macroeconomic policy fundamentals chapter 13. discussion topics characteristics of money federal...
Post on 21-Dec-2015
222 views
TRANSCRIPT

MacroeconomicPolicy
Fundamentals
Chapter 13

Discussion TopicsCharacteristics of moneyFederal Reserve SystemChanging the money supplyMoney market equilibriumEffects of monetary policy on economyThe federal budget deficitThe national debtFiscal policy options

Functions of Money
Medium of exchange – facilitates payment to others for goods and services
Unit of accounting – assessing profitability of businesses, household budgets and aggregate variables like GDP
Store of value – money is a liquid asset which has value in investment portfolios and cash flow decisions of businesses and households
Page 299

Functions of the Fed1. Supply the economy with paper currency2. Supervise member banks3. Provide check collection and clearing services4. Maintain the reserve balances of depository
institutions5. Lend to depository institutions6. Act at the federal government’s banker and
fiscal agent7. Regulate the money supply
Page 302-303

Page 301
Location of the 12 DistrictFederal Reserve Banks
Location of the 12 DistrictFederal Reserve Banks

Changing of the Guard
Alan Greenspan Ben Bernanke

The Fed’s Policy Tools
Reserve requirements – depository institutions are required to maintain a specific fraction of their customers’ deposits as reserves.
Discount rate – rate depository institutions pay when they borrow from the Fed
Open market operations – Fed can buy or sell government securities to alter the money supply
Page 304 – 305

Page 303
Role of the Board ofGovernors of theFederal Reserve System
Role of the Board ofGovernors of theFederal Reserve System

Page 303
Role of the Board ofGovernors of theFederal Reserve System
Role of the Board ofGovernors of theFederal Reserve System

Page 303
Role of the Board ofGovernors of theFederal Reserve System
Role of the Board ofGovernors of theFederal Reserve System

Page 303
Key role played by theFederal Open MarketCommittee or FOMC
Key role played by theFederal Open MarketCommittee or FOMC

Recent Fed Rate Actions
WOW

Page 303
Role of the 12 DistrictFederal Reserve Bankslocated throughoutthe country
Role of the 12 DistrictFederal Reserve Bankslocated throughoutthe country

Determinantsof the
Money Supply

Page 309
Existing money supplycurve. Note it isperpendicular to thequantity axis, implyingit is unaffected by theinterest rate.
Existing money supplycurve. Note it isperpendicular to thequantity axis, implyingit is unaffected by theinterest rate.

Page 309
Expansionary monetary policyactions will shift the MScurve to the right over a period of 12 months or so.
Expansionary monetary policyactions will shift the MScurve to the right over a period of 12 months or so.

Page 309
Contractionary monetary policy actions, on theother hand, will shift themoney supply curve to left over a similar timeperiod.
Contractionary monetary policy actions, on theother hand, will shift themoney supply curve to left over a similar timeperiod.

Page 307
Suppose a depositor in Bank Ag sells $1 million in government securitiesto the Fed. He then deposits the proceeds from the sale in his bank. Ifthe fractional reserve requirement ratio is 20 percent, Bank Ag canincrease the volume of its loans by $800,000. Suppose the proceeds of these loans are deposited in Bank B. Follow the trail to the Total line.
Suppose a depositor in Bank Ag sells $1 million in government securitiesto the Fed. He then deposits the proceeds from the sale in his bank. Ifthe fractional reserve requirement ratio is 20 percent, Bank Ag canincrease the volume of its loans by $800,000. Suppose the proceeds of these loans are deposited in Bank B. Follow the trail to the Total line.

Change in the Money SupplyWe can skip tracing deposits through the economy byusing the following money supply (MS) equation:
MS = (1.0 ÷ RR) × TR = MM × TR
where TR represents total reserves and RR is thereserve requirement ratio. The expression with thebrackets is known as the money multiplier.
We can restate this equation in terms of the change in the money supply as follows:
MS = (1.0 ÷ RR) × TR = MM × TRPage 307 – 308

Change in the Money SupplyUsing the example in Table 13.3 of the $1 million deposit on page 307 and 20% reserve requirements ratio, we see that the change in the money supply is:
MS = (1.0 ÷ .20) x TR = 5.0 x $1 million = $5 million
This results in a change in loans of
loans = MS - TR = $5 million - $1 million = $4 million
See bottom line in Table 13.3
See bottom line in Table 13.3
Page 307 – 308

Page 307
Change inmoney supply
Change inmoney supply
Change inloan volume
Change inloan volume
Initialinfusion
Initialinfusion+=

Impacts of Policy ToolsExpansionary actions: Effects of action:Fed buys securities Total reserves increaseFed lowers the discount rate Total reserves increaseFed lowers required reserve ratio Money multiplier increases
Page 308 - 309Greenspan

Impacts of Policy ToolsExpansionary actions: Effects of action:Fed buys securities Total reserves increaseFed lowers the discount rate Total reserves increaseFed lowers required reserve ratio Money multiplier increases
Contractionary actions: Effects of action:Fed sells securities Total reserves decreaseFed raises the discount rate Total reserves decreaseFed raises required reserve ratio Money multiplier decreases
Page 308 - 309Greenspan

Determinantsof the
Money Demand
Demand for Money
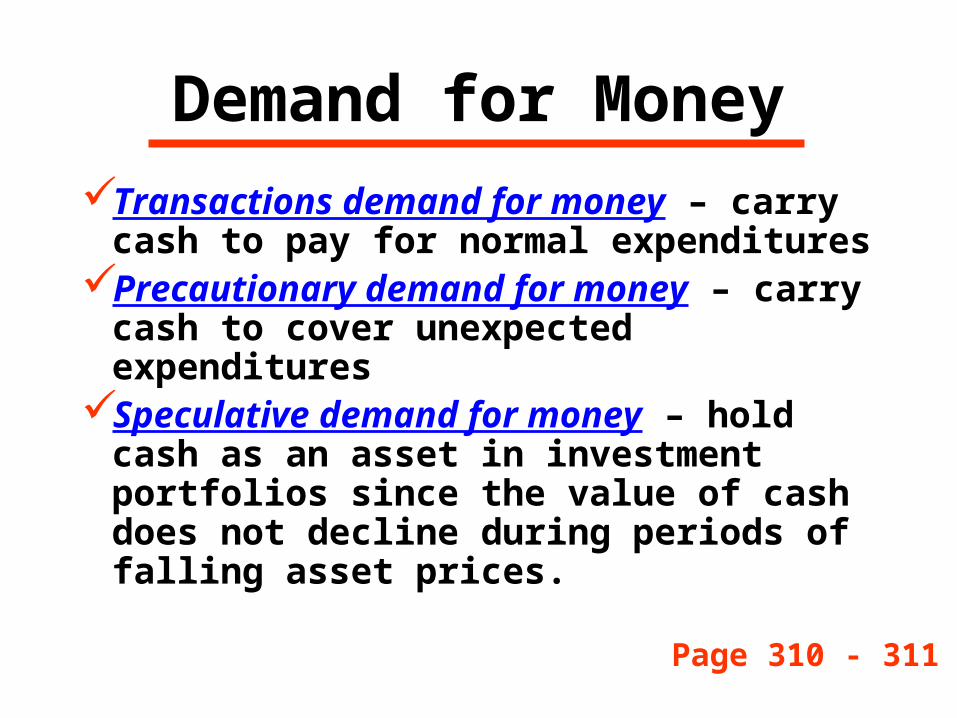
Transactions demand for money – carry cash to pay for normal expenditures
Precautionary demand for money – carry cash to cover unexpected expenditures
Speculative demand for money – hold cash as an asset in investment portfolios since the value of cash does not decline during periods of falling asset prices.
Page 310 - 311
Page 311
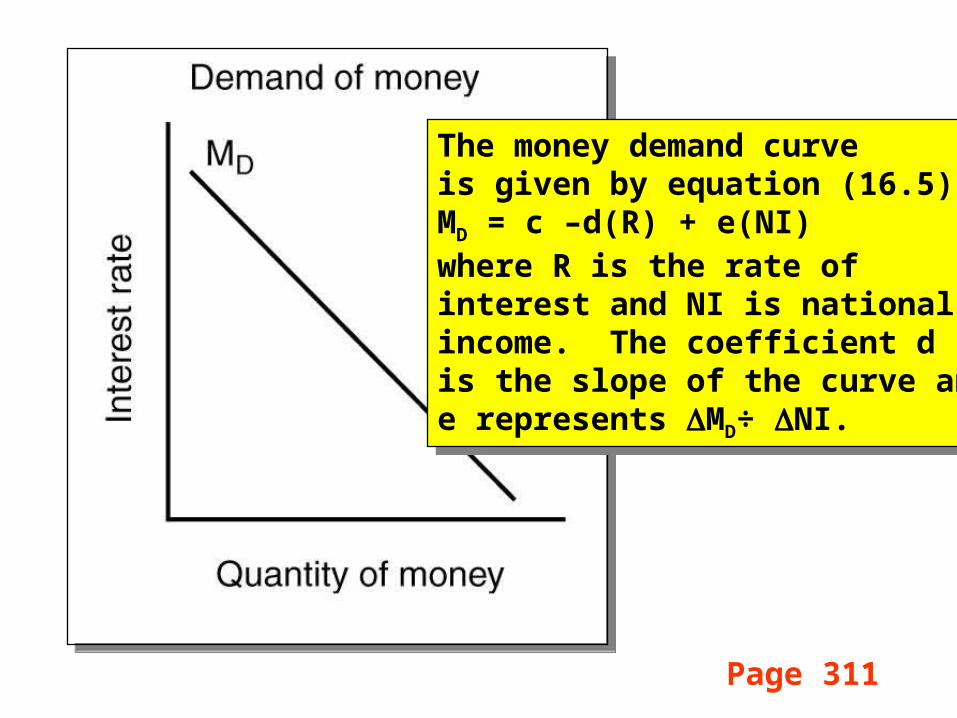
The money demand curve is given by equation (16.5):MD = c –d(R) + e(NI)where R is the rate of interest and NI is nationalincome. The coefficient d is the slope of the curve and e represents MD÷ NI.
The money demand curve is given by equation (16.5):MD = c –d(R) + e(NI)where R is the rate of interest and NI is nationalincome. The coefficient d is the slope of the curve and e represents MD÷ NI.

Page 311MD = c –d(R) + e(NI)MD = c –d(R) + e(NI)
Increase in incomeincreases demand
for money
Increase in incomeincreases demand
for money

Page 311
Money market interestrate given by intersectionof demand and supply
Money market interestrate given by intersectionof demand and supply

Page 311
MS*
0.06
Expansionarymonetary policylowers interestrates
Expansionarymonetary policylowers interestrates

Page 311
MS*
0.14 Contractionarymonetary policyraises interestrates
Contractionarymonetary policyraises interestrates

Page 312
The full effects of this changecould take 12 months or moreto register in bank deposits
The full effects of this changecould take 12 months or moreto register in bank deposits

Page 312
A change in the moneysupply will alter theequilibrium interest ratein the money market
A change in the moneysupply will alter theequilibrium interest ratein the money market

Page 312
We know from Chapter 12that a change in interest rates will lead to movementalong the planned investmentfunction….increasing ordecreasing new investment
We know from Chapter 12that a change in interest rates will lead to movementalong the planned investmentfunction….increasing ordecreasing new investment

Page 312
We also know from Chapter12 that increased investmentexpenditures, a componentof GDP, increases the demandfor labor, lowers unemploymentand thus fuels further growthin national income…
We also know from Chapter12 that increased investmentexpenditures, a componentof GDP, increases the demandfor labor, lowers unemploymentand thus fuels further growthin national income…

EliminatingRecessionary andInflationary Gaps

Page 313
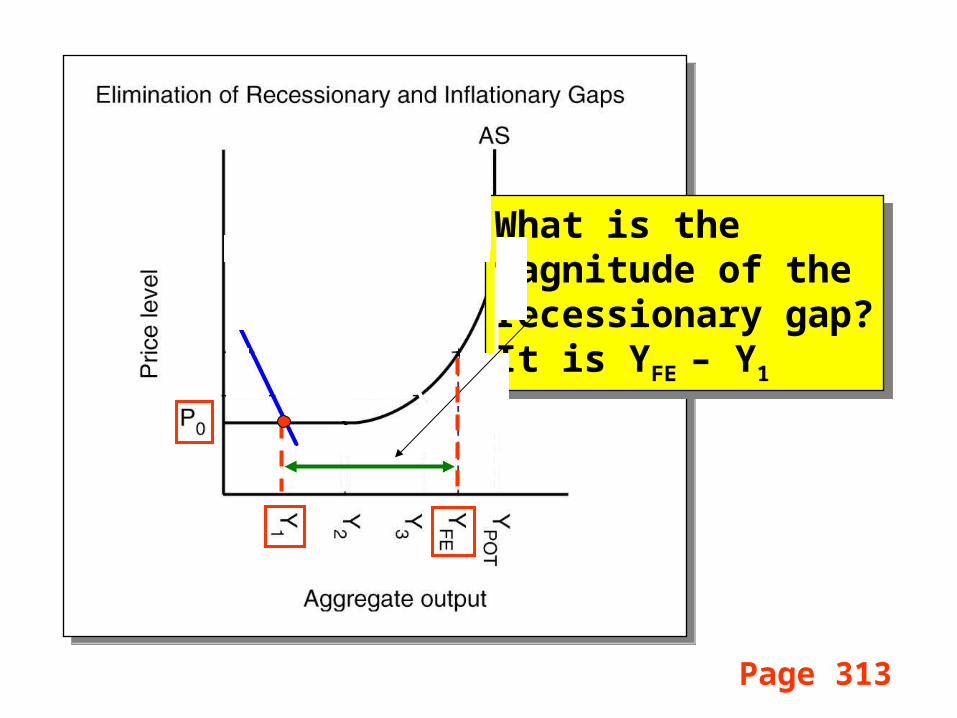
What is the magnitude of therecessionary gap?
What is the magnitude of therecessionary gap?
Page 313
What is the magnitude of therecessionary gap?It is YFE – Y1
What is the magnitude of therecessionary gap?It is YFE – Y1

Page 313
The use of expansionarymonetary policy actionsto push aggregate demandfrom AD1 to AD3 increasesreal GDP from Y1 to Y3
while only increasing thegeneral price level to P3.
The use of expansionarymonetary policy actionsto push aggregate demandfrom AD1 to AD3 increasesreal GDP from Y1 to Y3
while only increasing thegeneral price level to P3.

Page 313
Inflation rate(P3 – P0) ÷P0
Inflation rate(P3 – P0) ÷P0
Recessionary gapof YFE – Y1 ispartially closed toYFE – Y3
Recessionary gapof YFE – Y1 ispartially closed toYFE – Y3

Page 313
The further use of expansionary monetary policy to push aggregatedemand from AD3 to AD4 increases real GDP from Y3 to YFE (full employmentGDP), but increases the general price level to P4.
The further use of expansionary monetary policy to push aggregatedemand from AD3 to AD4 increases real GDP from Y3 to YFE (full employmentGDP), but increases the general price level to P4.

Page 313
Inflation rate(P4 – P3) ÷P3
Inflation rate(P4 – P3) ÷P3 Recessionary gap
fully closed
Recessionary gapfully closed
Page 313
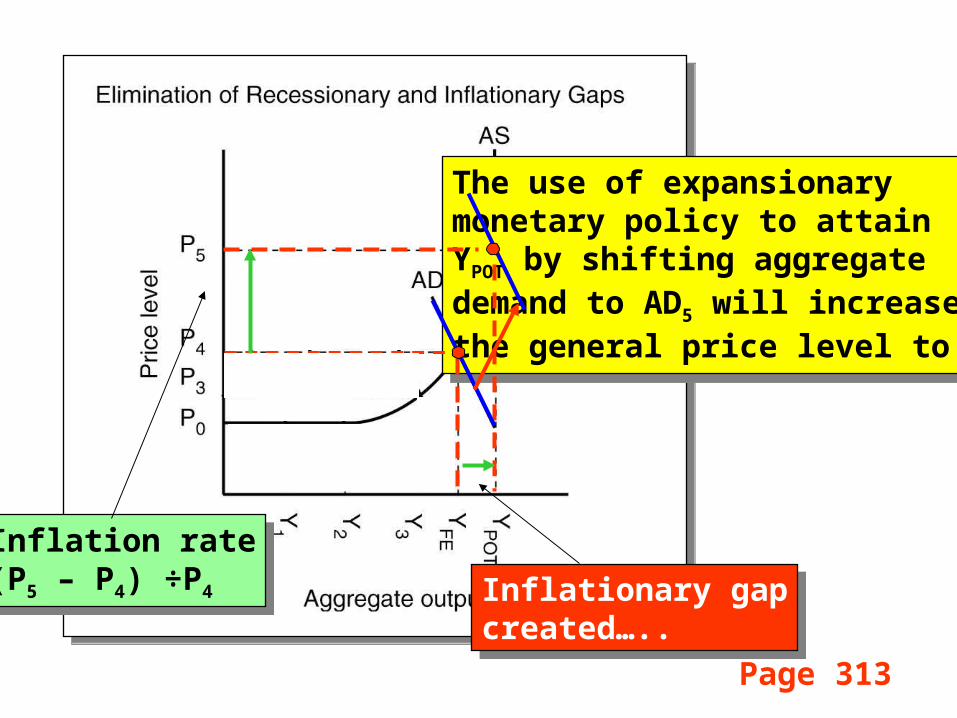
The use of expansionarymonetary policy to attainYPOT by shifting aggregatedemand to AD5 will increasethe general price level to P5.
The use of expansionarymonetary policy to attainYPOT by shifting aggregatedemand to AD5 will increasethe general price level to P5.
Inflation rate(P5 – P4) ÷P4
Inflation rate(P5 – P4) ÷P4 Inflationary gap
created…..
Inflationary gapcreated…..

MicroeconomicInterest RateImplications

Interest Rate Impacts on a 10-Year $150K Business Loan
Interest
rate
Annual
total PI payment
Annual interest
payment
Total interest
payment
8 percent $22,354.69 $7,354.69 $73,546.90
14 percent 28,757.67 13,757.67 137,576.88
20 percent 35,782.44 20,782.44 207,824.40
Page 315

Interest Rate Impacts on a 20- Year $100K Home Mortgage
Interest
rate
Monthly
total PI
payment
Monthly
interest
payment
Total
interest
payment8 percent $848.78 $432.08 $103,707.46
12 percent 1,115.73 699.06 167,773.46
Page 315

What is Fiscal Policy?
Taxation by federal, state and local governments
Government spending by federal state and local governments
Budget deficit and the national debt
Page 316

States Without Income Tax
Eight states do not have a state income tax
Eight states do not have a state income tax

State and Local Taxes
Alaska, thanks to oil reserves, has the lowest tax burden
Maine registering the highest has the highest tax burden
Major sources are sales taxes and property taxes

Our focus is on fiscal policy at the federal level….

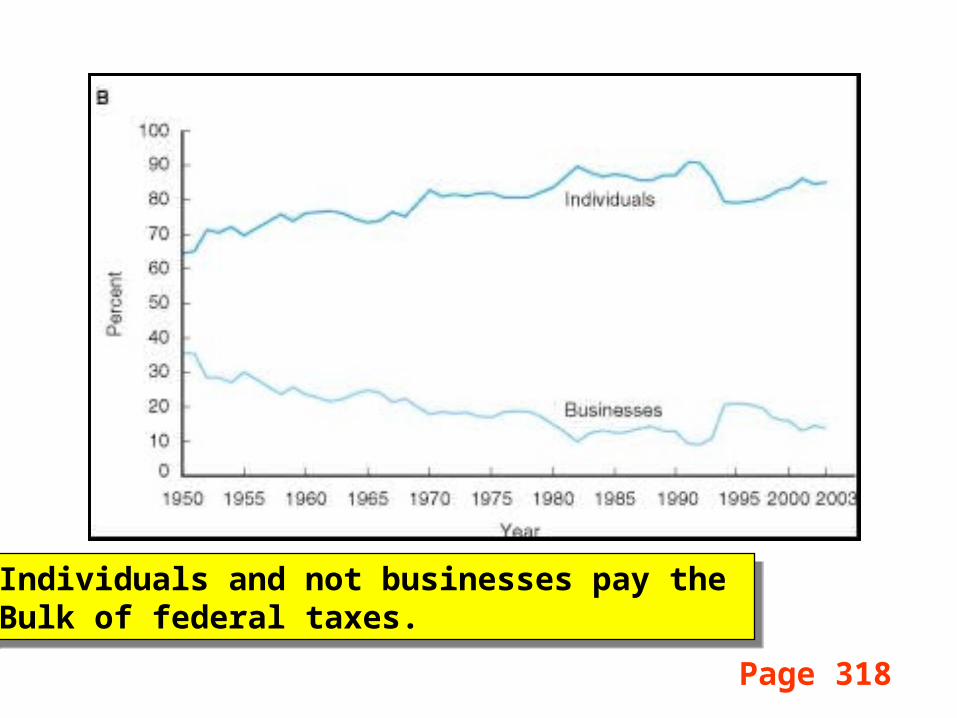
Page 318
Rising spending andtax cuts to spur theeconomy brought backbudget deficits
Rising spending andtax cuts to spur theeconomy brought backbudget deficits
Page 318
Individuals and not businesses pay the Bulk of federal taxes.
Individuals and not businesses pay the Bulk of federal taxes.

Page 320
A strong economy andcontrolled spending ledto the first budget surplusin more than 20 years…
A strong economy andcontrolled spending ledto the first budget surplusin more than 20 years…
The effects of 9/11 and increased spending plus tax cuts to stimulate the economy led to record high deficits…
The effects of 9/11 and increased spending plus tax cuts to stimulate the economy led to record high deficits…

Recent Trends in Deficit
• Typically the economy runs a budget deficit at the federal level
• 1998-2001 were the exceptions in recent years
• Fueled by growing economy and falling interest rates

Debt and the Deficit
National debtT = National debtT-1 + DeficitT

Page 321
The growth in federal spending has grown rapidly over the last 20 years…
The growth in federal spending has grown rapidly over the last 20 years…


Page 322
While the national debt grew as deficit spending dominated the1980s and 1990s, debt as a percentof GDP stayed within post-WW IIexperience…
While the national debt grew as deficit spending dominated the1980s and 1990s, debt as a percentof GDP stayed within post-WW IIexperience…

Federal government spending on Agriculture programs is the fourth highest on this list of total federal spending.
Federal government spending on Agriculture programs is the fourth highest on this list of total federal spending.

Fiscal Policy Options
Automatic fiscal policy instruments: take effect without explicit action by policymakers (e.g., progressive tax rates)
Discretionary fiscal policy instruments: require explicit actions by the president or Congress (e.g., passing a law)
Page 324

Impacts of Policy ToolsExpansionary actions: Effects of action:Cut taxes Increase disposable incomeIncrease government spending Increase aggregate demand
Congress & BushPage 327

Impacts of Policy ToolsExpansionary actions: Effects of action:Cut taxes Increase disposable incomeIncrease government spending Increase aggregate demand
Contractionary actions: Effects of action:Increase taxes Decrease disposable incomeCut government spending Decrease aggregate demand
Congress & BushPage 327
Page 324
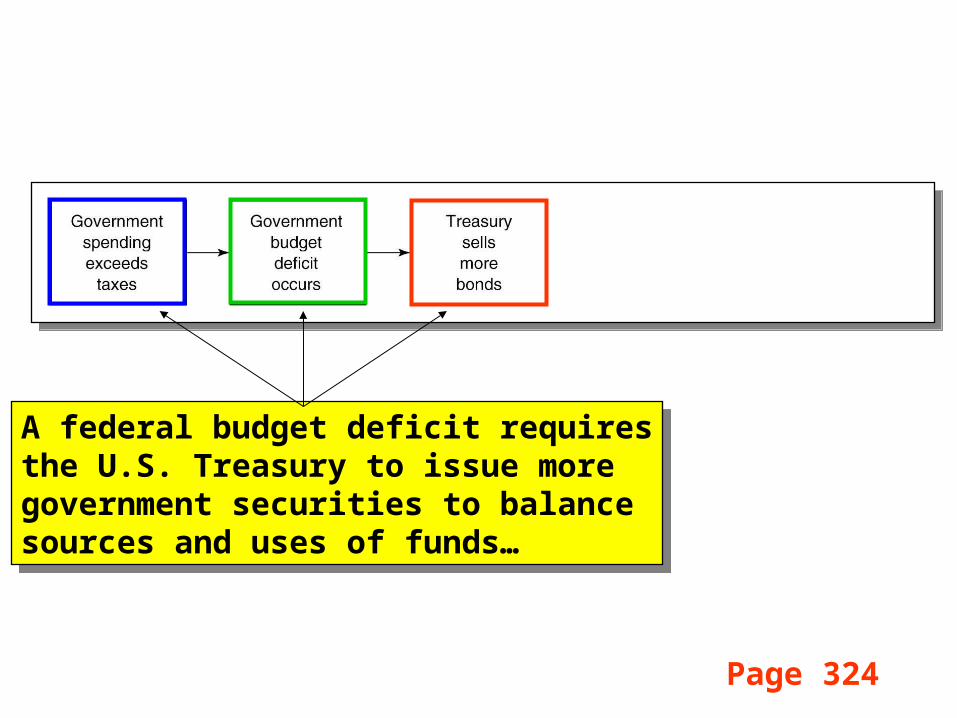
A federal budget deficit requiresthe U.S. Treasury to issue moregovernment securities to balancesources and uses of funds…
A federal budget deficit requiresthe U.S. Treasury to issue moregovernment securities to balancesources and uses of funds…

Page 324
An increase in the sale ofgovernment securitiesreduces the pool of privatecapital available to financeinvestment expenditures,raising interest rates…
An increase in the sale ofgovernment securitiesreduces the pool of privatecapital available to financeinvestment expenditures,raising interest rates…

Page 324
We know from Chapter 12 that higher interest rates depresses investmentexpenditures…
We know from Chapter 12 that higher interest rates depresses investmentexpenditures…

Page 328
The use of expansionaryfiscal policy actionsto push aggregate demandfrom AD1 to AD3 increasesreal GDP from Y1 to Y3
while only increasing thegeneral price level to P3.
The use of expansionaryfiscal policy actionsto push aggregate demandfrom AD1 to AD3 increasesreal GDP from Y1 to Y3
while only increasing thegeneral price level to P3.
Inflation rate(P3 – P0) ÷P0
Inflation rate(P3 – P0) ÷P0 Recessionary gap
partially closed
Recessionary gappartially closed

Page 328
The use of expansionaryfiscal policy to push demandfrom AD3 to AD4 increasesreal GDP from Y3 to YFE
(full employment GDP), But increases the general price level to P4.
The use of expansionaryfiscal policy to push demandfrom AD3 to AD4 increasesreal GDP from Y3 to YFE
(full employment GDP), But increases the general price level to P4.
Inflation rate(P4 – P3) ÷P3
Inflation rate(P4 – P3) ÷P3 Recessionary gap
closed….
Recessionary gapclosed….

Page 328
The use of expansionaryfiscal policy to attainYPOT by shifting aggregatedemand to AD5 will Increase the general price level to P5.
The use of expansionaryfiscal policy to attainYPOT by shifting aggregatedemand to AD5 will Increase the general price level to P5.
Inflation rate(P5 – P4) ÷P4
Inflation rate(P5 – P4) ÷P4 Inflationary gap
created….
Inflationary gapcreated….

Monetary Policy SummaryFunctions of money and the
role of the Federal Reserve System in the economy
The money multiplier and the growth of the money supply
Tools of monetary policyDemand for money and money
market equilibriumPolicy linkages and timing of
full effectsElimination of recessionary
and inflationary gaps.

Fiscal Policy SummaryDifference between
discretionary and automatic fiscal policy tools
Expansionary and contractionary fiscal policy actions
Application to eliminating recessionary and inflationary gaps
Budget deficits, national debt and concept of “crowding out”

Chapter 14 focuses on the key consequences of business fluctuations….