macroeconomics - 2014
DESCRIPTION
macroecoTRANSCRIPT


www.time4education.com
MACROECONOMICS
Ankur Jain
Chief Knowledge Expert, T.I.M.E.

THE 3 SECTORS OF THE ECONOMY
• Primary – agriculture, forestry, fishery, animal
husbandry
• Secondary—
mineral, power, mining, manufacturing
industries.
• Services–
Education, transport, trade, communication, ba
nking, other services
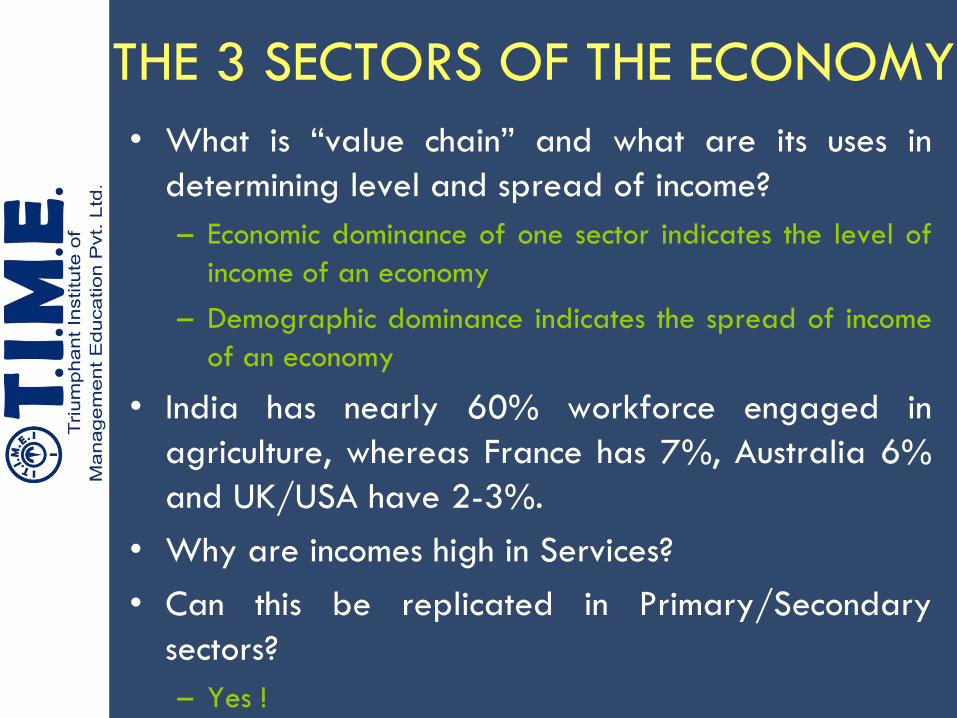
• What is ―value chain‖ and what are its uses in
determining level and spread of income?
– Economic dominance of one sector indicates the level of
income of an economy
– Demographic dominance indicates the spread of income
of an economy
• India has nearly 60% workforce engaged in
agriculture, whereas France has 7%, Australia 6%
and UK/USA have 2-3%.
• Why are incomes high in Services?
• Can this be replicated in Primary/Secondary
sectors?
– Yes !
THE 3 SECTORS OF THE ECONOMY

Changing Economic and
Demographic Profile of India
0
10
20
30
40
50
60
70
80
1950-51 1961 1981 1990-91 1993 1999-2000 2000-01 2008-09
Share of Agriculture in National Income
Workforce Engaged in Agriculture
TYPES OF ECONOMY
• Market Economy
• Socialist Economy
• Mixed Economy
What is Communism?
Indicators of Economic Health
• GDP
• Per Capita Income
• Inflation
• Human Development Index
• Level of Employment
• B.P.L. Population
• GDP – total flow of goods and services
produced in a country in one year.
• GNP = GDP + income from abroad
• NDP / NNP = GDP / GNP - depreciation
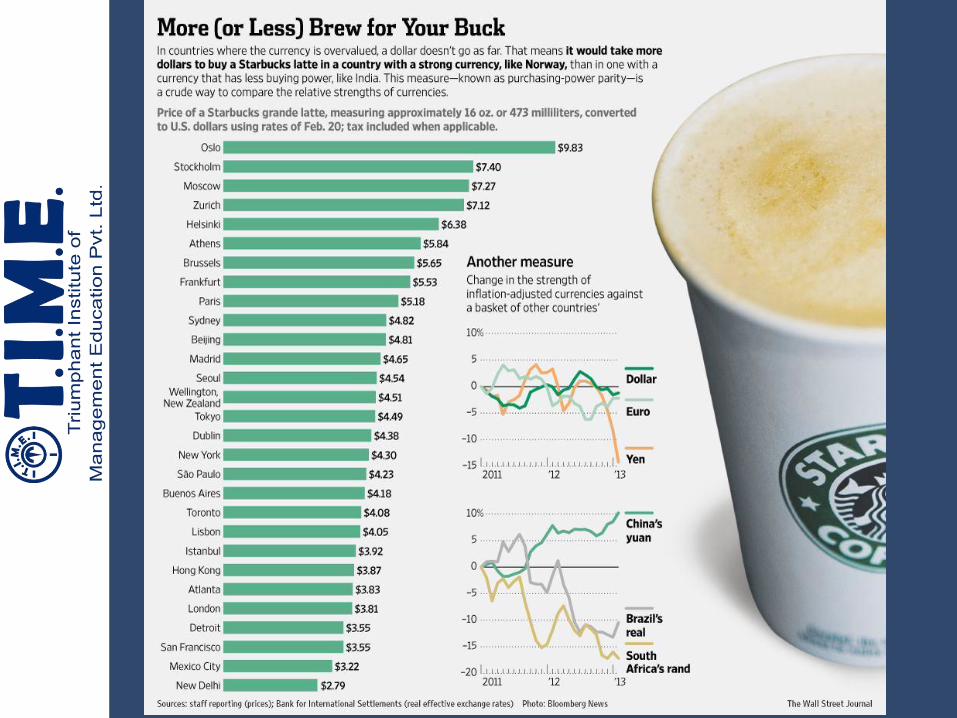
• GDP-PPP = GDP based on Purchasing Power
Parity
• PCI = Per capita GDP
GDP
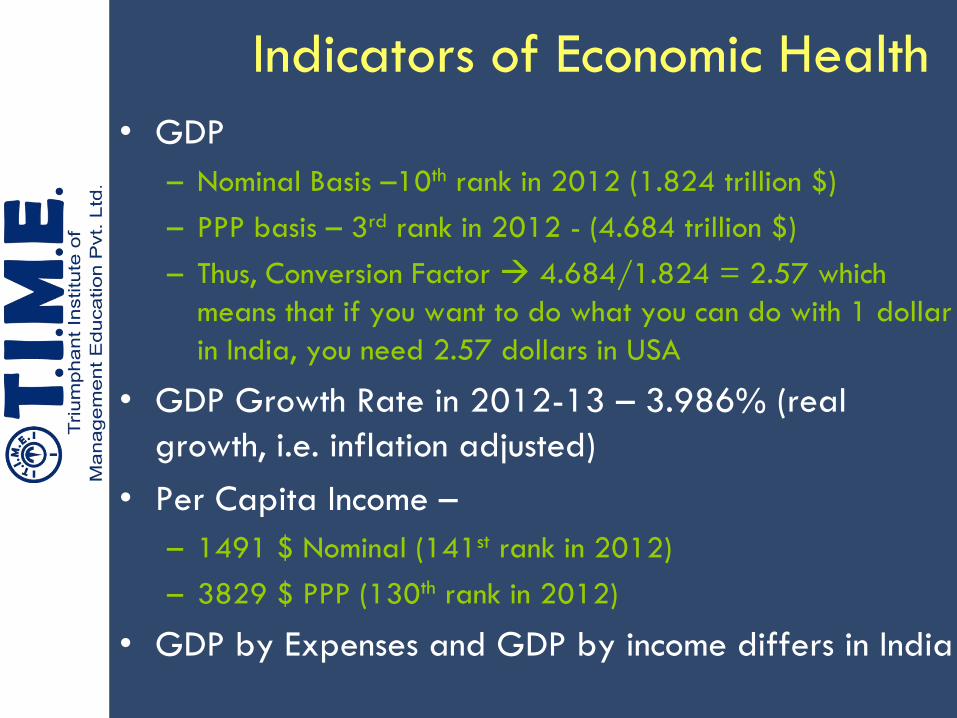
• GDP
– Nominal Basis –10th rank in 2012 (1.824 trillion $)
– PPP basis – 3rd rank in 2012 - (4.684 trillion $)
– Thus, Conversion Factor 4.684/1.824 = 2.57 which
means that if you want to do what you can do with 1 dollar
in India, you need 2.57 dollars in USA
• GDP Growth Rate in 2012-13 – 3.986% (real
growth, i.e. inflation adjusted)
• Per Capita Income –
– 1491 $ Nominal (141st rank in 2012)
– 3829 $ PPP (130th rank in 2012)
• GDP by Expenses and GDP by income differs in India
Indicators of Economic Health
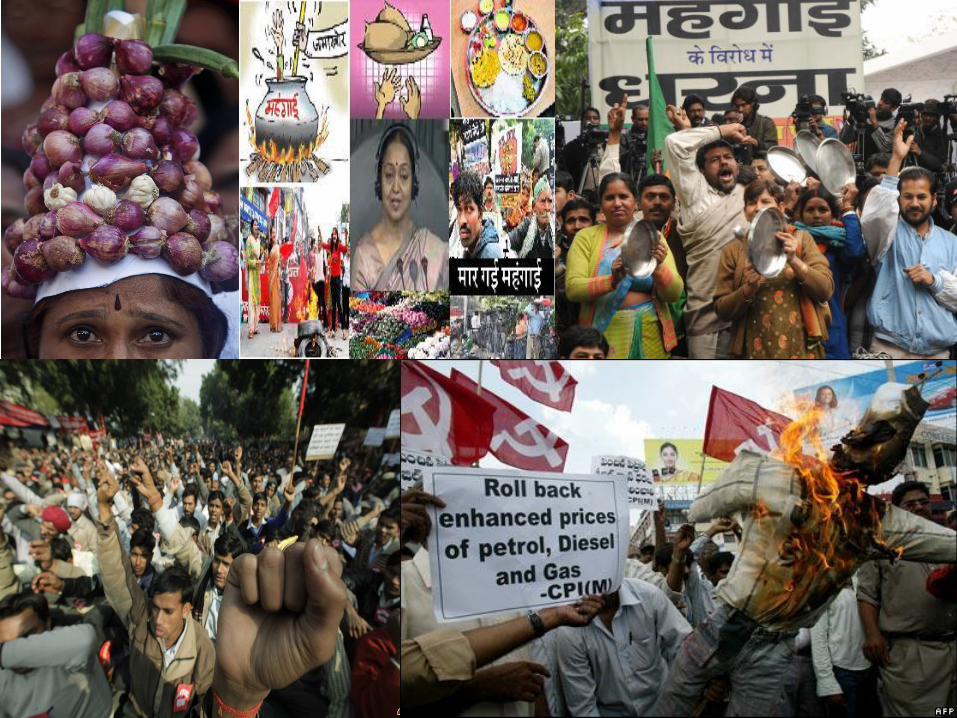

INFLATION
• Steady rise in prices, resulting in decline in
purchasing power of the money.
• 2 types - cost push & demand pull.
• Normally measured in terms of WPI, on YoY
basis.
• Moderate inflation is good for economy.
– WHY?
Indicators of Economic Health
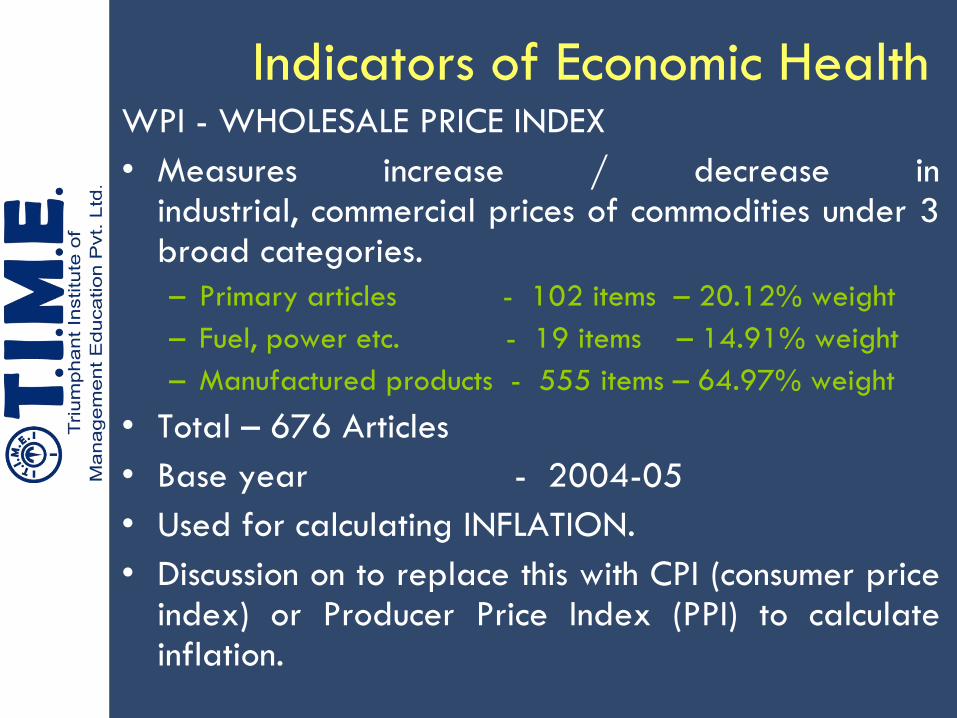
WPI - WHOLESALE PRICE INDEX
• Measures increase / decrease inindustrial, commercial prices of commodities under 3broad categories.
– Primary articles - 102 items – 20.12% weight
– Fuel, power etc. - 19 items – 14.91% weight
– Manufactured products - 555 items – 64.97% weight
• Total – 676 Articles
• Base year - 2004-05
• Used for calculating INFLATION.
• Discussion on to replace this with CPI (consumer priceindex) or Producer Price Index (PPI) to calculateinflation.
Indicators of Economic Health

CPI—CONSUMER PRICE INDEX
• Calculates increase / decrease in retail price.
• Direct bearing on consumers.
• Latest indices to have Services Component also.
• Different types of CPIs for various consumers.
►for agricultural laborers.
►for rural laborers.
►for industrial workers.
►for urban non-manual employee.
Indicators of Economic Health

Producer Price Index
• Tracks the price of goods recorded at the first
transaction.
• Measures changes in prices received by domestic
producers of goods and services over time.
• Different from the retail prices, which include
shipping costs, taxes and other levies.
• Gives an account of the economy's efficiency in
transferring goods and services from the producer
to the consumer, who could be the final consumer
or another producer using it as an input.
Indicators of Economic Health
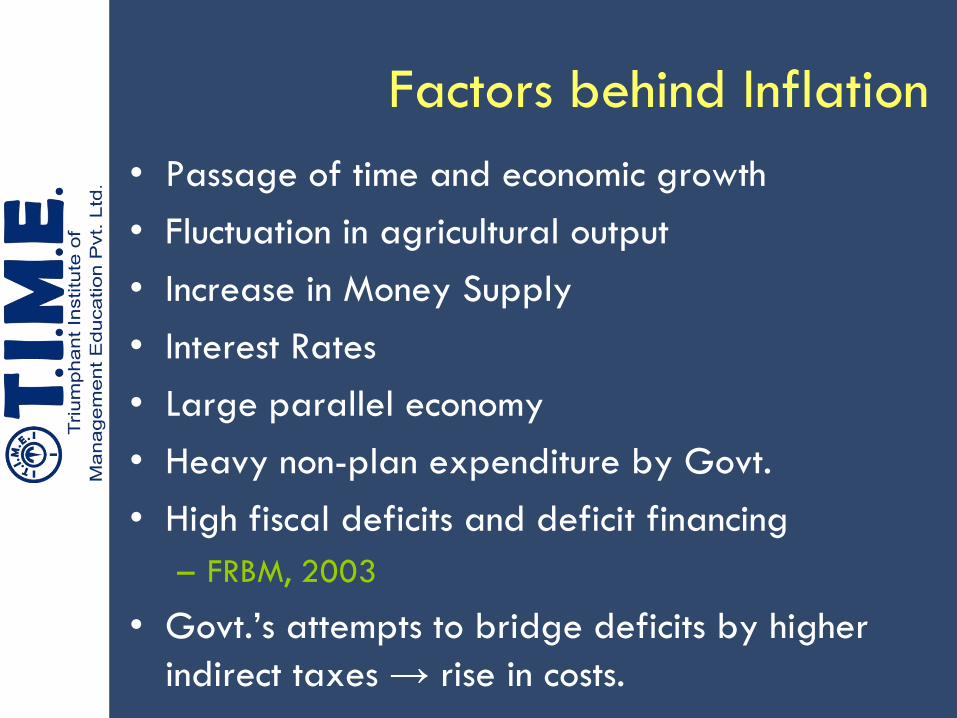
Factors behind Inflation
• Passage of time and economic growth
• Fluctuation in agricultural output
• Increase in Money Supply
• Interest Rates
• Large parallel economy
• Heavy non-plan expenditure by Govt.
• High fiscal deficits and deficit financing
– FRBM, 2003
• Govt.‘s attempts to bridge deficits by higher
indirect taxes → rise in costs.

Interest Rates ↓
Savings↓
Money Supply ↑
Consumer Expenditure ↑
Business Expansion ↑
Growth ↑
Business Confidence
(Stock Market) ↑
Interest Rates ↓
Loans ↑
Money Supply ↑
Inflation↑
The Interest in Interest Rates!
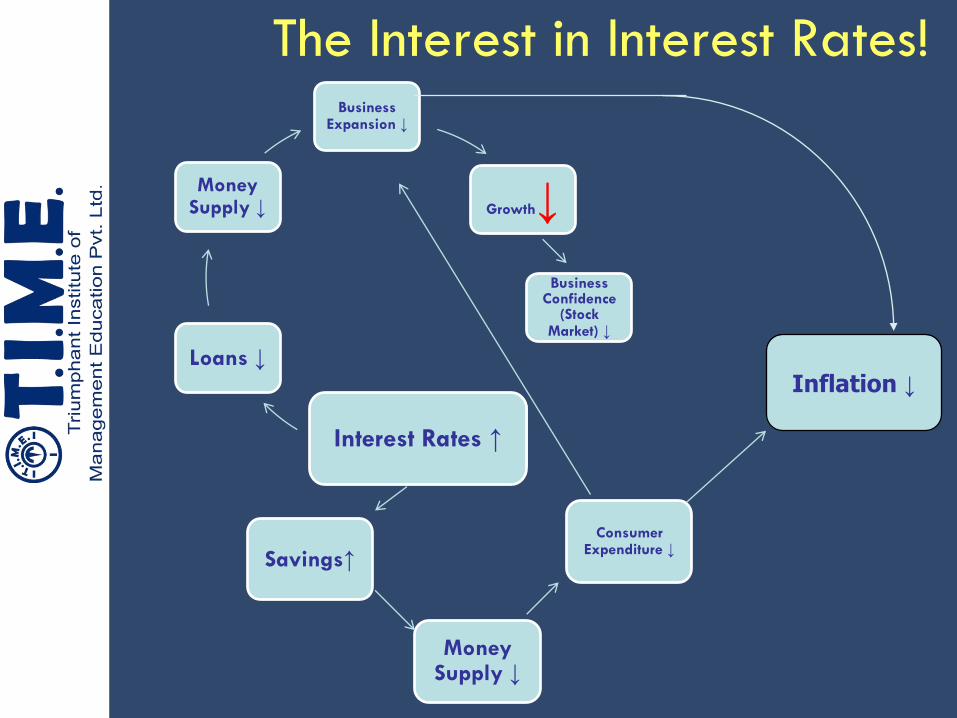
Interest Rates ↓
Savings↑
Money Supply ↓
Consumer Expenditure ↓
Business Expansion ↓
Growth↓
Business Confidence
(Stock Market) ↓
Interest Rates ↑
Loans ↓
Money Supply ↓
Inflation ↓
The Interest in Interest Rates!

Hyperinflation !!!

What is
Deficit
Financing?
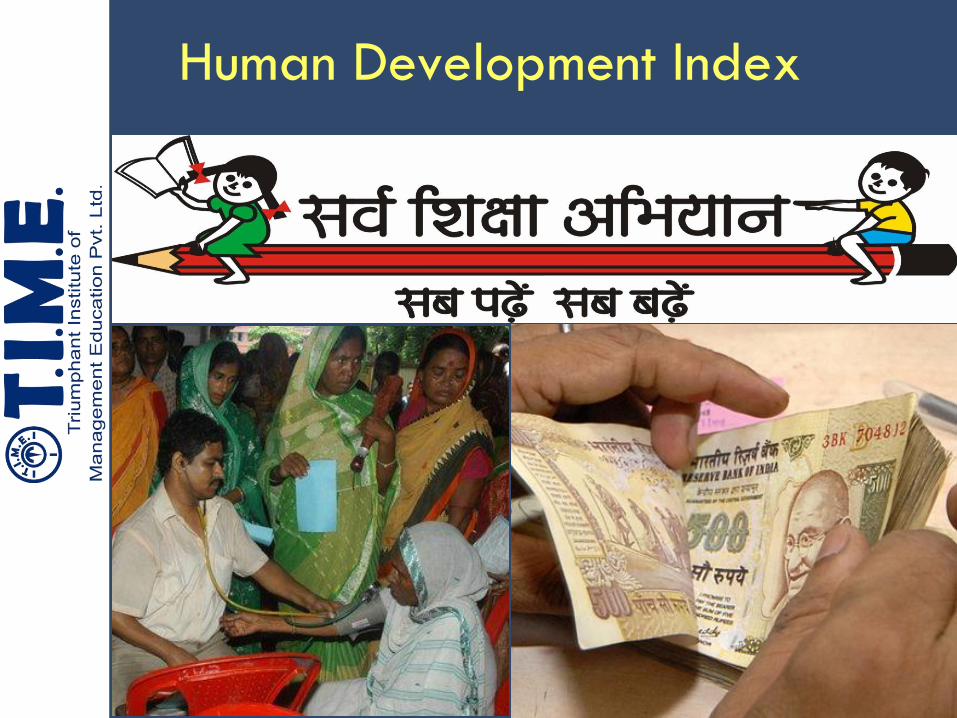
Human Development Index

HDI - HUMAN DEVELOPMENT INDEX
• Developed by UNDP in 1996
• Measures physical quality of life in a country
along 3 key parameters
► Life expectancy at birth
► No. of years in school
► Per capita income
• India‘s Rank – 136, down 2 ranks from last
year
Indicators of Economic Health
What about Gross National Happiness ?

Poverty Line

POVERTY LINE
• Consumption expenditure required for getting 2100
calories per person in urban area and 2400 calories
in rural areas.
• Why has the line been pegged to Rs. 28 or 32/day?
• Key parameters
– No. of people BPL – appx. 37 crores (1/3 of the world‘s
poor)
– % of population BPL as per GOI estimates – Range from
25-37%
– % of population living under $1 / day – 32%
– % of population living under $2 / day – 68.7%
Indicators of Economic Health

Unemployment
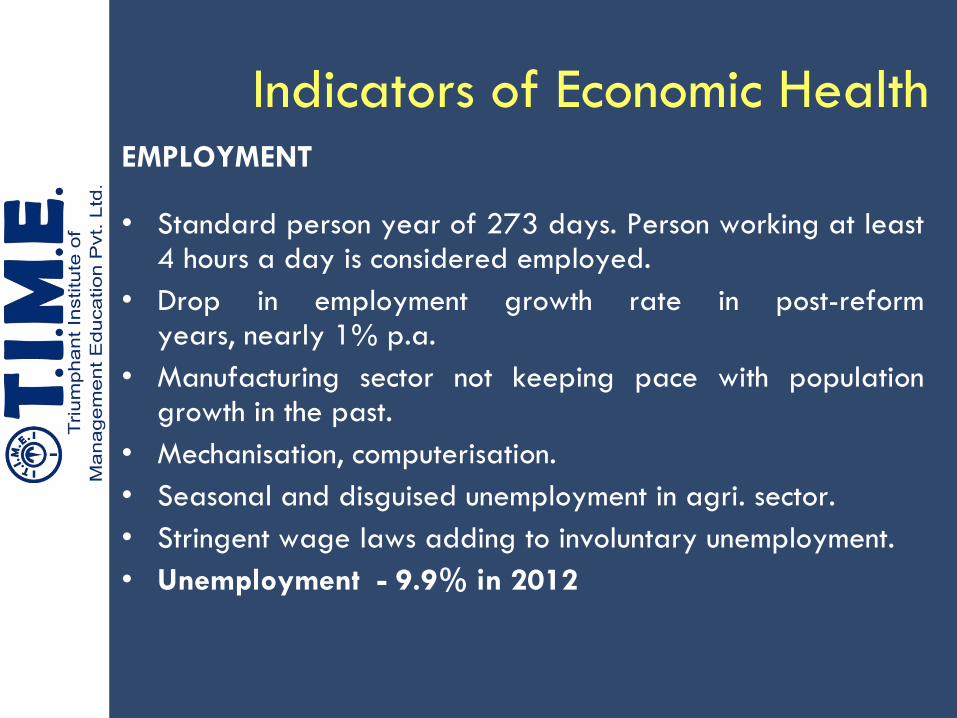
EMPLOYMENT
• Standard person year of 273 days. Person working at least4 hours a day is considered employed.
• Drop in employment growth rate in post-reformyears, nearly 1% p.a.
• Manufacturing sector not keeping pace with populationgrowth in the past.
• Mechanisation, computerisation.
• Seasonal and disguised unemployment in agri. sector.
• Stringent wage laws adding to involuntary unemployment.
• Unemployment - 9.9% in 2012
Indicators of Economic Health
Monetary Policy

Monetary Policy
• Who decides this ?
– Central Bank Of a Country
• What it aims to achieve?
– Monetary policy regulates the
money supply in an economy.
Tools of Monetary Policy
1.Bank Rate
2.Open market operations
3.CRR and SLR
4.Credit ceiling
5.Differential Interest Rates

Tools continued• Bank Rate - official rate of interest
charged by RBI. Current rate – 8.75%
• Open market operations - RBI buying andselling securities to regulate money supply.
– Repo rate – Rate at which RBI lends, in theshort run, to banks, currently at 7.75. Indicatesrate at which liquidity in injected into thesystem. Decrease in Repo rate can lead totemporary expansion of money supply.
– Reverse Repo – Rate at which RBI acceptsdeposits from banks, currently at 6.75%.Indicates rate at which liquidity in absorbedfrom the system. Decrease in Repo rate canalso lead to temporary expansion of moneysupply.
MONETARY POLICY
3. A) CRR - every commercial bank to keep a certain
percent of its demand and time deposits with the
RBI. Currently at 4.00%.
B) SLR - commercial banks keep a fixed percentage
of their demand and time deposits in liquid
assets, viz. cash, securities, gold. Currently at 23%.
4. C) Differential Interest Rates
– Base Rate – 9.80 % – 10.25%
5. D) Priority sector lending

ROLE OF
THE RBI
ROLE OF THE RBI
• Issue of bank notes of all denominations
– All ?
• Regulates money supply
• Lender of last resort to banks
• Controls FOREX operations.

TRADE CYCLES
TRADE CYCLES
Refers to fluctuation in economic activity
which forms a regular pattern.
• Expansionary phase characterized by
increase in income, output, employment and
inflation.
• Contraction phase is characterized by drop
in income, output , employment and deflation
( sustained fall in prices).
TRADE CYCLES• BOOM - A particularly sharp upwards
turn in demand and output. ITBoom, Realty Boom.
• RECESSION -Two consecutive quartersof falling GDP in an economy.Beginning of slump or depression.Occurs due to over production duringearlier phase, rise in fuel and rawmaterial prices etc.
• SLUMP/CRASH/BUST - Severe down-turn phase. Opposite of boom, e.g., thegreat US slump

TRADE CYCLES
• DIS-INFLATIONARY MEASURES
Steps taken by govt. to bring down
prices in face of chronic inflation.
• STAGFLATION
Decline in economic activity even in face
of inflation. Production doesn‘t rise even
with price rise, due to poor infrastructure
or high raw material cost. Mostly seen in
LDCs.

MONEY MARKETS
MONEY MARKETS
• Market in short term securities, loans, goldand FOREX. Mainly commercial banks areinvolved.
• Inter-bank call money market, the mostsignificant part. An over-the-phone market.
• Basic objectives
● To even out short term surpluses and deficits
● To provide easy access to short term moneyto meet commercial requirements at a realisticprice.

Capital Markets
CAPITAL MARKET
• Market for long term loans.
• Consists of – a) Govt. securities
b) Industrial securities
• Govt. securities aimed at bridging fiscal
deficit and financing public sector projects.
Major holders are RBI, commercial
banks, insurance cos. etc.; captive market for
govt. securities.

CAPITAL MARKETIndustrial securities
• Aimed at mobilizing long term funds forcorporate to finance capitalexpenditures,
e.g. new projects, acquisitions etc.
• Equities market consists of primary andsecondary markets.
• Equity shares traded through stockexchanges by brokers in an onlineenvironment. BSE and NSE the twolargest stock exchanges.

• STOCK EXCHANGE - an organized market for trading ofstocks and bonds. 22 in India. Facilitate financing forcorporates.
• BSE- estd. 1875, it is the oldest in Asia. Gettingovershadowed by newer NSE. 5085 listed companies. Sensexrepresents top 30 companies. 10th largest marketcapitalisation.
• NSE - Also located in Mumbai. Nifty – top 50 companies ontotal market cap basis. 1552 companies. 11th largest marketcapitalisation. 2nd largest trade in equities.
• SEBI- estd. 1992. Regulates working of stockexchanges, brokers and mutual funds. Registers FPI (foreignportfolio investment).
CAPITAL MARKET

BANKING SECTOR IN INDIA

BANKING SECTOR IN INDIA
• RBI- guides, controls and regulates other commercialbanks. Formulates monetary and credit policies.
• COMMERCIAL BANKS- mobilize savings and lend toborrowers ensuring maximum possible ‗spread rate‘.They keep demand deposits (current A/C), savingsdeposits and time deposits (FDs). Nationalised in1969 & in 1980. These include
A) PSU banks ( 7 SBI group + 19 nationalized )
B) Pvt. Sector banks ( Indian and foreign )

Current Account
1-(Import + Export) of goods and
services and unilateral transfers.
2-Trade in goods.
3-Trade in Services.
Capital Account
• Private transactions
• Official transactions
• Direct investments
• Portfolio investments
Fiscal Policy
• Who determines this?
– Finance Ministry/ Budget office
• What exactly is this?
– The part of govt. policy which is
concerned with raising revenues
through taxation and deciding on the
level and patterns of expenditure
(union budget).

Tools of Fiscal Policy
1.Level of taxation
2.Structure of taxation
3.Control of govt. expenditure
4.Subsidies and price controls
5.Export/ Import Restrictions
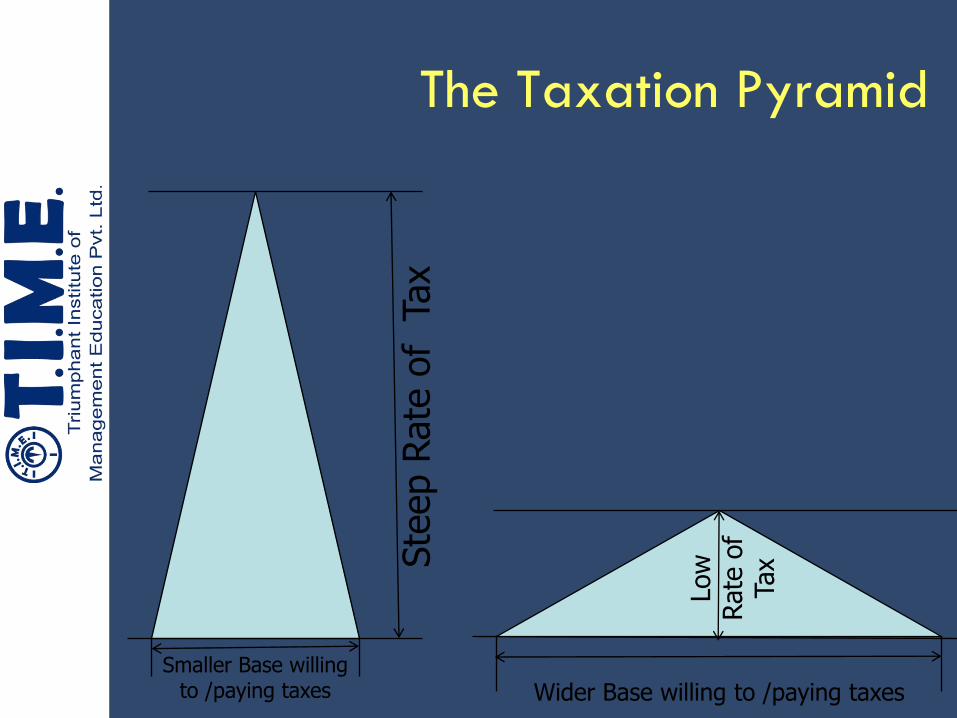
The Taxation Pyramid
Ste
ep R
ate
of
Tax
Smaller Base willing to /paying taxes
Low
Rate
of
Tax
Wider Base willing to /paying taxes

WE HAD HIGH TAXES – HOW
MUCH HIGH WERE THEY…WHAT
WAS THE HIGHEST RATE OF
INCOME TAX IN POST-
INDEPENDENCE INDIA?
Quiz TIME
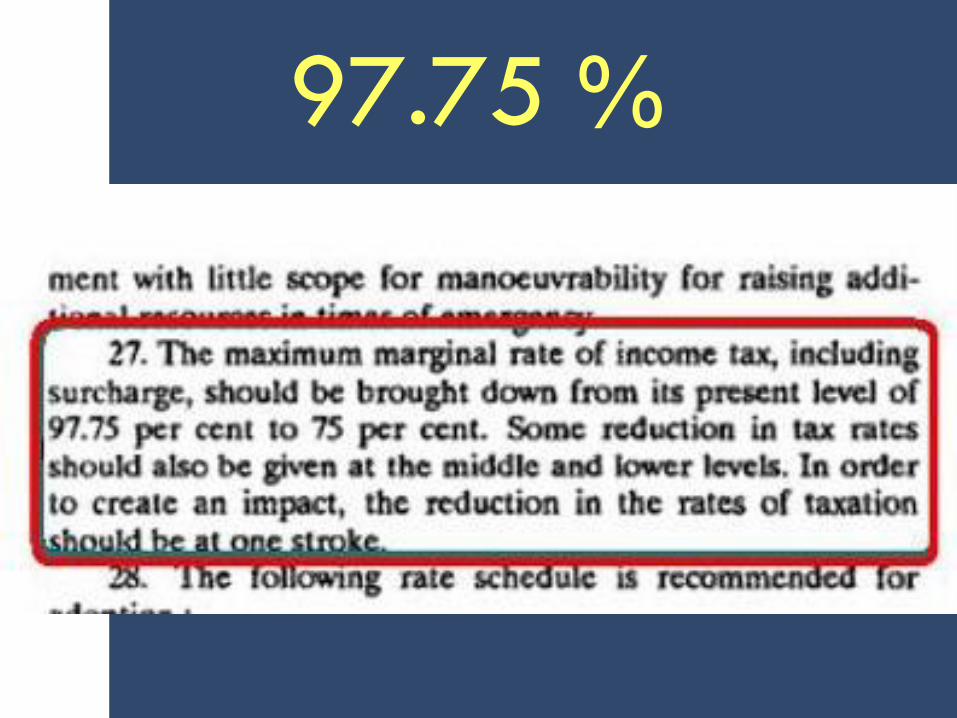
97.75 %
Union Budget

STRUCTURE OF UNION BUDGET
REVENUE SIDE
1. Revenue receipts
A) 70% - tax revenue — centralexcise, customs duty, corporation tax, incometax, service tax, FBT, STT etc.
B) 20% - non-tax revenue —interest receiptson loans , profits from PSUs.
2. Capital receipts
10% - Principal repayment fromdebtors, disinvestment proceeds, marketborrowings.
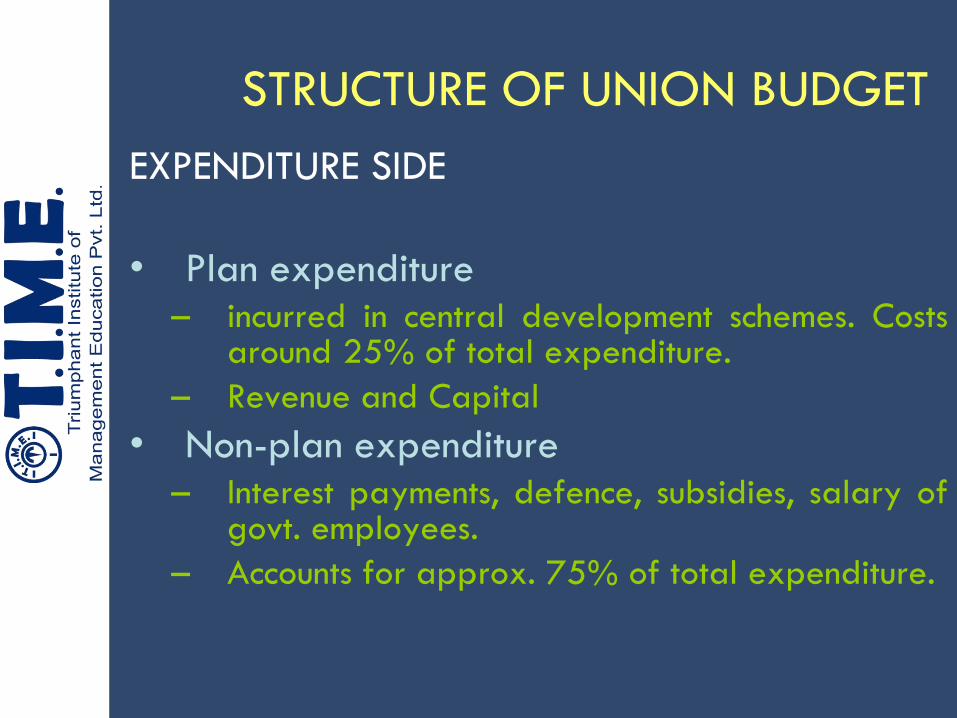
STRUCTURE OF UNION BUDGET
EXPENDITURE SIDE
• Plan expenditure– incurred in central development schemes. Costs
around 25% of total expenditure.
– Revenue and Capital
• Non-plan expenditure– Interest payments, defence, subsidies, salary of
govt. employees.
– Accounts for approx. 75% of total expenditure.
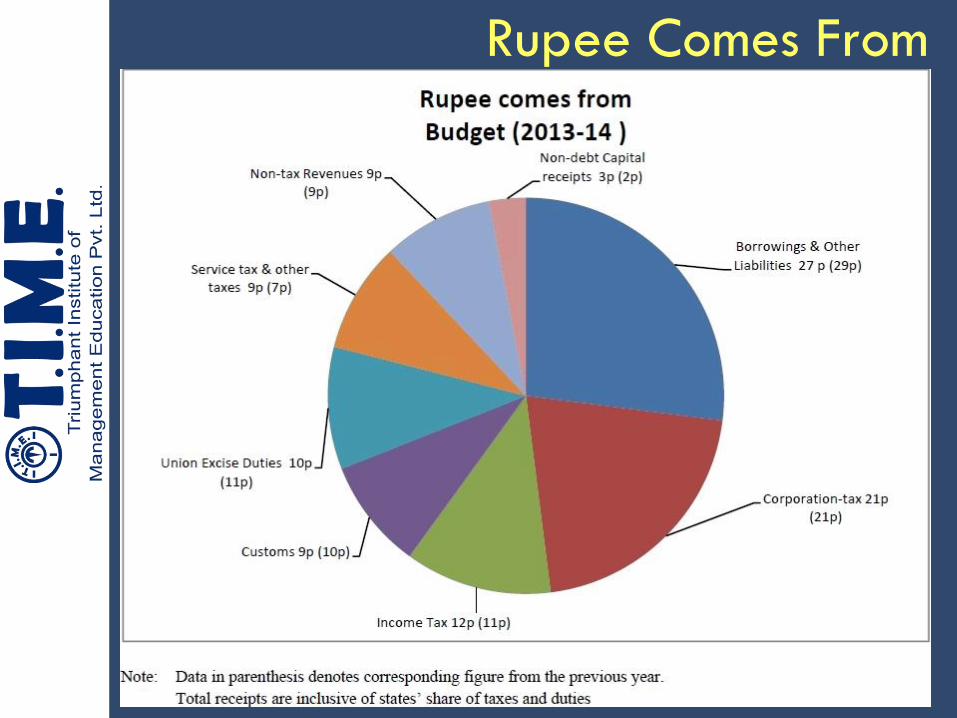
Rupee Comes From
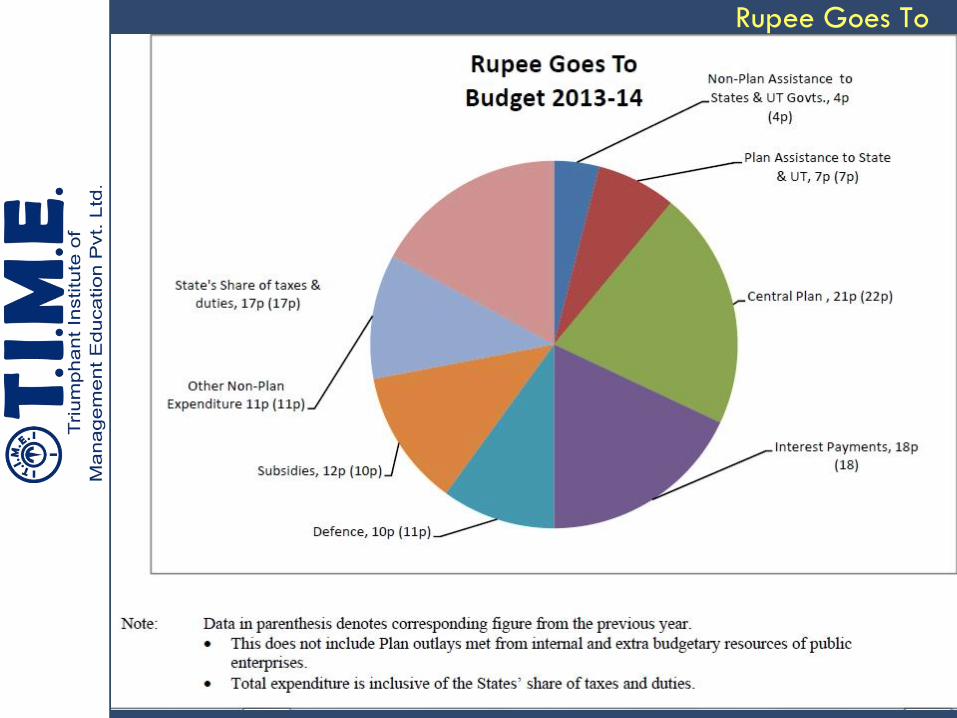
Rupee Goes To
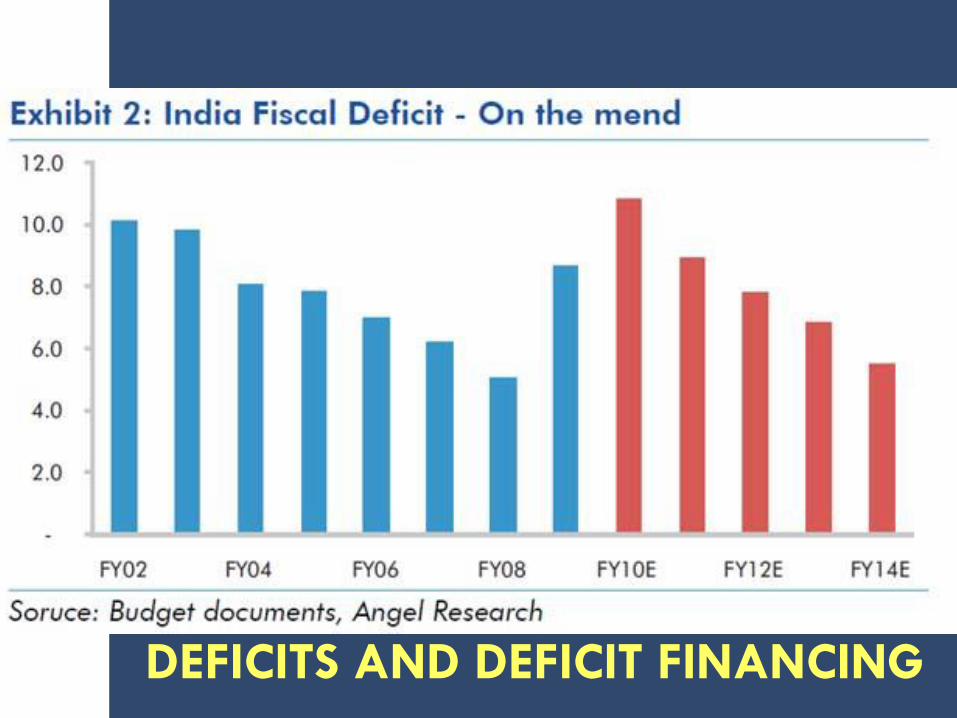
DEFICITS AND DEFICIT FINANCING

DEFICITS • Revenue deficit
Revenue expenditure (interest + subsidy +defense + law and order) — revenuereceipts ( tax + non tax)
• Budget deficit
Total expenditure - total receipts
• Fiscal deficit
Budget deficit + borrowings from banks andpublic

DEFICIT FINANCING AND IMPACT
• Govt. borrows from RBI by transferring securities.RBI prints new currency and puts it into circulationon behalf of the govt.
→ increases money supply. Adds inflationarypressure in economy.
• In some countries, market borrowing is alsotermed as deficit financing.
→ evacuates funds available for pvt. investors.Also, Govt. ends up paying more interest infuture. Development expenditure takes backseat.

TAXES !

TAXES
• DIRECT TAXES
Direct incidence of tax on the person who paysthe tax. liability to pay tax is NOT passed on tosomeone else. e.g. Income Tax, CorporationTax, Wealth Tax, Land Revenue, Gift Tax etc.Known as progressive taxes.
• INDIRECT TAXES
Levied on goods and services. traders /producers pay it. Liability passed on to endcustomer. e.g. VAT, Excise Tax, CustomsDuty, Service Tax. Known as regressive taxes.

Bibliography
• http://en.wikipedia.org/wiki/Economy_of_India
• http://timesofindia.indiatimes.com/city/hyderabad/Gulf-remittances-soar-as-rupee-
weakens/articleshow/13498372.cms
• http://articles.economictimes.indiatimes.com/2012-07-19/news/32747533_1_rural-
labourers-producer-price-index-agricultural-labourers
• http://blogs.economictimes.indiatimes.com/policypuzzles/entry/ax-rates-in-india-are-high-
and-constitute-an-important-reason-for-tax-evasion
• www.pib.nic.in
• www.swaminomics.org
