ma/cs 3751 fall 2002 lecture 24. ma/cs 3752 ginput ginput is a matlab function which takes one...
TRANSCRIPT

MA/CS 375 1
MA/CS 375
Fall 2002
Lecture 24

MA/CS 375 2
ginput
• ginput is a Matlab function which takes one argument
• input: number of points to select in the image
• output: x and y
Matlab functions

MA/CS 375 3
ginput
Cross hairs appear, then click to select point.
Matlab functions

MA/CS 375 4
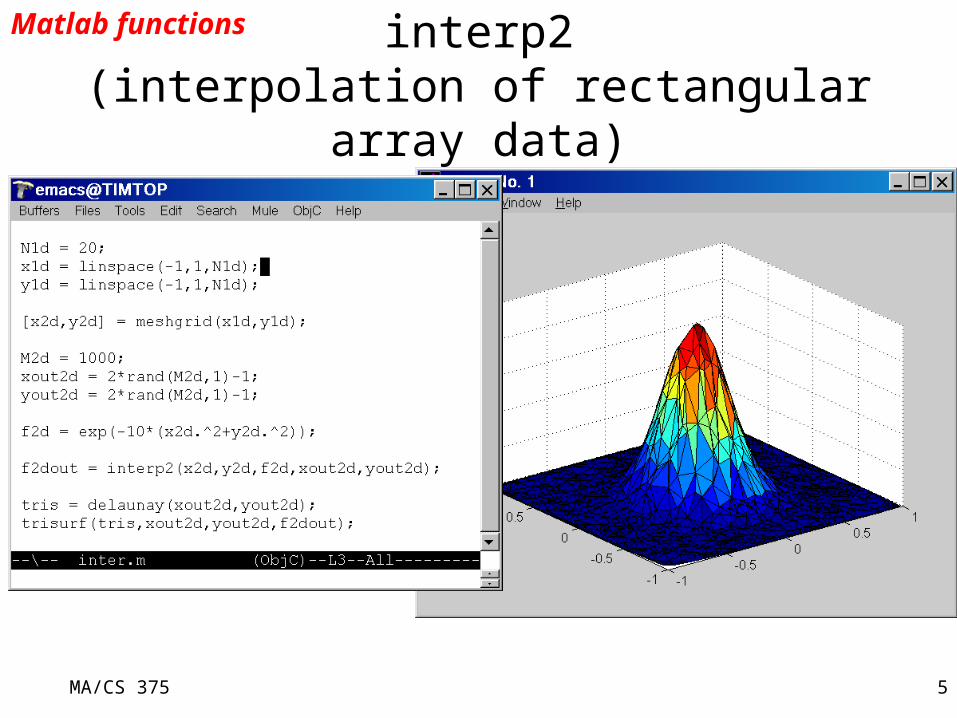
interp2• ZI = INTERP2(X,Y,Z,XI,YI) interpolates to find ZI, the
values of the underlying 2-D function Z at the points in matrices XI and YI.
• Matrices X and Y specify the points at which the data Z is given.
• Out of range values are returned as NaN.
• X, Y must be a regular grid of data (i.e. created with meshgrid)
MA/CS 375 5
interp2(interpolation of rectangular array data)
Matlab functions

MA/CS 375 6
griddata• griddata does the same as interp2 however the
input data can be given at arbitrarily spaced points.
• ZI = GRIDDATA(X,Y,Z,XI,YI) fits a surface of the form Z = F(X,Y) to the data in the (usually) nonuniformly-spaced vectors (X,Y,Z)
• GRIDDATA interpolates this surface at the points specified by (XI,YI) to produce ZI. The surface always goes through the data points.
• XI and YI are usually a uniform grid

MA/CS 375 7
griddataMatlab functions

MA/CS 375 8
Team Project
• Introduction– Each team is going to work on the same
type of project.
– All presentation rules for homework apply to the team project.
– All coding must be done in Matlab

MA/CS 375 9
General Project Topic
• Image tweening.
• i.e. given two or more images we are going to write routines that create intermediate images
• Morphing using non-linear maps
• Examples…
• More details:

MA/CS 375 10
Part 1
• Devise a one page team plan
• It should address what part each team member will work on

MA/CS 375 11
Part 2• Load in two images using imread• Crop the images to be the size of the smaller image.• Display the images in the same window using
subplot
• Let the “user” select a set of control point pairs [CXleft,CYleft] and [CXright,CYright]. i.e. a control point pair consists of one 2D point from each picture. Use ginput
• Plot a * at each point in the left picture and a + at each point in the right picture, using plot
Board demo

MA/CS 375 12
Part 3• Use griddata to evaluate:
Xwarpleft = griddata(CXright,CYright,CXleft,Xright,Yright, ‘cubic’);Ywarpleft = griddata(CXright,CYright,CYleft,Xright,Yright, ‘cubic’);
where Xright and Yright are a rectangular grid of pixel locations in the right
hand image, created with meshgrid.
The output Xwarpleft and Ywarpleft indicate the coordinates in the leftimage where the color of each pixel in the final right image is going to befound
Try using ‘linear’, ‘cubic’, ‘v4’ (i.e. first, third and mystery order interpolation)
Make sure the calculated Xwarpleft and Ywarpleft are in bounds

MA/CS 375 13
Part 4• For each pixel in the right picture, use the
coordinates (Xwarpleft,Ywarpleft in the left picture) found in Part 3, and the function interp2 to find the three intensities (red, green and blue) in the left picture at the warped coordinates.
• Convert the results into unsigned 8-bit integers using uint8.
• Use image to plot the deformed picture.

MA/CS 375 14
Example
Green points map to red points warped coordinate system

MA/CS 375 15
Part 5• Using linear interpolation in time, plot a
sequence of tween images (t=0,0.2,0.4,..,1) using:
• C(x,y) = LeftImage((1-t)*Xleft+t*Xwarpleft,(1-t)*Yleft+t*Ywarpleft)
• Where the values of LeftImage are obtained with interp2

MA/CS 375 16
Example of Tweening
MA/CS 375 17
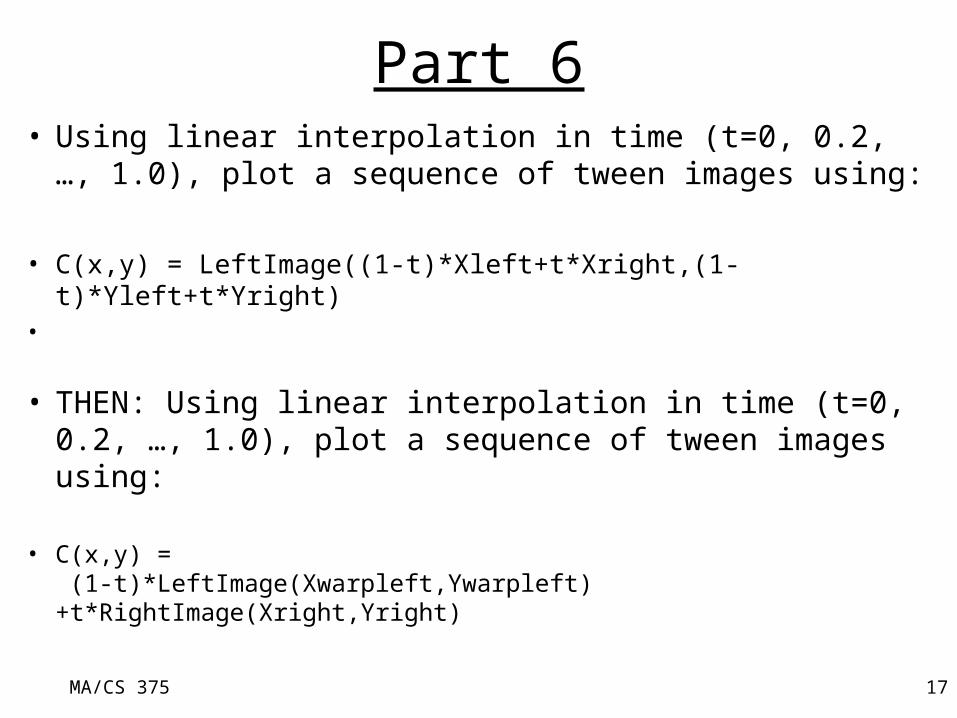
Part 6• Using linear interpolation in time (t=0, 0.2, …, 1.0),
plot a sequence of tween images using:
• C(x,y) = LeftImage((1-t)*Xleft+t*Xright,(1-t)*Yleft+t*Yright)•
• THEN: Using linear interpolation in time (t=0, 0.2, …, 1.0), plot a sequence of tween images using:
• C(x,y) = (1-t)*LeftImage(Xwarpleft,Ywarpleft)+t*RightImage(Xright,Yright)

MA/CS 375 18
Part 7
• Each team member should contribute a picture.
• Using the same method as Part 6 create an animation of the pictures morphing from one to the other in sequence.

MA/CS 375 19
Part 8 (extra credit)• Create a graphical user interface for the project
using guide
• It should have a number of buttons, sliders, radio buttons e.g.– a slider to choose the number of control points– a file option to choose the left and right images– an option to add and reduce control points– a zoom option– a slider to choose number of tween frames– ….
• Go wild….
MA/CS 375 20
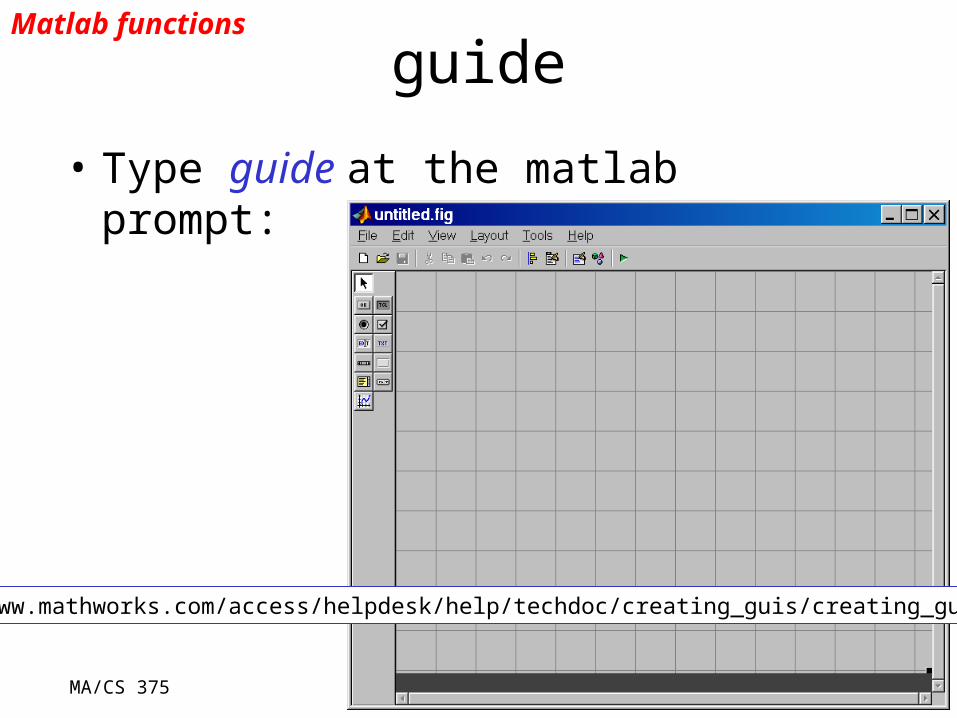
guide
• Type guide at the matlab prompt:
Matlab functions
http://www.mathworks.com/access/helpdesk/help/techdoc/creating_guis/creating_guis.shtml

MA/CS 375 21
guide cont(adding a slider)
1) click on slider icon2) move mouse to top
left of required slider3) drag rectangle to
specify shape ofslider
4) click File, then save as
(1)
(2)(3)

MA/CS 375 22
guide cont.(enabling a slider button)
• right click on slider button
• left click on properties
• you can now edit the properties of this slider

MA/CS 375 23
Using handles
> fig = openfig(mfilename,'reuse');
> handles = guihandles(fig); % Create structure for the first time
> slider_value = get(handles.slider1, ‘Value);

MA/CS 375 24
Add A Bunch of Options(but design a better interface)

MA/CS 375 25
Running GUI:

MA/CS 375 26
Checking slider value

MA/CS 375 27
Project Due 10/23/02
• No extensions. Presentations due on 10/23
• I encourage you to get the majority of it working well before the due date !!.
• Each team member must submit their own report, preferably with experiments using their own pictures.