magmatic processes at the volcanic front of central...
TRANSCRIPT

32
http://journals.tubitak.gov.tr/earth/
Turkish Journal of Earth Sciences Turkish J Earth Sci(2013) 22: 32-60© TÜBİTAKdoi:10.3906/yer-1104-9
Magmatic processes at the volcanic front of Central Mexican Volcanic Belt: Sierra de Chichinautzin Volcanic Field (Mexico)
Fernando VELASCO-TAPIA1,*, Surendra P. VERMA2
1 Facultad de Ciencias de la Tierra, Universidad Autónoma de Nuevo León, Ex-Hacienda de Guadalupe, Carretera Linares-Cerro Prieto km 8, Linares, N.L., 67700, Mexico
2 Departamento de Sistemas Energéticos, Centro de Investigación en Energía, Universidad Nacional Autónoma de México,Privada Xochicalco s/n, Col. Centro, Temixco, Mor., 62580, Mexico
* Correspondence: [email protected]
1. IntroductionThe theory of plate tectonics has provided a framework for the study of the different styles and geochemical characteristics of past and present igneous activity (Stock 1996; Kearey et al. 2009). At least four distinct tectonic environments have been established in which magmas may be generated. These are: (a) destructive plate margin setting (island and continental arcs), (b) continental intra-plate setting (extensional and rift zones), (c) oceanic intra-plate setting (ocean islands), and (d) constructive plate margin setting (mid-ocean ridges and back-arc spreading centres). However, despite deviations from the conventional rigid plate hypothesis (vertical motions, deformation in plate interiors or limitations on the sizes of plates; Stock 1996; Keith 2001), an unambiguous petrogenetic-tectonic model, though very much needed, is difficult to establish in tectonically complex zones, such as the Mexican Volcanic Belt (MVB, Figure 1).
The MVB is a major province, about 1000 km long and 50–300 km wide, of Miocene to present-day volcanism in southern Mexico (e.g., Robin 1982; Gómez-Tuena
et al. 2007a). It has also been called a large igneous province (LIP, Sheth 2007). It comprises more than 8000 individual volcanic structures, including stratovolcanoes, monogenetic cone fields, domes and calderas (Robin 1982). Uniquely, the MVB is oriented at an angle of about 15–20° with respect to the Middle America Trench (MAT, Figure 1, Molnar & Sykes 1969). In particular, in the central MVB (C-MVB) continuing subduction of the Cocos oceanic plate under the North American continental plate and the subalkaline character of most of the lavas, a classic subduction-related magmatic arc model has been suggested as appropriate. However, several geological, geophysical and geochemical features of the C-MVB pose problems with this simple model and have motivated a debate about the magma genesis and origin of this controversial magmatic province (e.g., Shurbet & Cebull 1984; Márquez et al. 1999a; Verma 1999, 2000, 2002, 2004, 2009; Sheth et al. 2000; Ferrari et al. 2001; Ferrari 2004; Blatter et al. 2007; Mori et al. 2009).
A basic problem of the subduction hypothesis is related to the lack of a well-defined Wadati-Benioff zone (Pacheco
Abstract: The Sierra de Chichinautzin (SCN) volcanic field is considered one of the key areas to understand the complex petrogenetic processes at the volcanic front of the Mexican Volcanic Belt (MVB). New as well as published major- and trace-element and Sr and Nd isotopic data are used to constrain the magma generation and evolution processes in the SCN. From inverse and direct modelling, combined 87Sr/86Sr and 143Nd/144Nd data, and use of multi-dimensional log-ratio discriminant function based diagrams and other geological and geophysical considerations, we infer that mafic magmas from the SCN were generated by partial melting of continental lithospheric mantle in an extensional setting. Inverse modelling of primary magmas from the SCN further indicates that the source region is not depleted in high-field strength elements (HFSE) compared to large ion lithophile elements (LILE) and rare-earth elements (REE). The petrogenesis of evolved magmas from the SCN is consistent with the partial melting of the continental crust facilitated by influx of mantle-derived magmas. Generally, an extensional setting is indicated for the SCN despite continuing subduction at the Middle America Trench.
Key Words: geochemistry, subduction, extension, multi-dimensional discrimination diagrams, isotopes, inverse modelling, direct modelling
Received: 18.04.2010 Accepted: 27.05.2011 Published Online: 04.01.2013 Printed: 25.01.2013
Research Article

33
VELASCO-TAPIA and VERMA / Turkish J Earth Sci
& Singh 2010 and references therein). The volcanic front of the C-MVB is about 300 km from the MAT (Verma 2009) whereas, in spite of numerous attempts and a very dense seismic network, the subducted Cocos plate is seismically poorly defined beyond the Pacific coast of Mexico and can only be traced to about 40 km depth at a distance of about 240 km from the trench (Pacheco & Singh 2010). Thus, the presence of the subducted slab can only be inferred from the MAT up to about 60 km away from the C-MVB volcanic front. Recently, subhorizontal subduction has been inferred by Pérez-Campos et al. (2008), Husker & Davis (2009), and Pacheco & Singh (2010) from seismic data obtained from a dense network. The quasi-horizontal subduction and a very shallow subducted slab (at most at about 40 km depth; Figure 5 in Pacheco & Singh 2010) are not thermodynamically favourable conditions for magma generation (Tatsumi & Eggins 1993). Husker & Davis
(2009) assumed a slab temperature model to interpret the seismic data and inferred tomography and thermal state of the Cocos plate, meaning that the results from this circular argument, especially the thermal regime, would depend directly on the basic assumptions. Futhermore, these authors ignored the geochemical and isotopic constraints for basic magmas from the C-MVB (e.g., Verma 1999, 2000, 2002, 2004; Velasco-Tapia & Verma 2001a, b). Similarly, Pérez-Campos et al. (2008) did not take into consideration these geochemical and isotopic constraints in their geological interpretation of the seismic data.
The diminution or even cessation of arc-related volcanism observed in the south-central Andes has been related to subhorizontal subduction of the Nazca plate (Kay et al. 1987; Martinod et al. 2010). Steeper subduction angles are commonly observed in many arcs (Doglioni et al. 2007; Schellart 2007). For example, average slab
Figure 1. Location of the Sierra de Chichinautzin (SCN) volcanic field at the volcanic front of the central part of the Mexican Volcanic Belt (MVB). This Figure (modified from Verma 2002) also includes the approximate location of the Eastern Alkaline Province (EAP), Los Tuxtlas Volcanic Field (LTVF), and Central American Volcanic Arc (CAVA). Other tectonic features are the Middle America Trench (MAT, shown by a thick blue curve) and the East Pacific Rise (EPR, shown by a pair of dashed-dotted black lines). The traces marked by numbers 5 to 20 on the oceanic Cocos plate give the approximate age of the oceanic plate in Ma. Locations of Iztaccíhuatl (I) and Popocatépetl stratovolcanoes (P; from which crustal xenoliths were analysed by Schaaf et al. 2005), are also shown. Cities are: PV– Puerto Vallarta, MC– Mexico City, and V– Veracruz.

34
VELASCO-TAPIA and VERMA / Turkish J Earth Sci
dip angles in the Tonga, Kermadec, New Hebrides and Marianas arcs vary from about 50° to almost 90° (Schellart 2005).
Unlike the south-central Andes and in spite of the peculiarities of subhorizontal subduction and an undefined Benioff zone, widespread volcanism occurs along the entire MVB. Extrapolation of the subducted Cocos plate to greater depths, without any solid seismic evidence, was proposed to overcome this problem (Pardo & Suárez 1995; Pérez-Campos et al. 2008), although this solution has already been criticized in the literature (Sheth et al 2000; Verma 2009). The slab is imagined to be broken and to plunge vertically into the mantle and, interestingly, it is done artificially, without any direct seismic evidence, after bringing it close to the volcanic front of the C-MVB (Pérez-Campos et al. 2008; Husker & Davis 2009).
In a magnetotelluric study of southern Mexico (two-dimensional inversion) by Jödicke et al. (2006), fluid release from the subhorizontal subducted Cocos plate and consequent partial melting of the crust beneath the MVB were inferred to explain the volcanism. Several questions remain to be answered, such as the inadequacy of a two-dimensional solution of a clearly three-dimensional Earth, which are as follows: (i) the assumption of the presence of subducted slab beneath the MVB without any seismic evidence; (ii) the release of subduction fluids from the plate at 40 km depth (this extremely shallow depth is now inferred by Pacheco & Singh 2010) and their subhorizontal travel through 60 km to the MVB volcanic front; and (iii) the inability of the magnetotelluric model to explain the presence of SCN mafic magmas presumably derived from the lithospheric mantle (Verma 2000, 2002, 2004; Velasco-Tapia & Verma 2001a, b). Why could the fluids not have originated either in the lithospheric mantle or in the continental crust, or both? Sheth et al. (2000) proposed that the mantle beneath the MVB is heterogeneous and contains kilometre-scale domains of vein-free peridotite and peridotite with veins of phlogopite or amphibole, or both phases, which could release the required fluids. This could be a more plausible model in the light of the most recent seismic evidence and interpretation (Pacheco & Singh 2010).
The study of mafic rocks located along the entire MVB has revealed rift-like isotopic and geochemical signatures, associated with partial melting of an upwelling heterogeneous mantle source and eruption of magma in an extensional setting with incipient or well-established rifting (e.g., Luhr et al. 1985, 1989; Verma 2009; Luhr 1997; Márquez et al. 2001; Velasco-Tapia & Verma 2001a, b). Alternative hypotheses also suggested to explain the origin of the MVB volcanism, include those related to a plume model (Moore et al. 1994; Márquez et al. 1999a), to extensional tectonics (Sheth et al. 2000; Márquez et al.
2001; Velasco-Tapia & Verma 2001a, b), or to detachment of the lower continental crust (Mori et al. 2009).
In this context, the Sierra de Chichinautzin volcanic field (SCN, Figure 2; Márquez et al. 1999a, b; Wallace & Carmichael 1999; Velasco-Tapia & Verma 2001a, b; Meriggi et al. 2008) represents one of the key areas in which to study the origin and evolution of the magmatism within the MVB for the following reasons: (1) the SCN marks the front of the central MVB (Figure 1) and, if the volcanism is related to subduction, the geochemistry of all rocks should display clear relationships with the subducted Cocos plate (see Verma 2009); (2) 14C age determinations of palaeosols and organic matter interbedded between SCN volcanics have always given ages younger than 40,000 years (Velasco-Tapia & Verma 2001a) and consequently, the processes related to the origin of magmas could still be active beneath this area; (3) the geochemical and Sr, Nd, and Pb isotopic composition of the descending slab is known in this part of the trench from previous studies (Verma 2000); (4) new multi-dimensional tectonic discrimination diagrams based on log-ratio transformed variables with statistically correct methodology (Aitchison 1986) and linear discriminant analysis (LDA) are available for the discrimination of four main tectonic settings (see Verma 2010); and (5) a wide variety of magmas from basalt and trachybasalt to dacite and trachydacite exist (Velasco-Tapia & Verma 2001b), which enable us to investigate the geochemical and isotopic characteristics of the magmatic sources as well as processes controlling the magmatic evolution.
To improve our understanding of the processes controlling the origin of magmas in the SCN volcanic field, we compiled new as well as published geochemical and isotopic data on rocks that cover the compositional range observed in this monogenetic field. The compiled rocks were classified into different geochemical types applying the total-alkali versus silica (TAS) diagram (Le Bas et al. 1986) in the correct way, i.e., after adjusting Fe-oxidation ratio (Middlemost 1989) on an anhydrous basis and to 100 %m/m, and were grouped according to their phenocryst assemblages. We used our extensive geochemical and isotopic database to evaluate different petrological mechanisms for the origin and evolution of the diversity of SCN magmas. We also resorted to inverse modelling of primary magmas to establish the source characteristics, as well as direct modelling of all SCN magmas to infer the petrogenetic processes.
2. Sierra de Chichinautzin: geological settingSeveral authors have described the stratigraphy (Cretaceous to Recent) and volcanic activity in the SCN and surrounding region (e.g., Martín del Pozzo 1982; Swinamer 1989; Vázquez-Sánchez & Jaimes-Palomera

35
VELASCO-TAPIA and VERMA / Turkish J Earth Sci
1989; Mooser et al. 1996; Márquez et al. 1999b; García-Palomo et al. 2000; Siebe et al. 2004; Meriggi et al. 2008).
A calcareous marine to shelf facies sequence was deposited in central Mexico during the Cretaceous (Fries 1960). Rocks from this sequence include massive limestone with black chert lenses, beds of gypsum, massive to thickly bedded limestones, greywacke interbedded with limonite and shale beds. This ~3000-m-thick Cretaceous sedimentary sequence was folded and uplifted during the Laramide orogenic event (Fries 1960) and later intruded by granitic or granodioritic dykes dated at 50±10 Ma (De Cserna et al. 1974). The Eocene–Oligocene stratigraphy that overlies the Cretaceous sequence consists of calcareous conglomerates, lava flows, sandstones, volcanic siltstones, and lacustrine deposits up to 500 m thick.
The sedimentary sequence is unconformably overlain by about 38 to 7.5 Ma rhyolite, rhyodacite, dacitic lava flows and pyroclastic flow deposits (Morán-Zenteno
et al. 1998; García-Palomo et al. 2002), and by Pliocene to Holocene volcanism in Las Cruces, Ajusco and Chichinautzin (Delgado-Granados & Martin del Pozzo 1993). Late Pliocene to Early Pleistocene andesitic to dacitic flows and associated pyroclastic deposits of Las Cruces (Figure 2) are dated approximately at 3.6 to 1.8 Ma (Fries 1960; Sánchez-Rubio 1984; Mora Alvarez et al. 1991; Delgado-Granados & Martin del Pozzo 1993; Osete et al. 2000; García-Palomo et al. 2002). During the younger eruptive period, the Ajusco volcano (Figure 2) was formed by extrusion of several andesitic domes, one of which was dated at about 0.39 Ma (Mora Alvarez et al. 1991). Late Pleistocene–Holocene volcanic activity (<40,000 years; Bloomfield 1975; Córdova et al. 1994; Delgado et al. 1998; Velasco-Tapia & Verma 2001a) in central MVB has been named the Chichinautzin eruption period, characterised by monogenetic activity generating scoria cones and shield volcanoes with associated lava flows.
Figure 2. Trace of the Sierra de Chichinautzin (SCN) volcanic field and the schematic location of the sampling sites according to the petrographic and geochemical rock-types: M1– near primary mafic magmas; M2– mafic magmas evolved by fractional crystallisation; E1– evolved magmas with an ol + opx ± cpx ± plg mineralogical assemblage; E2– evolved magmas with an opx ± cpx + plg mineralogical assemblage; HMI– high magnesium intermediate magmas; HB1– high-Ba magma with low Nb; HB2– high-Ba magma with high Nb; DISQ– D1 and D2 magmas with abundant textural evidence of mineralogical disequilibrium. This Figure (modified from Verma 1999) also includes the approximate location of the Sierra de Las Cruces, Ajusco volcano, and important cities and towns in the area.

36
VELASCO-TAPIA and VERMA / Turkish J Earth Sci
The SCN (Figure 2) comprises over 220 Quaternary monogenetic volcanic centres, covering approximately 2400 km2 (98°40’–99°40’W, 18°30’–19°30’N; Márquez et al. 1999b). Summit elevations in the SCN reach ~3700 m compared with ~2200 m elevation in the southern sector of the Basin of Mexico and ~1500 m in the Cuernavaca Basin (Wallace & Carmichael 1999). Márquez et al. (1999b) pointed out that the SCN can be interpreted as the southernmost structural domain of a group of six parallel E–W-oriented tectonic structures, which show active N–S extension and a strike-slip component. The tectonic setting in the SCN has been confirmed, for example, by the analysis of focal mechanism of the Milpa Alta earthquake (very shallow depth of ~ 12 km), that was interpreted as an E–W normal faulting event with a significant (50%) sinistral strike-slip component (UNAM & CENAPRED Seismology Group 1995). Based on the interpretation of reflection seismic transects and detailed geologic mapping, Mooser et al. (1996) recognised an Oligocene basin crossing the SCN from N to S, called the Mixhuca basin. Additionally, these authors reported three other Pleistocene basins in the region (denominated by them from north to south as the Mexico, Tlalli-Santa Catarina and Chichinautzin-Izta-Malinche basins), with an inferred east–west orientation. These basins could represent a widespread manifestation of both E–W and N–S extension in the SCN area (Velasco-Tapia & Verma 2001b).
The central MVB is characterised by pervasive E–W normal faults with a left-lateral strike- slip component, some of which are seismically active (Johnson & Harrison 1990; Suter et al. 1992, 1995; Ego & Ansan 2002). Taking into account the geometry of regional graben-type structures, Márquez et al. (2001) suggested that extensional rates increase to the west. The tectonic scenario is complemented by active N–S to NNW-striking normal faults, related to the southern continuation of the Basin and Range Province (Henry & Aranda-Gomez 1992). The monogenetic volcanism in this part of the MVB appears to be related to E–W and N60°E-oriented extensional faults (Alaniz-Alvarez et al. 1998).
Extensional stress conditions in the SCN could provoke crustal weakening and facilitate the formation and eruption of monogenetic volcanoes. This model is consistent with geophysical observations indicating the existence of a low density (3.29 g/cm3) and low velocity (Vp= 7.6 km/s) mantle layer at the base of the crust (at ~40 km depth) beneath the central MVB (Molina-Garza & Urrutia-Fucugauchi 1993; Campos-Enríquez & Sánchez-Zamora 2000). A pronounced gravity low is observed over the entire MVB, and especially beneath its central region (< –200 mGal Bouguer anomaly; Molina-Garza & Urrutia-Fucugauchi 1993). Consequently, several authors (Fix 1975; Gomberg & Masters 1988; Molina-Garza &
Urrutia-Fucugauchi 1993) have suggested the existence of an anomalous low density, low velocity, partially molten mantle layer at the base of the crust (~40 km), being an atypical feature of continental arcs (Tatsumi & Eggins 1993). Additionally, Márquez et al. (2001) proposed a two-layer crustal stretching model (brittle and ductile domains) to explain the southward migration of volcanic activity. These layers are separated at an upper crustal level (depth ~10 km) by a zone of simple shear decoupling, at the brittle-ductile transition zone. The overall movement which occurs above this zone is southwards.
3. Analytical methods and resultsSCN volcanic rocks were collected from outcrops or road-cuts, avoiding any possible alteration. Samples were jaw crushed and splits were pulverised in an agate bowl for geochemical analysis. Major elements were analysed in ten samples (Appendix A1) by X-ray fluorescence spectrometry (XRF) at Laboratorio Universitario de Geoquímica Isotópica (LUGIS)–UNAM. These measurements were carried out on fused glass discs using a Siemens sequential XRF SRS 3000 (with a Rh tube and 125 mm Be window) equipment. Sample preparation, measuring conditions, and other details about the calibration curves (applying a regression model considering errors on both axes) and precision and accuracy estimates were reported by Guevara et al. (2005). Precision for major elements ranged between 0.5 and 5%. Sixteen different geochemical reference materials (GRM) were run to assess the analytical accuracy, providing results within 1–10% of GRM recommended values.
Additionally, the major and trace element compositions of other twenty-five samples (Appendix A1 and A2) were determined by ActLabs laboratories, Canada, following the ‘4 LithoRes’ methodology. The sample was fused using a lithium metaborate-tetraborate mixture. The melt produced by this process was completely dissolved with 5% HNO3. Major elements were analysed in the resulting solution by inductively coupled plasma-optical emission spectrometry (ICP-OES), with an analytical accuracy of <6%. Trace element analyses were done by inductively coupled plasma-mass spectrometry (ICP-MS). The analytical reproducibility ranged between 5 and 12%.
Sr and Nd isotope analyses (Appendix A3) were performed at Laboratorio Universitario de Geoquímica Isotópica (LUGIS)–Universidad Nacional Autónoma de México. Analyses were carried out on a Finnigan MAT-262 thermal ionisation mass spectrometer (TIMS). Repeated analyses of SRM987 Sr standard (n= 208) and La Jolla Nd standard (n= 105) gave average values of 0.710233±17 and 0.511880±21, respectively. The analytical errors for 87Sr/86Sr and 143Nd/144Nd measured ratios are directly quoted for each sample (Appendix A3).

37
VELASCO-TAPIA and VERMA / Turkish J Earth Sci
Analytical data for minerals were obtained from thin-sections of selected samples, using the WDS JXA-8900 JEOL microprobe system of Centro de Microscopía Electrónica, Universidad Complutense de Madrid, Spain (Appendix A4–10). The experimental conditions were 15 kV and 20 nA, for establishing an electronic beam of ~1 mm. The apparent concentrations were automatically corrected for atomic number (Z), absorption (A), and fluorescence (F) effects internally in the ZAFJEOL software. The calibration of the microprobe system was carried out using reference minerals from the Smithsonian Institution (Jarosewich et al. 1980). The analytical accuracy was ~2% on average for each analysis.
The structural formula for each analysed mineral was estimated following a standard procedure that includes the calculation of atomic proportions of each element and the distribution of these proportions among the available sites in the silicate structure, with fixed number of oxygens (Deer et al. 1997). The problem of estimating Fe+3 content in spinels was solved by applying the stoichiometric criteria proposed by Droop (1987). Pyroxene and amphibole structural formulae were calculated using the computer programs developed by Yavuz (1999, 2001). However, compositional contrasts from core to rim were studied in zoned crystals by means of profile analysis and scanning probe microanalysis (SEM) images.
4. Database and initial data handlingNew geochemical (major and trace element data; Appendix A1 and A2) and isotopic data (Appendix A3) for magmas from the SCN were compiled. Also included were data for mafic and evolved magmas reported previously by Swinamer (1989), Rodríguez Lara (1997), Delgado et al. (1998), Wallace & Carmichael (1999), Verma (1999, 2000), Velasco-Tapia & Verma (2001b), García-Palomo et al. (2002), Martínez-Serrano et al. (2004), and Siebe et al. (2004). Thus, the database included information on 289 samples from the SCN.
Similarly, major and trace element data were also compiled for the Central American Volcanic Arc (CAVA, Figure 1) related to the subduction of the same Cocos oceanic plate beneath the Caribbean plate. This database enabled us to compare and contrast the geochemistry of the SCN with a classic arc (CAVA), particularly using the new log-ratio discriminant function based multi-dimensional diagrams (Verma et al. 2006; Verma & Agrawal 2011). The sources for these data were as follows: Carr (1984); Hazlett (1987); Reagan & Gill (1989); Carr et al. (1990); Walker et al. (1990, 2001); Bardintzeff & Deniel (1992); Cameron et al. (2002); Agostini et al. (2006); Alvarado et al. (2006); Bolge et al. (2006) and Ryder et al. (2006). Data from the rest of the MVB were not considered here, because they had been studied elsewhere (e.g., Verma 2009; Verma et al. 2011).
Rock classification was based on the total alkali-silica (TAS) scheme (Figure 3; Le Bas et al. 1986) on an anhydrous 100% adjusted basis and Fe2O3/FeO ratios assigned according to the rock type (Middlemost 1989). All computations (anhydrous and iron-oxidation ratio adjustments, and rock classifications) were automatically done using the SINCLAS computer program (Verma et al. 2002).
To compute and report central tendency and dispersion parameters, mean and standard deviation estimates were used after ascertaining that the individual parameter values were drawn from normal populations free of statistical contamination. To check this, a computer program was used to apply all single-outlier type discordancy tests at a strict 99% confidence level (DODESSYS by Verma & Díaz-González 2012).
5. Geochemical and mineralogical compositionThis section presents the geochemical, isotopic (Appendix A1–3), and mineralogical (Appendix A4–10) characteristics of different types of SCN magmas (Figures 3–6). The interpretation of these data will be presented in the next section.5.1. Mafic magmasApproximately 15% of magmas that constitute the SCN database have (SiO2)adj < 53% and Mg# [100*Mg/(Mg + Fe+2)] = 64–72 (mafic magmas, M). Note that we are not using mafic magmas as synonymous of basic magmas, because the latter have been defined as (SiO2)adj < 52% (Le Bas et al. 1986). The upper limit of 53% was used mainly because we wanted to have a number of samples for inverse modelling that might provide statistically significant results.
The mafic magmas are usually porphyritic or microcrystalline with < 25% of phenocryst content. Phenocrysts are of euhedral olivine with inclusions of chromiferous spinel, and plagioclase. However, in many samples, plagioclase occurs only as microphenocrysts. The groundmass consists of these minerals, plagioclase being the main component; opaque minerals (titanomagnetite, ilmenite) are also present. In many samples both phenocrysts and groundmass plagioclase show a preferred flow orientation. Additionally, some rocks show circular or elongated vesicles (6–10% in volume).
Representative core analysis and structural formulae for olivine, spinel and plagioclase in SCN mafic magmas are reported in Velasco-Tapia & Verma (2001b). Olivine phenocrysts show an average core composition of Fo85.9±2.5 (n= 48). Rims of most olivine phenocrysts show small variations in composition (0.2 to 4.0 in %Fo) compared to the core data, although some phenocrysts showed greater differences (17%). Olivine compositional data are consistent

38
VELASCO-TAPIA and VERMA / Turkish J Earth Sci
with those previously reported by Wallace & Carmichael (1999) and Márquez & De Ignacio (2002). Chromiferous spinel inclusions are characterised by typical compositions of inverse structure Fe/(Fe+Mg)= 0.54±0.06, Cr/(Cr+Al)= 0.49±0.05, and Fe+3/Fe= 0.35±0.05 (n= 25). However, it is not possible to assign specific names, as all specimens are situated in the central part of the MgAl2O4–MgCr2O4–FeCr2O4–FeAl2O4 prism (Haggerty 1991). Plagioclase is present as small euhedral phenocrysts, without optical zoning, of labradorite composition (An59.8±4.7; n= 29).
Using the TAS diagram (Figure 3; Le Bas et al. 1986), M magmas are classified as B, TB, BTA, and BA. All rocks show LREE (light rare-earth elements) enriched chondrite-normalised patterns (Figure 4a), being reflected by [La/Yb]N (chondrite-normalised) ratios of 5.1±0.9 (n= 18, range= 3.6–6.8), without a negative Eu anomaly. MORB-normalised multi-element plots of these magmas show enrichment in large ion lithophile elements (LILE) and lack high field strength element (HFSE) significant negative anomalies (Figure 5a). M-type magmas display 87Sr/86Sr ratios from 0.70348 to 0.704302 (n= 12), whereas
143Nd/144Nd ratios covers a narrow interval from 0.51279 to 0.51294 (n= 11). All samples fall within the ‘mantle array’ (Faure 1986) in the 87Sr/86Sr–143Nd/144Nd diagram (Figure 6a).5.2. Evolved magmasEvolved SCN rocks, (SiO2)adj > 53%, are usually porphyritic or microcrystalline with <26% of phenocrysts, of which some have circular or elongated vesicles reaching 6–10% of total volume. However, some lava domes (for example, Tabaquillo or Lama) have phenocryst content as high as 50%. Groundmass mainly consists of plagioclase, pyroxenes, and magnetite. Based on their mineralogical assemblage of phenocrysts, SCN evolved magmas are divided into two groups: (a) E1: ol + opx ± cpx ± plg; and (b) E2: opx ± cpx + plg.
Euhedral olivine crystals in E1 magmas have a similar composition (Fo84.1±3.1; n= 24; Appendix A4) as observed in specimens included in M-type magmas, although their rims are more enriched in iron (Fo77.3 ± 5.2; n= 17). Spinel inclusions are abundant in olivine, being slightly more chromiferous (Cr/[Cr + Al]= 0.57±0.07, n= 17; Appendix
Figure 3. Total alkali–silica diagram (TAS; Le Bas et al. 1986) for SCN magmas, based on recalculated major-element whole-rock concentrations normalized to 100% volatile-free with Fe2O3/FeO after Middlemost (1989) from SINCLAS computer program (Verma et al. 2002). Field names: B– basalt; BA– basaltic andesite; A– andesite; D– dacite; TB– trachybasalt; BTA– basaltic trachyandesite; TA– trachyandesite. Rock-type labels are the same as Figure 2.

39
VELASCO-TAPIA and VERMA / Turkish J Earth Sci
A5) than those in the M-magmas. Orthopyroxenes (enstatite) are typically subhedral to euhedral, usually displaying normal zoning with a homogeneous composition (cores: En81.1±1.5, n= 14; rims: En80.6±1.4, n= 12; Appendix A6). Clinopyroxenes (augite: En47; Appendix A7) appear only in the groundmass. Plagioclases are labradorite, comparable to plagioclases in M-type magmas
(An59.6±4.5, n= 14; Appendix A8). E1 magmas are distributed in the BTA, BA, TA, and A fields on the TAS diagram (Figure 3), with (SiO2)adj= 53.0–62.4 and Mg#= 52–74 (n= 90). These rocks show LREE-enriched patterns and lack or display a very small negative Eu anomaly (Figure 4d). [La/Yb]N ratios displayed by these magmas (7.0±1.6, n= 19) are significantly higher compared to the M magmas.
Figure 4. Chondrite-normalised REE diagrams for SCN magmas: (a) mafic magmas; (b) high-Ba magmas; (c) high-magnesium intermediate magmas; (d) evolved magmas with an ol + opx ± cpx ± plg mineralogical assemblage; (e) evolved magmas with an opx ± cpx + plg mineralogical assemblage; and (f) disequilibrium magmas. The adjusted %SiO2 –(SiO2)adj is reported for each sample. Chondrite data (mg.g-1) from Haskin et al. (1968) and Nakamura (1974): La= 0.329, Ce= 0.865, Pr= 0.112, Nd= 0.63, Sm= 0.203, Eu= 0.077, Gd= 0.276, Tb= 0.047, Dy= 0.343, Ho= 0.07, Er= 0.225, Tm= 0.03, Yb= 0.22, and Lu= 0.0339.

40
VELASCO-TAPIA and VERMA / Turkish J Earth Sci
Multi-element MORB-normalised diagrams are similar to those showed by M magmas with the exception of a slightly negative Nb anomaly (Figure 5d). The statistical comparison of E1 with M magmas reveals that (a) significantly higher contents of four LILE (K, Cs, Rb, and Ba), one HFSE (Hf) and two actinide-HFSE (Th and U);
(b) similar concentrations for REE (La-Lu), one LILE (Sr), and two HFSE (Zr and Ta); and (c) significantly lower Nb and Y contents.
Felsic E2 magmas are mainly pyroxene-phyric andesites and dacites ((SiO2)adj= 55.4–67.3, Mg#= 49.5–71.5; n= 96), sometimes showing clots of ortho > clinopyroxene.
Figure 5. N-MORB-normalised multi-element diagrams for SCN magmas: (a) mafic magmas; (b) high-Ba magmas; (c) high-magnesium intermediate magmas; (d) evolved magmas with an ol + opx ± cpx ± plg mineralogical assemblage; (e) evolved magmas with an opx ± cpx + plg mineralogical assemblage; and (f) disequilibrium magmas. The adjusted %SiO2 – (SiO2)adj– is reported for each sample. N-MORB data (%m/m for major-oxides and mg.g-1 for trace elements) from Pearce (1982): Sr= 120, K2O= 0.15%, Rb= 2, Ba= 20, Th= 0.20, Ta= 0.18, Nb= 3.5, Ce= 10, P2O5= 0.12%, Zr= 90, Hf= 2.40, Sm= 3.3, TiO2= 1.5, Y= 30, Yb= 3.4, and Cr= 250.

41
VELASCO-TAPIA and VERMA / Turkish J Earth Sci
Augitic and enstatitic pyroxenes are normally zoned, both displaying a narrow compositional range for cores (opx: En82.7±3.1, n= 45, Appendix A6; cpx: En46.3±2.1Wo43.3±1.3, n= 28, Appendix A7), with changes of 6–10% in %En for rims. However, some specimens also contain pyroxene phenocrysts showing slightly reverse zoning (opx in CHI02, Appendix A6; cpx in CHI71, Appendix A7). Plagioclase phenocrysts display a narrow compositional range (An59.5±3.9, n= 12). Felsic E2 magmas have REE ([La/Yb]N= 8.1±1.4, n= 49; Figure 4e) and MORB-normalised multi-element (Figure 5e) patterns similar to those of E1 magmas. Compared to M magmas, E2 magmas have: (a) significantly higher concentrations for three LILE (Ba, Rb, and Cs) and actinide-HFSE (Th and U); (b) similar compositions for LREE (La-Nd, except Ce), Dy, Hf and Sr; and (c) significantly lower contents for Ce, MREE (Sm-Tb), HREE (Ho-Lu), and four HFSE (Nb, Ta, Y, and Zr). It is remarkable that E2 magmas with somewhat higher silica levels — (SiO2)adj= 61.8±2.5 (n= 96) show significantly higher contents only for Ba, Cs, Rb, and actinide-HFSE (Th and U) compared to E1 magmas — (SiO2)adj= 57.0±2.5 (n= 90).
Sr isotope ratios of the evolved magmas display significant variations over their SiO2 range (E1: 0.7036–0.7048; E2: 0.7037–0.7047). Nd isotope ratios range from 0.5127 to 0.5130 and show a well-defined negative
correlation with Sr isotope ratios (Figure 6b). Generally, 87Sr/86Sr and 143Nd/144Nd fall within the ‘mantle array’ field, overlapping with the high 143Nd/144Nd side of the Mexican lower crust (Patchett & Ruiz 1987; Ruiz et al. 1988a, b; Roberts & Ruiz 1989; Schaaf et al. 1994).5.3. High-Mg intermediate magmasIntermediate magmas with relatively high contents of MgO (HMI) have been emitted from some volcanic centres of the SCN, most of them situated in the W area (Figure 2). As M magmas, these rocks are also usually porphyritic, with <20% vol. % phenocrysts in a glassy matrix. Phenocrysts are predominantly euhedral olivine, plagioclase, and occasionally orthopyroxene. The groundmass is largely made of small plagioclase microcrystals.
Euhedral olivine cores have compositions of Fo88.5±1.4 (n= 17), being slightly more mafic than those in M-type magmas (Appendix A4). In general, there is little change in the forsterite proportion throughout the olivine crystals (0.1–4.0%). The phenocrysts contain numerous chromiferous spinel inclusions of inverse structure (Appendix A5), with a composition of Fe/(Fe + Mg)= 0.52±0.08, Cr/(Cr + Al)= 0.563±0.020, and Fe+3/Fe= 0.322±0.031 (n= 15). Moderately zoned labradoritic plagioclase phenocrysts also occur, although with more calcic cores (n= 9; An64.2±1.4; Appendix A8) compared to those in M magmas.
Figure 6. 87Sr/86Sr-143Nd/144Nd plot for the SCN magmas and their comparison with other tectonic areas, mantle and crustal reservoirs, and the descending slab. The symbols used are shown as inset in each Figure. The “Mantle-array” (dashed lines) is included for reference (Faure 1986). (a) The mafic, high-Ba, and high-Mg intermediate SCN rocks are compared with primitive rocks (Mg# > 63, %SiO2 adj < 52) from continental rifts including extension-related areas as well as from island and continental arcs including the northern CAVA. All mantle components named after Zindler & Hart (1986) are: BSE– bulk silicate earth or PUM– primitive uniform mantle reservoir; PREMA– prevalent mantle composition; HIMU– high U/Pb mantle component. Also included is the mixing line (thick solid curve) of two-component mixing of altered basalts and sediments from the ‘Downgoing slab’ or Cocos plate (Verma 2002) The numbers (2–20%) indicate the %m/m of the sediment component in the mixture. Note the shift towards the ‘Downgoing slab’ shown by numerous arc magmas. (b) The high-Ba, evolved, and disequilibrium SCN rocks are compared with the Mexican lower crust (Patchett & Ruiz 1987; Ruiz et al. 1988a, b; Roberts & Ruiz 1989; Schaaf et al. 1994), crustal xenoliths from Popocatépetl near the SCN (Schaaf et al. 2005), and altered basalt and sediments from the subducting Cocos plate (‘Downgoing slab’; Verma 2000). The basalt-sediment mixing curve is the same as in (a).

42
VELASCO-TAPIA and VERMA / Turkish J Earth Sci
According to the nomenclature of Le Bas et al. (1986), the HMI magmas are classified as BTA and BA (HMI1 and HMI2 respectively in Figure 3), having (SiO2)adj= 52.7–56.6%, (MgO)adj= 6.5–10.2% and Mg#= 66–76 (n= 32). All rocks show enrichment in light REE, a gradual slope change which leads to a nearly flat pattern in heavy REE (Figure 4c; [La/Yb]N= 5.1±1.0, n= 7, range= 3.6–6.4), and a negligible Eu anomaly. MORB-normalised multi-element plots (Figure 5c) display a pattern characterised by enrichments in LILE (Sr, K, Rb, and Ba) and depletion of HFSE (Nb, Ta, and Ti), which contrasts with the observed patterns for M magmas. Moreover, two LREE (La and Ce), three MREE (Sm, Eu, and Tb), Sr, and five HFSE (Hf, Nb, Ta, Y, and Zr) concentrations in HMI rocks are statistically lower than the M magmas, whereas the differences in composition of the rest of the incompatible elements are not statistically significant. However, HMI magmas have 87Sr/86Sr (0.70390–0.70416) and 143Nd/144Nd (0.51281–0.51285) ratios (n= 3) nearly comparable with those displayed by M magmas.5.4. Two types of high-Ba magmasIn the SCN mafic emissions are characterised by a high concentration of Ba compared to M magmas and the other rock-types. This group, designated here as HB1, comprises one TB and three BTA ((SiO2)adj= 52.1±1.4; MgO= 9.0±0.9, Mg#= 74.5±0.5), erupted in the NW part of the monogenetic field, and not near the volcanic front.
In statistical comparison with M magmas at the same SiO2 level (BTA and BA), the HB1 group shows the following characteristics: (a) significantly higher concentrations of LREE (La-Nd), MREE (Sm-Gd), LILE (K, Rb, Ba, and Sr) and actinide-type HFSE (Th and U); (b) similar contents of MREE (Tb and Dy), HREE (Ho-Lu) and three HFSE (Zr, Hf, and Y); and (c) significantly lower composition of two HFSE (Ti and Nb). Chondrite-normalised REE patterns for HB1 are LREE enriched (Figure 4b; [La/Yb]N ~18.4), whereas a significant Nb depletion with respect to Ba and Ce is observed on a MORB-normalised multi-element diagram (Figure 5b). The BTA RMS-2 (Martínez-Serrano et al. 2004) shows higher 87Sr/86Sr and similar 143Nd/144Nd isotopic ratios compared to M mafic rocks, with a shift towards the right of the mantle array (Figure 6a).
A second group of high-Ba magmas (HB2) occurs in the central part of SCN (Figure 2). This group includes a variety of magma types (TB, BTA, TA, and A; (SiO2)adj= 50.4–61.7, Mg#= 61.2–71.0, Figure 3), which show high concentrations of Ba (715-1830 mg.g-1) and light REE (La= 23–58 mg.g-1; [La/Yb]N= 7.3–12.0; Figure 4b), accompanied by relatively high contents of HFSE (Nb= 8–19 mg.g-1; Zr= 249–344 mg.g-1; Figure 5b). However, compared to E2 magmas at the same SiO2 level, HB2 rocks have significantly lower La, Ce, and Ba contents.
5.5. Disequilibrium magmas (DISQ)The DISQ group comprises rocks that range widely in (SiO2)adj (54.7–66.2; BTA to D; n= 20) and Mg# (51–73), but with the two following distinctive features: (a) abundant textural evidence of mineralogical disequilibrium, such as coexisting Fo-rich olivine and quartz with pyroxene reaction rims and disequilibrium textures in plagioclase with oscillatory or more complex zoning and twinning; and (b) the occurrence of hydrous minerals (biotite, amphibole), absent in the other rock groups. Similar mineralogical characteristics have been reported in the evolved magmas erupted by the neighbouring stratovolcanoes Iztaccíhuatl (Nixon 1988a, b) and Popocatépetl (Straub & Martin del Pozzo 2001), which were interpreted as the result of mixing between mafic (derived from mantle) and felsic (derived from crust) magmas. Consequently, such a scenario can also be hypothesised for the SCN. See the Discussion section below.
Unzoned or slightly normally zoned olivine phenocrysts of the DISQ group have cores of Fo83.9±3.4 (n= 17; Appendix A4). Orthopyroxene (enstatite) cores have compositions (En82.4±3.6, n= 18; Appendix A6) comparable to those observed in other rock groups. Clinopyroxenes exhibit a varied morphology that includes euhedral, subeuhedral or skeletal crystals, showing an augitic composition (En45.0±1.8Wo44.5±1.6; n= 18; Appendix A7). In some samples, pyroxenes with normal and reversed zoning (e.g., opx: CHI08, CHI49, and CHI63, Appendix A6; cpx: CHI21, Appendix A7) are present. Several rounded quartz grains show hypersthene reaction rims (CHI11, En70Fs27). Compared to other rock groups, plagioclase cores in DISQ magmas vary more in composition (An54±13, n= 15). In some cases, as dacite CHI09, the plagioclases of groundmass display a bimodal composition (An20 and An60). Some dacitic thick lava flows, such as Lama CHI10 and Tabaquillo CHI79, include abundant large plagioclase phenocrysts (2–4 mm in length) characterised by concentric oscillatory zoning with the cores more calcic than the rims (Appendix A9). Additionally, these magmas contain hydrated minerals, amphibole (edenite, tschermakite, and hastingsite; Márquez & De Ignacio 2002) and brown biotite (annite; Appendix A10), strongly altered to iron oxides.
DISQ magmas show LREE-enriched patterns with either a very small or no negative Eu anomaly (Figure 4f). [La/Yb]N ratios displayed by these magmas are somewhat higher than mafic magmas (7.1±1.7, n= 9). MORB-normalised multi-element plots are characterised by relatively enriched LILE and depleted HFSE (Figure 5f), comparable with the E1 and E2 patterns and contrasting with those observed in M magmas. Note that, in this group, REE, LILE and HFSE concentrations diminish with increasing (SiO2)adj (Figures 4f & 5f). Statistically, trace

43
VELASCO-TAPIA and VERMA / Turkish J Earth Sci
element compositions in DISQ magmas are comparable with those shown by felsic E2 magmas, except for La, Rb and Ta (more concentrated in E2) and Sr (with high content in DISQ). The Sr (0.7037–0.7045; n= 7) and Nd (0.5128–0.5130; n= 7) isotopic ratios of DISQ magmas are within the range defined by evolved magmas from SCN and the Mexican lower crust and crustal xenoliths from the Popocatépetl stratovolcano located near the SCN (Figure 6b).
6. Discussion6.1. Origin of the mafic magmas(1) SCN near-primary magmas – Following Luhr (1997), 35 samples of M magma were identified with geochemical characteristics of near-primary magmas (M1: (SiO2)adj= 49.0–52.7%, (MgO)adj= 7.0–9.3%, Mg#= 64.1–72.7): basalt
(12 samples); trachybasalt (8); and basaltic trachyandesite (15). Average compositions of these magma types are reported in Appendix A11.
(2) Trace element ratios (subduction vs mantle signature) – In addition to relatively high Mg#, M1 magmas do not show significant HFSE (Nb and Ta) depletion compared to LILE (Rb, Ba and Sr) (Figure 5a). These magmas also have low Ba/Nb (< 30), Sr/P (< 0.45), Rb/La (<1.3), and Cs/Th (< 0.5) ratios (Figure 7a, b), similar to those observed in most rocks from continental rifts and break-up areas (e.g., Verma 2006). This behaviour contrasts with that exhibited by island and continental arcs (Hawkesworth et al. 1991; Tatsumi & Eggins 1993; Verma 2002).
SCN near-primary magmas show significantly small negative Nb anomalies (expressed as [Nb/Nb*]Primitive-mantle defined by Verma (2006); Appendix A12; mean or median
Figure 7. Four binary diagrams constructed using slab-sensitive or mantle-sensitive parameters (Verma 2006) for near primary mafic magmas from the SCN (open squares) and their comparison with similar rocks from continental rifts, including extension-related areas and continental break-up regions, as well as from island and continental arcs including the CAVA and Andes. Dotted lines in different diagrams give approximate reference values for the fields occupied by the SCN mafic rocks. (a) Slab-sensitive Ba/Nb–slab sensitive Sr/P (therefore, both parameters are likely to have high values for arcs); (b) slab-sensitive Rb/La–slab sensitive Cs/Th; (c) mantle sensitive Nb-[Nb/Nb*]Primitive mantle, where [Nb/Nb*]Primitive mantle is a quantitative measure of Nb anomaly defined as the ratio of actually measured Nb concentration of a sample normalized with respect to primitive mantle and the average value of primitive mantle-normalized concentrations of Ba and La in the same sample (primitive mantle values were from Sun & McDonough 1989); and (d) slab-sensitive [LILEE/LREEE]–slab sensitive [LILEE/HFSEE] where subscript E refers to bulk silicate earth-normalised values, LILEE= (KE + RbE + BaE + SrE)/4, LREEE = (LaE + CeE + NdE)/3, and HFSEE= (NbE + ZrE + TiE + PE)/4. All concentrations data in mg.g-1 were normalized against bulk silicate earth values (E) given by McDonough & Sun (1995).

44
VELASCO-TAPIA and VERMA / Turkish J Earth Sci
value ~0.69; 95% and 99% confidence limits of 0.61–0.77 and 0.58–0.81, respectively), which are similar to those in extension-related areas (Figure 7c). For comparison, island and continental arc magmas have [Nb/Nb*]Primitive-
mantle mean or median values of ~0.06–0.32 (Appendix A12; 95% and 99% confidence limits within the range ~0.03–0.47 and ~0.01-0.60, respectively). A negative Nb anomaly is also a common characteristic of primitive rocks from rifts, extension-related regions, and continental break-up areas (Figure 7c and Appendix A12) although its value is different from that in arcs. Furthermore, in arcs the negative Nb anomaly is accompanied by low Nb contents (generally < 10 mg.g-1; Verma 2006). Additionally, the M1 magmas have LILEE/HFSEE < 2.2, comparable to extension and continental break-up magmas (Figure 7d; Verma 2004, 2006). Three samples of mafic magmas from the SCN (not included in our database) reported by Schaaf et al. (2005), also have geochemical characteristics similar to the M1 magmas.
(3) Discrimination diagrams – Major and trace element signatures have been widely used in conventional discrimination diagrams to identify different tectonic settings (e.g., Pearce & Cann 1973; Shervais 1982; Meschede 1986; Cabanis & Lecolle 1989). However, the application of these older geochemical diagrams has been criticised (Verma 2010) on the basis of the following reasons: (a) the discrimination only uses bi- or tri-variate data drawn from ‘closed’ arrays; (b) the diagrams were generally constructed using a limited geochemical database; (c) they do not incorporate proper statistical treatment for compositional data (Aitchison 1986); (d) most such diagrams discriminate only broadly grouped settings, such as within-plate that combines continental rift basalt (CRB) and OIB settings; and (e) the boundaries in most tectonic discrimination diagrams are drawn by eye (Agrawal 1999).
All objections were in fact overcome in three sets of discriminant function based multi-dimensional diagrams (Verma et al. 2006; Agrawal et al. 2008; Verma & Agrawal 2011), in which natural-logarithm transformed ratios were used for LDA. These newer diagrams have been successfully used for the study of different areas (e.g., Srivastava et al. 2004; Rajesh 2007; Sheth 2008; Polat et al. 2009; Slovenec et al. 2010; Zhang et al. 2010). The results of their application to the SCN are summarised in Figure 8a–e for Verma et al. (2006) diagrams for major-elements and Figure 9a–e for Verma & Agrawal (2011) diagrams for the so called immobile elements – (TiO2)adj, Nb, V, Y, and Zr. For the other set of immobile elements (La, Sm, Yb, Nb, and Th), the set of diagrams proposed by Agrawal et al. (2008) could not be used, because complete data were available for only one mafic rock sample from the SCN. The results from Figure 8a–e show high success rates of
93% to 100% for the SCN as a continental rift setting and 76–80% for CAVA as an arc setting (Appendix A13). For Verma & Agrawal (2011) diagrams (Figure 9a–e) only four basic rock samples from the study area were available with complete data, although they indicated a continental rift setting. For CAVA an arc setting is fully confirmed (Appendix A13).
In a study of the SCN, Siebe et al. (2004; their figure 13) plotted data for mafic rocks in two conventional bivariate discrimination diagrams and, although clearly a within plate setting was indicated, these authors refrained from commenting on their results. How could these results for mafic magmas be explained by their preferred subduction-related model?
(4) Isotopic constraints – On a 87Sr/86Sr – 143Nd/144Nd diagram (Figure 6a), M1 magmas plot in the same field as the primitive rocks from continental rifts and extension-related areas as well as island and continental arcs. Altered basalts and sediments from the subducting Cocos plate (‘Downgoing slab’; Verma 1999) are included in the graph to show that slab composition (basalt-sediment mixing curve) plots considerably to the right of SCN near-primary magmas. These results contradict the conventional subduction-related models such as those proposed by Wallace & Carmichael (1999). In contrast, CAVA magmas (Carr et al. 1990) fall in an area to the right of the ‘mantle array’, closer to the basalt-sediment mixing curve for the Cocos plate. This shift towards the right of the ‘mantle array’ has been reported in many others arcs, as discussed by Verma (2006), such as Izu-Bonin arc (Taylor & Nesbitt 1998), Kamchatka arc (Kepezhinskas 1995), Lesser Antilles arc (Thirwall et al. 1997), South Sandwich island arc (Hawkesworth et al. 1977), Sunda arc (Hoogewerff et al. 1997), and Tonga-Kermadec arc (Gamble et al. 1995). This isotopic shift has also been detected in metabasaltic rocks from the Franciscan subduction complex (Nelson 1995) and altered oceanic basalts (Verma 1992).
The involvement of the ‘Downgoing slab’ in the genesis of the SCN M1 magmas is also not favoured by the amount of sediment necessary to reproduce their isotopic ratios. In fact, SCN near-primary magmas require ~5–20% of sediments to mix with altered slab basalts in order to cover the observed range of 143Nd/144Nd, but 87Sr/86Sr data cannot be explained by such a mixing process (Figure 6a). Further, mixing calculations have indicated that the isotope geochemistry of most arc magmas can be explained by incorporating ≤–3% of sediment component (White & Dupré 1986). Additionally, Righter et al. (2002) pointed out that it is problematic to explain a fluid transport process from the slab beneath the MVB considering the low Re and Cl contents and low 187Os/188Os ratios observed in MVB primary magmas. Finally, it is not possible to reproduce the isotopic ratios observed in SCN near-

45
VELASCO-TAPIA and VERMA / Turkish J Earth Sci
Figure 8. Five discriminant function diagrams, based on linear discriminant analysis (LDA) of loge-transformation of major-element ratios (Verma et al. 2006), for SCN and CAVA basic (bas) magmas with (SiO2)adj < 52%. The percent given next to the tectonic setting name represents the percent success obtained by these authors during the testing stage of these diagrams. (a) Island arc (IAB)–Continental rift (CRB)–Ocean island (OIB)–Mid-Ocean ridge (MORB) diagram; (b) Island arc (IAB)–Continental rift (CRB)–Ocean island (OIB) diagram; (c) Island arc (IAB)–Continental rift (CRB)– Mid-Ocean ridge (MORB) diagram; (d) Island arc (IAB)–Ocean island (OIB)–Mid-Ocean ridge (MORB) diagram; (e) Continental rift (CRB)–Ocean island (OIB)–Mid-Ocean ridge (MORB) diagram. Note that all diagrams indicate a “continental rift” tectonic setting for the SCN magmas. All diagrams also include SCN and CAVA intermediate (int) magmas (52 < (SiO2)adj < 63), showing their differences in DF1 and DF2 parameters. Note that the inclusion of intermediate rocks is simply for highlighting the differences between these two provinces and not for identifying their probable tectonic setting.

46
VELASCO-TAPIA and VERMA / Turkish J Earth Sci
Figure 9. Five discriminant function diagrams, based on linear discriminant analysis (LDA) of loge-transformation of element ratios (Verma & Agrawal 2011), for SCN and CAVA basic (bas) magmas with (SiO2)adj < 52%; where DiscO are CAVA data detected as discordant values by single-outlier detection tests DODESSYS; Verma & Díaz-González 2012). (a) Island arc (IAB)–Continental rift (CRB)+Ocean island (OIB)–Mid-Ocean ridge (MORB) diagram; (b) Island arc (IAB)–Continental rift (CRB)–Ocean island (OIB) diagram; (c) Island arc (IAB)–Continental rift (CRB)–Mid-Ocean ridge (MORB) diagram; (d) Island arc (IAB)–Ocean island (OIB)–Mid-Ocean ridge (MORB) diagram; and (e) Continental rift (CRB)–Ocean island (OIB)–Mid-Ocean ridge (MORB) diagram. All diagrams also include SCN and CAVA intermediate (int) magmas (52% < (SiO2)adj < 63%), showing their differences in DF1 and DF2 parameters. Note that the inclusion of intermediate rocks is simply for highlighting the differences between these two provinces and not for identifying their probable tectonic setting.

47
VELASCO-TAPIA and VERMA / Turkish J Earth Sci
primary magmas by considering a direct (slab melting) or indirect (fluid transport to the mantle) participation of the subducted Cocos plate.
(5) Spinel inclusions in olivine – Unlike Mg and Fe+2 in spinel trapped in olivine, magmatic abundances of trivalent (Al, Cr) and tetravalent (Ti) cations undergo very little, if any, change during post-entrapment re-equilibration because of their low diffusivity in olivine. For this reason, these cations have been used to discriminate between spinels that crystallised from different magmas in different geodynamic settings (Kamenetsky et al. 2001).
SCN chromian spinel inclusions in olivine phenocrysts have lower Cr/(Cr + Al) ratios (0.49±0.05; n=25; Figure 10a) compared to arc volcanic rocks, including boninites (>0.6), but similar or slightly lower than OIB (0.5–0.65; Dick & Bullen 1984; Kamenetsky et al. 2001). Also, SCN spinel inclusions display, in general, greater TiO2 contents that those observed in subduction-related magmas (Figure 10b), reflecting a non-depleted source in HFSE.
(6) Partial melting (PM) model of lithospheric mantle – The failure of the slab-involvement model, as documented from geochemical, mineralogical, and isotopic constraints, suggests that the SCN near-primary magmas were generated solely in the underlying mantle. Following the criteria of Pearce & Peate (1995), trace-element ratios (Nb/Y ~0.65; Ti [in % m/m]/Yb (mg.g-1) ~0.37; Th/Yb ~0.68; Zr/Yb ~ 80) indicate an enriched mantle source for SCN M1 magmas, compared to N-MORB (Nb/Y ~0.083; Ti [in % m/m]/Yb (mg.g-1) ~0.25; Th/Yb ~0.039; Zr/Yb ~ 24) or even E-MORB (Nb/Y ~0.29; Ti [in % m/m]/Yb (mg.g-1) ~0.25; Th/Yb ~0.25; Zr/Yb ~ 31) compositions (Sun & McDonough 1989).
Trace element concentration data for near-primary M1 magmas were used to develop a partial melting inversion model, in order to establish the ‘average’ geochemical characteristics of heterogeneous lithospheric mantle beneath the SCN. This approach was previously applied in the SCN by Velasco-Tapia & Verma (2001b), although based on a smaller number of samples and elements, as well as in other localities of the MVB (Verma 2004) and in the Los Tuxtlas volcanic field (LTVF, Figure 1, Verma 2006). The selected samples probably show olivine fractionation, as reflected by the variation of Ni content (117–200 mg.g-
1; Appendix A11), although the amount of fractionation may not be too large. About 5–15% removal of olivine could easily model the observed Ni concentration in the M1 magmas from a primary magma in equilibrium with a peridotitic source. However, as a result of mineral/liquid partition coefficients <<1 for a typical upper mantle mineral assemblage (olivine, orthopyroxene, clinopyroxene, and spinel), this process will not produce any significant effect in the abundance of highly incompatible trace-elements or, more importantly, in their ratios (Rollinson 1993). Note
that the inverse model assumes that the peridotitic source is uniform with respect to trace element concentrations (Hofmann & Feigenson 1983). Although this requirement is not easily met, similar radiogenic isotopic ratios of primary magmas would suggest a relative homogeneity of the source region. The SCN M1 magmas display 87Sr/86Sr ratios of 0.70369±0.00027 (n= 10) and 143Nd/144Nd= 0.51286±0.00005 (n= 9). Finally, an additional assumption in the inversion model is that melting occurs in an invariant condition, which in theory will give constant primary melt major element composition. The average SiO2 (anhydrous 100% adjusted) concentration of the selected samples is 51.2±0.9 (n= 38). This relatively small variation in major
Figure 10. Compositional relationships in spinel inclusions in olivine (Fo85.9±2.5) from SCN mafic magmas. (a) Cr/(Cr + Al) and Mg/(Mg + Fe+2) ratios (in mol). For comparison, the diagram also includes spinel data from different geodynamic settings (Arc, Ocean Island, and Mid-Ocean ridge; Dick & Bullen 1984; Kamenetsky et al. 2001). (b) Al2O3 and TiO2 (in %m/m). Discrimination between Mid-Ocean ridge (MORB), Arc, Ocean Island (OIB), and Large igneous province (LIP) tectonic settings (Kamenetsky et al. 2001).

48
VELASCO-TAPIA and VERMA / Turkish J Earth Sci
elements is to be expected in natural systems with a minimal effect on trace element compositions in the set of cogenetic magmas (Ormerod et al. 1991).
The inverse modelling method applied to the SCN primary magmas is the same as that proposed by Hofmann & Feigenson (1983). Relevant equations can be consulted in this paper as well as in Velasco-Tapia & Verma (2001b). La was used as the most incompatible element, because it shows, in general, lower bulk mineral/melt partition coefficients for olivine + orthopyroxene + clinopyroxene + spinel assemblage than other REE, LILE and HFSE (e.g., Rollinson 1993; Green 1994). The results of linear regression element-element (CLa – Ci)E and element-element ratio (CLa – CLa/Ci)E equations (where superscript
i refers to a trace element other than La, and subscript E refers to normalisation against silicate earth-concentration values used, were those estimated by McDonough & Sun 1995) for the SCN near-primary magmas are presented in Appendix A14 and Figure 11. For REE with statistically valid correlations (CLa – Ci)E at 95% confidence level and n ≥ 15, the incompatibility in (CLa – CLa/Ci)E diagram decreases in the sequence from Ce (LREE) to Lu (HREE). For other trace-elements (n ³ 12), the incompatibility sequence is U > P ~ Ba > Ta ~ K > Rb > Th ~ Nb ~ Zr > Hf > Y.
For comparison, (CLa – Ci)E and (CLa – CLa/Ci)E linear regressions (Appendix A15 and Figure 11) were prepared for near-primary magmas from the Central America Volcanic Arc database (downloaded from M.J. Carr’s website: http://www.rutgers.edu/~carr, June 2004); CAVA petrogenesis has been clearly related to subduction of the
Figure 11. Inverse modelling (CLa/Ci)E – (CLa)E diagrams for SCN near primary magmas following the methodology proposed by Hofmann & Feigenson (1983). Subscript E refers to normalization with respect to silicate earth: concentration values used were those estimated by McDonough & Sun (1995). (a) Rare-earth elements (Ce to Lu) and (b) Large-ion lithophile elements (LILE): K, Rb, Ba, and Sr; High-field strength elements (HFSE): P, Nb, Th, Zr, Hf, Ti, and Y.
Figure 12. Diagrams of mi – Ii (slope – intercept) for near primary magmas from (a) SCN and (b) CAVA (database downloaded from M.J. Carr’s website: http://www.rutgers.edu/~carr, June 2004). The size for each rectangle (dashed lines) represents one standard error on the regression parameters, derived from the (CLa/Ci)E – (CLa)E diagrams (Figure 12 for SCN; CAVA diagram are not shown).

49
VELASCO-TAPIA and VERMA / Turkish J Earth Sci
Cocos plate (Figure 1; Verma 2002 and references therein). REE incompatibility behaviour is similar to that observed in the SCN diagram, whereas the other trace elements show the incompatibility sequence P > K ~ Th > Nb > U ~ Zr > Ba > Sr > Hf ~ Pb > Y.
Intercept – slope (Ii – mi) diagrams (Figure 12) were also prepared from SCN and CAVA (CLa – CLa/Ci)E linear regression models, in which:
Ii = (C0La / C0
i) (1 – Pi) and mi (D0i / C0
i)where C0
i refers to the concentration of element i in the mantle source, D0
i the bulk distribution coefficient for source prior to melting, and Pi the bulk partition coefficient corresponding to the melting phases.
The slope values obtained from SCN linear regression models (Figure 12a) increase very slowly from Ce (0.0044) to Lu (0.053). For LREE (Ce and Nd), D0
i ~0 and (1 –Pi) ~1. The increase in the intercept value from LREE to HREE can be interpreted as a decrease in C0
i, as a result of moderate compatibility in clinopyroxene (Dcpx= 0.5 –0.6; Rollinson 1993). The large difference in ICe and IYb (ratio ~4; Appendix A14) implies an enriched source in LREE, with a mantle normalised ratio (La/Yb)N > 1. However, positive intercepts of Tb to Lu are inconsistent with the presence of mineral phases with D0
i > 1 for HREE, such as garnet in the source. On the other hand, LILE and HFSE display low slope values (mi < 0.03), except for Y (mi= 0.104). Note that HFSE elements (Y, Ta, Hf, Th, and Zr) are not as depleted as LREE and LILE, because they show low slope values (mi= 0.009–0.030) combined with intercepts (Ii= 0.81–1.09) comparable to Ce (Nb showing lower intercept value). This behaviour contrasts with that observed in subduction-related magmas, because the latter are generally characterised by low concentrations of HFSE (Tatsumi & Eggins 1993), as also confirmed from the inverse modelling of CAVA data (see below).
Slope values of REE in the CAVA near-primary magmas increase very rapidly from Ce to Yb, reaching mi= 0.12, whereas intercepts show a slight variation from Ce to Dy (Ii= 0.75–0.90) and increase their values in HFSE (Figure 12b). An IYb/ICe ~1.4 is indicative of a peridotitic source enriched in LREE but less than the mantle source of the SCN magmas. The remaining trace elements display low slope values (mi= 0–0.04). However, LILE (K, Ba, and Sr) show lower intercept values (Ii= 0.1–0.2) than HFSE (Nb, Zr, Hf, and Th; Ii= 1.0–1.5). This decoupling is a typical characteristic of subduction-related magmas, reflecting depletion of HFSE in the mantle source compared to LILE (Ormerod et al. 1991).6.2. Origin of high-Mg intermediate magmasThe origin of HMI magmas has been generally attributed to an arc setting derived from partial melting of the subducted oceanic plate (e.g., Yogodzinski et al. 1994; Kelemen 1995). According to Castillo (2006), such
magmas display high SiO2 ≥ 56 %, Al2O3 ≥ 15%, Sr > 300 ppm, Sr/Y > 20, and La/Yb > 20, with no Eu anomaly in REE chondrite-normalized patterns and low Y < 15 ppm, Yb < 1.9 ppm, and 87Sr/86Sr < 0.704. HMI magmas in the central MVB have been interpreted as arc-related adakites (e.g., Martínez-Serrano et al. 2004; Gómez-Tuena et al. 2007b). However, these ‘adakite’ samples do not plot on or even close to the subducting Cocos plate (‘Downgoing slab’) in the Sr-Nd isotopic diagram (Figure 6a; data not plotted).
HMI magmas have been also observed in zones where the volcanic activity is produced in an extensional tectonic setting (e.g., Kirin Province, northeast China; Hsu et al. 2000; Nighzhen, east China, Xu et al. 2002). Therefore, the presence of such magmas alone cannot be used to unequivocally infer the tectonic setting. HMI magmas from the SCN do not have isotopic ratios similar to the Cocos plate (Figure 6a). However, these rocks have Sr and Nd isotopic ratios similar to the M magmas. Mafic magmas may interact with mantle peridotite (Fisk 1986) or lower continental crust (Kelemen 1995) rich in residual olivine and probably, to a lesser extent, other common minerals fractionated from earlier batches of mafic magmas. This interaction is likely to move their compositions towards higher MgO and Ni contents (Fisk 1986), and the resulting magmas are likely to become basaltic andesite (Kelemen 1995). The Sr and Nd isotopic composition of these high-Mg intermediate magmas (Figure 6a) supports this mechanism for their genesis.6.3. Origin of the evolved magmasE1 and E2 evolved magmas are petrologically important as they represent ~65% of the present SCN database. A consistent model should explain their relevant geochemical features as compared to the mafic magmas (Verma 1999) including: (a) generally lower REE concentrations; (b) similar Pb isotopic ratios but slightly higher 87Sr/86Sr and somewhat lower 143Nd/144Nd; and (c) lower Nb concentrations and higher Ba/Nb ratios. A consistent model would also explain why the mineral compositions of olivine, spinel, and plagioclase of the SCN mafic and evolved magmas do not show statistically significant differences. Two viable mechanisms for explaining the genesis of the SCN evolved magmas were also suggested; these are: (a) the partial melting (~50%) of a heterogeneous mafic granulite source in the lower crust, and (b) a magma mixing process between the most evolved andesitic and dacitic magmas generated in the lower crust and the mantle-derived mafic magmas. However, Márquez & De Ignacio (2002) considered, without any quantitative thermal estimates of their own and not taking into account the presence of partial melts in the lower crust (Campos-Enríquez & Sánchez-Zamora 2000), that anatexis is not an appropriate model for genesis of the most evolved

50
VELASCO-TAPIA and VERMA / Turkish J Earth Sci
magmas, as a high degree of partial melting (~50%) would be required and discrepancies exist between the predicted and measured LILE concentrations. As an alternative, these authors proposed the possibility that some evolved magmas were the result of partial melting of underplated mantle-derived magmas in the mantle-crust boundary under low water fugacity. This could well be a viable model but is not significantly different from that proposed by Verma (1999). The combined Sr-Nd isotope data from the Mexican lower crust and crustal xenoliths from the Popocatépetl stratovolcano (Figure 6b) are in general consistent with a significant crustal involvment in the genesis of SCN evolved magmas.
As Verma (1999) and Márquez & De Ignacio (2002) used a limited geochemical and isotopic database in hypothesis evaluation, the origin of SCN evolved magmas is still problematic. In the present study, several hypotheses were tested to explain their genesis.
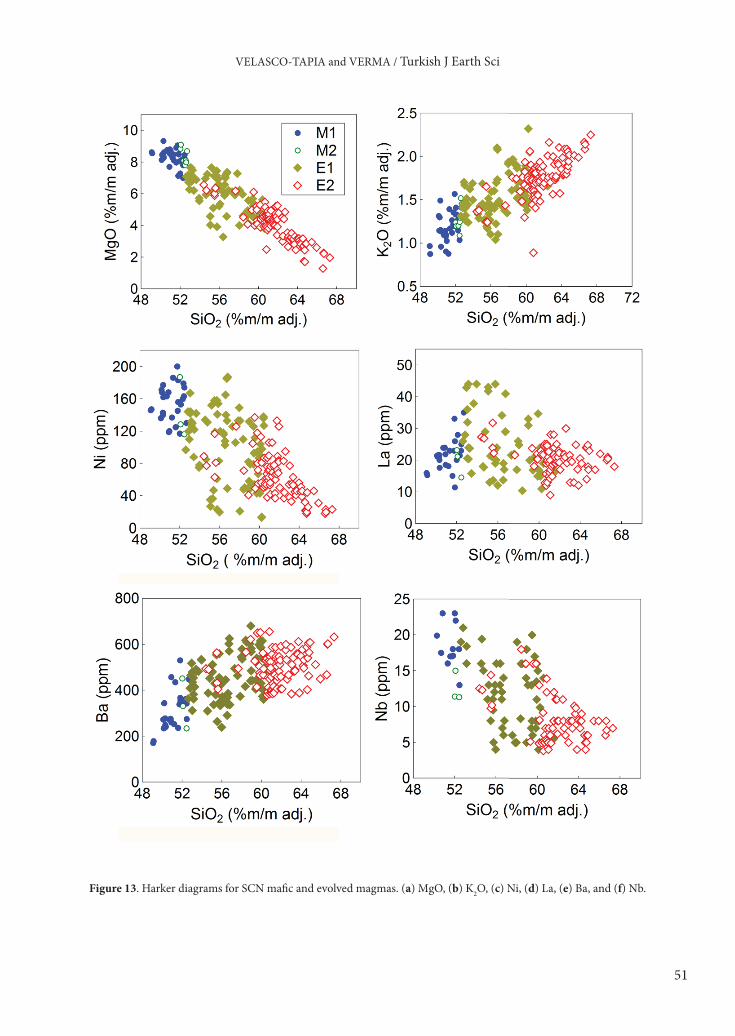
(7) Fractional crystallisation (FC) model – In Figure 13 Harker diagrams of major- and trace-elements for the SCN evolved magmas and M magmas are presented. As expected, MgO and compatible element (e.g., Ni) contents diminish, up to four times, with the increment of %SiO2 in the SCN evolved magmas (linear correlation coefficient r of –0.901 and –0.713 for MgO (n= 289) and Ni (n= 259), respectively; statistically significant at 99% confidence level; Bevington & Robinson 2003). Also, LILE composition (e.g., K2O and Ba) is increased two or three times, as expected, for the most felsic rocks (r of 0.716 and 0.265 for K2O (n= 289) and Ba (n= 268), respectively). Initially, these observations could be explained as a result of fractional crystallisation. During progressive magma crystallisation, compatible elements are concentrated in the solids and incompatible elements are continuously enriched in the residual liquid. However, REE (e.g., La) concentrations do not increase with SiO2 (Figure 13; r of –0.237, n= 207), although these elements are, in general, incompatible with respect to the mineral assemblage observed in the evolved rocks. In fact, SCN dacites have lower concentrations than mafic magmas (Appendix A11; Figure 14). A similar situation is true for HFSE (e.g., Nb, r= –0.433, n= 204; Figure 13; for other elements Appendix A11 and Figure 14), which precludes simple fractional crystallisation as a viable process for generating evolved magmas in the SCN. Additionally, small but significant differences in 87Sr/86Sr and, to a lesser extent, in 143Nd/144Nd (Figure 6) rule out a simple fractional crystallisation of mafic magmas to generate the SCN evolved magmas. Although Schaaf et al. (2005) proposed (polybaric) fractional crystallisation as the dominant process for the genesis of magmas from Popocatépetl and the SCN and Valle de Puebla areas, they failed to explain their REE data from this simple process. Verma (1999) had already commented on this problem for
the SCN magmas. Additionally, their isotopic data will also rule out their proposed polybaric fractional crystallisation process as the main mechanism.
Nevertheless, we calculated detailed FC models using the average composition of basalt (B in Appendix A11) as the starting composition and common as well as accessory minerals (Figure 14). Note that the basaltic and basaltic andesite mafic magmas show higher REE concentrations than the evolved andesitic and dacitic magmas (compare B and BA with A and D in Figure 14a). The FC models, irrespective of whether common or accessory minerals are involved, show just the opposite, i.e., the liquids remaining after the removal of minerals would contain higher REE concentrations than the original basaltic magma (compare B with all L-FC patterns in Figure 14b). The multi-element plot for the SCN magmas (Figure 14c) shows that the evolved magmas have higher LILE (e.g., Rb and Ba) and Th and lower HFSE (e.g., Ta, Nb, P2O5, Zr, TiO2, and Y) and REE (e.g., Sm and Yb). The FC modelling (Figure 14d), on the other hand, shows that most elements would increase in concentrations and thus the depletions of most HFSE, such as Nb, P, Ti and Y, cannot be easily modelled.
(8) Assimilation-fractional crystallisation (AFC) model – Mantle-derived mafic magmas can underplate or stall within the lower and/or upper continental crust, cool, fractionally crystallise, and provide latent heat to cause assimilation of country rock. Consequently, the AFC process in the SCN has been tested using major elements, REE, LILE, HFSE and 87Sr/86Sr ratios, applying the equations proposed by DePaolo (1981). M1 average compositional data (B in Appendix A11) were used as initial magma concentrations. To evaluate petrogenetic processes in the SCN, compositions of mafic meta-igneous xenoliths from the San Luis Potosí area (Schaaf et al. 1994) had to be used by Verma (1999) as assimilant, but now new compositional data for crustal xenoliths from the nearby Popocatépetl stratovolcano (Figure 1) are available (Schaaf et al. 2005), which can be used to test the AFC process.
The bulk partition coefficients were calculated for several different mineralogies from mineral-liquid partition coefficients compiled by Torres-Alvarado et al. (2003) and Rollinson (1993) and used for AFC modelling different assimilants and assimilant/FC ratios r from 0.1 to 0.5. We report only the results of one such calculation (Figure 15). Although for a realistic AFC model, we should use a weighted estimate of mean values, we decided to illustrate this process by using the assimilant with the most extreme concentration values, that would cause the maximum effect in each case. These assimilants were as follows: A-ms (metasandstone) for Figure 15a and A-sk (skarn) for Figure 15b. In spite of this choice, in the bivariate Y-Ba/Nb diagram the liquids resulting from the AFC process move away from the trend of the SCN
51
VELASCO-TAPIA and VERMA / Turkish J Earth Sci
Figure 13. Harker diagrams for SCN mafic and evolved magmas. (a) MgO, (b) K2O, (c) Ni, (d) La, (e) Ba, and (f) Nb.

52
VELASCO-TAPIA and VERMA / Turkish J Earth Sci
magmas (AFC curve with the fraction of remaining liquid F from 0.9 to 0.5 in Figure 15a), whereas in the chondrite-normalised diagram, all liquids remaining after AFC (corresponding to F from 0.9 to 0.7; Figure 15b) plot above the average basalt compositions away from the evolved SCN magmas, all of which plot below this mafic rock sample (see REE patterns for the andesite and dacitic rocks [A and D] in Figure 14a). Therefore, the AFC process does not seem to be appropriate to model the evolution of the SCN magmas.
(9) Continental crust partial melting – Information on the continental crustal structure along MVB has been provided essentially by gravimetric, seismic and magneto-telluric studies (e.g., Valdés et al. 1986; Molina-Garza & Urrutia-Fucugauchi 1993; Campos-Enríquez & Sánchez-Zamora 2000; Jording et al. 2000). Geophysical data analysis has revealed that the thickest continental crust is present around the Toluca and Mexico valleys (~47 km; ~14 kbars; 700–800°C for the lower crust), near the SCN volcanic field. Ortega-Gutiérrez et al. (2008) suggested
Figure 14. Chondrite-normalised REE and N-MORB-normalised multi-element diagrams for SCN average magma compositions and the FC models. The normalising values are as in Figures 4 and 5. For average compositions see Appendix A11. The partition coefficients were taken from the compilation by Torres-Alvarado et al. (2003) and Rollinson (1993). Although only equilibrium fractional crystallization curves are shown, the Rayleigh fractionation curves were also computed and observed to be very similar to those shown. The symbols are explained in the insets. (a) REE (B–basalt; BA– basaltic andesite; A– andesite; D– dacite; (M)– mafic; (E1)– evolved type 1; (HMI)– high-Mg intermediate; (E2)– evolved type 2; (Disq)– disequilibrium), (b) REE (the curves shown are for the equilibrium crystallization of 20% minerals from the original magma assumed to be B (M) type; the common minerals are ol– olivine, plg– plagioclase, opx– orthopyroxene, and cpx– clinopyroxene, whereas the accessory minerals modelled are mgn– magnetite, ilm– ilmenite, qz– quartz, amp– amphibole, and biot– biotite, an additional plausible FC model includes 50% crystallisation of olivine, plagioclase, orthopyroxene, clinopyroxene, and magnetite in the proportion of 0.30, 0.30, 0.20, 0.15, and 0.05), (c) multi-element plot for SCN (more information in a), and (d) multi-element plot for FC models (more information in b).

53
VELASCO-TAPIA and VERMA / Turkish J Earth Sci
that, under these physical conditions, garnet granulites of gabbroic composition and Mg# <60 should compose most of the lower crust underlying the central MVB.
From a seismic model, Fix (1975) interpreted a zone with ~20% partial melting below central Mexico in the crust-mantle interface. Ortega-Gutierrez et al. (2008) proposed that Mexican lower crust, even if wet, cannot
melt at 700°C to produce andesitic magmas, but it certainly would do so for temperatures above 1000°C as modelled using temperature-stress dependent mantle rheologies. A periodic basaltic intrusion over a sustained but geologically short period could be a plausible mechanism to reach temperature above 1000°C at the crust-mantle interface in continental arc and other tectonic settings. Underplating of basaltic magma at the Moho and intrusion of basalt into the lower crust have been advocated for supplying heat for crustal anatexis (e.g., Bergantz 1989; Petford & Gallagher 2001). These mechanisms would result in heat transfer from the mantle to the lower crust, thus promoting melting. According to numerical simulations by Gallagher & Petford (2001), emplacing new basalt intrusions on top of earlier ones maximizes the amount of melt generated in the overlying protolith, and reduces greatly the heat loss through the base of the pile. The degree of partial melting is governed by the initial intrusion temperature and the periodicity, and yields a maximum predicted average melt fraction of 0.38. Dufek & Bergantz (2005) have modelled this process in 2-D for 30 to 50 km crusts in an arc environment. They pointed out that dacitic and rhyodacitic magmas can be generated in the crust although such magmas may not easily erupt at the surface. However, the eruption of such crustal melts may be facilitated in an extensional environment such as that inferred in the SCN (Márquez et al. 1999b).
The origin of some SCN felsic magmas has been interpreted as a product of partial melting of continental crust (Verma 1999). Because Mexican crust (e.g., Patchett & Ruiz 1987; Ruiz et al. 1998a, b; Roberts & Ruiz 1989; Heinrich & Besch 1992; Schaaf et al. 1994, 2005; Aguirre-Díaz et al. 2002) is highly heterogeneous both chemically
Figure 15. Evaluation of assimilation-fractional crystallisation (AFC) process for SCN magmas. AFC conditions: (1) Initial magma compositions: MB− average composition of basalt (Appendix A11); (2) Assimilant/fractionated ratio (r) of 0.5 for fractions of liquid remaining (F) between 0.9 and 0.5; (3) FC mineral assemblages (solid line): 0.25 olivine + 0.40 plagioclase + 0.25 clinopyroxene + 0.10 magnetite; (4) Assimilant: Crustal xenolith (A-ms; meta-sandstone) from Popocatépetl (Schaaf et al. 2005) used for (a) and crustal xenolith (A-sk; skarn) for (b). Other crustal xenoliths are also shown in these plots. (a) Ba/Nb–Y plot, PM paths refer to partial melting of different xenoliths, whereas the FC path gives the possible trajectory of fractional crystallization of MB mafic magma; and (b) Chondrite-normalised plot, for symbols of crustal xenoliths see (a).
Figure 16. Nb-Ba/Nb bivariate diagram for SCN rocks. The symbols used are explained as an inset. A plausible mixing curve for M-E2 magmas is included for reference to explain the origin of disequilibrium magmas.

54
VELASCO-TAPIA and VERMA / Turkish J Earth Sci
and isotopically, as is the crust elsewhere (Taylor & McLennan 1985; Rudnick et al. 1998), the magmas generated from its partial melting should also be similarly heterogeneous (Figure 6). Migration of SCN M and HMI melts upwards would result in crustal heating above the initial melting regions, and ultimately lead to assimilation and melting at shallower crustal levels. These petrological processes might be restricted to the middle crust (average worldwide composition: SiO2= 60.6%, Al2O3= 15.5%, MgO= 3.4%, Rudnick & Gao 2003; depth in MVB= 10–25 km, Ortega-Gutiérrez et al. 2008), because SCN evolved magmas display little or no negative Eu anomaly in chondrite-normalized REE patterns. Evidence of entrapment of melt inclusions has been reported from upper to middle crust in central Mexico (1-6 kbar or less; Cervantes & Wallace 2003).
As revealed by xenoliths in volcanic rocks from the central part of the MVB, the crust is highly heterogeneous, because it consists of orthoquarzite sandstone, metasandstone, metasiltstone, xenocrystic quartz, calc-silicate skarn, foliated fine-grained granodiorite, coarse-grained pyroxene diorite to gabbro, fine-grained hornblende-biotite granodiorite, and marble (Márquez et al. 1999b; Siebe et al. 2004; Schaaf et al. 2005; Ortega-Gutiérrez et al. 2008). Partial melting of crustal xenoliths (gd in Figure 15a) can generate intermediate andesitic and dacitic SCN magmas (see PM paths in Figure 15a). The REE (Figure 15b) and Sr-Nd isotopic data (Figure 6a, b) of these xenoliths are also fully consistent with this partial melting model, because such melts are likely to have REE patterns below the B curve, i.e., similar to the evolved magmas (Figure 14a) and isotopic compositions similar to the SCN evolved magmas.6.4. Origin of the disequilibrium magmasDISQ magmas amounting to only ~7% represent incomplete mixing of at least two different types of magmas. Similar rock types with disequilibrium textures have also been observed in the nearby Iztaccíhuatl and Popocatépetl stratovolcanoes (Nixon 1988a, b; Straub & Martin del Pozzo 2001; Schaaf et al. 2005). Magma mixing is evaluated from one bivariate diagram (Figure 16). Mafic magmas show higher Nb concentrations than most other evolved magma varieties. Because Nb is an incompatible element in most common rock-forming minerals (e.g., Rollinson 1993), SCN magmas cannot be related to simple fractional crystallisation processes. Thus, the origin of the SCN evolved rocks with disequilibrium features could be explained as a result of the mixing of olivine-bearing mafic (M) magmas with evolved andesitic and dacitic (E1 and E2) magmas generated by partial melting of the crust.
7. ConclusionsCompilation of 289 samples from the SCN shows that of the basaltic to dacitic magmas erupted, about 15% were
mafic magmas. The 87Sr/86Sr and 143Nd/144Nd of these mafic magmas are 0.7035–0.7043 and 0.51279–0.51294. In comparison, the evolved magmas have Sr and Nd isotopic compositions of 0.7036–0.7048 and 0.51270–0.51230 (slightly higher and lower, respectively). All samples from the SCN plot on the ‘mantle array’ in the Sr-Nd isotope diagram. Spinel inclusions in olivines have compositions different from those in arcs. Some of the evolved magmas show abundant textural evidence of mineralogical disequilibrium, such as coexisting olivine and quartz, quartz with pyroxene reaction rims, and plagioclase with oscillatory or complex zoning. On multi-dimensional log-ratio transformed major-element discriminant function based diagrams, most (93–100%) mafic rock samples plot in the continental rift setting. Similar multi-dimensional immobile element based diagrams support this conclusion. Inverse modelling of trace-element data for the SCN mafic magmas shows a source enriched in LILE, HFSE and LREE and absence of residual garnet. This modelling also shows the following incompatibility sequence for the SCN: U > P ~ Ba > Ta ~ K > Rb > Th ~ Nb ~ Zr > Hf > Y. In comparison, the incompatibility sequence for the CAVA was as follows: P > K ~ Th > Nb > U ~ Zr > Ba > Sr > Hf ~ Pb > Y. Evolved magmas from the SCN show a more complex history, although the involvement of the continental crust, particularly the lower crust, might be considered significant. Our preferred petrogenetic model for the SCN can be summarised as follows: (1) mantle-derived basic (basaltic) magmas intruded the base of the continental crust; (2) their periodic injection resulted in a significant increase in crustal temperatures to cause partial melting of the crust which produced evolved andesitic and dacitic magmas and their eruption was facilitated by an extensional regime beneath the SCN; and (3) fractional crystallisation of basic magmas and their incomplete mixing with the evolved magmas gave rise to disequilibrium magmas.
AcknowledgementsWe are grateful to Gabriela Solís Pichardo and Juan Julio Morales Contreras (LUGIS, UNAM); Mirna Guevara (CIE, UNAM); and Rufino Lozano and Patricia Girón (IG, UNAM) for help with chemical and isotopic analyses, to Francisco Anguita, Álvaro Márquez and José González de Tánago (Facultad de Ciencias Geológicas, Universidad Complutense de Madrid) for making the microprobe determinations possible, and to Alfredo Quiroz Ruiz for maintaining our computers and helping us with the preparation of final electronic format of the Figures. Thanks are also due to Programa de Intercambio de Personal Académico UNAM-UANL. We are also grateful to three anonymous reviewers for critical reviews as well as the Editor-in-Chief Erdin Bozkurt for allowing us to improve our presentation.

55
VELASCO-TAPIA and VERMA / Turkish J Earth Sci
References
Agostini, S., Corti, G., Doglioni, C., Carminati, E., Innocenti, F., Tonarini, S., Manetti, P., Di Vincenzo, G. & Montanari, D. 2006. Tectonic and magmatic evolution of the active volcanic front in El Salvador: insight into the Berlín and Ahuachapán geothermal areas. Geothermics 35, 368–408.
Agrawal, S. 1999. Geochemical discrimination diagrams: a simple way of replacing eye-fitted boundaries with probability based classifier surfaces. Journal of the Geological Society of India 54, 335–346.
Agrawal, S., Guevara, M. & Verma, S.P. 2008. Tectonic discrimination of basic and ultrabasic rocks through log-transformed ratios of immobile trace elements. International Geology Review 50, 1057–1079.
Aguirre-Díaz, G.J., Dubois, M., Laureyns, J. & Schaaf, P. 2002. Nature and P-T conditions of the crust beneath the central Mexican Volcanic Belt based on Precambrian crustal xenolith. International Geology Review 44, 222–242.
Aitchison, J. 1986. The Statistical Analysis of Compositional Data. Chapman and Hall, London.
Alaniz-Alvarez, S.A., Nieto-Samaniego, A.F. & Ferrari, L. 1998. Effect of strain rate in the distribution of monogenetic and polygenetic volcanism in the Transmexican Volcanic Belt. Geology 26, 591–594.
Alvarado, G.E., Soto, G.J., Schmincke, H.-U., Bolge, L.L. & Sumita, M. 2006. The 1968 andesitic lateral blast eruption at Arenal volcano, Costa Rica. Journal of Volcanology and Geothermal Research 157, 9–33.
Bardintzeff, J.M. & Deniel, C. 1992. Magmatic evolution of Pacaya and Cerro Chiquito volcanological complex, Guatemala. Bulletin of Volcanology 54, 267–283.
Barnett, V. & Lewis, T. 1994. Outliers in Statistical Data. John Wiley & Sons, Chichester.
Bevington, P.R. & Robinson, D.K. 2003. Data Reduction and Error Analysis for the Physical Sciences. Mc-Graw Hill, Boston.
Bergantz, G.W. 1989. Underplating and partial melting: implications for melt generation and extraction. Science 245, 1093–1095.
Blatter, D.L., Farmer, G.L. & Carmichael, I.S.E. 2007. A north-south transect across the Central Mexican Volcanic Belt at ~100°W: spatial distribution, petrological, geochemical and isotopic characteristics of Quaternary volcanism. Journal of Petrology 48, 901–950.
Bloomfield, K. 1975. A late-Quaternary monogenetic volcano field in central Mexico. Geologische Rundschau 64, 476–497.
Bolge, L.L., Carr, M.J., Feigenson, M.D. & Alvarado, G.E. 2006. Geochemical stratigraphy and magmatic evolution at Arenal volcano, Costa Rica. Journal of Volcanology and Geothermal Research 157, 34–48.
Cabanis, B. & Lecolle, M. 1989. Le diagramme La/10-Y/15-Nb/8: un outil pour la discrimination des séries volcaniques et la mise en évidence des processus de mélange et/ou de contamination crustale. Comptes Rendus Academie de Sciences Paris Serie II 309, 2023–2029.
Cameron, B.I., Walker, J.A., Carr, M.J., Patino, L.C., Matías, O. & Feigenson, M.D. 2002. Flux versus decompression melting at stratovolcanoes in southeastern Guatemala. Journal of Volcanology and Geothermal Research 119, 21–50.
Campos-Enríquez, J.O. & Sánchez-Zamora, O. 2000. Crustal structure across southern Mexico inferred from gravity data. Journal of South American Earth Sciences 13, 479–489.
Carr, M.J. 1984. Symmetrical and segmented variation of physical and geochemical characteristics of the Central American volcanic front. Journal of Volcanology and Geothermal Research 20, 231–252.
Carr, M.J., Feigenson, M.D. & Bennett, E.A. 1990. Incompatible element and isotopic evidence for tectonic control of source mixing and melt extraction along the Central America arc. Contributions to Mineralogy and Petrology 105, 369–380.
Castillo, P. 2006. An overview of adakite petrogenesis. Chinese Science Bulletin 51, 257–268.
Cervantes, P. & Wallace, P.J. 2003. Role of H2O in subduction-zone magmatism: New insights from melt inclusions in high-Mg basalts from central Mexico. Geology 31, 235–238.
Córdova, C., Martin del Pozzo, A.L. & López, C.J. 1994. Paleolandforms and volcanic impact on the environment of Prehistoric Cuicuilco, southern Mexico City. Journal of Archeology Science 21, 585–596.
De Cserna, Z., Fries, C., Rincón-Orta, C., Silver, T.L., Westley, H., Solorio-Munguía, J. & Schmitter-Villada, E. 1974. Datos geocronométricos terciarios de los Estados de México, Morelos y Guerrero. Boletín de la Asociación Mexicana de Geólogos Petroleros 26, 263–273.
Deer, W.A., Howie, A.R. & Zusmann, J. 1997. Rock Forming Minerals. Longman, London.
Delgado, H., Molinero, R., Cervantes, P., Nieto-Obregón, J., Lozano-Santa Cruz, R., Macías-González, H.L., Mendoza-Rosales, C. & Silva Romo, G. 1998. Geology of Xitle volcano in southern Mexico City, a 2000-year old monogenetic volcano in an urban area. Revista Mexicana de Ciencias Geológicas 15, 115–131.
Delgado-Granados, H. & Martín del Pozo, A.L. 1993. Pliocene to Holocene volcanic geology at the junction of Las Cruces, Chichinautzin and Ajusco ranges, southwest of Mexico City. Geofísica Internacional 32, 511–522.
DePaolo, D.J. 1981. Trace element and isotopic effects of combined wallrock assimilation and fractional crystallisation. Earth and Planetary Science Letters 53, 189–202.
Dick, H.J.B. & Bullen, T. 1984. Chromian spinel as a petrogenetic indicator in abyssal and alpine-type peridotites and spatially associated lavas. Contributions of Mineralogy and Petrology 86, 54–76.
Doglioni, C., Carminati, E., Cuffaro, M. & Scrocca, D. 2007. Subduction kinematics and dynamic constraints. Earth-Science Reviews 83, 125–175.

56
VELASCO-TAPIA and VERMA / Turkish J Earth Sci
Droop, G.T.R. 1987. A general equation for estimating Fe+3 concentrations in ferromagnesian silicates and oxides from microprobe analyses, using stoichiometric criteria. Mineralogical Magazine 51, 431–435.
Dufek, J. & Bergantz, GVW. 2005. Lower crustal magma genesis and preservation: a stochastic framework for the evaluation of basalt-crust interaction. Journal of Petrology 46, 2167–2195.
Ego, F. & Ansan, V. 2002. Why is the Central Trans-Mexican Volcanic Belt (102°–99°W) in transtensive deformation? Tectonophysics 359, 189–208.
Faure, G. 1986. Principles of Isotope Geology. Wiley, New York.
Ferrari, L. 2004. Slab detachment control on mafic volcanic pulse and mantle heterogeneity in central Mexico. Geology 32, 77–80.
Ferrari, L., Petrone, C.M. & Francalanci, L. 2001. Generation of oceanic-island basalt-type volcanism in the western Trans-Mexican volcanic belt by slab rollback, asthenosphere infiltration, and variable flux melting. Geology 29, 507–510.
Fisk, M.R. 1986. Basalt magma interaction with harzburgite and the formation of high-magnesium andesites. Geophysical Research Letters 13, 467–470.
Fix, J.E. 1975. The crust and the upper mantle of central Mexico. Geophysical Journal of the Royal Astronomical Society 43, 453–499.
Fries, C. 1960. Geología de Estado de Morelos y partes adyacentes de México y Guerrero, región central meridional de México. Boletín del Instituto de Geología, UNAM 60, 1–236.
Gallagher, K. & Petford, N. 2001. Partial melting of mafic (amphibolitic) lower crust by periodic influx of basaltic magma. Earth and Planetary Science Letters 193, 483–499.
Gamble, J.A., Wright, I.C., Woodhead, J.D. & McCulloch, M.T. 1995. Arc and back-arc geochemistry in the southern Kermadec arc-Ngatoro basin and offshore Taupo volcanic zone, SW Pacific. In: Smellie, J.L. (ed), Volcanism Associated with Extension at Consuming Plate Margins. Geological Society Special Publication 81, 193–212.
García-Palomo, A., Macías, J.L. & Garduño, V.H. 2000. Miocene to Recent structural evolution of the Nevado de Toluca volcano region, Central Mexico. Tectonophysics 318, 281–302.
García-Palomo, A., Macías, J.L., Arce, J.L., Capra, L., Garduño, V.H. & Espíndola, J.M. 2002. Geology of Nevado de Toluca Volcano and Surrounding Areas, Central Mexico. 1:100 000 Scale Geological Map and Explanatory Text. Geological Society of America Map and Chart Series MCH089, 1–26.
Gomberg, J.S. & Masters, T.G. 1988. Waveform modelling using locked-mode synthetic and differential seismograms: application to determination of the structure of Mexico. Geophysical Journal 94, 193–218.
Gómez-Tuena, A., Langmuir, C.H., Goldstein, S.L., Straub, S.M. & Ortega-Gutiérrez, F. 2007b. Geochemical evidence for slab melting in the Trans-Mexican Volcanic Belt. Journal of Petrology 48, 537–562.
Gómez-Tuena, A., Orozco-Esquivel, T. & Ferrari, L. 2007a. Igneous petrogenesis of the Trans-Mexican Volcanic Belt. In: Alaniz-Álvarez, S.A. & Nieto-Samaniego, A.F. (eds), Geology of Mexico: Celebrating the Centenary of the Geological Society of Mexico. Geological Society of America Special Paper 442, 129–181.
Green, T.H. 1994. Experimental studies of trace-element partitioning applicable to igneous petrogenesis: Sedona 16 years later. Chemical Geology 117, 1–16.
Guevara, M., Verma, S.P., Velasco-Tapia, F., Lozano-Santa Cruz, R. & Girón, P. 2005. Comparison of linear regression models for quantitative geochemical analysis: an example using X-Ray Fluorescence Spectrometry. Geostandards and Geoanalytical Research 29, 271–284.
Haggerty, S.E. 1991. Oxide mineralogy of the upper mantle. In: Lindsley, D.H. (ed), Oxide Minerals: Petrologic and Magnetic Significance. Reviews in Mineralogy 25, 355–416.
Haskin, L.A., Haskin, M.A., Frey, F.A. & Wildeman, T.R. 1968. Relative and absolute terrestrial abundances of the rare earths. In: Ahrens, L.H. (ed), Origin and Distribution of the Elements. Pergamon Press, Oxford, 889 –912.
Hawkesworth, C.J., Hergt, J.M., Ellam, R.M. & McDermott, F. 1991. Element fluxes associated with subduction related magmatism. Royal Society of London Philosophical Transactions 335, 393–405.
Hawkesworth, C.J., O’Nions, R.K., Pankhurst, R.J., Hamilton, P.J. & Evensen, E.M. 1977. A geochemical study of island-arc and back-arc tholeiites from the Scotia Sea. Earth and Planetary Science Letters 36, 153 –162.
Hazlett, R.W. 1987. Geology of San Cristobal volcanic complex, Nicaragua. Journal of Volcanology and Geothermal Research 33, 223 –230.
Heinrich, W. & Besch, T. 1992. Thermal history of the upper mantle beneath a young back-arc extensional zone: ultramafic xenoliths from San Luis Potosí, central Mexico. Contributions to Mineralogy and Petrology 111, 126–142.
Henry, C.D. & Aranda-Gomez, J.J. 1992. The real southern Basin and Range: mid-to late Cenozoic extension in Mexico. Geology 20, 701–704.
Hofmann, A.W. & Feigenson, M.D. 1983. Case studies on the origin of basalt. I. Theory and reassessment of Grenada basalts. Contributions to Mineralogy and Petrology 84, 382–389.
Hoogewerff, J.A., van Bergen, M.J., Vroon, P.Z., Hertogen, J., Wordel, R., Sneyers, A., Nasution, A., Varekamp, J.C., Moens, H.L.E. & Mouchel, D. 1997. U-series, Sr-Nd-Pb isotope and trace-element systematics across an active island arc-continent collision zone: implications for element transfer at the slab-wedge interface. Geochimica et Cosmochimica Acta 61, 1057–1072.
Hsu, C.-N., Chen, J.-C. & Ho, K.-S. 2000. Geochemistry of Cenozoic volcanic rocks from Kirin Province, northeast China. Geochemical Journal 34, 33–58.
Husker, A. & Davis, P.M. 2009. Tomography and thermal state of the Cocos plate subduction beneath Mexico City. Journal of Geophysical Research 114, B04306, doi: 10.1029/2008JB006039.

57
VELASCO-TAPIA and VERMA / Turkish J Earth Sci
Jarosewich, E., Nelen, J.A. & Norberg, J.A. 1980. Reference samples for electron microprobe analysis. Geostandards Newsletter 4, 43–47.
Johnson, C.A. & Harrison, C.G.A. 1990. Neotectonics in central Mexico. Physics of Earth and Planetary Interiors 64, 187–210.
Jording, A., Ferrari, L., Arzate, J. & Jödicke, H. 2000. Crustal variations and terrane boundaries in southern Mexico as imaged by magnetotelluric transfer functions. Tectonophysics 327, 1–13.
Jödicke, H., Jording, A., Ferrari, L., Arzate, J., Mezger, K. & Rüpke, L. 2006. Fluid release from the subducted Cocos plate and partial melting of the crust deduced from magnetotelluric studies in southern Mexico: implications for the generation of volcanism and subduction dynamics. Journal of Geophysical Research 111, B08102, doi: 10.1029/2005JB003739.
Kamenetsky, V.S., Crawford, A.J. & Meffre, S. 2001. Factors controlling chemistry of magmatic spinel: an empirical study of associated olivine, Cr-spinel and melt inclusions from primitive rocks. Journal of Petrology 42, 655–671.
Kay, S.M., Maksaev, V., Moscoso, R., Mpodozis, C. & Nasi, C. 1987. Probing the evolving Andean lithosphere: Mid-late Tertiary magmatism in Chile (29°–30°30’S) over the modern zone of subhorizontal subduction. Journal of Geophysical Research 92, 6173–6189.
Kearey, P., Klepeis, K.A. & Vine, F.J. 2009. Global Tectonics. Wiley-Blackwell, New York.
Keith, M. 2001. Evidence for a plate tectonics debate. Earth-Science Reviews 55, 235–336.
Kelemen, P.B. 1995. Genesis of high Mg# andesites and the continental crust. Contributions to Mineralogy and Petrology 120, 1–19.
Kepezhinskas, P. 1995. Diverse shoshonite magma series in the Kamchatka arc: relationships between intra-arc extension and composition of alkaline magmas. In: Smellie, J.L. (ed), Volcanism Associated with Extension at Consuming Plate Margins. Geological Society Special Publication 81, 249–264.
Le Bas, M.J. 2000. IUGS reclassification of the high-Mg and picritic volcanic rocks. Journal of Petrology 41, 1467–1470.
Le Bas, M.J., LeMaitre, R., Streckeisen, A. & Zanettin, B. 1986. A chemical classification of volcanic rocks based on the total alkali-silica diagram. Journal of Petrology 27, 745–750.
Luhr, J.F. 1997. Extensional tectonics and the diverse primitive volcanic rocks in the western Mexican Volcanic Belt. Canadian Mineralogist 35, 473–500.
Luhr, J.F., Nelson, S.A., Allan, J.F. & Carmichael, I.S.E. 1985. Active rifting in southwestern Mexico: manifestations of an incipient eastward spreading-ridge jump. Geology 13, 54–57.
Luhr, J.F., Allan, J.F., Carmichael, I.S.E., Nelson, S.A. & Hasenaka, T. 1989. Primitive calc-alkaline and alkaline rock types from the western Mexican Volcanic Belt. Journal of Geophysical Research 94, 4515–4530.
Márquez, A. & De Ignacio, C. 2002. Mineralogical and geochemical constraints for the origin and evolution of magmas in Sierra Chichinautzin, Central Mexican Volcanic Belt. Lithos 62, 35–62.
Márquez, A., Oyarzun, R., Doblas, M. & Verma, S.P. 1999a. Alkalic (ocean-island basalt type) and calc-alkalic volcanism in the Mexican Volcanic Belt: a case for plume-related magmatism and propagating rifting at an active margin? Geology 27, 51–54.
Márquez, A., Oyarzun, R., de Ignacio, C. & Doblas, M. 2001. Southward migration of volcanic activity in the central Mexican Volcanic Belt: asymmetric extension within a two-layer crustal stretching model. Journal of Volcanology and Geothermal Research 112, 175–187.
Márquez, A., Verma, S.P., Anguita, F., Oyarzun, R. & Brandle, J.L. 1999b. Tectonics and volcanism of Sierra Chichinautzin: extension at the front of the Central Trans-Mexican Volcanic belt. Journal of Volcanology and Geothermal Research 93, 125–150.
Martín del Pozzo, A.L. 1982. Monogenetic volcanism in Sierra Chichinautzin, Mexico. Bulletin Volcanologique 45, 9–24.
Martínez-Serrano, R.G., Schaaf, P., Solís-Pichardo, G., Hernández-Bernal, M.S., Hernández-Treviño, T., Morales-Contreras, J.J. & Macías, J.L. 2004. Sr, Nd and Pb isotope and geochemical data from the Quaternary Nevado de Toluca volcano, a source of recent adakitic magmatism, and the Tenango Volcanic Field, Mexico. Journal of Volcanology and Geothermal Research 138, 77–110.
Martinod, J., Husson, L., Roperch, P., Guillaume, B. & Espurt, N. 2010. Horizontal subduction zones, convergence velocity and the building of the Andes. Earth and Planetary Science Letters 299, 299–309.
McDonough, W.F. & Sun, S.-S. 1995. The composition of the Earth. Chemical Geology 120, 223–253.
Meriggi, L., Macías, J.L., Tommasini, S., Capra, L. & Conticelli, S. 2008. Heterogeneous magmas of the Quaternary Sierra Chichinautzin volcanic field (central Mexico): the role of an amphibole-bearing mantle and magmatic evolution processes. Revista Mexicana de Ciencias Geológicas 25, 197–216.
Meschede, M. 1986. A method of discriminating between different types of mid-ocean ridge basalts and continental tholeiites with the Nb-Zr-Y diagram. Chemical Geology 56, 207–218.
Middlemost, E.A.K. 1989. Iron oxidation ratios, norms and the classification of volcanic rocks. Chemical Geology 77, 19–26.
Molina-Garza, R. & Urrutia-Fucugauchi, J. 1993. Deep crustal structure of central Mexico derived from interpretation of Bouger gravity anomaly data. Journal of Geodynamics 17, 181–201.
Molnar, P. & Sykes, L.R. 1969. Tectonics of the Caribbean and Middle America regions from focal mechanisms and seismicity. Geological Society of America Bulletin 80, 1639–1684.
Moore, G., Marone, C., Carmichael, I.S.E. & Renne, P. 1994. Basaltic volcanism and extension near the intersection of the Sierra Madre volcanic province and the Mexican Volcanic Belt. Geological Society of America Bulletin 106, 383–394.
Mooser, F., Montiel, A. & Zuñiga, A. 1996. Nuevo mapa geológico de las cuencas de México, Toluca y Puebla. Estratigrafía, tectónica regional y aspectos geotérmicos. Internal Report, Comisión Federal de Electricidad, Mexico City.

58
VELASCO-TAPIA and VERMA / Turkish J Earth Sci
Mora Alvarez, G., Caballero Miranda, C., Urrutia Fucugauchi, J. & Uchiumi, S. 1991. Southward migration of volcanic activity in the Sierra de las Cruces, basin of Mexico? – A preliminary K-Ar dating and paleomagnetic study. Geofísica Internacional 30, 61–70.
Morán-Zenteno, D.J., Alba-Aldave, L.A., Martínez-Serrano, R.G., Reyes-Salas, M.A., Corona-Esquivel, R. & Ángeles-García, S. 1998. Stratigraphy, geochemistry and tectonic significance of the Tertiary volcanic sequence of the Taxco-Tilzapotla region, southern Mexico. Revista Mexicana de Ciencias Geológicas 15, 167–180.
Mori, L., Gómez-Tuena, A., Schaaf, P., Goldstein, S.J., Pérez-Arvizu, O. & Solís-Pichardo, G. 2009. Lithospheric removal as a trigger for flood basalt magmatism in the Trans-Mexican Volcanic Belt. Journal of Petrology 50, 2157–2186.
Nakamura, N. 1974. Determination of REE, Ba, Fe, Mg, Na and K in carbonaceous and ordinary chondrites. Geochimica et Cosmochimica Acta 38, 757–775.
Nelson, B.K. 1995. Fluid flow in subduction zones: evidence from Nd- and Sr-isotope variations in metabasalts of the Franciscan complex, California. Contributions to Mineralogy and Petrology 119, 247–262.
Nixon, G.T. 1988a. Petrology of younger andesites and dacites of Iztaccíhuatl volcano, Mexico: I. Disequilibrium phenocrysts assemblages as indicators of magma chamber processes. Journal of Petrology 29, 213–264.
Nixon, G.T. 1988b. Petrology of younger andesites and dacites of Iztaccíhuatl volcano, Mexico: II. Chemical stratigraphy, magma mixing, and the composition of basaltic magma influx. Journal of Petrology 29, 265–303.
Ormerod, D.S., Rogers, N.W. & Hawkesworth, C.J. 1991. Melting in the lithospheric mantle: inverse modelling of alkali-olivine basalts from the Big Pine Volcanic Field, California. Contributions to Mineralogy and Petrology 108, 305–317.
Ortega-Gutiérrez, F., Elías-Herrera, M. & Dávalos-Elizondo, M.G. 2008. On the nature and role of the lower crust in the volcanic front of the Trans-Mexican Volcanic Belt and its fore-arc region, southern and central Mexico. Revista Mexicana de Ciencias Geológicas 25, 346–364.
Osete, M.L., Ruiz-Martínez, V.C., Caballero, C., Galindo, C., Urrutia-Fucugauchi, J. & Tarling, D.H. 2000. Southward migration of continental volcanic activity in the Sierra de las Cruces, Mexico: paleomagnetic and radiometric evidence. Tectonophysics 318, 201–215.
Pacheco, J.F. & Singh, S.K. 2010. Seismicity and state of stress in Guerrero segment of the Mexican subduction zone. Journal of Geophysical Research 115, doi:10.1029/2009JB006453.
Pardo, M. & Suárez, G. 1995. Shape of the subducted Rivera and Cocos plates in southern Mexico: seismic and tectonic implications. Journal of Geophysical Research 100, 12357–12373.
Patchett, P.J. & Ruiz, J. 1987. Nd isotopic ages of crustal formation and metamorphism in the Precambrian of eastern and southern Mexico. Contributions to Mineralogy and Petrology 96, 523–528.
Pearce, J.A. 1982. Trace element characteristics of lavas from destructive plate boundaries. In: Thorpe, R.S. (ed), Andesites. John Wiley & Sons, Chichester, 525–548.
Pearce, J.A. & Cann, J.R. 1973. Tectonic setting of the basic volcanic rocks determined using trace element analyses. Earth and Planetary Science Letters 19, 290–300.
Pearce, J.A. & Peate, D.W. 1995. Tectonic implications of the composition of volcanic arc magmas. Annual Review of Earth and Planetary Science 23, 251–285.
Pérez-Campos, X., Kim, Y., Husker, A., Davis, P.M., Clayton, R.W., Iglesias, A., Pacheco, J.F., Singh, S.K., Manea, V.C. & Gurnis, M. 2008. Horizontal subduction and truncation of the Cocos plate beneath central Mexico. Geophysical Research Letters 35, L18303.
Petford, N. & Gallagher, K. 2001. Partial melting of mafic (amphibolitic) lower crust by periodic influx of basaltic magma. Earth and Planetary Science Letters 193, 483–499.
Polat, A., Frei, R., Fryer, B. & Appel, P.W.U. 2009. The origin of geochemical trends and Eoarchean (ca. 3700 Ma) zircons in Mesoarchean (ca. 3075 Ma) ocelli-hosting pillow basalts, Ivisaartoq greenstone belt, SW Greenland: evidence for crustal contamination versus crustal recycling. Chemical Geology 268, 248–271.
Rajesh, H.M. 2007. The petrogenetic characterization of intermediate and silicic charnockites in high-grade terrains: a case study from southern India. Contributions to Mineralogy and Petrology 154, 591–606.
Reagan, M.K. & Gill, J.B. 1989. Coexisting calcalkaline and high-niobium basalts from Turrialba volcano, Costa Rica: implications for residual titanites in arc magma sources. Journal of Geophysical Research 94, 4619–4633.
Righter, K., Chelsey, J.T. & Ruiz, J. 2002. Genesis of primitive, arc-type basalt: constraints from Re, Os, and Cl on the depth of melting and role of fluids. Geology 30, 619–622.
Roberts, S.J. & Ruiz, J. 1989. Geochemistry of exposed granulite facies terrains and lower crustal xenoliths in Mexico. Journal of Geophysical Research 94, 7961–7974.
Robin, C. 1982. Mexico. In: Thorpe, R.S. (ed), Andesites. John Wiley, Chichester.
Rodríguez Lara, V.C. 1997. Evolución del conjunto volcánico Guespalapa y del volcán Chichinautzin, Distrito Federal-Morelos, México. BSc Thesis, ESIA-Instituto Politécnico Nacional, México, D.F. [unpublished].
Rollinson, H.R. 1993. Using Geochemical Data: Evaluation, Presentation, Interpretation. Longman Scientific & Technical, Essex, England.
Rudnick, R.L. & Gao, S. 2003. Composition of the Continental Crust. In: Carlson, R.W., Holland, H.D. & Turekian, K.K. (eds), Treatise of Geochemistry. Elsevier, New York 3, 1–64.
Rudnick, R.L., McDonough, W.F. & O’Connell, R.J. 1998. Thermal structure, thickness and composition of continental lithosphere. Chemical Geology 145, 399–415.

59
VELASCO-TAPIA and VERMA / Turkish J Earth Sci
Ruiz, J., Patchett, P.J. & Arculus, R.J. 1988a. Nd-Sr isotope composition of lower crustal xenoliths – evidence for the origin of mid-Tertiary felsic volcanics in Mexico. Contributions to Mineralogy and Petrology 99, 36–43.
Ruiz, J., Patchett, P.J. & Ortega-Gutierrez, F. 1988b. Proterozoic and Phanerozoic basement terranes of Mexico from Nd isotopic studies. Geological Society of America Bulletin 100, 274–281.
Ryder, C.H., Gill, J.B., Tepley III, F., Ramos, F. & Reagan, M. 2006. Closed- to open-system differentiation at Arenal volcano (1968–2003). Journal of Volcanology and Geothermal Research 157, 75–93.
Sánchez-Rubio, G. 1984. Cenozoic Volcanism in the Toluca – Amealco Region, Central Mexico. MSc Thesis, University of London, London – United Kingdom [unpublished].
Schaaf, P., Heinrich, W. & Besch, T. 1994. Composition and Sm-Nd isotopic data of the lower crust beneath San Luis Potosí, central Mexico: evidence from granulite-facies xenolith suite. Chemical Geology 118, 63–84.
Schaaf, P., Stimac, J., Siebe, C. & Macías, J.L. 2005. Geochemical evidence for mantle origin and crustal processes in volcanic rocks from Popocatépetl and surrounding monogenetic volcanoes, Central Mexico. Journal of Petrology 46, 1243–1282.
Schellart, W.P. 2005. Influence of the subducting plate velocity on the geometry of the slab and migration of the subduction hinge. Earth and Planetary Science Letters 231, 197–219.
Schellart, W.P. 2007. The potential influence of subduction zone polarity on overriding plate deformation, trench migration and slab dip angle. Tectonophysics 445, 363–372.
Shervais, J.W. 1982. Ti-V plots and the petrogenesis of modern and ophiolitic lavas. Earth and Planetary Science Letters 59, 101–118.
Sheth, H.C. 2007. ‘Large Igneous Provinces (LIPs)’: definition, recommended terminology, and a hierarchical classification. Earth Science Reviews 85, 117–124.
Sheth, H.C. 2008. Do major oxide tectonic discrimination diagrams work? Evaluating new log-ratio and discriminant-analysis-based diagrams with Indian Ocean mafic volcanics and Asian ophiolites. Terra Nova 20, 229–236.
Sheth, H., Torres-Alvarado, I.S. & Verma, S.P. 2000. Beyond subduction and plumes: A unified tectonic-petrogenetic model for the Mexican Volcanic Belt. International Geology Review 42, 1116–1132.
Shurbet, D.H. & Cebull, S.E. 1984. Tectonic interpretation of the Trans-Mexican Volcanic Belt. Tectonophysics 101, 159–165.
Siebe, C., Rodríguez-Lara, V., Schaaf, P. & Abrams, M. 2004. Geochemistry, Sr-Nd isotope composition, and tectonic setting of Holocene Pelado, Guespalapa and Chichinautzin scoria cones, south of Mexico City. Journal of Volcanology and Geothermal Research 130, 197–226.
Slovenec, D., Lugović, B. & Vlahović, I. 2010. Geochemistry, petrology and tectonomagmatic significance of basaltic rocks from the ophiolite mélange at the NW external-internal Dinarides junction (Croatia). Geologica Carpathica 61, 273–292.
Srivastava, R.K., Chandra, R. & Shastry, A. 2004. High-Ti type N-MORB parentage of basalts from the south Andaman ophiolite suite, India. Proceedings of Indian Academy of Sciences (Earth and Planetary Sciences) 113, 605–618.
Stock, J.M. 1996. Plate tectonics. Encyclopedia of Applied Physics 14, 273–294.
Straub, S.M. & Martin Del Pozzo, A.L. 2001. The significance of phenocryst diversity in tephra from recent eruptions at Popocatepetl volcano (central Mexico). Contributions to Mineralogy and Petrology 140, 487–510.
Sun, S.-S. & McDonough, W.F. 1989. Chemical and isotopic systematics of oceanic basalts: implications for mantle composition and processes. In: Saunders, A.D. & Norry, M.J. (eds), Magmatism in the Ocean Basins. Geological Society Special Publication 42, 313–345.
Suter, M., Quintero, O. & Johnson, C.A. 1992. Active faults and the state of stress in the central part of the Trans-Mexican Volcanic Belt, Mexico: 1. The Venta de Bravo fault. Journal of Geophysical Research 97, 11983–11993.
Suter, M., Quintero, O., López, M., Aguirre, G. & Farrrar, E. 1995. The Acambay graben: active intra-arc extension in the Trans-Mexican volcanic belt, Mexico. Tectonics 14, 1245–1262.
Swinamer, R.T. 1989. The Geomorphology, Petrography, Geochemistry and Petrogenesis of the Volcanic Rocks in the Sierra de Chichinautzin, Mexico. MSc Thesis, Queen’s University, Kingston, Ontario-Canada [unpublished].
Tatsumi, Y. & Eggins, S. 1993. Subduction Zone Magmatism. Blackwell Science, Ann Arbor.
Taylor, S.R. & McLennan, S.M. 1985. The Continental Crust: Its Composition and Evolution. Blackwell Scientific, Oxford.
Taylor, R.N. & Nesbitt, R.W. 1998. Isotopic characteristics of subduction fluids in an intra-oceanic setting, Izu-Bonin Arc, Japan. Earth and Planetary Science Letters 164, 79–98.
Thirwall, M.F., Graham, A.M., Arculus, R.J., Harmon, R.S. & Macpherson, C.G. 1997. Resolution of the effects of crustal assimilation, sediment subduction, and fluid transport in island arc magmas: Pb-Sr-Nd-O isotope geochemistry of Grenada, Lesser Antilles. Geochimica and Cosmochimica Acta 60, 4785–4810.
Torres-Alvarado, I.S., Verma, S.P., Palacios-Berruete, H., Guevara, M. & González-Castillo, O.Y. 2003. DC_Base: a database system to manage Nernst distribution coefficients and its application to partial melting modeling. Computers & Geosciences 29, 1191–1198.
UNAM & CENAPRED Seismology Group 1995. The Milpa Alta earthquake of January 21, 1995. Geofísica Internacional 34, 355–362.
Valdés, C.M., Mooney, W., Singh, K., Meyer, S., Lomnitz, C., Luetgert, J., Hesley, C., Lewis, B. & Mena, M. 1986. Crustal structure of Oaxaca, México, from seismic refraction measurements. Bulletin of Seismological Society of America 76, 547–563.
Vázquez-Sánchez, E. & Jaimes-Palomera, L.R. 1989. Geología de la Cuenca de México. Geofísica Internacional 28, 133–189.
60
VELASCO-TAPIA and VERMA / Turkish J Earth Sci
Velasco-Tapia, F. & Verma, S.P. 2001a. Estado actual de la investigación geoquímica en el campo monogenético de la Sierra de Chichinautzin: Análisis de información y perspectivas. Revista Mexicana de Ciencias Geológicas 18, 1–36.
Velasco-Tapia, F. & Verma, S.P. 2001b. First partial melting inversion model for a rift-related origin of the Sierra de Chichinautzin Volcanic Field, Central Mexican Volcanic Belt. International Geology Review 43, 788–817.
Verma, S.P. 1992. Seawater alteration effects on REE, K, Rb, Cs, Sr, U, Th, Pb and Sr-Nd-Pb isotopic systematics in Mid-Ocean Ridge Basalt. Geochemical Journal 26, 159–177.
Verma, S.P. 1999. Geochemistry of evolved magmas and their relationship to subduction un-related mafic volcanism at the volcanic front of the Central Mexican Volcanic Belt. Journal of Volcanology and Geothermal Research 93, 151–171.
Verma, S.P. 2000. Geochemistry of subducting Cocos plate and the origin of subduction-unrelated mafic volcanism at the volcanic front of the Central Mexican Volcanic Belt (Mexico). In: Delgado-Granados, G., Aguirre-Díaz, G. & Stock, J.M. (eds), Cenozoic Tectonics and Volcanism of Mexico. Geological Society of America Special Paper 334, 195–222.
Verma, S.P. 2002. Absence of Cocos plate subduction-related mafic volcanism in southern Mexico: a unique case on Earth? Geology 30, 1095–1098.
Verma, S.P. 2004. Solely extension-related origin of the eastern to west-central Mexican Volcanic Belt (Mexico) from partial melting inversion model. Current Science 86, 713–719.
Verma, S.P. 2006. Extension-related origin of magmas from a garnet-bearing source in the Los Tuxtlas volcanic field, Mexico. International Journal of Earth Sciences 95, 871–901.
Verma, S.P. 2009. Continental rift setting for the central part of the Mexican Volcanic Belt: A statistical approach. Open Geology Journal 3, 8–29.
Verma, S.P. 2010. Statistical evaluation of bivariate, ternary and discriminant function tectonomagmatic discrimination diagrams. Turkish Journal of Earth Sciences 19, 239–265.
Verma, S.P. & Agrawal, S. 2011. New tectonic discrimination diagrams for basic and ultrabasic volcanic rocks through log-transformed ratios of high field strength elements and implications for petrogenetic processes. Revista Mexicana de Ciencias Geológicas 28, 24–44.
Verma, S.P. & Díaz-González, L. 2012. Application of the discordant outlier detection and separation system in the geosciences. International Geology Review, DOI:10.1080/00206814.2011.569402.
Verma, S.P., Guevara, M. & Agrawal, S. 2006. Discriminating four tectonic settings: five new geochemical diagrams for basic and ultrabasic volcanic rocks based on log-ratio transformation of major-element data. Journal of Earth System Science 115, 485–528.
Verma, S.P., Torres-Alvarado, I.S. & Sotelo-Rodríguez, Z.T. 2002. SINCLAS: standard igneous norm and volcanic rock classification system. Computer & Geosciences 28, 711–715.
Verma, S.P., Verma, S.K., Pandarinath, K. & Rivera-Gómez, M.A. 2011. Evaluation of recent tectonomagmatic discrimination diagrams and their application to the origin of basic magmas in Southern Mexico and Central America. Pure and Applied Geophysics, 168, 1501–1525.
Walker, J.A., Carr, M.J., Feigenson, M.D. & Kalamarides, R.I. 1990. The petrogenetic significance of interstratified high- and low-Ti basalts in central Nicaragua. Journal of Petrology 31, 1141–1164.
Walker, J.A., Patino, L.C., Carr, M.J. & Feigenson, M.D. 2001. Slab control over HFSE depletions in central Nicaragua. Earth and Planetary Science Letters 192, 533–543.
Wallace, P. & Carmichael, I.S.E. 1999. Quaternary volcanism near the Valley of Mexico: implications for subduction zone magmatism and the effects of crustal thickness variations on primitive magma compositions. Contributions to Mineralogy and Petrology 135, 291–314.
White, W.M. & Dupré, B. 1986. Sediment subduction and magma genesis in the Lesser Antilles: isotopic and trace element constraints. Journal of Geophysical Research 91, 5927–5941.
Xu, J.F., Shinjo, R., Defant, M.J., Wang, Q. & Rapp, R.P. 2002. Origin of Mesozoic adakitic intrusive rocks in the Ningzhen area of east China: partial melting of delaminated lower continental crust? Geology 30, 1111–1114.
Yavuz, F. 1999. A revised program for microprobe-derived amphibole analyses using IMA rules. Computers & Geosciences 25, 909–927.
Yavuz, F. 2001. PYROX: A computer program for the IMA pyroxene classification and calculation scheme. Computer & Geosciences 27, 97–107.
Yogodzinski, G.M., Volynets, O.N., Koloskov, A.V., Seliverstov, N.I. & Matvenkov, V.V. 1994. Magnesian andesites and the subduction component in a strongly calc-alkaline series at Piip volcano, far western Aleutians. Journal of Petrology 35, 163–204.
Zhang, Z., Zhao, G., Santosh, M., Wang, J., Dong, X. & Shen, K. 2010. Late Cretaceous charnockite with adakitic affinities form the Gangdese batholith, southeastern Tibet: Evidence for Neo-Tethyan mid-ocean ridge subduction? Gondwana Research 17, 615–631.
Zindler, A. & Hart, S. 1986. Chemical geodynamics. Annual Review of Earth and Planetary Science 14, 493 –571.

1
VELASCO-TAPIA and VERMA / Turkish J Earth Sci
Appendix A1. New major-element data for SCN volcanic rocks.
Sample CHI20 CHI56 CHI18 CHI59 CHI64 CHI70 CHI69 CHI19 CHI42 CHI16
Sample S Barbara Cima Atlapulco Jumiltepec Tetillas Pelagatos Agua Pehualtepec Jumento Santa Fe
Locality 18°58.88’ 19°07.33’ 19°14.98’ 18°44.50’ 18° 52.50’ 19° 06.00’ 19° 00.50’ 19° 13.07’ 19°10.16’ 19° 10.21’
Latitude (°N): 98°55.42’ 99°11.50’ 99°23.75’ 99°11.83’ 99° 07.00’ 98° 55.99’ 98° 58.50’ 99° 24.17’ 99°19.09’ 99° 27.20’
Longitude (ªW): 1 1 1 1 1 1 1 2 1 1
Analytical method BA BA BTA, sho BA BA BA BA BA BA BA
Rock type M M HB1 HMI HMI HMI E1 E1 DISQ E1
Major elements (% m/m; original composition)
SiO2 51.650 52.110 52.320 52.960 52.630 53.100 54.010 55.640 55.250 55.240
TiO2 1.534 1.459 1.059 1.479 0.920 0.770 1.330 1.160 0.980 1.300
Al2O3 15.730 16.580 15.310 17.690 16.000 15.490 16.710 16.250 16.160 16.070
Fe2O3t 8.810 9.000 7.800 8.960 7.990 7.580 7.680 7.100 6.970 7.910
MnO 0.134 0.134 0.129 0.128 0.120 0.120 0.120 0.130 0.110 0.120
MgO 8.760 7.850 8.300 6.420 8.510 9.500 5.980 7.390 7.040 6.250
CaO 8.090 7.650 8.770 7.460 7.900 7.700 7.120 7.600 7.320 7.330
Na2O 3.620 3.910 3.530 3.580 3.500 3.270 3.700 3.910 4.040 3.880
K2O 1.230 1.080 2.180 0.790 0.980 1.000 1.240 1.170 1.540 1.270
P2O5 0.430 0.280 0.710 0.390 0.190 0.740 0.390 0.250 0.370 0.360
LOI 0.190 0.030 0.140 1.110 0.160 0.150 0.570 0.290 0.470 0.180
Major elements (% m/m; adjusted composition)
(SiO2)adj 52.018 52.455 52.576 53.414 53.644 53.815 55.296 55.618 55.679 55.738
(Na2O)adj 3.646 3.936 3.547 3.611 3.567 3.314 3.788 3.908 4.071 3.915
(K2O)adj 1.239 1.087 2.191 0.797 0.999 1.013 1.270 1.170 1.552 1.281
Analytical Method: (1) ICP-OES (‘4LithoRes’ methodology; ActLabs, Inc., Canada); (2) XRF (Guevara et al. 2005; Instituto de Geología, UNAM, Mexico). Rock-types are presented according to total alkalis versus silica diagram (Le Bas et al. 1986; Le Bas 2000) on an anhydrous 100% adjusted basis and Fe2O3/FeO ratio after Middlemost (1989) using the SINCLAS computer program (Verma et al. 2002). Group subdivision based in phenocryst assemblage and geochemical composition: (a) HMI– high-magnesian intermediate magmas; DISQ– evolved magmas with a ol + opx ± cpx ± plg assemblage; (b) E2– evolved magmas with a opx ± cpx + plg assemblage; and (c) E3 – evolved magmas with textural evidences of mineralogical disequilibrium, such as coexisting olivine and quartz, phenocrysts of plagioclase and pyroxene with oscillatory or more complex zoning and twinning, the presence of biotite and hornblende phenocrysts, and quartz xenocrysts with pyroxene reaction rims.
APPENDIX

2
VELASCO-TAPIA and VERMA / Turkish J Earth Sci
Appendix A1. Continued.
Sample CHI14 CHI24 CHI55 CHI58 CHI33 CHI63 CHI67 CHI22 CHI27 CHI31Locality Coatepec Cocotitlán Tlecuilco Ajusco Temixco Pelado Cajete Cuatepetl Texclacoyoqui TiocaLatitude (°N): 19°09.03’ 19°14.18’ 18°54.00’ 19°13.67’ 18°51.03’ 19°07.00’ 19°06.00’ 19°05.15’ 19°09.05’ 19°12.52’Longitude (ªW): 99°24.93’ 98°52.55’ 98°48.50’ 99°13.00’ 99°12.42’ 99°16.50’ 99°14.50’ 98°51.62’ 98°56.03’ 99°05.67’Analytical method 2 2 2 1 2 2 1 1 1 1Rock type BA BTA, mug BA BA BA A A A A AGroup E1 E1 HMI DISQ E1 DISQ DISQ E1 E1 E2
Major elements (% m/m; original composition)SiO2 55.850 55.700 55.770 56.390 56.740 58.780 58.340 58.870 59.670 60.050TiO2 1.3100 1.280 1.030 0.976 1.180 1.270 0.810 0.934 1.120 0.836Al2O3 15.770 16.800 14.870 16.470 16.220 16.180 16.130 16.180 15.830 15.830Fe2O3
t 7.940 7.510 7.130 6.960 7.580 7.070 5.940 6.290 6.780 5.660MnO 0.130 0.120 0.120 0.110 0.130 0.120 0.093 0.102 0.109 0.090MgO 6.530 5.320 8.370 6.550 6.180 4.760 5.260 5.630 4.450 5.420CaO 7.130 7.100 6.860 6.960 6.680 5.550 6.050 5.890 6.070 6.050Na2O 4.200 4.140 3.490 3.840 3.720 4.280 4.270 3.950 3.890 3.880K2O 1.460 1.580 1.270 1.140 1.480 1.680 1.600 1.500 1.810 1.430P2O5 0.390 0.350 0.260 0.190 0.320 0.360 0.310 0.220 0.390 0.170LOI 0.100 0.200 0.190 0.610 0.320 0.400 0.380 0.450 0.050 0.410
Major elements (% m/m; adjusted composition)(SiO2)adj 55.803 56.077 56.558 56.938 56.950 59.069 59.318 59.412 59.908 60.666(Na2O)adj 4.196 4.168 3.539 3.877 3.734 4.301 4.342 3.986 3.906 3.920(K2O)adj 1.459 1.591 1.288 1.151 1.485 1.688 1.627 1.514 1.817 1.445
Sample CHI40 CHI71 CHI38 CHI30 CHI77 CHI79 CHI72 CHI47 CHI28 CHI21
Sample Mateo Xicomulco Pocito Cuahutenco Teuhtli Tabaquillo Zompole Tres Cruces Tlacotenco S. Matías
Locality 19°11.50’ 19°12.14’ 19°03.92’ 19°12.02’ 19°13.00’ 19°12.50’ 19°11.83’ 19°12.50’ 19°09.25’ 19°04.50’
Latitude (°N): 99°19.67’ 99°03.66’ 99°19.67’ 99°05.88’ 99°02.50’ 99°08.00’ 99°06.00’ 99°17.66’ 98°58.67’ 98°50.85’
Longitude (ªW): 1 1 1 2 1 1 1 1 1 1
Analytical method A A A A A D D D D D
Rock type E2 E2 E2 E1 E2 DISQ E2 E2 E2 DISQ
Major elements (% m/m; original composition)
SiO2 54.640 60.870 60.740 61.300 62.230 62.970 63.460 63.680 63.150 63.220
TiO2 0.912 0.810 0.804 0.970 0.757 0.630 0.851 0.785 0.746 0.720
Al2O3 19.800 16.570 16.600 16.000 15.290 17.920 15.900 17.010 16.010 15.740
Fe2O3t 5.430 5.670 5.350 5.930 5.565 4.740 5.460 4.970 4.820 4.690
MnO 0.092 0.090 0.088 0.100 0.099 0.090 0.091 0.081 0.082 0.079
MgO 2.230 4.650 4.270 3.250 4.820 1.880 3.130 2.450 3.120 3.330
CaO 2.660 5.870 5.660 5.090 5.240 5.260 4.840 4.720 4.710 4.700
Na2O 3.470 3.940 4.200 4.040 3.760 4.250 4.300 4.680 4.380 3.950
K2O 0.800 1.520 1.540 1.630 1.690 1.530 1.920 1.570 1.830 2.030
P2O5 0.220 0.210 0.210 0.330 0.190 0.230 0.280 0.190 0.220 0.170
LOI 8.950 0.160 0.710 0.980 0.310 0.870 0.070 0.030 0.060 1.070
Major elements (% m/m; adjusted composition)
(SiO2)adj 60.819 61.012 61.320 62.431 62.721 63.509 63.568 63.827 63.973 64.324
(Na2O)adj 3.862 3.949 4.240 4.114 3.790 4.286 4.307 4.691 4.437 4.019
(K2O)adj 0.890 1.524 1.555 1.660 1.703 1.543 1.923 1.574 1.854 2.065

3
VELASCO-TAPIA and VERMA / Turkish J Earth Sci
Appendix A1. Continued.
Sample CHI29 CHI26 CHI49 CHI43 CHI39
Sample Atocpan Tezilo Tabaquillo Mesa Gloria Huitzilac
Locality 19°12.22’ 19°02.65’ 19°06.34’ 19°04.00’ 19°01.50’
Latitude (°N): 99°02.22’ 98°55.55’ 99°17.50’ 99°19.84’ 99°17.08’
Longitude (ªW): 2 2 1 1 1
Analytical method D D D D D
Rock type E2 E2 DISQ DISQ E2
Major elements (% m/m; original composition)
SiO2 64.47 64.70 64.66 65.97 66.06
TiO2 0.74 0.74 0.64 0.60 0.572
Al2O3 16.45 16.14 15.86 16.23 15.92
Fe2O3t 5.05 5.03 4.48 4.23 3.84
MnO 0.10 0.10 0.08 0.08 0.066
MgO 2.82 3.17 2.97 2.21 2.20
CaO 4.55 4.55 4.84 3.93 4.07
Na2O 4.07 4.14 4.15 4.25 4.34
K2O 2.09 1.80 1.89 2.23 2.12
P2O5 0.24 0.24 0.18 0.20 0.16
LOI 0.20 0.22 0.36 0.20 0.56
Major elements (% m/m; adjusted composition)
(SiO2)adj 64.336 64.545 65.037 66.223 66.683
(Na2O)adj 4.062 4.130 4.174 4.266 4.381
(K2O)adj 2.086 1.796 1.901 2.238 2.140

4
VELASCO-TAPIA and VERMA / Turkish J Earth Sci
Appendix A2. New trace-element data (in mg.g-1) for volcanic rocks from the SCN.
Sample CHI20 CHI56 CHI18 CHI59 CHI64 CHI70 CHI69 CHI42 CHI16 CHI58 CHI67 CHI22 CHI27
La 23.2 14.5 66.0 22.9 10.3 10.8 21.3 24.2 23.3 13.7 20.3 16.9 34.7
Ce 53.0 32.1 139.0 46.9 23.1 24.0 44.7 54.1 49.0 28.8 44.9 34.7 69.3
Pr 7.2 4.0 19.0 5.7 3.2 3.3 5.9 7.4 6.4 3.4 6.2 4.4 7.6
Nd 29.1 16.7 83.6 24.4 14.5 14.0 24.8 32.0 27.9 15.5 26.8 18.4 29.6
Sm 6.05 4.24 15.50 5.64 3.37 3.43 5.43 6.56 5.94 3.82 5.62 4.14 6.38
Eu 2.15 1.54 4.28 1.85 1.16 1.09 1.76 1.82 1.98 1.27 1.61 1.25 1.71
Gd 5.80 4.52 10.50 5.14 3.58 3.38 5.22 5.36 5.11 3.56 4.74 3.94 5.32
Tb 0.86 0.77 1.36 0.85 0.63 0.57 0.86 0.78 0.82 0.64 0.68 0.66 0.87
Dy 4.69 4.47 6.58 4.80 3.64 3.29 4.83 3.84 4.64 3.87 3.59 3.69 5.14
Ho 0.96 0.84 1.04 0.93 0.72 0.65 0.97 0.72 0.86 0.71 0.67 0.70 0.98
Er 2.76 2.50 2.89 2.48 2.08 1.90 2.67 1.90 2.41 2.08 1.75 2.04 2.66
Tm 0.39 0.38 0.40 0.36 0.30 0.27 0.39 0.26 0.34 0.30 0.24 0.31 0.40
Yb 2.36 2.32 2.44 2.39 1.90 1.76 2.44 1.66 2.03 1.91 1.50 1.87 2.65
Lu 0.36 0.36 0.33 0.37 0.28 0.25 0.34 0.25 0.32 0.28 0.21 0.29 0.39
Sc 22 22 23 21 23 23 20 18 19 19 - 17 16
V 160 157 163 150 152 156 144 130 134 117 101 116 113
Cr 307 267 283 192 410 488 192 248 206 269 190 235 157
Co 39 33 31 18 31 33 23 24 32 25 19 29 29
Ni 187 116 183 55 161 220 37 132 61 114 86 126 47
Cu 36 32 22 18 22 57 22 36 21 37 93 29 22
Zn 87 84 103 27 78 90 66 97 91 84 - 92 88
Ga 17 18 17 16 16 16 18 16 19 19 - 21 20
Rb 23 20 36 12 17 19 25 20 23 24 23 41 47
Sr 631 467 1511 517 350 371 470 682 646 414 608 442 450
Y 25 24 30 26 20 18 26 20 23 18 17 19 26
Zr 192 153 217 223 125 114 209 139 160 140 139 152 292
Nb 11.4 11.3 5.4 12.0 3.8 2.7 13.3 5.3 9.5 6.6 4.0 7.0 13.5
Cs 0.70 0.70 0.90 0.60 0.74 1.05 1.29 0.90 0.80 1.10 - 1.60 1.30
Ba 451 234 1424 463 247 247 429 571 455 314 515 405 615
Hf 4.40 3.80 5.60 4.60 3.41 3.16 5.22 3.81 4.20 3.60 4.02 3.90 6.10
Ta 0.79 0.71 0.29 0.89 0.31 0.25 0.98 0.41 0.69 0.34 0.40 0.44 0.93
Pb - - 15.0 - 7.4 11.6 11.3 14.8 - 6.0 - 6.0 7.0
Th 2.83 2.06 7.73 3.27 1.65 2.02 3.16 3.01 2.77 2.19 2.84 3.27 5.19
U 0.90 0.60 2.71 1.04 0.57 0.65 1.09 1.08 1.00 0.75 - 1.04 1.31
Rock-type and group classification as defined in Appendix A1. Trace-element analysis was carried out in ActLabs, Inc. (Ancaster, Canada) by ICP-MS applying the ‘4LithoRes’ methodology (http://www.actlabs.com/geochemistry/america/lithogeochemistry.htm).

5
VELASCO-TAPIA and VERMA / Turkish J Earth Sci
Appendix A2. Continued.
Sample CHI31 CHI40 CHI71 CHI38 CHI77 CHI79 CHI72 CHI47 CHI28 CHI21 CHI49 CHI39
La 15.7 20.0 16.1 18.6 19.1 15.6 24.9 12.1 20.6 17.8 18.4 20.5
Ce 32.6 47.9 33.5 37.3 38.4 31.8 47.2 25.2 40.6 34.1 37.6 39.6
Pr 4.0 7.3 4.3 5.0 4.6 4.0 5.7 3.4 5.0 3.9 4.7 4.6
Nd 16.6 29.7 17.7 22.5 18.6 16.2 23.9 14.9 19.7 16.4 19.1 18.5
Sm 3.6 6.12 3.87 4.71 3.90 3.24 4.77 3.48 3.94 3.73 3.92 3.65
Eu 1.19 1.77 1.17 1.47 1.22 1.11 1.36 1.08 1.19 1.10 1.13 1.02
Gd 3.40 6.21 3.56 3.93 3.70 2.99 4.40 3.31 3.71 3.19 3.61 3.23
Tb 0.60 0.92 0.60 0.64 0.70 0.50 0.75 0.55 0.60 0.54 0.55 0.50
Dy 3.20 5.18 3.22 3.66 3.60 2.75 4.14 3.07 3.47 3.10 2.97 2.53
Ho 0.60 1.02 0.65 0.66 0.70 0.54 0.77 0.62 0.64 0.58 0.59 0.48
Er 1.80 2.74 1.88 1.92 1.90 1.61 2.18 1.73 1.82 1.61 1.72 1.38
Tm 0.24 0.37 0.27 0.29 0.26 0.24 0.32 0.24 0.26 0.24 0.25 0.20
Yb 1.50 2.18 1.80 1.83 1.70 1.62 1.98 1.52 1.64 1.53 1.58 1.40
Lu 0.24 0.32 0.25 0.26 0.26 0.24 0.29 0.24 0.26 0.22 0.23 0.19
Sc 15 10 - 14 15 6 12 10 11 11 12 8
V 107 43 123 77 106 66 89 79 81 83 93 51
Cr 205 28 172 119 337 - 160 56 92 120 87 74
Co 27 10 15 16 20 6.3 14 10 19 25 10 9.0
Ni 50 - - 69 52 - 45 - 56 59 - 20
Cu 14 94 14 20 26 - 23 13 18 19 - 15
Zn 64 158 - 86 78. 88 94 64 83 83 72 70
Ga 19 22 - 20 20 18 21 18 21 20 18 22
Rb 38 3 - 20 42 34 54 26 49 50 37 57
Sr 481 306 562 677 382 623 413 484 425 408 555 439
Y 18 29 18 17 20 15 20 17 17 15 16 12
Zr 150 170 135 135 173 140 201 135 174 151 152 151
Nb 5.0 5.4 5.0 4.9 6.0 4.9 10.1 3.5 8.1 7.0 4.8 6.7
Cs 1.80 - - 1.10 1.90 1.95 2.10 0.85 1.80 2.10 1.76 2.30
Ba 394 449 404 467 467 396 559 389 548 484 531 602
Hf 3.70 4.40 3.79 3.90 4.30 3.91 5.30 3.77 4.70 - 4.29 4.40
Ta 0.40 0.34 0.42 0.33 0.50 0.44 0.61 0.32 0.49 0.47 0.49 -
Pb - 14.0 - 7.0 6.0 13.7 9.0 9.1 8.0 7.0 13.3 9.0
Th 3.90 3.21 3.64 3.00 4.50 3.43 4.60 2.24 - 3.82 3.65 4.84
U 1.30 1.32 - 0.98 1.60 1.29 1.59 0.92 1.34 1.33 1.43 1.61

6
VELASCO-TAPIA and VERMA / Turkish J Earth Sci
Appendix A3. New Sr and Nd isotopic data for volcanic rocks from the SCN.
Sample Locality Rock type Group (SiO2)adj (%m/m) 87Sr/86Sr 143Nd/144Nd
CHI64 Tetillas BA HMI 53.644 0.704164±41 0.512854±19
CHI70 Pelagatos BA HMI 53.815 0.704164±32 0.512813±22
CHI69 Agua BA E1 55.296 0.704334±39 0.512766±18
CHI42 Jumento BA DISQ 55.679 0.704103±38 0.512971±20
CHI27 Texclacoyoqui A E1 59.908 0.704759±39 0.512697±16
CHI31 Tioca A E2 60.666 0.703987±41 0.512751±18
CHI71 Xicomulco A E2 61.012 0.704065±36 0.512787±17
CHI77 Teuhtli A E2 62.721 0.704254±37 0.512815±23
CHI79 Tabaquillo D DISQ 63.509 0.704157±34 0.512756±21
CHI28 Tlacotenco D E2 63.973 0.704470±43 0.512809±15
CHI21 S. Matías D DISQ 64.324 0.704525±44 0.512825±16
CHI49 Tabaquillo D DISQ 65.037 0.703791±38 0.512846±13
Rock-types and group classification as defined in Appendix A1. Sr and Nd isotopic data from Laboratorio Universitario de Geoquímica Isotópica (LUGIS-UNAM; México, D.F.) using a FINNIGAN MAT-262 mass spectrometer (average 87Sr/86Sr= 0.710233±17 for n= 208 in SRM987 standard; average 143Nd/144Nd= 0.511880±21 for n= 105 in La Jolla standard). Sr isotopic ratios normalised to 86Sr/88Sr= 0.11940 and adjusted to 87Sr/86Sr= 0.710230 for SRM987 standard. Nd isotopic ratios normalised to 146Nd/144Nd= 0.72190 and adjusted to 143Nd/144Nd= 0.511860 for La Jolla standard.

7
VELASCO-TAPIA and VERMA / Turkish J Earth Sci
Appendix A4. Representative compositional data and structural formula for olivine phenocrysts (cores) in volcanic rocks from the SCN.
Sample CH164 (HMI: (SiO2)adj= 53.64 %, (MgO)adj= 8.67 %) CHI33 (E1: (SiO2)adj= 56.95 %, (MgO)adj= 6.20 %)%SiO2 40.839 40.255 40.299 40.725 40.537 40.303 39.901 40.005 40.537 39.395 39.615 39.651TiO2 0.031 0.000 0.000 0.000 0.008 0.000 0.021 0.014 0.000 0.056 0.057 0.000Al2O3 0.016 0.022 0.031 0.067 0.034 0.031 0.039 0.045 0.032 0.045 0.015 0.025FeOt 10.542 10.741 11.609 10.607 11.719 11.002 13.771 13.236 13.060 14.254 13.336 14.001MnO 0.149 0.195 0.129 0.163 0.134 0.148 0.216 0.188 0.214 0.227 0.210 0.149MgO 48.316 48.725 48.722 48.743 48.579 48.033 47.033 47.276 46.992 46.272 46.458 46.547CaO 0.117 0.105 0.129 0.139 0.138 0.154 0.136 0.134 0.112 0.134 0.149 0.135NiO 0.000 0.000 0.001 0.007 0.013 0.000 0.014 0.016 0.026 0.000 0.000 0.046Cr2O3 0.033 0.096 0.022 0.075 0.055 0.000 0.000 0.010 0.000 0.004 0.057 0.026Total 100.043 100.139 100.942 100.526 101.217 99.671 101.131 100.924 100.973 100.387 99.897 100.580
Si 1.003 0.991 0.987 0.996 0.990 0.997 0.986 0.988 0.998 0.984 0.989 0.986Al 0.000 0.001 0.001 0.002 0.001 0.001 0.001 0.001 0.001 0.001 0.001 0.001Sum 1.003 0.992 0.988 0.998 0.991 0.998 0.987 0.989 0.999 0.985 0.990 0.987Ti 0.001 0.000 0.000 0.000 0.000 0.000 0.000 0.000 0.000 0.001 0.001 0.000Cr 0.001 0.002 0.000 0.001 0.001 0.000 0.000 0.000 0.000 0.000 0.001 0.001Fe+2 0.216 0.221 0.238 0.217 0.239 0.227 0.285 0.273 0.269 0.298 0.279 0.291Mn 0.003 0.004 0.003 0.003 0.003 0.003 0.005 0.004 0.004 0.005 0.004 0.003Mg 1.769 1.787 1.780 1.778 1.770 1.771 1.733 1.740 1.725 1.722 1.730 1.726Ca 0.003 0.003 0.003 0.004 0.004 0.004 0.004 0.004 0.003 0.004 0.004 0.004Ni 0.000 0.000 0.000 0.000 0.000 0.000 0.000 0.000 0.001 0.000 0.000 0.001Sum 1.993 2.017 2.024 2.004 2.017 2.005 2.026 2.022 2.0021 2.030 2.019 2.026
%Fo 89.10 89.00 88.21 89.12 88.08 88.62 85.89 86.43 86.51 85.27 86.13 85.56%Fa 10.90 11.00 11.79 10.88 11.92 11.38 14.11 13.57 13.49 14.73 13.87 14.44
Sample CHI63 (DISQ: (SiO2)adj= 59.07 %, (MgO)adj= 4.78 %) CHI27 (E1: (SiO2)adj= 59.91 %,(MgO)adj= 4.47 %)%SiO2 39.694 39.532 38.801 39.029 38.954 39.105 39.145 38.887 39.322 39.004 38.887 38.924TiO2 0.000 0.000 0.000 0.019 0.000 0.012 0.028 0.000 0.000 0.010 0.023 0.010Al2O3 0.038 0.043 0.018 0.012 0.015 0.021 0.000 0.038 0.041 0.003 0.012 0.000FeOt 16.733 16.783 18.046 17.081 18.001 18.126 17.055 19.147 17.954 17.125 17.384 17.156MnO 0.236 0.263 0.276 0.265 0.275 0.268 0.220 0.263 0.280 0.291 0.263 0.313MgO 42.533 43.270 42.348 42.744 42.308 42.458 44.433 41.877 43.776 43.896 43.958 43.884CaO 0.119 0.107 0.105 0.201 0.184 0.163 0.136 0.154 0.159 0.134 0.187 0.110NiO 0.000 0.000 0.015 0.032 0.014 0.008 0.022 0.020 0.023 0.021 0.016 0.017Cr2O3 0.035 0.006 0.059 0.047 0.052 0.049 0.028 0.011 0.000 0.017 0.011 0.000Sum 99.388 100.004 99.668 99.430 99.803 100.210 101.067 100.397 101.555 100.501 100.741 100.414
Si 1.010 1.001 0.993 0.997 0.995 0.995 0.983 0.993 0.987 0.986 0.982 0.985Al 0.001 0.001 0.001 0.000 0.001 0.001 0.000 0.001 0.001 0.000 0.001 0.000Sum 1.011 1.002 0.994 0.997 0.996 0.996 0.983 0.994 0.988 0.986 0.983 0.985Ti 0.000 0.000 0.000 0.000 0.000 0.000 0.001 0.000 0.000 0.000 0.000 0.000Cr 0.001 0.000 0.001 0.001 0.001 0.001 0.001 0.000 0.000 0.000 0.000 0.000Fe+2 0.356 0.355 0.386 0.365 0.385 0.386 0.358 0.409 0.377 0.362 0.367 0.363Mn 0.005 0.006 0.006 0.006 0.006 0.006 0.005 0.006 0.006 0.006 0.006 0.007Mg 1.613 1.633 1.616 1.627 1.611 1.611 1.664 1.594 1.638 1.654 1.655 1.656Ca 0.003 0.003 0.003 0.005 0.005 0.004 0.004 0.004 0.004 0.004 0.005 0.003Ni 0.000 0.000 0.000 0.001 0.000 0.000 0.000 0.000 0.000 0.000 0.000 0.000Sum 1.978 1.997 2.012 2.005 2.008 2.008 2.032 2.013 2.025 2.027 2.034 2.029%Fo 81.92 82.13 80.71 81.69 80.73 80.68 82.28 79.59 81.30 82.05 81.85 82.02Fa 18.08 17.87 19.29 18.31 19.27 19.32 17.72 20.41 18.70 17.95 18.15 17.98

8
VELASCO-TAPIA and VERMA / Turkish J Earth Sci
Appendix A4. Continued.
Sample CHI69 (E1: (SiO2)adj= 55.30%,
(MgO)adj= 6.12 %)CHI42 (DISQ: (SiO2)adj= 55.68
%, (MgO)adj= 7.10 %)
CHI11 (DISQ: (SiO2)adj= 61.10 %, (MgO)adj=
4.40 %) *
CHI08 (DISQ: (SiO2)adj= 61.60 %, (MgO)adj= 4.20 %) *
%SiO2 39.900 39.629 40.204 41.76 41.20 40.75 40.15 39.89 39.460 39.487 39.291TiO2 0.000 0.055 0.024 0.02 0.01 0.00 0.00 0.03 0.059 0.000 0.050Al2O3 0.001 0.024 0.012 0.04 0.05 0.03 0.01 0.04 0.011 0.009 0.018FeOt 15.249 14.628 16.463 6.34 12.23 16.55 12.13 12.49 16.243 15.383 18.022MnO 0.203 0.187 0.282 0.12 0.16 0.26 0.12 0.18 0.246 0.254 0.286MgO 43.779 45.138 43.480 51.76 47.89 44.71 47.15 47.63 43.014 43.439 42.406CaO 0.203 0.146 0.149 0.16 0.10 0.00 0.26 0.18 0.132 0.114 0.137NiO 0.000 0.010 0.004 0.04 0.10 0.00 0.26 0.18 0.329 0.330 0.241Cr2O3 0.011 0.024 0.055 0.02 0.00 0.04 0.01 0.04 0.000 0.009 0.036Total 99.346 99.841 100.673 100.260 101.74 102.34 100.09 100.66 99.494 99.025 100.487
Si 1.009 0.995 1.008 1.004 1.002 1.004 0.995 0.986 1.003 1.005 0.997Al 0.000 0.001 0.000 0.001 0.002 0.001 0.001 0.001 0.000 0.000 0.001Sum 1.009 0.996 1.008 1.005 1.004 1.005 0.996 0.987 1.003 1.005 0.998Ti 0.000 0.001 0.000 0.000 0.000 0.000 0.000 0.001 0.001 0.000 0.000Cr 0.000 0.000 0.001 0.000 0.000 0.001 0.000 0.001 0.000 0.000 0.000Fe+2 0.322 0.307 0.345 0.127 0.249 0.341 0.251 0.258 0.345 0.327 0.820Mn 0.004 0.004 0.006 0.002 0.003 0.005 0.003 0.004 0.005 0.005 0.006Mg 1.650 1.690 1.625 1.855 1.737 1.643 1.743 1.754 1.630 1.648 1.605Ca 0.005 0.004 0.004 0.004 0.003 0.000 0.007 0.005 0.004 0.003 0.004Ni 0.000 0.000 0.000 0.001 0.002 0.000 0.005 0.004 0.007 0.007 0.005Total 1.982 2.007 1.982 1.990 1.993 1.990 2.009 2.026 1.992 1.990 2.003%Fo 83.66 84.62 82.48 93.57 87.47 82.81 87.39 87.17 85.52 83.43 80.75Fa 16.34 15.38 17.52 6.43 12.53 17.19 12.61 12.83 17.48 16.57 19.25
*Geochemical and Sr-Nd isotopic whole-rock composition reported by Verma (1999).

9
VELASCO-TAPIA and VERMA / Turkish J Earth Sci
Appendix A5. Representative compositional data and structural formula for spinel in volcanic rocks from the SCN.
Sample CHI64 (HMI: (SiO2)adj= 53.64%, (MgO)adj= 8.67%)CHI70 (HMI:
(SiO2)adj= 53.82%, (MgO)adj= 9.63%)
%Fo 89.10 89.00 88.21 89.12 88.08 88.62 89.00 88.21 88.83 89.10 90.39 87.10
SiO2 0.074 0.073 0.101 0.145 0.114 0.099 0.124 0.101 0.128 0.113 0.140 0.100TiO2 0.563 0.666 0.894 0.730 1.315 1.261 0.638 1.008 1.016 0.651 0.490 0.510Al2O3 21.345 21.066 20.540 19.042 19.161 18.724 21.343 20.086 20.327 22.558 19.280 18.510Cr2O3 40.813 41.032 36.682 39.757 35.897 37.487 40.758 37.472 36.903 39.223 43.790 40.020FeOt 20.695 20.372 28.147 27.585 27.253 30.933 20.262 27.859 26.998 23.697 18.120 25.770MnO 0.268 0.216 0.312 0.198 0.285 0.313 0.270 0.317 0.312 0.210 0.180 0.320MgO 13.841 14.297 10.471 9.812 11.994 8.179 14.050 11.359 11.972 12.458 14.230 10.680CaO 0.018 0.008 0.080 0.135 0.008 0.095 0.008 0.041 0.059 0.020 0.030 0.040Total 97.617 97.730 97.227 97.404 96.027 97.091 97.453 98.243 97.715 98.930 96.260 95.950
Si 0.018 0.018 0.026 0.038 0.029 0.026 0.031 0.026 0.032 0.028 0.036 0.026Ti 0.106 0.125 0.173 0.142 0.255 0.250 0.120 0.192 0.194 0.121 0.094 0.100Al 6.282 6.182 6.215 5.818 5.828 5.808 6.281 5.999 6.066 6.592 5.777 5.708Cr 8.058 8.078 7.446 8.149 7.325 7.801 8.047 7.508 7.388 7.689 8.802 8.279Fe+3 1.412 1.454 1.942 1.673 2.277 1.839 1.370 2.057 2.094 1.419 1.163 1.760Fe+2 2.910 2.788 4.101 4.307 3.605 4.970 2.861 3.847 3.623 3.494 2.689 3.878Mn 0.057 0.046 0.068 0.043 0.062 0.070 0.057 0.068 0.067 0.044 0.039 0.071Mg 5.153 5.308 4.008 3.792 4.615 3.210 5.231 4.292 4.520 4.606 5.393 4.166Ca 0.005 0.002 0.022 0.037 0.002 0.027 0.002 0.011 0.016 0.005 0.008 0.011Sum 24.001 24.001 24.001 23.999 23.998 24.001 24.000 24.000 24.000 23.998 24.001 23.999
Fe/(Fe + Mg) 0.46 0.44 0.60 0.61 0.56 0.68 0.45 0.58 0.56 0.52 0.42 0.58Cr/(Cr + Al) 0.56 0.57 0.55 0.58 0.56 0.57 0.56 0.56 0.55 0.54 0.60 0.59Fe+3/ Fe 0.33 0.34 0.32 0.28 0.39 0.27 0.32 0.35 0.37 0.29 0.30 0.31
Sample CHI63 (DISQ: (SiO2)adj= 59.07%, (MgO)adj= 4.78%)
CHI33 (E1: (SiO2)adj= 56.95%, MgO= 6.20%)
CHI69 (E1: (SiO2)adj= 55.30%, MgO= 6.12%)
%Fo 81.92 82.13 85.89 85.27 86.13 83.66 84.62 82.48
SiO2 0.056 0.082 0.063 0.694 0.094 0.061 0.040 0.080TiO2 5.194 3.352 1.185 1.552 1.455 3.137 1.492 3.152Al2O3 10.007 12.303 19.551 19.740 17.844 15.340 17.289 16.229Cr2O3 35.305 34.192 39.222 37.423 39.903 32.822 40.009 32.941FeOt 38.590 37.903 24.676 25.801 26.718 34.915 27.419 34.419MnO 0.342 0.181 0.281 0.292 0.201 0.316 0.271 0.212MgO 7.068 9.138 12.155 11.857 11.367 8.392 11.173 9.957CaO 0.040 0.000 0.033 0.009 0.000 0.054 0.009 0.000Total 96.602 97.151 97.166 97.368 97.582 95.037 97.702 96.990
Si 0.015 0.022 0.016 0.177 0.024 0.017 0.010 0.021Ti 1.080 0.675 0.227 0.297 0.282 0.640 0.290 0.622Al 3.261 3.884 5.881 5.926 5.414 4.904 5.259 5.021Cr 7.717 7.240 7.914 7.536 8.122 7.039 8.163 6.837Fe+3 2.831 3.482 1.718 1.590 1.852 2.745 1.978 2.856Fe+2 6.090 5.007 3.549 3.906 3.899 5.175 3.939 4.699Mn 0.080 0.041 0.061 0.063 0.044 0.073 0.059 0.047Mg 2.913 3.649 7.625 4.503 4.363 3.394 4.299 3.897Ca 0.012 0.000 0.009 0.002 0.000 0.016 0.002 0.000Total 23.999 24.000 27.000 24.000 24.000 24.003 23.999 24.000
Fe/(Fe + Mg) 0.75 0.70 0.53 0.55 0.57 0.70 0.58 0.66Cr/(Cr + Al) 0.70 0.65 0.57 0.56 0.60 0.59 0.61 0.58Fe+3/ Fe 0.32 0.41 0.33 0.29 0.32 0.35 0.33 0.38

10
VELASCO-TAPIA and VERMA / Turkish J Earth Sci
Appendix A6. Representative compositional data and structural formula for orthopyroxene in volcanic rocks from the SCN.
Sample CHI63 (DISQ: (SiO2)adj= 59.07%,; (MgO)adj= 4.78%)
Analysis Core Rim Core Rim Core Rim Core Rim Core Rim%SiO2 55.284 55.022 55.546 54.447 55.418 54.785 55.010 54.685 56.039 54.500TiO2 0.141 0.231 0.182 0.300 0.034 0.225 0.190 0.284 0.109 0.121Al2O3 2.234 1.527 1.282 1.833 1.094 1.598 2.369 1.570 1.477 2.430FeOt 9.289 10.151 10.653 12.199 12.947 10.637 10.439 10.828 9.911 10.505MnO 0.170 0.276 0.241 0.257 0.196 0.180 0.175 0.229 0.194 0.219MgO 31.430 30.371 30.192 28.013 28.821 29.890 29.494 29.970 30.943 29.453CaO 1.085 1.219 1.276 1.742 0.504 1.150 1.550 1.244 1.131 1.190Na2O 0.037 0.032 0.040 0.051 0.013 0.061 0.069 0.000 0.031 0.073NiO 0.020 0.009 0.018 0.000 0.080 0.000 0.000 0.038 0.000 0.000Cr2O3 0.518 0.363 0.331 0.329 0.075 0.397 0.439 0.396 0.244 0.531Total 100.208 99.201 99.761 99.171 99.182 98.923 99.735 99.244 100.079 99.022
Si 1.936 1.955 1.965 1.955 1.985 1.955 1.946 1.949 1.967 1.943Al IV 0.064 0.045 0.035 0.045 0.015 0.045 0.054 0.051 0.033 0.057Sum 2.000 2.000 2.000 2.000 2.000 2.000 2.000 2.000 2.000 2.000Al VI 0.028 0.019 0.019 0.033 0.031 0.023 0.045 0.015 0.028 0.045Ti 0.004 0.006 0.005 0.008 0.001 0.006 0.005 0.008 0.003 0.003Cr 0.014 0.010 0.009 0.009 0.002 0.011 0.012 0.011 0.007 0.015Fe+3 0.024 0.009 0.000 0.000 0.000 0.004 0.000 0.014 0.000 0.000Mg 1.641 1.609 1.593 1.500 1.539 1.590 1.556 1.593 1.619 1.565Fe+2 0.248 0.293 0.315 0.366 0.388 0.313 0.309 0.309 0.291 0.313Mn 0.005 0.008 0.007 0.008 0.006 0.005 0.005 0.007 0.006 0.007Ni 0.001 0.000 0.001 0.000 0.002 0.000 0.000 0.001 0.000 0.000Ca 0.041 0.046 0.048 0.067 0.019 0.044 0.059 0.048 0.043 0.045Na 0.003 0.002 0.003 0.004 0.001 0.004 0.005 0.000 0.002 0.005Sum 2.008 2.003 2.000 1.995 1.990 2.001 1.996 2.005 1.998 1.998
% En 83.78 81.87 81.12 77.27 78.84 81.26 80.67 80.85 82.68 81.08% Fs 14.14 15.77 16.42 19.28 20.17 16.50 16.29 16.74 15.15 16.56% Wo 2.08 2.36 2.46 3.45 0.99 2.25 3.05 2.41 2.17 2.35
Sample CHI27 (E1: (SiO2)adj = 59.91%, (MgO)adj = 4.47%)
Analysis Core Rim Core Rim Core Rim Core Rim Core Rim%SiO2 54.262 53.947 55.175 55.293 54.445 54.447 54.844 55.086 54.987 54.921TiO2 0.225 0.305 0.181 0.202 0.156 0.308 0.183 0.165 0.183 0.224Al2O3 1.925 2.207 1.625 1.457 1.943 1.620 1.328 0.718 1.738 1.326FeOt 10.512 10.482 10.691 10.214 10.554 11.030 10.225 12.065 11.439 10.346MnO 0.223 0.198 0.251 0.209 0.257 0.215 0.234 0.310 0.186 0.242MgO 30.528 30.239 30.795 30.143 30.667 30.508 31.240 29.726 29.599 30.423CaO 1.333 1.411 1.470 1.441 1.301 1.421 1.226 1.776 1.615 1.354Na2O 0.058 0.042 0.018 0.019 0.079 0.036 0.059 0.059 0.022 0.031NiO 0.000 0.000 0.000 0.086 0.016 0.036 0.026 0.000 0.016 0.000Cr2O3 0.390 0.451 0.375 0.276 0.519 0.357 0.463 0.136 0.263 0.292Total 99.456 99.282 100.581 99.340 99.937 99.978 99.828 100.041 100.048 99.159
Si 1.930 1.923 1.941 1.962 1.928 1.932 1.941 1.962 1.949 1.955Al IV 0.070 0.077 0.059 0.038 0.072 0.068 0.059 0.038 0.051 0.045Sum 2.000 2.000 2.000 2.000 2.000 2.000 2.000 2.000 2.000 2.000Al VI 0.011 0.015 0.008 0.023 0.009 0.000 0.000 0.001 0.022 0.011Ti 0.006 0.008 0.005 0.005 0.004 0.008 0.005 0.004 0.005 0.006Cr 0.011 0.013 0.010 0.008 0.015 0.010 0.013 0.004 0.007 0.008Fe+3 0.061 0.054 0.049 0.000 0.067 0.067 0.067 0.056 0.020 0.025Mg 1.619 1.607 1.615 1.595 1.619 1.614 1.648 1.578 1.564 1.614Fe+2 0.252 0.259 0.266 0.303 0.245 0.260 0.236 0.303 0.320 0.283Mn 0.007 0.006 0.007 0.006 0.008 0.006 0.007 0.009 0.006 0.007Ni 0.000 0.000 0.000 0.002 0.000 0.001 0.001 0.000 0.000 0.000Ca 0.051 0.054 0.055 0.055 0.049 0.054 0.046 0.068 0.061 0.052Na 0.004 0.003 0.001 0.001 0.005 0.002 0.004 0.004 0.002 0.002Total 2.020 2.018 2.016 1.999 2.023 2.023 2.026 2.019 2.007 2.008
% En 81.39 81.19 81.06 81.41 81.41 80.63 82.23 78.34 79.39 81.48% Fs 16.06 16.09 16.16 15.79 16.10 16.67 15.45 18.30 17.49 15.91% Wo 2.55 2.72 2.78 2.80 2.48 2.70 2.32 3.36 3.11 2.61

11
VELASCO-TAPIA and VERMA / Turkish J Earth Sci
Appendix A6. Continued.
Sample CHI31 (E2: (SiO2)adj= 60.67%,MgO= 5.48%)
CHI71 (E2: (SiO2)adj= 61.01%,MgO= 4.66%)
CHI03 (E2: (SiO2)adj= 61.96%,MgO= 5.25%)*
Analysis Core Rim Core Rim Core Rim Core Rim Core Rim Core Rim%SiO2 56.102 55.254 56.461 55.659 56.093 55.276 53.952 54.748 55.615 55.808 56.374 55.327TiO2 0.133 0.170 0.119 0.126 0.064 0.211 0.166 0.161 0.152 0.194 0.129 0.166Al2O3 1.543 1.198 0.740 1.189 1.692 1.386 3.320 1.793 1.408 1.388 0.646 0.690FeOt 7.289 8.428 8.230 8.882 7.426 11.452 6.980 10.889 8.276 10.816 9.474 10.505MnO 0.181 0.246 0.175 0.203 0.163 0.240 0.158 0.285 0.164 0.230 0.244 0.188MgO 33.240 32.191 32.880 32.187 32.979 30.343 32.263 30.385 31.414 28.845 31.033 30.273CaO 0.948 1.286 1.313 1.233 0.941 1.170 1.162 0.996 0.962 1.562 1.335 1.541Na2O 0.026 0.022 0.049 0.033 0.048 0.015 0.068 0.058 0.055 0.030 0.048 0.073NiO 0.000 0.000 0.000 0.022 0.020 0.000 0.000 0.000 0.126 0.097 0.089 0.079Cr2O3 0.346 0.250 0.237 0.337 0.412 0.078 0.646 0.282 0.451 0.057 0.201 0.051Total 99.808 99.045 100.204 99.871 99.838 100.171 98.715 99.597 98.620 99.030 99.570 98.890
Si 1.953 1.952 1.967 1.953 1.953 1.954 1.902 1.944 1.968 1.988 1.987 1.975Al IV 0.047 0.048 0.033 0.047 0.047 0.046 0.098 0.056 0.032 0.012 0.013 0.025Sum 2.000 2.000 2.000 2.000 2.000 2.000 2.000 2.000 2.000 2.000 2.000 2.000Al VI 0.016 0.002 0.000 0.003 0.022 0.012 0.040 0.019 0.027 0.046 0.013 0.004Ti 0.003 0.005 0.003 0.003 0.002 0.006 0.004 0.004 0.004 0.005 0.003 0.004Cr 0.010 0.007 0.007 0.009 0.011 0.002 0.018 0.008 0.013 0.002 0.006 0.001Fe+3 0.025 0.047 0.038 0.045 0.020 0.031 0.053 0.038 0.000 0.000 0.000 0.022Mg 1.725 1.696 1.708 1.684 1.712 1.599 1.696 1.608 1.657 1.532 1.630 1.611Fe+2 0.187 0.202 0.202 0.215 0.196 0.307 0.153 0.285 0.245 0.322 0.279 0.292Mn 0.005 0.007 0.005 0.006 0.005 0.007 0.005 0.009 0.005 0.007 0.007 0.006Ni 0.000 0.000 0.000 0.001 0.001 0.000 0.000 0.000 0.004 0.003 0.003 0.002Ca 0.035 0.049 0.049 0.046 0.035 0.044 0.044 0.038 0.036 0.060 0.050 0.059Na 0.002 0.002 0.003 0.002 0.003 0.001 0.005 0.004 0.004 0.002 0.003 0.005Total 2.008 2.016 2.015 2.015 2.007 2.011 2.018 2.013 1.994 1.978 1.995 2.007%En 87.22 84.75 85.32 84.32 86.99 80.39 86.96 81.31 85.27 79.76 82.88 80.99Fs 11.00 12.81 12.24 13.35 11.23 17.38 10.79 16.78 12.85 17.14 14.56 16.05Wo 1.79 2.43 2.45 2.32 1.78 2.23 2.25 1.92 1.88 3.10 2.56 2.96
Sample CHI77 (E2: (SiO2)adj = 62.72 %, MgO = 4.86%)
CHI28 (E2: (SiO2)adj = 63.97 %, MgO = 3.16%)
CHI02 (E2: (SiO2)adj = 63.73 %, MgO = 3.31%)*
Analysis Core Rim Core Rim Core Rim Core Rim Core Rim Core Rim%SiO2 55.666 54.461 55.226 54.729 54.528 55.625 54.454 55.148 53.80 55.66 55.89 55.23TiO2 0.107 0.244 0.110 0.197 0.191 0.223 0.224 0.215 0.27 0.21 0.23 0.21Al2O3 2.053 1.572 2.389 1.420 1.989 1.809 1.953 1.530 1.63 1.62 1.07 1.35FeOt 8.291 13.195 7.127 12.025 9.536 9.383 9.214 10.399 10.94 11.66 11.64 11.54MnO 0.195 0.342 0.095 0.209 0.206 0.237 0.200 0.231 0.27 0.22 0.31 0.32MgO 32.256 27.967 32.958 29.703 31.706 31.655 31.704 31.098 29.90 29.36 30.13 30.14CaO 0.831 1.605 1.088 1.388 1.216 1.358 1.340 1.078 1.42 1.16 1.29 1.26Na2O 0.043 0.012 0.050 0.028 0.002 0.006 0.021 0.009 0.03 0.05 0.02 0.02NiO 0.009 0.017 0.000 0.000 0.009 0.038 0.006 0.030 0.05 0.00 0.02 0.00Cr2O3 0.633 0.150 0.544 0.192 0.377 0.386 0.403 0.360 0.35 0.27 0.25 0.28Total 100.084 99.565 99.587 99.891 99.760 100.720 99.519 100.098 98.66 100.21 100.85 100.35
Si 1.942 1.957 1.928 1.949 1.924 1.941 1.924 1.944 1.935 1.967 1.965 1.953Al IV 0.058 0.043 0.072 0.051 0.076 0.059 0.076 0.056 0.065 0.033 0.035 0.047Sum 2.000 2.000 2.000 2.000 2.000 2.000 2.000 2.000 2.000 2.000 2.000 2.000Al VI 0.026 0.023 0.026 0.008 0.007 0.015 0.006 0.008 0.004 0.034 0.009 0.009Ti 0.003 0.007 0.003 0.005 0.005 0.006 0.006 0.006 0.007 0.006 0.006 0.006Cr 0.017 0.004 0.015 0.005 0.011 0.011 0.011 0.010 0.010 0.008 0.007 0.008Fe+3 0.018 0.005 0.043 0.044 0.072 0.033 0.072 0.041 0.058 0.000 0.011 0.031Mg 1.678 1.498 1.715 1.577 1.668 1.647 1.670 1.634 1.603 1.546 1.579 1.589Fe+2 0.224 0.391 0.165 0.314 0.209 0.241 0.201 0.266 0.271 0.344 0.331 0.310Mn 0.006 0.010 0.003 0.006 0.006 0.007 0.006 0.007 0.008 0.007 0.009 0.010Ni 0.000 0.000 0.000 0.000 0.000 0.001 0.000 0.001 0.001 0.000 0.001 0.000Ca 0.031 0.062 0.041 0.053 0.046 0.051 0.051 0.041 0.055 0.044 0.049 0.048Na 0.003 0.001 0.003 0.002 0.000 0.000 0.001 0.001 0.002 0.003 0.001 0.001Total 2.006 2.002 2.014 2.015 2.024 2.011 2.024 2.014 2.020 1.992 2.004 2.011%En 85.75 76.17 87.21 79.07 83.34 83.24 83.54 82.19 80.35 79.66 79.79 79.95Fs 12.66 20.69 10.72 18.27 14.37 14.19 13.92 15.76 16.90 18.08 17.76 17.65% Wo 1.59 3.14 2.07 2.66 2.30 2.57 2.54 2.05 2.74 2.26 2.45 2.40

12
VELASCO-TAPIA and VERMA / Turkish J Earth Sci
Appendix A6. Continued.
SampleCHI11 (DISQ:
(SiO2)adj = 61.20%, (MgO)adj = 4.43%)*
CHI08 (DISQ: (SiO2)adj = 61.63%,(MgO)adj = 4.17%)*
CHI21 (DISQ: (SiO2)adj = 64.32%,(MgO)adj = 3.39%)
Analysis Rim-ol Rim-ol Core Rim Core Rim Core Rim Core Core Core Core%SiO2 53.44 54.15 55.442 53.278 56.261 55.061 54.316 55.118 53.476 55.171 53.670 54.480TiO2 0.24 0.26 0.221 0.255 0.102 0.120 0.132 0.154 0.263 0.168 0.237 0.198Al2O3 2.29 2.65 1.471 3.063 0.953 1.827 2.414 1.589 3.302 1.689 1.864 1.291FeOt 16.79 15.36 9.316 14.014 8.394 8.891 11.773 9.653 9.288 13.029 12.322 13.561MnO 0.32 0.33 0.214 0.686 0.189 0.222 0.311 0.208 0.172 0.220 0.311 0.316MgO 24.22 23.21 30.754 26.732 31.990 31.406 28.995 31.054 30.673 28.849 28.514 28.797CaO 1.76 1.36 1.577 1.221 1.097 1.111 1.299 1.232 1.795 1.109 1.788 1.598Na2O 0.28 0.33 0.048 0.034 0.014 0.034 0.079 0.040 0.075 0.057 0.049 0.051NiO 0.03 0.06 0.082 0.096 0.186 0.143 0.024 0.149 0.058 0.013 0.000 0.032Cr2O3 0.03 0.04 0.332 0.079 0.258 0.471 0.188 0.317 0.514 0.361 0.187 0.108Total 99.400 97.750 99.46 99.46 99.44 99.29 99.53 99.51 99.62 100.67 98.94 100.43
Si 1.956 1.994 1.959 1.926 1.976 1.945 1.938 1.949 1.893 1.955 1.937 1.946Al IV 0.044 0.006 0.041 0.074 0.024 0.055 0.062 0.051 0.107 0.045 0.063 0.054Sum 2.000 2.000 2.000 2.000 2.000 2.000 2.000 2.000 2.000 2.000 2.000 2.000Al VI 0.055 0.109 0.020 0.056 0.015 0.021 0.040 0.015 0.031 0.025 0.016 0.000Ti 0.007 0.007 0.006 0.007 0.003 0.003 0.004 0.004 0.007 0.004 0.006 0.005Cr 0.001 0.001 0.009 0.002 0.007 0.013 0.005 0.009 0.014 0.010 0.005 0.003Fe+3 0.000 0.000 0.005 0.007 0.000 0.026 0.023 0.032 0.078 0.008 0.048 0.066Mg 1.322 1.274 1.620 1.440 1.675 1.654 1.542 1.637 1.619 1.524 1.534 1.533Fe+2 0.514 0.473 0.270 0.416 0.246 0.237 0.329 0.254 0.197 0.378 0.324 0.339Mn 0.010 0.010 0.006 0.021 0.006 0.007 0.009 0.006 0.005 0.007 0.010 0.010Ni 0.001 0.002 0.002 0.003 0.005 0.004 0.001 0.004 0.002 0.000 0.000 0.001Ca 0.069 0.054 0.060 0.047 0.041 0.042 0.050 0.047 0.068 0.042 0.069 0.061Na 0.020 0.024 0.003 0.002 0.001 0.002 0.005 0.003 0.005 0.004 0.003 0.004Sum 1.997 1.953 2.002 2.002 1.999 2.009 2.008 2.011 2.026 2.003 2.016 2.022%En 69.03 70.35 82.60 74.55 85.09 84.16 78.99 82.87 82.30 77.80 77.30 76.32Fs 27.36 26.68 14.36 23.01 12.81 13.70 18.47 14.76 14.24 20.05 19.22 20.63Wo 3.60 2.96 3.04 2.45 2.10 2.14 2.54 2.36 3.46 2.15 3.48 3.04
Sample
CHI79 (DISQ: (SiO2)adj = 63.51%, (MgO)adj = 1.90%)
CHI49 (DISQ: (SiO2)adj = 65.04%, (MgO)adj = 2.99%)
CHI10 (DISQ: (SiO2)adj = 63.47%, (MgO)adj = 3.34%)*
Analysis Rim-bt Rim-bt Core Rim Core Rim Core Rim Core Core Core Core%SiO2 53.580 53.743 55.32 56.53 55.08 54.77 54.94 54.95 55.936 55.127 56.014 55.739TiO2 0.473 0.462 0.13 0.18 0.16 0.10 0.18 0.18 0.144 0.155 0.179 0.151Al2O3 1.891 1.902 1.94 2.21 1.69 1.85 2.13 2.06 1.459 1.867 1.761 1.678FeOt 10.102 10.302 9.56 10.05 10.17 9.36 9.43 11.18 7.416 7.783 8.204 7.623MnO 0.298 0.243 0.13 0.19 0.31 0.25 0.20 0.27 0.144 0.139 0.144 0.142MgO 30.075 30.259 30.64 28.46 30.53 30.01 30.85 29.43 33.080 32.679 32.221 32.819CaO 1.841 2.068 1.18 1.17 1.30 1.20 1.29 1.24 1.106 1.159 0.935 1.004Na2O 0.057 0.047 0.05 0.26 0.05 0.04 0.06 0.04 0.066 0.026 0.027 0.032NiO 0.047 0.051 0.00 0.04 0.00 0.01 0.00 0.00 0.060 0.045 0.037 0.041Cr2O3 0.015 0.000 0.41 0.21 0.37 0.40 0.39 0.33 0.424 0.560 0.403 0.430Total 98.379 99.077 99.360 99.300 99.660 97.990 99.470 99.680 99.835 99.540 99.925 99.659
Si 1.927 1.922 1.954 1.995 1.949 1.961 1.941 1.951 1.950 1.933 1.954 1.947Al IV 0.073 0.078 0.046 0.005 0.051 0.039 0.059 0.049 0.050 0.067 0.046 0.053Sum 2.000 2.000 2.000 2.000 2.000 2.000 2.000 2.000 2.000 2.000 2.000 2.000Al VI 0.007 0.002 0.035 0.087 0.020 0.039 0.029 0.037 0.010 0.010 0.027 0.016Ti 0.013 0.012 0.003 0.005 0.004 0.003 0.005 0.005 0.004 0.004 0.005 0.004Cr 0.000 0.000 0.011 0.006 0.010 0.011 0.011 0.009 0.012 0.016 0.011 0.012Fe+3 0.066 0.081 0.000 0.000 0.024 0.000 0.021 0.000 0.038 0.052 0.000 0.028Mg 1.612 1.613 1.614 1.497 1.611 1.602 1.625 1.557 1.719 1.708 1.676 1.709Fe+2 0.238 0.227 0.282 0.297 0.277 0.280 0.258 0.332 0.179 0.177 0.239 0.195Mn 0.009 0.007 0.004 0.006 0.009 0.008 0.006 0.008 0.004 0.004 0.004 0.004Ni 0.001 0.001 0.000 0.001 0.000 0.000 0.000 0.000 0.002 0.001 0.001 0.001Ca 0.071 0.079 0.045 0.044 0.049 0.046 0.049 0.047 0.041 0.044 0.035 0.038Na 0.004 0.003 0.003 0.018 0.003 0.003 0.004 0.003 0.004 0.002 0.002 0.002Total 2.022 2.027 1.998 1.960 2.008 1.993 2.007 1.998 2.013 2.017 2.000 2.009
%En 80.77 80.34 82.98 81.21 81.75 82.75 82.98 80.09 86.79 86.10 85.75 86.60Fs 15.67 15.71 14.72 16.39 15.75 14.87 14.53 17.48 11.13 11.71 12.46 11.50Wo 3.55 3.95 2.30 2.40 2.50 2.38 2.49 2.43 2.09 2.19 1.79 1.90
* Geochemical and Sr-Nd isotopic whole-rock composition reported by Verma (1999).

13
VELASCO-TAPIA and VERMA / Turkish J Earth Sci
Appendix A7. Representative compositional data and structural formula for clinopyroxene in volcanic rocks from the SCN.
Sample CHI31 (E2: (SiO2)adj= 60.67%, (MgO)adj= 5.48%) CHI71 (E2: (SiO2)adj= 61.01%, (MgO)adj= 4.66%)
Analysis Core Rim Core Rim Core Rim Core Inter Rim Core Inter Rim%SiO2 53.022 51.857 53.078 51.958 52.075 51.170 51.769 52.911 52.528 53.261 52.134 52.445TiO2 0.397 0.463 0.370 0.443 0.450 0.737 0.736 0.453 0.394 0.354 0.395 0.403Al2O3 1.706 2.496 1.622 2.393 1.727 3.257 3.320 2.113 2.018 1.311 1.964 1.985FeOt 5.099 5.247 4.466 4.677 5.170 6.443 5.941 5.629 5.634 4.740 5.295 5.393MnO 0.187 0.089 0.118 0.161 0.112 0.129 0.181 0.101 0.112 0.187 0.176 0.136MgO 17.663 17.515 17.645 17.295 17.342 16.947 16.148 16.901 17.071 18.502 17.139 16.900CaO 21.533 21.337 22.117 21.639 21.979 20.313 21.655 22.207 22.063 21.085 22.215 21.962Na2O 0.252 0.291 0.263 0.247 0.231 0.296 0.329 0.304 0.308 0.208 0.240 0.228NiO 0.073 0.000 0.020 0.000 0.006 0.006 0.000 0.000 0.004 0.118 0.015 0.041Cr2O3 0.415 0.482 0.214 0.411 0.051 0.138 0.221 0.133 0.109 0.220 0.139 0.200Sum 100.347 99.777 99.913 99.224 99.143 99.436 100.300 100.752 100.241 99.986 99.712 99.693
Si 1.937 1.908 1.943 1.918 1.929 1.893 1.900 1.930 1.927 1.946 1.923 1.932Al IV 0.063 0.092 0.057 0.082 0.071 0.107 0.100 0.070 0.073 0.054 0.077 0.068Sum 2.000 2.000 2.000 2.000 2.000 2.000 2.000 2.000 2.000 2.000 2.000 2.000Al VI 0.010 0.016 0.013 0.022 0.004 0.035 0.043 0.021 0.014 0.002 0.008 0.019Ti 0.011 0.013 0.010 0.012 0.013 0.021 0.020 0.012 0.011 0.010 0.011 0.011Cr 0.012 0.014 0.006 0.012 0.001 0.004 0.006 0.004 0.003 0.006 0.004 0.006Fe+3 0.056 0.086 0.055 0.062 0.085 0.072 0.049 0.062 0.083 0.061 0.089 0.056Mg 0.962 0.961 0.963 0.952 0.958 0.935 0.883 0.919 0.934 1.008 0.942 0.928Fe+2 0.100 0.075 0.082 0.083 0.075 0.128 0.133 0.110 0.090 0.084 0.074 0.111Mn 0.006 0.003 0.004 0.005 0.004 0.004 0.006 0.003 0.003 0.006 0.005 0.004Ni 0.002 0.000 0.001 0.000 0.000 0.000 0.000 0.000 0.000 0.003 0.000 0.001Ca 0.843 0.841 0.867 0.856 0.872 0.805 0.851 0.868 0.867 0.825 0.878 0.867Na 0.018 0.021 0.019 0.018 0.017 0.021 0.023 0.022 0.022 0.015 0.017 0.016Total 2.019 2.029 2.018 2.021 2.028 2.024 2.016 2.021 2.028 2.020 2.030 2.019%En 48.92 48.87 48.86 48.64 48.04 48.10 45.95 46.85 47.22 50.80 47.38 47.23Fs 8.22 8.35 7.12 7.63 8.21 10.47 9.77 8.91 8.92 7.59 8.49 8.67Wo 42.86 42.78 44.01 43.73 43.75 41.43 44.28 44.24 43.86 41.60 44.13 44.10
SampleCHI03 (E2: (SiO2)adj= 61.96 %,
(MgO)adj= 5.25%)
CHI77 (E2: (SiO2)adj= 62.72 %, (MgO)adj= 4.86%)
CHI29 (E2: (SiO2)adj= 64.34 %, (MgO)adj= 2.81%)
Analysis Core Core Core Core Core Core Core Rim Core Rim Core Rim%SiO2 53.103 52.686 51.898 52.548 53.197 51.382 50.660 50.709 51.202 52.427 52.462 52.184TiO2 0.369 0.453 0.374 0.385 0.281 0.739 0.532 0.599 0.574 0.406 0.524 0.287Al2O3 1.362 2.175 1.936 1.908 1.686 2.407 4.142 4.001 2.952 1.734 2.360 2.024FeOt 5.566 5.553 5.019 5.074 5.780 7.623 7.844 8.241 7.681 6.401 7.158 6.242MnO 0.137 0.212 0.126 0.207 0.138 0.158 0.247 0.206 0.195 0.209 0.204 0.163MgO 17.432 16.598 16.398 16.999 16.937 16.006 14.199 14.493 15.591 16.258 15.532 15.786CaO 20.732 21.978 21.861 21.677 21.786 20.685 20.664 20.630 21.157 21.324 21.588 21.103Na2O 0.271 0.298 0.262 0.235 0.349 0.274 0.645 0.578 0.349 0.303 0.383 0.403NiO 0.047 0.047 0.026 0.000 0.047 0.032 0.000 0.032 0.000 0.000 0.000 0.017Cr2O3 0.144 0.208 0.154 0.187 0.217 0.073 0.110 0.077 0.094 0.178 0.087 0.341Total 99.160 100.210 98.050 99.220 100.418 99.379 99.043 99.566 99.795 99.240 100.298 98.550
Si 1.959 1.932 1.941 1.940 1.947 1.914 1.897 1.892 1.903 1.946 1.933 1.949Al IV 0.041 0.068 0.059 0.060 0.053 0.086 0.103 0.108 0.097 0.054 0.067 0.051Sum 2.000 2.000 2.000 2.000 2.000 2.000 2.000 2.000 2.000 2.000 2.000 2.000Al VI 0.019 0.026 0.027 0.023 0.019 0.020 0.079 0.068 0.032 0.022 0.036 0.038Ti 0.010 0.012 0.011 0.011 0.008 0.021 0.015 0.017 0.016 0.011 0.015 0.008Cr 0.004 0.006 0.005 0.005 0.006 0.002 0.003 0.002 0.003 0.005 0.003 0.010Fe+3 0.025 0.047 0.038 0.039 0.055 0.062 0.056 0.070 0.082 0.039 0.039 0.025Mg 0.959 0.908 0.914 0.936 0.924 0.889 0.792 0.806 0.864 0.900 0.853 0.879Fe+2 0.147 0.124 0.119 0.118 0.121 0.175 0.189 0.187 0.157 0.160 0.181 0.170Mn 0.004 0.007 0.004 0.006 0.004 0.005 0.008 0.007 0.006 0.007 0.006 0.005Ni 0.001 0.001 0.001 0.000 0.001 0.001 0.000 0.001 0.000 0.000 0.000 0.001Ca 0.820 0.864 0.876 0.858 0.854 0.826 0.829 0.824 0.842 0.848 0.852 0.844Na 0.019 0.021 0.019 0.017 0.025 0.020 0.047 0.042 0.025 0.022 0.027 0.029Total 2.008 2.016 2.013 2.013 2.019 2.021 2.019 2.023 2.027 2.013 2.013 2.008%En 49.06 46.59 46.86 47.83 47.16 45.43 42.27 42.55 44.28 46.07 44.15 45.70Fs 9.01 9.08 8.25 8.34 9.25 12.39 13.52 13.92 12.55 10.51 11.74 10.40Wo 41.93 44.33 44.89 43.83 43.59 42.19 44.21 43.53 43.18 43.42 44.10 43.90

14
VELASCO-TAPIA and VERMA / Turkish J Earth Sci
Appendix A7. Continued.
Sample CHI21 (DISQ: (SiO2)adj= 63.48%,(MgO)adj= 3.51%)
CHI69 (E1:(SiO2)adj= 55.30%, (MgO)adj= 6.12%)
CHI11 (DISQ:(SiO2)adj= 61.20%, (MgO)adj= 4.43%)*
CHI08 (DISQ: (SiO2)adj= 61.63%, (MgO)adj= 4.17%)*
Analysis Core Rim Core Rim Core Rim Core Rim Core Rim Core Rim%SiO2 50.300 51.800 51.562 51.589 52.860 52.868 51.081 51.751 53.47 53.58 51.501 51.308TiO2 0.810 0.627 0.477 0.377 0.338 0.315 0.790 0.659 0.06 0.06 0.595 0.508Al2O3 3.581 2.493 2.831 1.640 1.477 1.549 3.317 3.175 0.31 1.56 2.461 2.692FeOt 7.701 6.639 6.498 7.312 6.440 5.885 5.673 5.489 7.46 8.48 5.651 5.742MnO 0.171 0.128 0.131 0.256 0.225 0.185 0.190 0.071 0.20 0.23 0.175 0.071MgO 15.311 15.763 16.393 16.521 17.007 17.409 16.156 16.237 15.25 15.17 16.995 14.451CaO 22.279 22.704 22.006 22.327 21.081 21.720 21.083 21.650 21.89 19.95 21.418 24.318Na2O 0.316 0.354 0.474 0.247 0.298 0.344 0.335 0.416 0.24 0.51 0.307 0.314NiO 0.000 0.000 0.000 0.012 0.017 0.000 0.022 0.054 0.03 0.00 0.114 0.041Cr2O3 0.090 0.106 0.106 0.030 0.070 0.145 0.674 0.733 0.00 0.00 0.219 0.009Total 100.56 100.61 100.48 100.310 99.810 100.420 99.321 100.235 98.91 99.54 99.440 99.450
Si 1.865 1.908 1.898 1.913 1.949 1.937 1.893 1.899 2.000 1.987 1.907 1.913Al IV 0.135 0.092 0.102 0.087 0.051 0.063 0.107 0.101 0.000 0.013 0.093 0.087Sum 2.000 2.000 2.000 2.000 2.000 2.000 2.000 2.000 2.000 2.000 2.000 2.000Al VI 0.021 0.016 0.021 0.015 0.013 0.004 0.038 0.037 0.013 0.055 0.014 0.031Ti 0.023 0.017 0.013 0.011 0.009 0.009 0.022 0.018 0.002 0.002 0.017 0.014Cr 0.003 0.003 0.003 0.001 0.002 0.004 0.020 0.021 0.000 0.000 0.006 0.000Fe+3 0.132 0.094 0.127 0.146 0.058 0.092 0.045 0.053 0.001 0.000 0.091 0.075Mg 0.846 0.866 0.900 0.913 0.935 0.951 0.892 0.888 0.850 0.839 0.938 0.803Fe+2 0.107 0.110 0.073 0.081 0.141 0.088 0.131 0.115 0.232 0.263 0.083 0.104Mn 0.005 0.004 0.004 0.008 0.007 0.006 0.006 0.002 0.006 0.007 0.005 0.002Ni 0.000 0.000 0.000 0.000 0.001 0.000 0.001 0.002 0.001 0.000 0.003 0.001Ca 0.885 0.896 0.868 0.887 0.833 0.853 0.837 0.851 0.877 0.793 0.850 0.971Na 0.023 0.025 0.034 0.018 0.021 0.024 0.024 0.030 0.017 0.037 0.022 0.023Total 2.044 2.032 2.043 2.049 2.019 2.031 2.015 2.018 2.000 1.995 2.031 2.025%En 42.84 43.94 45.63 44.88 47.38 47.80 46.70 46.51 43.23 44.11 47.66 41.07Fs 12.36 10.58 10.35 11.54 10.42 9.35 9.51 8.93 12.18 14.21 9.17 9.27Wo 44.80 45.48 44.02 43.58 42.20 42.85 43.79 44.56 44.59 41.68 43.17 49.66
* Geochemical and Sr-Nd isotopic whole-rock composition reported by Verma (1999).

15
VELASCO-TAPIA and VERMA / Turkish J Earth Sci
Appendix A8. Representative compositional data and structural formula for plagioclase in volcanic rocks from the SCN.
Sample CHI64 (HMI: (SiO2)adj= 53.64 %, (MgO)adj= 8.67%)
%SiO2 52.369 52.125 52.890 51.808 52.200 52.203 52.224 52.801 52.419TiO2 0.054 0.111 0.071 0.071 0.083 0.071 0.065 0.081 0.009Al2O3 30.129 30.545 30.196 29.934 29.380 30.292 29.664 30.523 30.247FeOt 0.589 0.613 0.619 0.666 0.545 0.666 0.554 0.517 0.631MnO 0.000 0.000 0.066 0.040 0.012 0.000 0.000 0.000 0.000MgO 0.169 0.218 0.174 0.238 0.253 0.185 0.181 0.144 0.180CaO 13.213 13.455 12.655 13.302 13.163 13.282 13.114 13.458 13.245Na2O 3.897 3.828 4.354 3.898 3.867 3.987 3.820 3.993 4.266K2O 0.126 0.116 0.145 0.115 0.167 0.118 0.125 0.121 0.125BaO 0.000 0.000 0.000 0.000 0.000 0.000 0.000 0.000 0.000SrO 0.041 0.000 0.033 0.000 0.000 0.000 0.000 0.000 0.033Total 100.587 101.011 101.203 100.072 99.670 100.804 99.747 101.638 101.155
Si 2.368 2.350 2.377 2.359 2.382 2.358 2.380 2.363 2.362Ti 0.002 0.004 0.002 0.002 0.003 0.002 0.002 0.003 0.000Al 1.606 1.623 1.600 1.607 1.581 1.613 1.593 1.611 1.607Fe+3 0.020 0.021 0.021 0.023 0.019 0.023 0.019 0.017 0.021Sum 3.997 3.997 4.000 3.991 3.985 3.997 3.994 3.994 3.990Mg 0.011 0.015 0.012 0.016 0.017 0.012 0.012 0.010 0.012Mn 0.000 0.000 0.003 0.002 0.000 0.000 0.000 0.000 0.000Ca 0.640 0.650 0.609 0.649 0.644 0.643 0.640 0.645 0.639Na 0.342 0.335 0.379 0.344 0.342 0.349 0.337 0.347 0.373K 0.007 0.007 0.008 0.007 0.010 0.007 0.007 0.007 0.007Sr 0.001 0.000 0.001 0.000 0.000 0.000 0.000 0.000 0.001Total 1.002 1.006 1.012 1.017 1.013 1.011 0.997 1.009 1.032%An 64.722 65.570 61.116 64.911 64.653 64.359 65.000 64.616 62.733Ab 34.543 33.757 38.050 34.421 34.370 34.960 34.262 34.692 36.562Or 0.735 0.673 0.834 0.668 0.977 0.681 0.738 0.692 0.705
Sample CHI33 (E1: (SiO2)adj= 56.95%, (MgO)adj= 6.20%) CHI63 (DISQ: (SiO2)adj= 59.07%, (MgO)adj= 4.78%)
CHI27 (E1: (SiO2)adj= 59.91%,MgO= 4.47%)
%SiO2 50.766 51.301 51.417 50.479 52.335 53.740 52.674 52.938TiO2 0.044 0.043 0.039 0.037 0.044 0.062 0.039 0.088Al2O3 30.663 29.869 29.979 30.295 29.873 28.586 29.066 28.858FeOt 0.424 0.528 0.468 0.450 0.549 0.414 0.659 0.648MnO 0.000 0.000 0.000 0.000 0.000 0.000 0.020 0.000MgO 0.189 0.102 0.153 0.146 0.129 0.123 0.156 0.172CaO 14.687 13.794 14.095 14.242 13.177 11.808 13.066 12.779Na2O 3.562 3.912 3.813 3.632 4.118 4.670 4.386 4.666K2O 0.111 0.148 0.117 0.131 0.175 0.183 0.234 0.257BaO 0.035 0.017 0.000 0.007 0.000 0.000 0.000 0.022SrO 0.000 0.000 0.038 0.023 0.000 0.000 0.009 0.012Total 100.481 99.714 100.119 99.442 100.400 99.586 100.309 100.440
Si 2.311 2.348 2.345 2.320 2.373 2.443 2.394 2.403Ti 0.002 0.001 0.001 0.001 0.002 0.002 0.001 0.003Al 1.646 1.612 1.612 1.641 1.597 1.532 1.557 1.544Fe+3 0.015 0.018 0.016 0.016 0.019 0.014 0.023 0.022Sum 3.973 3.980 3.974 3.978 3.990 3.992 3.975 3.972Mg 0.013 0.007 0.010 0.010 0.009 0.008 0.011 0.012Mn 0.000 0.000 0.000 0.000 0.000 0.000 0.001 0.000Ca 0.716 0.677 0.689 0.701 0.640 0.575 0.636 0.622Na 0.314 0.347 0.337 0.324 0.362 0.412 0.387 0.411K 0.006 0.009 0.007 0.008 0.010 0.011 0.014 0.015Ba 0.001 0.000 0.000 0.000 0.000 0.000 0.000 0.000Sr 0.000 0.000 0.001 0.001 0.000 0.000 0.000 0.000Total 1.051 1.040 1.044 1.043 1.021 1.006 1.048 1.059
An 69.067 65.532 66.693 67.915 63.238 57.666 61.397 59.359Ab 30.311 33.631 32.648 31.341 35.762 41.270 37.294 39.220Or 0.622 0.837 0.659 0.744 1.000 1.064 1.309 1.421

16
VELASCO-TAPIA and VERMA / Turkish J Earth Sci
Appendix A8. Continued.
Sample CHI79 (DISQ: (SiO2)adj= 63.51%, (MgO)adj= 1.90%)
CHI69 (E1: (SiO2)adj= 55.30%, (MgO)adj= 6.12%)
CHI10 (DISQ: (SiO2)adj 63.47%,MgO= 3.34%)*
CHI49 (DISQ: (SiO2)adj= 65.04%,MgO= 2.99%)
%SiO2 53.012 53.037 51.928 51.091 55.643 56.436 61.63 61.48TiO2 0.117 0.072 0.044 0.078 0.037 0.045 0.00 0.00Al2O3 29.184 28.983 30.078 30.710 26.718 26.471 23.85 24.40FeOt 0.733 0.688 0.632 0.630 0.582 0.125 0.14 0.10MnO 0.000 0.000 0.000 0.030 0.000 0.000 0.04 0.00MgO 0.084 0.091 0.121 0.136 0.021 0.011 0.02 0.01CaO 12.064 11.842 13.330 13.550 9.758 9.053 5.55 5.73Na2O 4.497 4.595 3.759 3.741 6.007 6.269 8.61 7.96K2O 0.238 0.227 0.186 0.163 0.447 0.341 0.52 0.50BaO 0.000 0.058 0.026 0.000 0.000 0.000 0.000 0.000SrO 0.000 0.015 0.006 0.048 0.000 0.000 0.000 0.000Total 99.929 99.608 100.110 100.177 99.213 98.751 100.360 100.180
Si 2.410 2.418 2.362 2.327 2.534 2.567 2.735 2.726Ti 0.004 0.002 0.002 0.003 0.001 0.002 0.000 0.000Al 1.564 1.558 1.613 1.649 1.434 1.420 1.248 1.276Fe+3 0.025 0.024 0.022 0.022 0.020 0.004 0.005 0.003Sum 4.003 4.002 3.998 4.000 3.989 3.992 3.988 4.005Mg 0.006 0.006 0.008 0.009 0.001 0.001 0.001 0.001Mn 0.000 0.000 0.000 0.001 0.000 0.000 0.002 0.000Ca 0.588 0.578 0.650 0.661 0.476 0.441 0.264 0.272Na 0.396 0.406 0.332 0.330 0.530 0.553 0.741 0.684K 0.014 0.013 0.011 0.009 0.026 0.020 0.029 0.028Ba 0.000 0.001 0.000 0.000 0.000 0.000 0.000 0.000Sr 0.000 0.000 0.000 0.001 0.000 0.000 0.000 0.000Total 1.003 1.005 1.001 1.013 1.034 1.015 1.037 0.986%An 58.892 57.972 65.492 66.054 46.115 43.517 25.518 27.642Ab 39.725 40.705 33.420 33.000 51.370 54.531 71.635 69.486Or 1.383 1.323 1.088 0.946 2.515 1.952 2.847 2.872
* Geochemical and Sr-Nd isotopic whole-rock composition reported by Verma (1999).

17
VELASCO-TAPIA and VERMA / Turkish J Earth Sci
Appendix A9. Compositional data and structural formula for plagioclase phenocrysts with oscillatory zonation in volcanic rocks (DISQ-group) from the SCN.
(a) CHI10 ((SiO2)adj= 63.5%, (MgO)adj= 3.34%; data from Verma 1999)
Analysis 1(Core) 2 3 4 5 6 7 8 9 10 (Rim)%SiO2 58.396 59.836 57.155 57.376 58.090 56.981 58.953 59.934 60.812 60.847TiO2 0.020 0.000 0.044 0.000 0.031 0.018 0.000 0.000 0.000 0.000Al2O3 25.279 24.712 26.608 26.151 25.616 26.705 25.487 24.447 23.935 23.991FeOt 0.162 0.102 0.135 0.142 0.172 0.087 0.105 0.085 0.057 0.157MnO 0.045 0.033 0.003 0.011 0.000 0.000 0.000 0.011 0.000 0.000MgO 0.000 0.000 0.021 0.005 0.011 0.014 0.019 0.026 0.025 0.000CaO 7.580 6.882 8.864 8.655 7.790 8.899 7.522 6.808 6.372 6.153Na2O 7.276 7.621 6.585 6.700 6.901 6.667 7.173 7.635 7.477 7.397K2O 0.336 0.361 0.225 0.391 0.671 0.233 0.384 0.451 0.918 1.014Total 99.094 99.547 99.640 99.431 99.282 99.604 99.643 99.397 99.596 99.559
Si 2.638 2.682 2.574 2.591 2.623 2.569 2.644 2.690 2.722 2.724Ti 0.001 0.000 0.001 0.000 0.001 0.001 0.000 0.000 0.000 0.000Al 1.346 1.306 1.413 1.392 1.364 1.419 1.348 1.294 1.263 1.266Fe+3 0.006 0.003 0.005 0.005 0.006 0.003 0.004 0.003 0.002 0.005Sum 3.990 3.991 3.993 3.988 3.994 3.991 3.995 3.987 3.987 3.996Mg 0.000 0.000 0.001 0.000 0.001 0.001 0.001 0.002 0.002 0.000Mn 0.002 0.001 0.000 0.000 0.000 0.000 0.000 0.000 0.000 0.000Ca 0.367 0.331 0.428 0.419 0.377 0.430 0.362 0.327 0.306 0.295Na 0.637 0.662 0.575 0.587 0.604 0.583 0.624 0.665 0.649 0.642K 0.019 0.021 0.013 0.023 0.039 0.013 0.022 0.026 0.052 0.058Total 1.025 1.015 1.017 1.029 1.021 1.027 1.009 1.020 1.009 0.995%An 35.845 32.612 42.114 40.740 36.960 41.896 35.889 32.172 30.350 29.659Ab 62.263 65.351 56.614 57.069 59.249 56.798 61.930 65.290 64.444 64.521Or 1.892 2.037 1.273 2.191 3.791 1.306 2.181 2.538 5.206 5.820
(b) CHI79 ((SiO2)adj = 63.51%, (MgO)adj = 1.90%)
Analysis 1 (Core) 2 3 4 5 6 7 8 9 (Rim)
%SiO2 46.598 47.548 47.963 48.348 48.794 47.937 47.843 48.705 46.942TiO2 0.000 0.000 0.020 0.032 0.014 0.023 0.048 0.039 0.000Al2O3 34.263 34.031 33.348 33.075 33.003 33.789 33.451 33.056 34.233FeOt 0.365 0.396 0.389 0.339 0.377 0.365 0.330 0.398 0.497MnO 0.000 0.000 0.038 0.000 0.000 0.000 0.000 0.000 0.027MgO 0.047 0.078 0.052 0.044 0.035 0.030 0.064 0.045 0.051CaO 17.610 17.268 16.585 15.871 16.304 16.747 16.865 16.058 17.273Na2O 1.625 1.759 2.161 2.357 2.308 1.946 2.037 2.290 1.685K2O 0.035 0.019 0.034 0.036 0.054 0.041 0.044 0.049 0.039BaO 0.000 0.060 0.000 0.000 0.051 0.000 0.000 0.003 0.028SrO 0.000 0.022 0.016 0.000 0.000 0.000 0.001 0.010 0.012Total 100.543 101.181 100.606 100.102 100.940 100.878 100.683 100.653 100.787
Si 2.135 2.161 2.189 2.211 2.217 2.181 2.183 2.216 2.144Ti 0.000 0.000 0.001 0.001 0.000 0.001 0.002 0.001 0.000Al 1.850 1.824 1.795 1.784 1.767 1.812 1.799 1.773 1.844Fe+3 0.013 0.014 0.013 0.012 0.013 0.012 0.011 0.014 0.017Sum 3.998 3.999 3.998 4.008 3.997 4.006 3.995 4.005 4.005Mg 0.003 0.005 0.004 0.003 0.002 0.002 0.004 0.003 0.003Mn 0.000 0.000 0.001 0.000 0.000 0.000 0.000 0.000 0.001Ca 0.864 0.841 0.811 0.778 0.794 0.816 0.824 0.783 0.845Na 0.144 0.155 0.191 0.209 0.203 0.172 0.180 0.202 0.149K 0.002 0.001 0.002 0.002 0.003 0.002 0.003 0.003 0.002Ba 0.000 0.001 0.000 0.000 0.001 0.000 0.000 0.000 0.001Sr 0.000 0.001 0.000 0.000 0.000 0.000 0.000 0.000 0.000Total 1.014 1.004 1.010 0.992 1.003 0.992 1.012 0.991 1.002%An 85.518 84.343 80.761 78.651 79.358 82.428 81.855 79.259 84.802Ab 14.280 15.547 19.042 21.136 20.329 17.332 17.891 20.453 14.970Or 0.202 0.110 0.197 0.212 0.313 0.240 0.254 0.288 0.228

18
VELASCO-TAPIA and VERMA / Turkish J Earth Sci
Appendix A10. Compositional data and structural formula for biotite in volcanic rocks (CHI21: (SiO2)adj= 64.32%, (MgO)adj= 3.39%) from the SCN.
Analysis 1 2%SiO2 42.988 42.885TiO2 2.163 2.157Al2O3 10.552 10.549FeOT 15.747 15.658MnO 0.250 0.260MgO 19.385 19.298CaO 8.583 8.562Na2O 1.700 1.705K2O 0.088 0.078Total 101.460 101.150
Si 5.87 5.87Al IV 2.13 2.13Sum 8.00 8.00Ti 0.22 0.22Mg 3.95 3.94Fe+2 1.80 1.79Mn 0.03 0.03Total 6.00 5.98Ca 1.26 1.26Na 0.45 0.45K 0.02 0.01Total 1.72 1.72
Sum of cations 15.72 15.71
Fe+2 / (Fe+2 + Mg) 0.31 0.31

19
VELASCO-TAPIA and VERMA / Turkish J Earth SciA
ppen
dix
A11
. Ave
rage
com
posit
ions
of t
he S
CN
vol
cani
c roc
ks u
sed
in g
eoch
emic
al m
odel
ing.
Elem
ent
M (
mafi
c mag
mas
)H
MI (
high
-Mg
inte
rmed
iate
mag
mas
)
BTB
BTA
BABA
BTA
n– x
sn
– xs
n– x
sn
– xs
n– x
sn
– xs
(SiO
2) adj
1250
.70.
98
50.6
0.6
1552
.08
0.39
852
.41
0.25
2553
.90.
66
54.0
0.7
(TiO
2) adj
121.
760.
118
1.84
0.13
141.
670.
098
1.60
0.15
261.
040.
316
1.03
0.17
(Al 2O
3) adj
1116
.08
0.36
815
.88
0.36
1515
.80.
68
15.9
10.
4225
15.7
80.
416
15.7
0.6
(Fe 2O
3) adj
121.
530.
078
2.14
0.08
142.
210.
068
1.96
0.09
251.
720.
106
1.87
0.09
(FeO
) adj
127.
670.
338
7.12
0.25
146.
320.
168
6.55
0.29
255.
740.
336
5.33
0.26
(MnO
) adj
120.
155
0.00
68
0.15
00.
007
150.
149
0.00
98
0.14
40.
010
260.
131
0.00
96
0.12
60.
005
(MgO
) adj
128.
570.
348
8.1
0.5
158.
10.
68
8.3
0.5
268.
90.
86
8.7
0.8
(CaO
) adj
128.
50.
88
8.44
0.37
157.
570.
308
7.75
0.45
267.
680.
256
7.46
0.24
(Na 2O
) adj
123.
560.
277
3.88
0.13
154.
320.
207
3.56
0.08
263.
610.
306
4.35
0.17
(K2O
) adj
121.
100.
238
1.20
0.10
151.
260.
118
1.28
0.14
261.
010.
136
1.17
0.28
(P2O
5) adj
120.
450.
068
0.55
0.07
140.
480.
118
0.47
0.10
240.
200.
056
0.27
00.
032
Mg#
1266
.56
1.41
867
.01.
615
69.2
2.1
869
.31.
926
73.0
3.0
674
.41.
4La
817
.73.
87
21.7
1.2
1024
53
205
916
76
16.7
4.5
Ce
742
107
49.3
1.8
958
113
4410
935
106
407
Pr3
5.4
1.8
19.
73
5.8
1.6
34.
11.
4N
d7
226
726
.43.
81
413
246
719
5Sm
75.
21.
46
5.9
0.21
18.
43
5.3
1.0
74.
61.
1Eu
81.
720.
397
1.92
0.13
22.
200.
363
1.83
0.31
71.
480.
33G
d3
5.5
2.1
25.
93.
23
5.3
0.7
34.
01.
0Tb
80.
800.
177
0.87
0.08
30.
870.
393
0.85
0.08
70.
680.
15D
y1
2.97
34.
820.
433
3.9
0.8
Ho
30.
900.
342
1.0
0.6
30.
950.
103
0.77
0.15
Er3
2.5
0.9
22.
71.
43
2.73
0.21
32.
150.
30Tm
30.
360.
142
0.39
0.20
30.
395
0.02
33
0.31
0.05
Yb7
2.5
0.6
72.
900.
271
4.36
32.
410.
137
2.18
0.40
Lu7
0.36
0.11
70.
379
0.03
81
0.66
30.
377
0.02
07
0.31
0.07
Ba8
250
608
325
110
1235
060
333
911
023
248
166
370
90C
o8
395
736
.32.
02
4113
336
.63.
25
32.3
0.8
Cr
828
138
728
18
424
735
330
131
2242
010
0H
f6
4.3
0.6
54.
280.
221
4.47
34.
40.
67
3.9
0.6
Nb
318
.21.
51
2310
20.3
5.7
312
.62.
116
5.0
1.2
66.
52.
6N
i8
146
148
153
2112
162
263
144
3823
213
386
197
43Pb
28.
50.
73
9.7
4.2
28
51
6.0
Rb7
18.1
3.5
522
.23.
212
23.8
2.1
321
.31.
522
19.5
2.9
621
5Sc
223
.52.
12
224
20.1
1.2
Sr8
502
508
507
3911
506
263
520
9019
395
246
560
100
Ta6
1.05
0.32
71.
070.
241
1.19
30.
900.
267
0.64
0.33
Th6
1.74
0.25
61.
870.
081
2.78
32.
530.
417
2.2
0.6
U6
0.57
0.20
60.
780.
151
0.77
20.
750.
214
0.74
0.32
V6
157
187
149
163
148
173
157.
72.
022
154
7Y
729
.42.
68
30.8
1.8
1131
.93.
93
25.3
1.5
2320
.53.
65
23.4
0.5
Zr8
199
208
228
3012
240
503
183
2717
128
86
150
25

20
VELASCO-TAPIA and VERMA / Turkish J Earth SciA
ppen
dix
A11
. Con
tinue
d.
Elem
ent
E1 (o
l + o
px ±
cpx
± p
lg e
volv
ed-t
ype
mag
mas
)E2
(opx
± c
px ±
plg
evo
lved
-typ
e m
agm
as)
BTA
BATA
ABT
A +
TA
+ B
AA
D
n– x
sn
– xs
n– x
sn
– xs
n– x
sn
– xs
n– x
sSi
O2
3054
.41.
417
56.0
0.6
558
.21.
737
59.5
1.1
555
.10.
660
61.0
1.0
3064
.51.
1Ti
O2
301.
520.
3117
1.27
0.15
50.
990.
1937
1.01
0.16
61.
260.
0753
0.85
0.10
300.
730.
08A
l 2O3
3016
.10.
718
16.4
0.5
515
.82
0.44
3716
.29
0.45
616
.46
0.14
5816
.21
0.41
2816
.36
0.37
Fe2O
330
2.05
0.24
161.
630.
055
1.73
0.22
371.
570.
136
1.81
0.13
551.
410.
0830
1.26
0.13
FeO
305.
90.
716
5.42
0.18
54.
30.
537
4.49
0.37
55.
550.
0955
3.16
0.33
303.
160.
33M
nO30
0.13
80.
017
170.
125
0.00
74
0.10
90.
009
360.
106
0.01
06
0.11
50.
005
600.
096
0.01
030
0.08
30.
010
MgO
306.
41.
218
6.4
0.7
55.
90.
937
4.9
0.8
56.
200.
2760
4.4
0.6
302.
70.
5C
aO30
7.19
0.30
187.
110.
385
6.2
0.5
376.
130.
455
7.40
0.27
595.
660.
4530
4.58
0.30
Na 2O
304.
250.
2717
3.89
0.12
44.
598
0.03
037
4.08
0.29
64.
280.
2859
4.19
0.20
304.
360.
24K
2O28
1.44
0.15
181.
300.
145
1.83
0.15
361.
670.
186
1.44
0.22
591.
720.
1630
1.92
0.17
P 2O5
300.
570.
2517
0.32
0.07
50.
300.
0737
0.29
0.09
60.
440.
0658
0.25
0.05
300.
203
0.03
0M
g#30
665
1867
.03.
35
70.7
3.5
3765
.63.
96
65.7
2.2
5965
.83.
330
60.2
3.9
La27
2910
718
.34.
24
245
2220
65
26.4
3.7
5120
.24.
222
19.2
3.9
Ce
2567
207
418
454
622
4611
557
750
449
2243
7Pr
15.
73
5.7
0.8
55.
01.
85
7.5
0.9
135.
61.
15
4.6
0.8
Nd
1235
115
23.2
4.5
922
55
32.6
3.9
3622
57
19.8
3.6
Sm12
7.5
2.2
55.
10.
89
4.5
1.0
56.
90.
736
4.6
0.8
74.
000.
45Eu
122.
20.
65
1.62
0.27
91.
320.
265
2.03
0.20
361.
360.
197
1.17
0.13
Gd
15.
493
4.95
0.37
53.
91.
25
5.5
0.5
123.
90.
54
3.8
0.5
Tb12
0.95
0.26
50.
780.
129
0.60
0.13
50.
800.
0635
0.59
0.07
50.
576
0.04
3D
y2
4.74
0.13
24.
41.
05
4.47
0.19
103.
310.
353
3.4
0.8
Ho
10.
923
0.88
0.09
50.
680.
215
0.94
00.
042
130.
690.
144
0.65
0.13
Er1
2.57
32.
460.
195
1.9
0.6
42.
170.
1113
1.82
0.36
41.
870.
36Tm
10.
353
0.35
20.
033
50.
270.
104
0.32
00.
014
130.
270.
054
0.27
0.05
Yb13
3.1
0.9
52.
240.
308
1.66
0.36
52.
230.
1237
1.73
0.21
71.
660.
24Lu
120.
430.
124
0.31
90.
028
90.
280.
065
0.34
00.
025
350.
249
0.03
67
0.25
0.07
Ba29
450
9014
370
605
500
7036
500
906
480
6060
500
8028
530
70C
o13
277
526
.94.
09
258
525
.10.
635
3015
613
.03.
6C
r15
180
5011
210
601
118
2315
050
621
060
4415
050
1278
14H
f12
5.9
1.4
44.
50.
65
3.96
0.05
254.
20.
55
4.5
0.6
Nb
1718
912
136
58.
84.
432
115
612
.01.
833
7.2
2.6
267.
11.
7N
i28
116
4314
100
504
140
736
7837
681
2254
7224
2738
15Pb
67.
81.
76
6.5
1.5
611
.52.
63
8.7
0.6
Rb26
276
1428
.02.
85
32.2
3.2
3637
96
266
5836
828
457
Sc3
19.2
2.7
217
.52.
12
16.5
0.7
1512
.91.
24
10.6
1.8
Sr22
521
2014
530
705
710
180
3551
570
666
090
6052
080
2746
050
Ta11
1.29
0.38
40.
820.
135
0.61
0.24
250.
670.
285
0.56
0.18
Th12
2.9
0.7
42.
60.
65
3.23
0.19
303.
50.
65
4.0
1.2
U11
0.89
0.28
30.
970.
066
1.16
0.16
281.
200.
295
1.37
0.29
V14
137
1111
138
81
9923
116
126
133
1643
105
1312
857
Y27
328
1324
.23.
55
21.2
3.5
3624
66
24.4
1.5
5519
.72.
728
19.2
2.5
Zr29
270
9013
183
335
177
3136
220
706
198
2654
176
3128
180
23

21
VELASCO-TAPIA and VERMA / Turkish J Earth SciA
ppen
dix
A11
. Con
tinue
d.
Elem
ent
DIS
Q (d
isequ
ilibr
ium
-typ
e m
agm
as)
HB
(hig
h-Ba
-typ
e m
agm
as)
BTA
+ T
A +
BA
AD
HB1
HB2
n– x
sn
– xs
n– x
sn
– xs
n– x
s
SiO
25
56.0
1.2
860
.01.
57
64.5
1.0
452
.11.
47
57.3
4.4
TiO
25
1.15
0.32
80.
900.
217
0.67
0.05
41.
000.
077
1.25
0.43
Al 2O
35
16.6
0.6
816
.00.
57
16.7
0.8
414
.90.
67
15.6
60.
44Fe
2O3
51.
710.
228
1.47
0.16
71.
210.
094
1.88
0.10
71.
780.
40Fe
O4
5.25
0.35
84.
20.
57
3.07
0.21
45.
60.
57
5.1
1.4
MnO
50.
122
0.01
58
0.10
00.
012
70.
084
0.00
54
0.13
10.
013
70.
111
0.03
6M
gO5
6.2
1.4
85.
10.
67
2.7
0.6
49.
00.
97
5.7
1.4
CaO
57.
090.
278
6.0
0.5
74.
70.
54
8.9
0.5
76.
51.
1N
a 2O5
4.32
0.34
84.
240.
167
4.25
0.12
43.
940.
407
4.02
0.41
K2O
51.
370.
198
1.69
0.12
71.
870.
244
1.92
0.33
71.
980.
29P 2O
55
0.38
0.22
80.
260.
077
0.18
30.
026
40.
560.
147
0.50
0.28
Mg#
471
.10.
68
68.1
3.0
761
54
74.1
0.5
766
.43.
1La
318
67
17.7
2.3
616
.12.
84
5213
431
6C
e3
4313
746
75
36.7
4.2
411
625
575
19Pr
25.
42.
83
5.0
1.3
34.
190.
452
18.4
0.9
Nd
224
123
217
317
.21.
62
80.7
4.0
333
9Sm
25.
21.
93
4.4
1.3
33.
630.
352
14.9
0.9
36.
81.
7Eu
21.
550.
393
1.32
0.30
31.
113
0.01
52
4.05
0.33
31.
90.
5G
d2
4.5
1.3
34.
10.
63
3.16
0.16
210
.31
0.28
Tb2
0.71
0.10
30.
660.
053
0.53
00.
026
21.
300.
083
0.80
0.20
Dy
23.
855
0.02
11
3.59
32.
970.
192
6.2
0.6
Ho
20.
715
0.00
73
0.70
0.09
30.
580
0.04
02
1.02
50.
021
Er2
1.99
0.13
31.
790.
123
1.65
0.07
22.
620.
38Tm
20.
282
0.03
03
0.26
30.
021
30.
2383
0.00
292
0.36
0.05
Yb2
1.80
0.15
31.
750.
364
1.51
0.14
22.
280.
233
2.4
0.8
Lu2
0.26
80.
025
30.
320.
093
0.23
10.
009
20.
323
0.01
83
0.31
0.09
Ba4
460
100
747
060
647
060
411
4025
05
800
50C
o2
24.4
0.8
317
.52.
24
148
229
.62.
03
226
Cr
421
090
314
050
392
252
320
505
180
50H
f2
3.70
0.15
14.
022
4.10
0.27
15.
63
5.2
0.7
Nb
511
87
5.4
1.2
65.
61.
34
3.7
1.5
416
5N
i5
110
507
7329
438
164
212
287
103
36Pb
16
17.
01
15.0
27.
01.
4Rb
526
67
316
635
124
287
738
11Sc
119
111
123
Sr5
570
110
766
050
656
090
411
5030
05
540
50Ta
20.
380.
051
0.40
30.
467
0.02
51
0.29
30.
730.
15Th
22.
60.
61
2.84
33.
630.
201
7.73
34.
01.
5U
10.
751
1.33
12.
713
1.20
0.26
V4
121
63
9315
473
192
155
115
120
19Y
420
.02.
27
19.3
2.8
616
.31.
24
28.1
1.7
728
9Zr
415
418
715
321
614
69
417
634
724
060

22
VELASCO-TAPIA and VERMA / Turkish J Earth Sci
Appendix A12. Statistical data for the Nb anomaly ([Nb/Nb*]Primitive-mantle with respect to Ba and La) for mafic rocks from the SCN and their comparison with arcs and rifts or extension-related area and continental break-up regions around the world as well as with other Mexican provinces (the comparison data from Verma 2006).
Area n m x±s 95% CL 99% CL
SCN (Mexico) 12 0.69 0.69±0.13 0.61–0.77 0.58–0.81
ArcsAleutian arc 13 0.11 0.19±0.08 0.14–0.24 0.12–0.26
* 11 0.15 0.17±0.06 0.13–0.21 0.11–0.22Burma arc 4 0.09 0.09±0.02 0.05–0.13 0.02–0.16Central American Volcanic Arc (CAVA) 55 0.13 0.17±0.13 0.14–0.21 0.13–0.22Izu-Bonin arc 18 0.09 0.16±0.21 0.06–0.27 0.02–0.31
* 16 0.09 0.10±0.05 0.07–0.13 0.06–0.14Japan arc 7 0.14 0.19±0.15 0.05–0.33 –
* 6 0.14 0.15±0.09 0.05–0.24 –Kamchatka arc 14 0.21 0.34±0.35 0.14–0.54 0.07–0.62
* 12 0.21 0.22±0.11 0.15–0.29 0.12–0.32Lesser Antilles arc 45 0.31 0.32±0.12 0.28–0.35 0.28–0.36Luzon arc 4 0.31 0.30±0.10 0.14–0.47 0.01– 0.60Marianas arc 8 0.07 0.07±0.04 0.04–0.11 0.02–0.12New Hebrides arc 10 0.14 0.16±0.04 0.12–0.19 0.11–0.20Papua - New Guinea arc 3 0.11 0.09±0.02 0.04–0.15 –Philippines arc 20 0.22 0.21±0.07 0.18–0.25 0.17–0.26Sangihe arc 3 0.16 0.16±0.01 0.13–0.19 0.09–0.23Sunda-Banda arc 23 0.15 0.15±0.08 0.11–0.18 0.10–0.20Tonga-Kermadec arc 8 0.14 0.15±0.08 0.08–0.22 0.05–0.26Vanuatu arc 5 0.06 0.06±0.02 0.03–0.09 0.01–0.11
Rift and extension-related areas: with negative Nb anomalyBasin and Range 34 0.64 0.69±0.33 0.58–0.81 0.54–0.85Colorado Plateau-Transition 39 0.63 0.63±0.19 0.57–0.69 0.50–0.74Rio Grande rift 35 0.81 0.77±0.43 0.62–0.91 0.57–0.97Western USA 30 0.68 0.73±0.39 0.58–0.88 0.53–0.93North China 8 0.85 0.84±0.08 0.77–0.90 0.74–0.93Northeast China 22 0.79 0.78±0.22 0.69–0.88 0.65–0.91Gregory rift–Kenya 4 0.74 0.77±0.08 0.64–0.90 0.53–1.01
Continental break-up regions: with negative Nb anomalyColumbia River 3 0.37 0.41±0.12 0.12–0.70 –Deccan - India 12 0.59 0.61±0.19 0.49–0.73 0.44–0.78Greenland 3 0.79 0.82±0.09 0.59–1.05 0.29–1.36Paraná - Brazil 1 – 0.49 – –
Other Mexican ProvincesEastern Alkaline Province 97 0.76 0.80±0.27 0.74–0.85 0.72–0.86Los Tuxtlas Volcanic Field 22 0.61 0.62±0.20 0.53–0.71 0.50–0.74Eastern Mexican Volcanic Belt 94 0.49 0.53±0.22 0.48–0.57 0.46–0.59
n= number of samples; m= median; x= mean; s= standard deviation; 95%CL= 95% confidence limit of the mean; 99%CL= 99% confidence limit of the mean. For CAVA, some basalts from the back-arc Yohoa volcano showing significant positive Nb anomaly were not included in the statistical calculations, otherwise the statistic were not meaningful. *= When the median (m) and mean (x) values for the Nb anomaly showed significant differences, the data were checked for discordant outliers (Barnett & Lewis 1994); in these cases, the statistical data are also presented after outlier detection and elimination. – = means that the 95% or 99% confidence limits were not meaningful for these more dispersed parameters because of the very small number of samples.

23
VELASCO-TAPIA and VERMA / Turkish J Earth Sci
Appendix A13. Synthesis of inferred tectonic setting results for Sierra de Chichinautzin (SCN) and Central American Volcanic Arc (CAVA) basic magmas from new multi-dimensional discriminant function based diagrams.
Area of application
Diagramreference
Figure codeTotal no. of
samples(%)
Number of samples (%) discriminated asDiagram typeIAB
(1)CRB+OIB
(2+3)CRB(2)
OIB(3)
MORB(4)
SCN VGA2006 Fig_1234m2 28 (100) 2 (7) 26 (93) 0 0Fig_123m2 28 (100) 0 28 (100) 0Fig_124m2 28 (100) 0 28 (100) 0Fig_134m2 28 (100) 2 5 21 InapplicableFig_234m2 28 (100) 28 (100) 0 0
Before and after DODESSYS
SCN VA2011 Fig_1234t2 4 0 2 2Fig_123t2 4 0 4 0Fig_124t2 4 0 3 1Fig_134t2 4 0 0 4 InapplicableFig_234t2 4 3 0 1
CAVA VGA2006 Fig_1234m2 84 (100) 67 (80) 3 (3) 0 14 (17)Fig_123m2 84 (100) 64 (76) 12 (14) 8 (10)
Fig_124m2 84 (100) 66 (79) 5 (6) 13 (15)
Fig_134m2 84 (100) 67 (80) 2 (2) 15 (18)
Fig_234m2 84 (100) 61 0 23 Inapplicable
Before DODESSYS
CAVA VA2011 Fig_1234t2 41 (100) 26 (64) 1 (2) 14 (34)
Fig_123t2 41 (100) 35 (85) 6 (15) 0
Fig_124t2 41 (100) 26 (64) 1 (2) 14 (34)
Fig_134t2 41 (100) 24 (59) 1 (2) 16 (39)
Fig_234t2 41 (100) 2 (5) 0 39 Inapplicable
After DODESSYS
CAVA VA2011 Fig_1234t2 38 (100) 24 (63) 1 (3) 13 (34)
Fig_123t2 38 (100) 33 (87) 5 (13) 0
Fig_124t2 38 (100) 24 (63) 1 (3) 13 (34)
Fig_134t2 38 (100) 22 (58) 1 (3) 15 (39)
Fig_234t2 38 (100) 1 0 37 Inapplicable
In Figure code, numbers 1 to 4 refer to the tectonic settings (1–IAB, 2–CRB, 3–OIB, 4–MORB); m2 and t2 are for, respectively, the diagrams proposed by Verma et al. (2006) and Verma & Agrawal (2011). Computer program DODESSYS is by Verma & Díaz-González (2012).

24
VELASCO-TAPIA and VERMA / Turkish J Earth Sci
Appendix A14. Linear regression coefficients for trace-element inverse modelling results for mafic magmas (SiO2 < 52%; Mg# > 63) from the SCN, using La as a reference element (the most highly incompatible element).
Elem(i)
(CLa – Ci)E diagram (CLa – CLa/Ci)E diagram
n mi semi Ii seIi r Pc(r,n) mi semi Ii seIi r Pc(r,n)
Ce 24 0.78 0.07 4.2 2.5 0.920 < 0.0001 0.0044 0.0024 0.96 0.08 0.358 0.0860
Nd 15 0.55 0.05 1.7 2.0 0.950 < 0.0001 0.0042 0.0039 1.49 0.13 0.284 0.3044*
Sm 15 0.308 0.044 4.2 1.5 0.891 < 0.0001 0.016 0.006 1.72 0.20 0.625 0.0127
Eu 17 0.196 0.034 5.7 1.2 0.827 < 0.0001 0.034 0.007 1.56 0.22 0.800 < 0.0001
Tb 17 0.158 0.030 3.5 1.0 0.805 < 0.0001 0.040 0.013 2.45 0.44 0.622 0.0080
Yb 15 0.123 0.025 2.3 0.8 0.809 < 0.0001 0.044 0.022 3.7 0.7 0.488 0.0647
Lu 15 0.119 0.031 1.9 1.1 0.724 0.0023 0.053 0.031 4.0 1.0 0.421 0.1178
Ba 26 1.12 0.26 10 9 0.667 0.0002 0.003 0.009 0.63 0.13 0.155 0.4480*
Hf 14 0.23 0.06 8.2 1.8 0.762 0.0015 0.030 0.007 1.09 0.23 0.765 0.0014
Nb 12 0.45 0.16 14 6 0.660 0.0196 0.017 0.007 0.55 0.25 0.631 0.0277
Rb 23 0.46 0.14 20 5 0.568 0.0047 0.0134 0.0044 0.51 0.16 0.549 0.0066
Sr 26 0.06 0.06 23.7 2.6 0.200 0.3267* 0.0361 0.0029 0.10 0.09 0.9327 < 0.0001
Ta 14 0.62 0.25 9 8 0.584 0.0283 0.009 0.008 0.86 0.30 0.2542 0.3806*
Th 14 0.41 0.16 11 5 0.607 0.0214 0.016 0.007 0.81 0.23 0.550 0.0413
U 13 0.80 0.35 8 11 0.570 0.0417 0.0010 0.0013 0.98 0.43 0.010 0.9689*
Y 24 0.047 0.014 5.5 0.5 0.580 0.0030 0.104 0.010 1.21 0.35 0.910 < 0.0001
Zr 24 0.39 0.06 8.3 2.1 0.806 < 0.0001 0.018 0.005 0.96 0.15 0.632 0.0005
Ti 26 -0.004 0.017 8.8 0.6 0.049 0.8010* 0.117 0.007 -0.04 0.26 0.955 < 0.0001
P 26 2.7 0.5 39 17 0.732 < 0.0001 0.0024 0.0011 0.186 0.037 0.410 0.0371
K 26 0.60 0.18 39 6 0.561 0.0029 0.0102 0.0017 0.22 0.06 0.783 < 0.0001
n= number of data pairs considered in the trace-element diagrams; mi= slope of the linear model; Ii= intercept value of the linear model; r= correlation coefficient of the linear model; Pc(r,n)= probability that the variables are not correlated (i.e. 1 - Pc(r,n) is the probability that the two variables are correlated); semi= standard error for slope in (CLa – Ci)E or (CLa – CLa/Ci)E diagrams; seIi= standard error for intercept in (CLa – Ci)E or (CLa – CLa/Ci)E diagrams; subscript E refers to normalisation with respect to Silicate Earth values. All concentration data are normalised against Silicate Earth values (in mg.g-1) by McDonough & Sun (1995): La= 0.648; Ce= 1.675; Pr= 0.254; Nd= 1.250; Sm= 0.406; Eu= 0.154; Gd= 0.544; Tb= 0.099; Dy= 0.674; Ho= 0.149; Er= 0.438; Tm= 0.068; Yb= 0.441; Lu= 0.0675; Ba= 6.600; Cs= 0.021; Hf= 0.283; Nb= 0.658; Pb= 0.150; Rb= 0.600; Sr= 19.9; Ta= 0.037; Th= 0.0795; U= 0.0203; Y= 4.30; Zr= 10.5; Ti= 1205; P= 90; K= 240. Asterisk “*” denotes statistically invalid correlations even at the 95% confidence level (italicized Pc(r,n) values).

25
VELASCO-TAPIA and VERMA / Turkish J Earth Sci
Appendix A15. Linear regression coefficients for trace-element inverse modelling results for mafic magmas (SiO2 < 52%; Mg# > 63) from the CAVA, using La as a reference element (the most highly incompatible element).
Elem(i)
(CLa – Ci)E diagram (CLa – CLa/Ci)E diagram
n mi semi Ii seIi r Pc(r,n) mi semi Ii seIi r Pc(r,n)
Ce 20 0.651 0.026 2.48 0.43 0.986 < 0.0001 0.0133 0.0019 0.900 0.031 0.860 <0.0001
Nd 20 0.440 0.017 3.69 0.27 0.987 < 0.0001 0.0275 0.0028 0.83 0.05 0.920 <0.0001
Sm 20 0.224 0.019 4.37 0.32 0.940 < 0.0001 0.0584 0.0038 0.77 0.06 0.964 <0.0001
Eu 20 0.198 0.014 4.40 0.24 0.955 < 0.0001 0.063 0.005 0.78 0.08 0.948 <0.0001
Gd 20 0.165 0.014 4.52 0.23 0.942 <0.0001 0.073 0.005 0.75 0.08 0.964 <0.0001
Dy 20 0.135 0.015 3.70 0.25 0.904 <0.0001 0.091 0.008 0.90 0.14 0.934 <0.0001
Er 20 0.150 0.017 2.96 0.28 0.904 <0.0001 0.089 0.011 1.19 0.18 0.890 <0.0001
Yb 20 0.100 0.009 2.74 0.15 0.934 < 0.0001 0.120 0.009 1.25 0.15 0.949 <0.0001
Ba 20 0.46 0.28 29 5 0.364 0.1152* 0.0209 0.0021 0.100 0.035 0.918 0.0111
Cs 12 0.007 0.10 5.8 2.0 0.020 0.9468* 0.151 0.038 1.3 0.8 0.766 0.1091
Hf 12 0.36 0.05 3.2 0.7 0.928 0.0011 0.036 0.012 1.03 0.19 0.687 0.0135
Nb 20 1.46 0.14 -2.2 2.4 0.922 0.3728 0.008 0.011 1.18 0.19 0.152 0.5230*
Pb 13 0.31 0.08 9.6 1.5 0.762 0.0020 0.0394 0.0034 0.33 0.07 0.961 0.0005
Rb 20 0.45 0.10 7.8 1.6 0.733 0.0002 0.024 0.005 0.61 0.09 0.698 <0.0001
Sr 20 0.49 0.07 13.9 1.1 0.871 <0.0001 0.0260 0.0015 0.220 0.025 0.970 <0.0001
Th 13 0.60 0.05 1.3 1.0 0.959 0.2549 0.003 0.007 1.44 0.14 0.125 0.6838*
U 13 0.69 0.18 9.6 3.5 0.756 0.0030 0.014 0.005 0.54 0.10 0.06 0.0184
Y 20 0.198 0.014 2.82 0.24 0.957 <0.0001 0.066 0.009 1.24 0.14 0.873 <0.0001
Zr 19 0.53 0.05 2.07 0.8 0.941 0.0160 0.015 0.012 1.23 0.20 0.301 0.2098*
Ti 20 0.140 0.026 3.84 0.42 0.788 <0.0001 0.019 0.11 33.0 1.9 0.373 0.1053*
P 20 2.11 0.07 0.7 1.2 0.989 0.6057* 0.0001 0.0005 0.484 0.027 0.088 0.7119*
K 20 3.18 0.16 10.2 2.7 0.977 0.0013 0.0023 0.0008 0.203 0.013 0.576 0.0079
For the explanation of variables and symbols see Appendix A14.