magnesita 3 q12_presentation_en
DESCRIPTION
TRANSCRIPT

1
Earnings Call – 3Q12 November 9th, 2012

2
Index
3Q12 Highlights New strategic view

3
Consolidated Revenues (R$ million)
Quarter YTD
561.5637.6 608.1
3Q11 2Q12 3Q12
1,719.81,852.6
9M11 9M12
-4.6%
+8.3% +7.7%
50.2%
18.1%
22.6%
9.0%
2Q12
50.9%
16.9%
22.4%
9.4%0.4%
3Q11
49.1%
21.6%
20.0%
9.3%
3Q12
South America
North America
Europe
Asia
RoW

4
87.0% 84.0% 86.3%
13,0%16,0% 13,7%
3Q11 3Q11 3Q12
Steel Industrial
496.7 566.9 535.2-5.6%
+7.7%
86.0% 84.0%
14,0%16,0%
9M11 9M12
Steel Industrial
1,517.81,652.4
+8,9%
Revenues – Refractories Solutions (R$ million)
Steel Industrial
Quarter Acumulated
432.0476.3 462.0
3Q11 3Q11 3Q12
6.9%
-3.0%1,305,4
1,388.9
9M11 9M12
6.4%
64.7
90.673.1
3Q11 3Q11 3Q12
13.1%
-19.2%212.4
263.6
9M11 9M12
24.1%

5
Gross profit and gross margin by segment
Segment (R$ million) Quarter Var. % YTD Var. %
Refractory Solution 3Q12 (a) 2Q12 (b) 3Q11 (c) (a/b) (a/c) 9M12 (d) 9M11 (e) (d/e)
Gross Profit (R$ million) 165.9 183.6 160.1 -9.6% 3.7% 519.1 494.4 5.0%
Gross Margin (%) 31.0% 32.4% 32.2% -139 bp -122 bp 31.4% 32.6% -116 bp
Minerals
Gross Profit (R$ million) 13.6 14.8 14.2 -8.1% -4.2% 38.9 38.7 0.6%
Gross Margin (%) 45.0% 43.7% 50.6% 128 bp -559 bp 43.5% 46.2% -275 bp
Services
Gross Profit (R$ million) 5.9 3.2 3.8 87.7% 56.3% 10.8 14.0 -22.5%
Gross Margin (%) 13.9% 8.6% 10.4% 533 bp 354 bp 9.8% 11.8% -202 bp
TOTAL
Gross Profit (R$ million) 185.5 201.6 178.1 -8.0% 4.2% 568.9 547.1 4.0%
Gross Margin (%) 30.5% 31.6% 31.7% -112 bp -122 bp 30.7% 31.8% -111 bp

6
EBITDA and Net profit
EBITDA and EBITDA margin R$ million and %
Net profit and net margin R$ million and %
118.7105.2
84.3
21.1%
16.5%13.9%
3Q11 (c) 2Q12 (b) 3Q12 (a)
EBITDA EBITDA Margin (%)
315.7277.0
18.4%
15.0%
9M11 9M12
EBITDA Margem EBITDA (%)
34.4 36.7
10.7
6.1% 5.8%
1.8%
3Q11 (c) 2Q12 (b) 3Q12 (a)
Net Profit Net Margin (%)
87.075.8
5.1%
4.1%
9M11 9M12
Net Profit Net Margin (%)
7
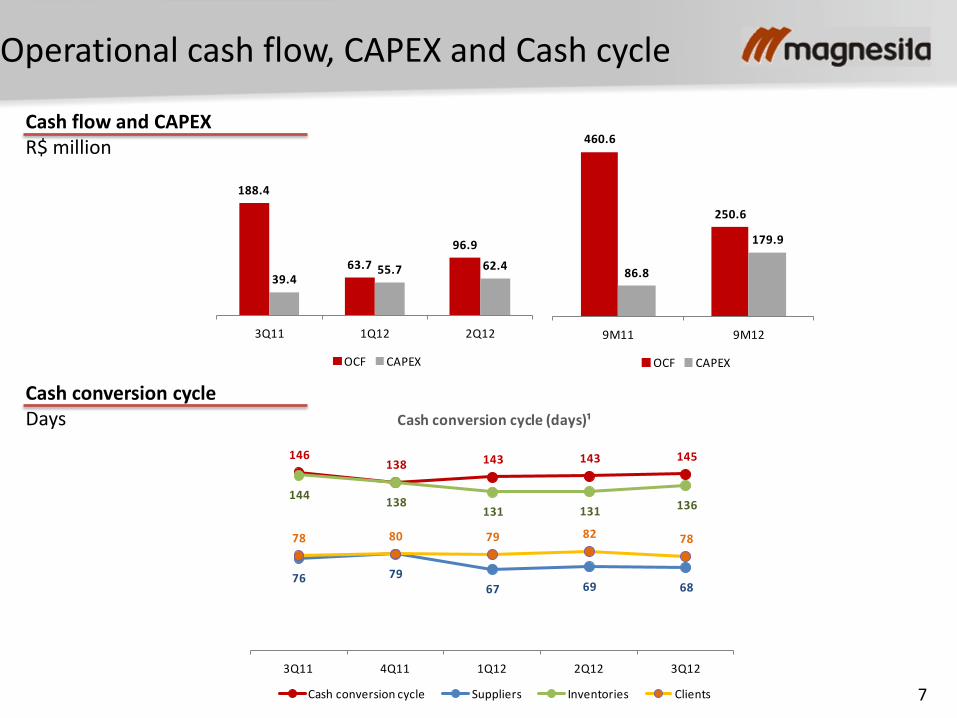
188.4
63.7
96.9
39.455.7 62.4
3Q11 1Q12 2Q12
OCF CAPEX
460.6
250.6
86.8
179.9
9M11 9M12
OCF CAPEX
Operational cash flow, CAPEX and Cash cycle
Cash flow and CAPEX R$ million
Cash conversion cycle Days
146 138 143 143 145
76 79 67 69 68
144 138
131 131 136
78 80 79 82 78
3Q11 4Q11 1Q12 2Q12 3Q12
Cash conversion cycle (days)¹
Cash conversion cycle Suppliers Inventories Clients

8
Debt and leverage
Net debt and leverage R$ million
Debt profile
900.2 957.3 968.0
1,060.0 1,074.4
787.7 761.2 791.8 819.1 834.7
2.11x2.24x 2.30x
2.51x
2.76x
3Q11 4Q11 1Q12 2Q12 3Q12
Net Debt Working capital Net Debt/EBITDA
6.8%
93.2%
Short term Long term
16.9%
83.1%
Local currency (BRL) Foreign currencies

9
3Q12 Highlights
• Net revenue of R$ 608.1 million, up 8.3% over 3Q11, but down 4.6% over 2Q12
• EBITDA of R$84.3 million, margin 13.9%, compared to R$118.7 million (margin 21.1%) in 3Q11 and
R$105.2 million (margin 16.5%) in 2Q12.
• Services: Revenue of R$42.7 million with gross margin at 13.9%, compared to R$36.6 million (margin at
10.4%) in 3Q11 and R$36.8 million (margin 8.6%) in 2Q12
• Brumado Expansion: Went into operation the new furnace in Brumado (Brazil), increasing the
production capacity of high-grade magnesite sinter to 240,000 tons per year
• Graphite Project: Obtainment of the Preliminary Environmental License
10
Index
3Q12 Highlights New strategic view

11
The new vision and the 4 strategy pillars
Vision: Be the best provider of refractories solutions and industrial minerals,
leveraging and developing our minerals base
Continue to develop high quality, low cost raw material sources to support our current busi-nesses as well as new businesses where we can have a sustainable com-petitive advantage
Strive to keep offering high quality and innovative products, unrivaled services and cost performance
Optimize production globally to improve efficiency and support growth
Develop global supply chain management
Pursue long term growth opportunities in selected markets where we can deliver superior value to our customers and shareholders
Expand industrial minerals base
Ensure leadership in our core markets
Maintain a global low cost production base
Grow selectively and aggressively
▪ Meritocracy
▪ Ethics
▪ Profit
▪ Management and Method
▪ Customer
▪ People
▪ Agility and Transparency
▪ Respect for Safety, Environment and Communities
Our values
On
e g
lob
al o
rgan
iza
tio
n

12
Magnesita 2017
Industrial Minerals
New
refractories markets
Core refractories markets
Integrated product offer:
•Raw materials •Refractory Solutions
•Services
• Largest magnesite mine ex-China • Low-cost/high quality source for relevant refractories raw materials • Portfolio of industrials minerals in Brazil
•Leadership in South America and dolomite products
• Sustainable position in selected markets with focus in growth and industrial applications
13
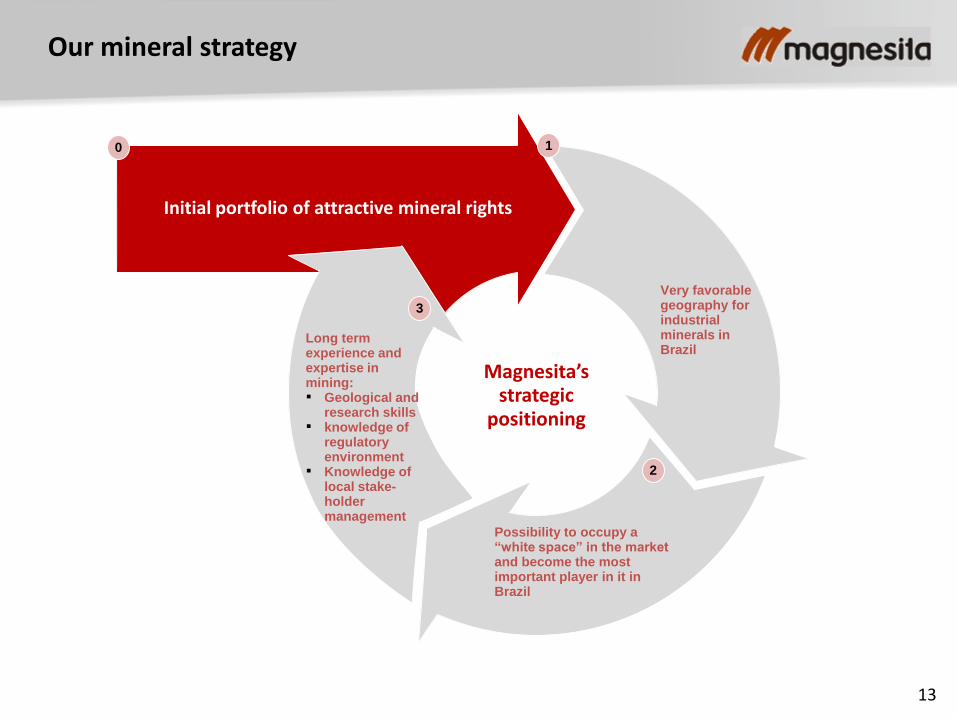
Our mineral strategy
Initial portfolio of attractive mineral rights
Very favorable geography for industrial minerals in Brazil
Possibility to occupy a “white space” in the market and become the most important player in it in Brazil
0 1
2
3
Magnesita’s strategic
positioning
Long term experience and expertise in mining: ▪ Geological and
research skills ▪ knowledge of
regulatory environment
▪ Knowledge of local stake-holder management

14
Investor Relations contacts:
Octavio Pereira Lopes
CEO and IRO
Daniel Domiciano Silva
Investor Relations
Phone: 55 11 3152-3202/3241
www.magnesita.com