magnetic levitation of single cells si final updated · ! 1! supplementary information magnetic...
TRANSCRIPT
1
Supplementary Information
Magnetic levitation of single cells
Naside Gozde Durmus1,4,a , H. Cumhur Tekin2,a, Sinan Guven2, Kaushik Sridhar2,Ahu Arslan Yildiz2, Gizem Calibasi2, Ionita Ghiran5, Ronald W. Davis1,3,4*, Lars M. Steinmetz3,4*, Utkan
Demirci2*
1 Department of Biochemistry, School of Medicine, Stanford University, CA, USA, 94304 2 Canary Center at Stanford for Cancer Early Detection, Radiology Department, School of Medicine,
Stanford University, CA, USA, 94304 3 Department of Genetics, School of Medicine, Stanford University, CA, USA, 94304
4 Stanford Genome Technology Center, Stanford University, CA, USA, 94304 5 Department of Medicine, Beth Israel Deaconess Medical Center, Harvard Medical School, MA, USA,
02115
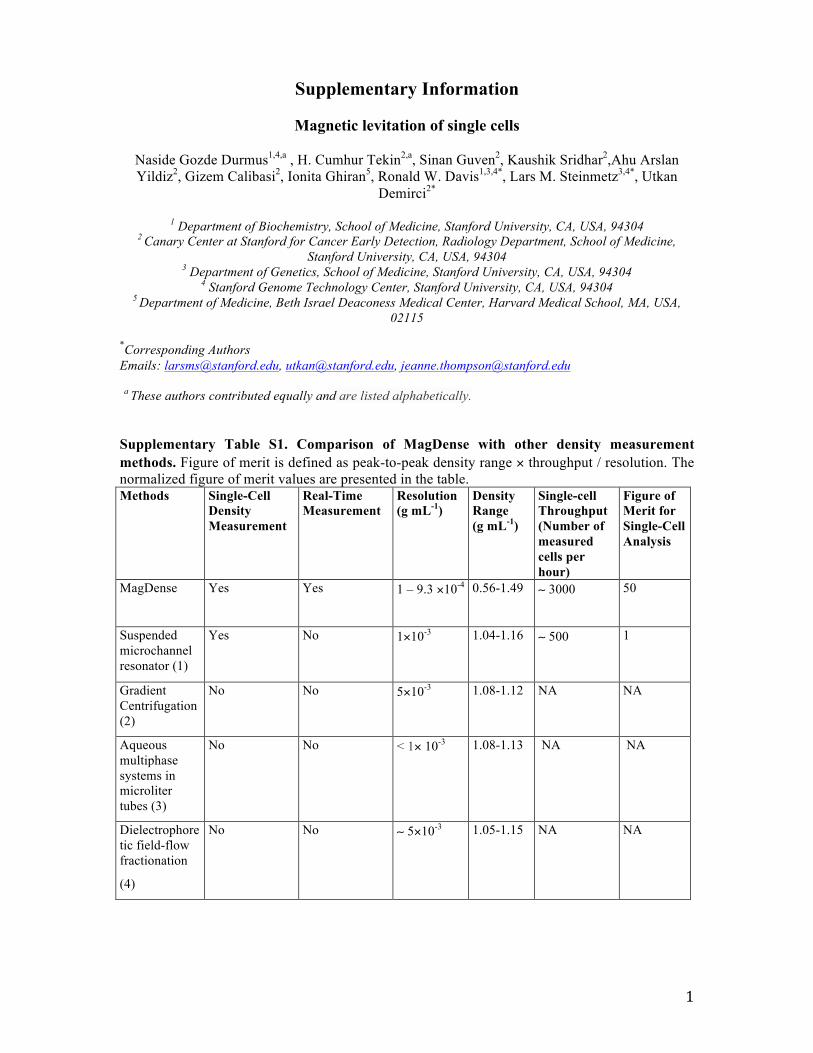
*Corresponding Authors Emails: [email protected], [email protected], [email protected] a These authors contributed equally and are listed alphabetically. Supplementary Table S1. Comparison of MagDense with other density measurement methods. Figure of merit is defined as peak-to-peak density range × throughput / resolution. The normalized figure of merit values are presented in the table. Methods Single-Cell
Density Measurement
Real-Time Measurement
Resolution (g mL-1)
Density Range (g mL-1)
Single-cell Throughput (Number of measured cells per hour)
Figure of Merit for Single-Cell Analysis
MagDense
Yes Yes 1 – 9.3 ×10⁻⁴ 0.56-1.49 ∼ 3000 50
Suspended microchannel resonator (1)
Yes No
1×10⁻³ 1.04-1.16
∼ 500 1
Gradient Centrifugation (2)
No No 5×10⁻³ 1.08-1.12 NA NA
Aqueous multiphase systems in microliter tubes (3)
No No < 1× 10⁻³
1.08-1.13 NA NA
Dielectrophoretic field-flow fractionation
(4)
No No ∼ 5×10⁻³ 1.05-1.15 NA NA

2
Supplementary Table S2. Resolution and dynamic range of MagDense using different Gd concentrations in FBS. Gd Concentration (mM) Resolution (g mL-1) Range (g mL-1) 10* 1.0 ×10-4 0.97 - 1.07 30* 2.7 ×10-4 0.89 – 1.15 50* 5.5 ×10-4 0.74 - 1.30 100† 9.3 ×10⁻⁴ 0.56 - 1.49 * from experimental results (Fig. S5) and † from simulation results (Fig 1e).
Supplementary Table S3. Comparison of measured cell densities with the literature. Density (g mL-1)
Measured (mean±s.d.) Literature (range)
Red blood cells (RBC) 1.109 ± 0.008 1.080-1.120 (5)
White blood cells (WBC) 1.088 ± 0.005 1.055-1.095 (6)
Cancer cells: < 1.077 (7)
HT29 1.084 ± 0.012 -
HCT116 1.063 ± 0.007 -
HCC827 1.062 ± 0.013 -
JHesoAD1 1.059 ± 0.008 -
MDA-MB-231 1.044 ± 0.018 -
Yeast (Saccharomyces cerevisiae) 1.119 ± 0.011 1.11-1.20 (8, 9)
Bacteria (E. coli) 1.139 ± 0.016 1.06-1.19 (10)
Figure S1. Photograph of densitometry platform. Capillary channel is introduced between two permanent neodymium magnets whose same poles are facing each other. Mirrors are used to image samples along the side of the channel.

3
Figure S2. FEM simulation results showing z and x component of magnetic induction (Bz , Bx) inside the channel. Total magnetic induction (Bz+Bx) is also presented as streamlines on the images. Coordinates of the device are presented in Fig. 1.
Figure S3. Time-lapse observation of cells along the channel. Breast cancer cells and RBC are levitated using 30 mM Gd concentration in (a) and (b), respectively.

4
Figure S4. Long term culture viability results of esophageal cancer cells. Fluorescent images of JHEsoAD1 cells cultured for 5 days with (a) 0 mM Gd, (b) 30 mM Gd, (c) 50 mM Gd, (d) 100 mM Gd, (live: green, dead: red). Scale bars are 150µm. (e) Cell viability and (f) proliferation profile for long term culturing with 0, 30, 50, 100 mM Gd.
5
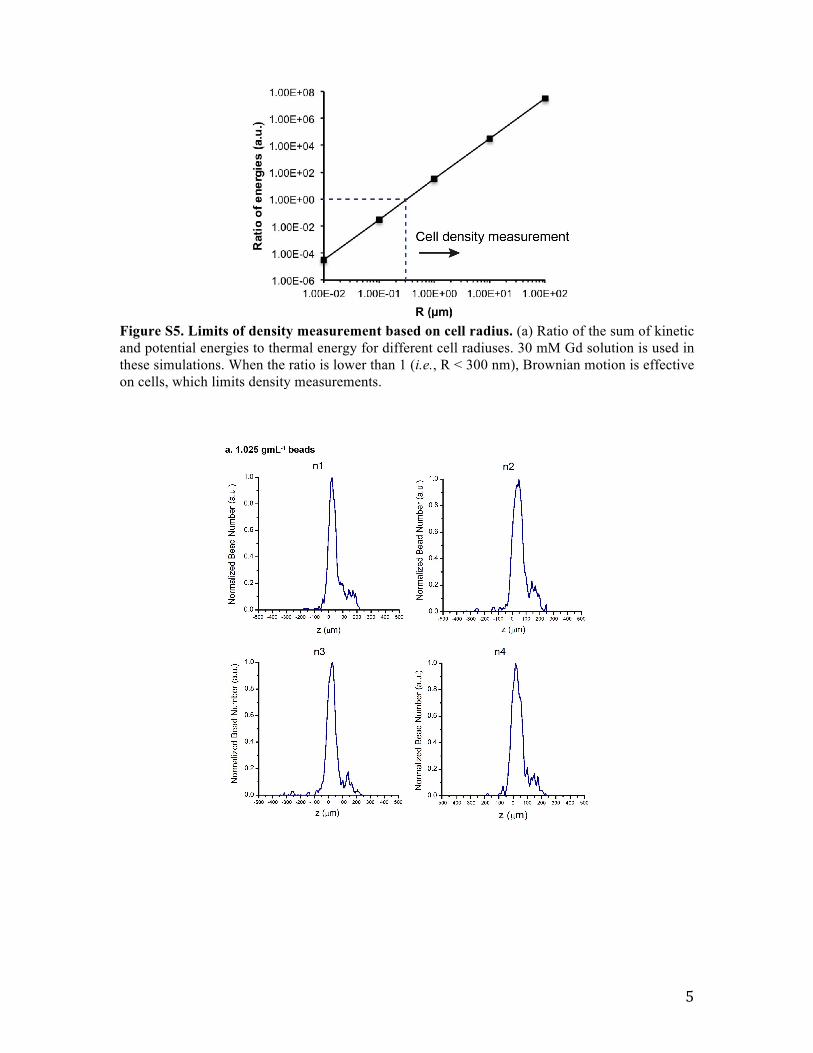
Figure S5. Limits of density measurement based on cell radius. (a) Ratio of the sum of kinetic and potential energies to thermal energy for different cell radiuses. 30 mM Gd solution is used in these simulations. When the ratio is lower than 1 (i.e., R < 300 nm), Brownian motion is effective on cells, which limits density measurements.
6
7
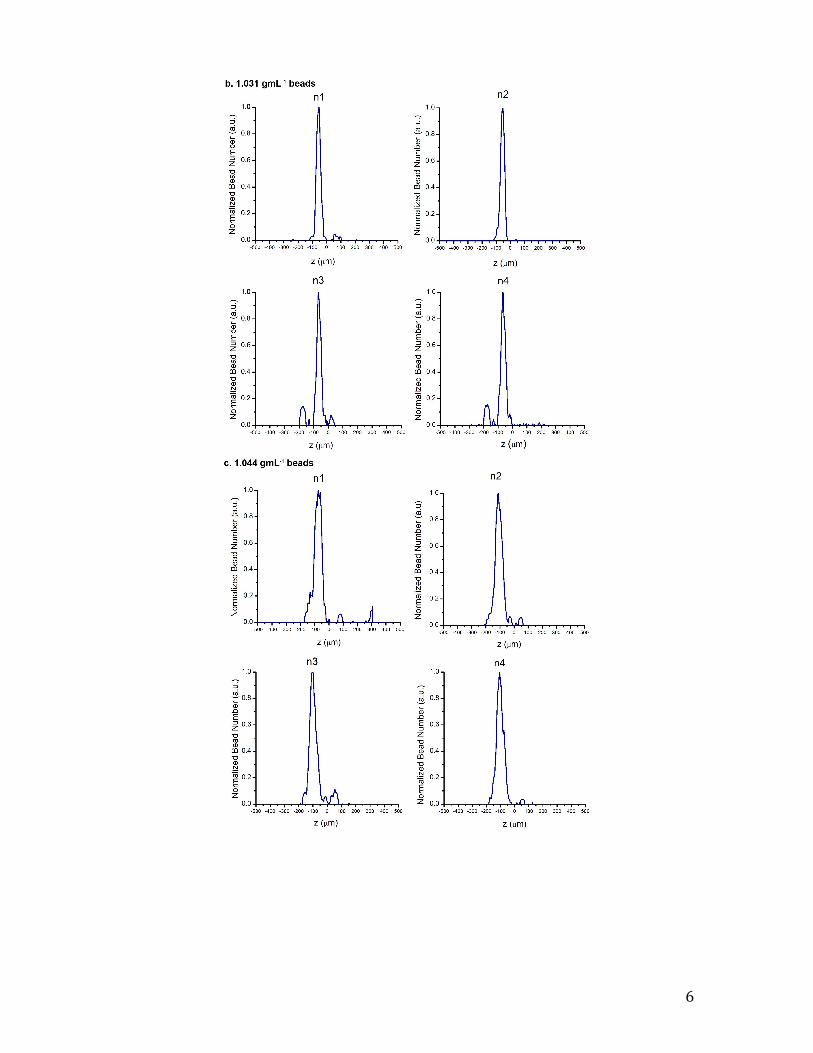
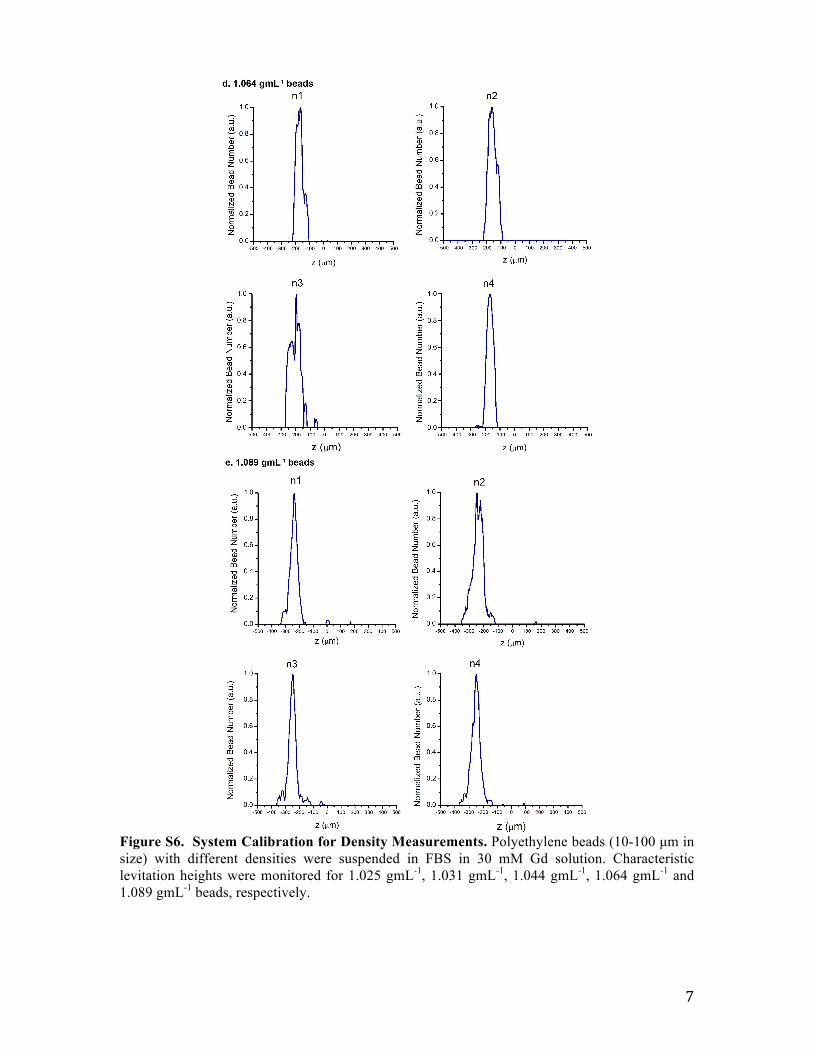
Figure S6. System Calibration for Density Measurements. Polyethylene beads (10-100 µm in size) with different densities were suspended in FBS in 30 mM Gd solution. Characteristic levitation heights were monitored for 1.025 gmL-1, 1.031 gmL-1, 1.044 gmL-1, 1.064 gmL-1 and 1.089 gmL-1 beads, respectively.

8
Figure S7. Dot plots of cell density versus radius (R) distribution of different cell types. Experiments were conducted in FBS with 30 mM Gd. N represents the number of cells measured in each experiment.

9
Figure S8. Trajectories of breast cancer cells in an acidic environment. (a) Initial positions of cells (t=15 min). (b) Corresponding cellular trajectories in real-time (final time= 95 min).
Figure S9. Distribution of breast cancer cells in an acidic microenvironment. (a) Micrographs of MDA-MB-231 cells that were treated with 100 mM HCl for 3 hours. Cells were levitated in FBS containing 100 mM Gd for density profiling. Cell viability was assessed by live-dead staining (Calcein/PI), where red fluorescence indicated the dead cells and green fluorescence indicated the live cells. Fluorescent and bright-field microscopy images were merged for the final image. Two distinct density bands were observed for live and dead cells, respectively. (b) Density distribution of dead cells along the channel.
10
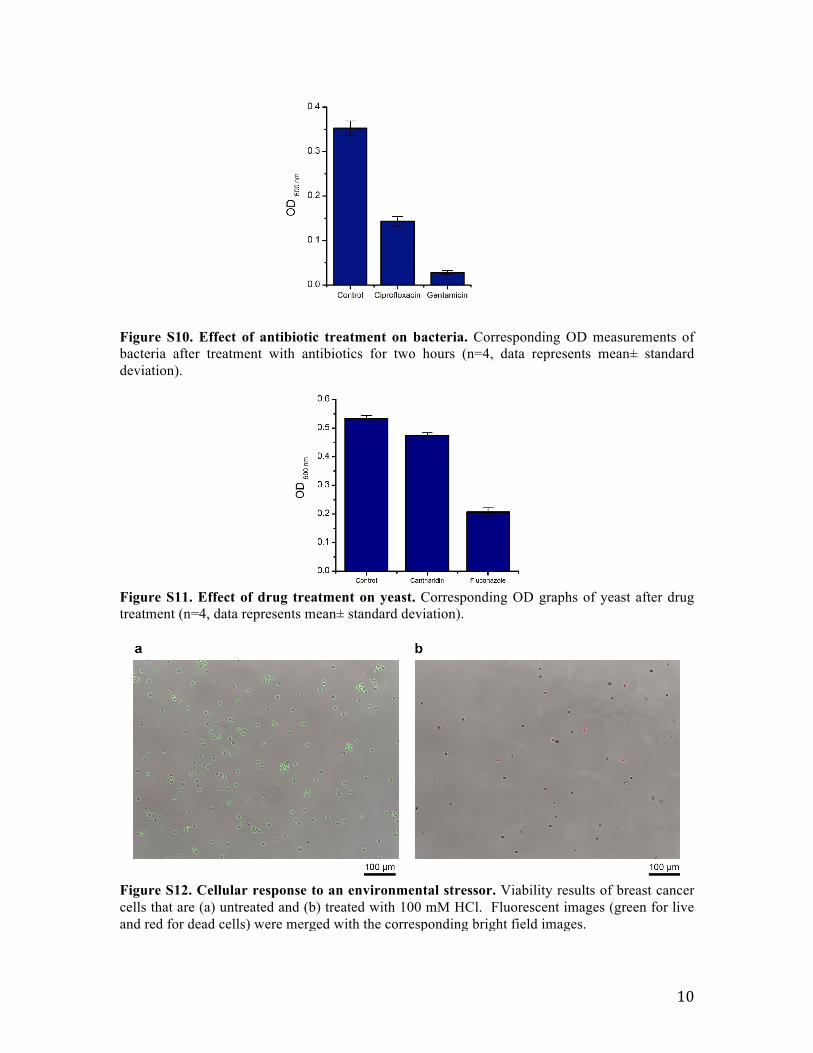
Figure S10. Effect of antibiotic treatment on bacteria. Corresponding OD measurements of bacteria after treatment with antibiotics for two hours (n=4, data represents mean± standard deviation).
Figure S11. Effect of drug treatment on yeast. Corresponding OD graphs of yeast after drug treatment (n=4, data represents mean± standard deviation).
Figure S12. Cellular response to an environmental stressor. Viability results of breast cancer cells that are (a) untreated and (b) treated with 100 mM HCl. Fluorescent images (green for live and red for dead cells) were merged with the corresponding bright field images.

11
Supplementary Video 1. Real-time monitoring of breast cancer cells treated with 100 mM HCl in the densitometry platform. Fluorescent and bright-field microscopy images were taken every 20 seconds and merged together. Green fluorescence indicates live and red fluorescence indicates dead cells.

12
References: 1. Grover WH, et al. (2011) Measuring single-cell density. Proceedings of the National
Academy of Sciences of the United States of America 108(27):10992-10996. 2. Spooner RJ, Percy RA, & Rumley AG (1979) The effect of erythrocyte ageing on some
vitamin and mineral dependent enzymes. Clin. Biochem. 12:289-290. 3. Kumar AA, et al. (2014) Density-based separation in multiphase systems provides a
simple method to identify sickle cell disease. Proc Natl Acad Sci U S A 111(41):14864-14869.
4. Shim S, Gascoyne P, Noshari J, & Hale KS (2011) Dynamic physical properties of dissociated tumor cells revealed by dielectrophoretic field-flow fractionation. Integrative biology : quantitative biosciences from nano to macro 3(8):850-862.
5. Prall YG, Gambhir KK, & Ampy FR (1998) Acetylcholinesterase: an enzymatic marker of human red blood cell aging. Life sciences 63(3):177-184.
6. Zucker RM & Cassen B (1969) The separation of normal human leukocytes by density and classification by size. Blood 34(5):591-600.
7. Tseng JY, et al. (2014) Dynamic changes in numbers and properties of circulating tumor cells and their potential applications. Cancers 6(4):2369-2386.
8. Allen C, et al. (2006) Isolation of quiescent and nonquiescent cells from yeast stationary-phase cultures. The Journal of cell biology 174(1):89-100.
9. Bryan AK, Goranov A, Amon A, & Manalis SR (2010) Measurement of mass, density, and volume during the cell cycle of yeast. Proceedings of the National Academy of Sciences of the United States of America 107(3):999-1004.
10. Poole RK (1977) Fluctuations in Buoyant Density during the Cell Cycle of Escherichia coli K12: Significance for the Preparation of Synchronous Cultures by Age Selection. Journal of General Microbiology (98:177-186.