magnetic resonance imaging detection and time … cerebral microhemorrhages during passive...
TRANSCRIPT

Magnetic Resonance Imaging Detection and Time Courseof Cerebral Microhemorrhages during Passive Immunotherapyin Living Amyloid Precursor Protein Transgenic Mice
Feng Luo, Nathan R. Rustay, Terese Seifert, Beate Roesner, Vincent Hradil, Heinz Hillen,Ulrich Ebert, Jean M. Severin, Bryan F. Cox, Daniel A. Llano, Mark Day,and Gerard B. FoxTranslational Imaging and Biochemical Biomarkers (F.L., N.R.R., T.S., V.H., M.D., G.B.F.), Structural Biology (J.M.S), IntegrativePharmacology (B.F.C.), and Development Neuroscience (D.A.L.), Global Pharmaceutical Research and Development, AbbottLaboratories, Abbott Park, Illinois; and CNS Discovery Research, Abbott Laboratories, Ludwigshafen, Germany (B.R.,H.H., U.E.)
Received July 14, 2010; accepted September 2, 2010
ABSTRACTIn recent years immunotherapy-based approaches for treatingAlzheimer’s disease have become the subject of intensive re-search. However, an important mechanistic-related safety con-cern is exacerbation of the risk of microhemorrhage that maybe associated with fast removal of amyloid-� (A�) depositsfound in blood vessels or brain parenchyma. Rapid in vivodetection of microhemorrhages in living amyloid precursor pro-tein transgenic mice has not been described, and histologicalanalysis can take several months before this risk is assessed.Aged transgenic mice were divided into two groups that wouldundergo longitudinal passive immunotherapy for 12 or 18weeks. 6G1, a nonselective anti-A� monoclonal antibody, and8F5, a more selective antioligomeric A� monoclonal antibody,were examined in both longitudinal studies. High-resolutionT2*-weighted magnetic resonance microscopy (100 � 100 �
400 �m) was used for microhemorrhage detection in vivo.Cerebral microhemorrhages by magnetic resonance imagingwere compared with histological hemosiderin staining in eachanimal; results showed that T2*-weighted magnetic resonancemicroscopy can reliably detect microhemorrhages of �60 �min diameter at baseline and after 12 to 18 weeks of treatment inthe same animals in vivo. This correlated significantly withhistological readings. This new imaging safety biomarker canbe readily applied to preclinical antibody screening in a longi-tudinal manner. 6G1 and 8F5, however, both increased micro-hemorrhage incidence in aged amyloid precursor protein trans-genic mice compared with their baseline and vehicle treatment.A highly selective antibody for soluble A� is needed to addressthe question of whether antibodies that do not bind to depos-ited A� have microhemorrhage liability.
IntroductionAlzheimer’s disease (AD) is the most common cause of
dementia (Boche et al., 2008). According to the amyloid hy-pothesis, abnormal aggregation of amyloid-� (A�) in thebrain triggers tau aggregation, microglial activation, synap-tic dysfunction, and neuronal loss, ultimately resulting incognitive decline (Hardy and Selkoe, 2002). A� accumulatesin the brains of patients with AD in the form of extracellularaggregates in the cerebral cortex and in the walls of bloodvessels as cerebral amyloid angiopathy (CAA) (Boche et al.,
2008). Therefore, A� represents an important molecular tar-get for intervention in AD, and agents that can prevent itsformation and accumulation or stimulate its clearance mayultimately be of therapeutic benefit (Schenk, 2002). Experi-mental studies of both active and passive A� immunizationin transgenic mice have confirmed that removal of existingA� plaques can occur, sometimes within a matter of days,and this is associated with cognitive benefits (Schenk etal., 1999; Janus et al., 2000; Morgan et al., 2000; Schenk,2002; Wilcock et al., 2004; Boche et al., 2008). However,several studies have demonstrated an increased incidence ofcerebral microhemorrhages ex vivo in aged transgenic miceafter a period of immunotherapy (Pfeifer et al., 2002; Rackeet al., 2005; Wilcock et al., 2007; Schroeter et al., 2008;Thakker et al., 2009). The discontinued phase II active im-
This work was funded by Abbott Laboratories.Article, publication date, and citation information can be found at
http://jpet.aspetjournals.org.doi:10.1124/jpet.110.172932.
ABBREVIATIONS: AD, Alzheimer’s disease; A�, �-amyloid; APP, amyloid precursor protein; CAA, cerebral amyloid angiopathy; FOV, field of view;MRI, magnetic resonance imaging; NBF, neutral buffered formalin; PBS, phosphate-buffered saline; TE, echo time; TR, repetition time.
0022-3565/10/3353-580–588$20.00THE JOURNAL OF PHARMACOLOGY AND EXPERIMENTAL THERAPEUTICS Vol. 335, No. 3Copyright © 2010 by The American Society for Pharmacology and Experimental Therapeutics 172932/3640810JPET 335:580–588, 2010 Printed in U.S.A.
580
http://jpet.aspetjournals.org/content/suppl/2011/02/08/jpet.110.172932.DC1.htmlSupplemental material to this article can be found at:
at ASPE
T Journals on January 13, 2015
jpet.aspetjournals.orgD
ownloaded from

munization trial with aggregated A� as an immunogen(AN1792) observed more severe CAA in immunized patientsthan those without at a similar stage of AD, with multiplecortical hemorrhages in one case (Boche et al., 2008; Thakkeret al., 2009). Furthermore, microhemorrhage and dose-dependent vasogenic edema have been reported recently inpatients with AD after passive immunization against A�(Salloway et al., 2009). These findings have significantlyaffected the clinical development of antiamyloid immuno-therapy platforms across industry and academia (Boche etal., 2008), and although the mechanism of vascular compro-mise is not known, both human and animal literature sug-gest that A� immunotherapy at least transiently worsensCAA (Thakker et al., 2009).
The analysis of microhemorrhage development may allowfor improved safety profiles of potential immunotherapeu-tics. Although detection of small (20–400 �M), individualmicrohemorrhages postmortem in mouse brain is possible byhistological examination using Prussian blue (Pfeifer et al.,2002; Racke et al., 2005; Wilcock et al., 2007), it is very timeconsuming (Pfeifer et al., 2002; Wilcock et al., 2004; Racke etal., 2005; Schroeter et al., 2008). Two further fundamentalquestions cannot be easily addressed by using the ex vivoapproach: 1) When do the microhemorrhages occur duringimmunotherapy? 2) Does age play a critical role in exacer-bating cerebral microhemorrhages during immunotherapy?Thus, a new in vivo safety biomarker for monitoring micro-hemorrhage is needed. Given the promising data favoringefficacy of the antiamyloid approach to the treatment of ADin animal models (Pfeifer et al., 2002; Racke et al., 2005;Wilcock et al., 2007; Schroeter et al., 2008; Thakker et al.,2009) it will be of great value to develop a rapid and highlysensitive method for preclinically screening potential immu-notherapeutic compounds for their potential to cause vascu-lar compromise.
MRI microscopy is capable of assessing the global anatom-ical status of rodent brains because it can provide a three-dimensional data set of the entire brain without sectioning.However, MRI-based techniques have the significant limita-tion of decreased image resolution compared with ex vivohistology. To apply MRI microscopy to the detection of cere-bral microhemorrhage in living transgenic mice, one mustdetermine whether it can provide sufficient resolution andcontrast to identify the microhemorrhage. In this article, wereport the first identification of cerebral microhemorrhage inliving APP Swedish transgenic mice by using T2*-weightedMRI microscopy with an in-plane resolution of 100 �m. APrussian blue histological readout was also acquired afterthe imaging endpoint. The fast removal of deposited A� fromthe brain vasculature has been hypothesized to be a cause ofmicrohemorrhage. Therefore, strategies that target solubleoligomers and avoid the removal of insoluble A� plaques,which are heavily involved in CAA, have been proposed(Barghorn et al., 2005) to be a potentially safer and moreeffective treatment for AD than nonspecific removal of mul-tiple species of A�. To test the hypothesis that fewer micro-hemorrhages will occur when soluble A� oligomers are tar-geted (reducing the removal of insoluble A� plaques in thevessel walls), two different anti-A� monoclonal antibodieswere used in two longitudinal studies in aged Tg2576 mice. Anonselective antibody targeting soluble and insoluble A�
(6G1) and a more selective antioligomer antibody (8F5) wereused (Barghorn et al., 2005).
Materials and MethodsInitial Control Study
Seven male C57BL/6 mice (approximately 3–6 months old at thetime of imaging), purchased from Taconic Farms (Germantown, NY),were used in control studies to determine the feasibility of using MRIto detect hemosiderin deposits in vivo. Hemosiderin deposits resultfrom the phagocytosis of hemoglobin by macrophages and are used asa histological marker of hemorrhage. In these studies, mice wereanesthetized with 2.5% isoflurane in oxygen and placed into a smallanimal stereotaxic adapter (Stoelting, Chicago, IL) fitted to a largerstereotaxic frame (David Kopf Instruments, Tujunga, CA). A midlinescalp incision was made by using sterile surgical techniques, and 0.1�l of whole arterial blood was microinjected intracerebrally via aburr hole to deliver to a point at the cortical and subcortical junction(coordinates from bregma: anterior posterior, �1.7 mm; mediolat-eral, 1.0 mm; dorsal-ventral, 2.5 mm; dorsal-ventral set at 2.5 mm toallow for needle bevel). Donor arterial blood was obtained fresh fromseven additional male mice (Taconic Farms) from the carotid arteryunder terminal isoflurane anesthesia.
Transgenic Mice
A total of 60 heterozygous double Swedish mutation (K670N andM671L) Tg2576 transgenic mice that express human APP cDNA(Hsiao et al., 1996; Spires and Hyman, 2005) were obtained fromTaconic Farms at approximately 3 months of age. Mice were imagedat approximately 17 to 23 months of age. In the 12-week passiveimmunotherapy study, 30 male and female Tg2576 mice underwentbaseline MRI scan at the age of 19 months, followed by 12 weeklyintraperitoneal injections of vehicle [phosphate-buffered saline(PBS)], antibody 6G1 (0.5 mg/mouse/week in 0.1 ml of PBS), orantibody 8F5 (0.5 mg/mouse/week in 0.1 ml of PBS), with 10 mice pergroup (Fig. 1). In the 18-week passive immunotherapy study, an-other 30 male Tg2576 mice underwent a baseline MRI scan at theage of 17 months followed by 18 weeks of weekly treatment withantibody 8F5 (0.5 mg/mouse/week in 0.1 ml of PBS) or control anti-body IgG2a (0.5 mg/mouse/week in 0.1 ml of PBS) (Fig. 1). Passivevaccination was commenced within 1 week of completion of baselineMRI acquisition. Female mice were group-housed and male micewere single-housed in filtered isolation cages initially and thentransferred to a filtered, forced-air isolation rack. All mice weremaintained on standard sterile wood chip bedding in a quiet roomunder conditions of 12-h lights on/12-h lights off (on at 6:00 AM),with food and water available ad libitum. An electronic chip, IMI-1000 from Bio Medical Data Systems (Seaford, DE), was implantedsubcutaneously in the dorsal posterior region for identification pur-poses. This chip was removed before final MRI scanning. All imagingwas performed during the light phase, and all experiments wereconducted in accordance with the Abbott Institutional Animal Careand Use Committee and the National Institutes of Health Guide forCare and Use of Laboratory Animals in facilities accredited by theAssociation for the Assessment and Accreditation of Laboratory An-imal Care.
MRI Methodology
MRI experiments were carried out by using a Bruker BioSpinhorizontal-bore scanner (7.0 T/21 cm, 300 MHz) (Bruker BioSpin,Ettlingen, Germany) equipped with a triple-axis gradient unit (max-imum 40 G/cm per direction). Animals were first anesthetized withmedetomidine hydrochloride (Domitor, 1 mg/kg i.p.; Pfizer AnimalHealth, Exton, PA) � ketamine (75 mg/kg i.p.; Fort Dodge AnimalHealth, Fort Dodge, IA) (Luo et al., 2008) and then placed in adual-coil small animal restrainer (Insight Neuroimaging Systems,LLC, Worcester, MA), which contains a volume coil for transmitting
MRI Detection of Cerebral Microhemorrhage in Tg2576 Mice 581
at ASPE
T Journals on January 13, 2015
jpet.aspetjournals.orgD
ownloaded from
and a surface coil for receiving. Respiration rates and waveformswere continuously monitored via a force transducer. Rectal temper-ature was monitored and maintained at 37 � 1°C via a feedback-regulated, circulating water pad. For longitudinal imaging studies,medetomidine anesthesia was reversed by intraperitoneal injectionof atipamezole (0.1 mg/kg; Antisedan; Pfizer, Karlsruhe, Germany)at the end of each imaging session (Weber et al., 2006). Coil-to-coilelectromagnetic interaction was actively decoupled. Multislice, mul-tiecho pulse sequence with TR/TE � 500/11 ms, bandwidth � 2700Hz, FOV � 2.56 � 2.56 cm, imaging matrix � 256 � 256, and sixaverages was used for T1 anatomical images for eight 1-mm slices.Rapid acquisition relaxation enhanced pulse sequence with TR/TE �3000/50 ms, bandwidth � 5400 Hz, FOV � 2.56 � 2.56 cm, matrix �256 � 256, rapid acquisition relaxation enhanced factor � 8, and fouraverages was used for T2 anatomical images for eight 1.0-mm slices.In-plane resolution for T1 and T2 anatomical images were 100 � 100�m and covered the range of interaural 6.0 to �1.0 mm. A gradientecho three-dimensional fast low-angle shot sequence with TR/TE �100/13 ms, bandwidth � 22,000 Hz, FOV � 2.56 � 2.56 cm, imagingmatrix � 256 � 256 � 16, and four averages was used for T2*anatomical images with in-plane resolution � 100 � 100 �m andinterplane resolution � 400 �m and covered the range of approxi-mately interaural 6.0 to 0.0 mm. After intracerebral microinjection ofwhole arterial blood in the initial control studies, acute scans wereobtained from all seven mice within 30 min. Of these, three micewere perfusion-fixed for subsequent histological assessment andidentification of acute “hemorrhage.” The remaining four mice werehoused for an additional 14 days, at which point two of the mice wererescanned for identification of hemosiderin deposits resulting fromthe initial injection. After MRI, theses mice and the remaining twomice were perfusion-fixed for histochemical confirmation of hemo-siderin deposits. Ex vivo T2*-weighted MRI microscopy was con-ducted after in vivo imaging in the same animal for the 12-weeklongitudinal study. Thorough cardiac perfusion was used to eradi-cate blood flow void signal in the ex vivo setting. For the 18-weeklongitudinal MRI study, multiple time-point MRI readouts werecollected at 6, 12, and 18 weeks after baseline acquisition. Theparadigms for the 12- and 18-week longitudinal MRI studies areillustrated in Fig. 1.
Histology
Initial Control Studies. For the initial control studies, threemice that were microinjected with arterial blood were euthanizedwith 100% CO2, 2 h after the microinjection (after the initial MRIscan). Brains were removed and immersion-fixed in neutral bufferedformalin (NBF). After paraffin embedding, sectioning was conducted
on a microtome at 6-�m slice thickness. Hematoxylin and eosinstaining was used to visualize the acute hemorrhage. Detection ofacute hemorrhage via histology was compared with MRI images inthe same area. Perl’s Prussian blue staining was used to identifyhemosiderin deposits in the remaining four normal C57BL/6 mice 14days after blood microinjection. Detection of chronic hemorrhageusing MRI was compared with histology in each animal.
Twelve- and 18-Week Longitudinal Studies. For the two lon-gitudinal studies, after the last in-life MRI scan, each mouse wasdeeply anesthetized with medetomidine/xylazine and perfused withice-cold PBS at a rate of 5.0 ml/min for 2.5 min via the left atrium byusing an open thorax method. The right atrium was cut at the startof the perfusion. Each mouse was then perfusion-fixed with 10%NBF at a rate of 5 ml/min for 5.5 min. For the first 12-week immu-notherapy study, the brain was removed from each mouse, cut intotwo hemispheres, and postfixed in 10% NBF overnight. Brains weresubsequently cryoprotected by placement in a solution of 30% su-crose for approximately 2 days (until the brain hemispheres hadfallen to the bottom of the vial) and stored at 4°C until sectioning.Brains were sectioned at 30 �m with a cryostat. The right hemi-sphere was sectioned in the coronal plane, and the left hemispherewas sectioned in the horizontal plane. A total of eight series ofsections were cut. One series of sections was stained with Perl’sPrussian blue to identify hemosiderin deposits resulting from micro-hemorrhages and counterstained with neutral red. An arbitrary 60�m was used to categorize Prussian blue-positive lesions into twopools: number of all lesions versus number of lesion with size �60�m. This was based on control studies that indicated this may be apossible detection size limit for our MRI protocol. An adjacent seriesof sections was stained with Congo red to identify A� deposits. Theremaining six series of sections were stored for alternative futurehistochemical analyses. Thus, there was approximately 240 �m (30�m � eight series) between each section analyzed. For the second18-week passive immunization study, the whole brain was sectionedin the coronal plane; otherwise the same histological preparationwas used.
Antibodies
Antibodies were produced at Abbott Laboratories (Structural Bi-ology, Advanced Technology, Abbott Park, IL). Monoclonal antibod-ies 6G1 and 8F5 were generated from mice immunized with A�1–42
globulomer according to standard procedures (Barghorn et al., 2005).Antibody 8F5 is reported to be approximately 100 times more selec-tive than 6G1 for soluble A� oligomers (Barghorn et al., 2005). Inbrief, anti-A� mAb ML5–6G1.3E2.5C3 (molecular mass 150 kDa)was produced by fermentation in 25-liter wave bags, purified of most
Baseline imaging
MRI #0
Baseline imaging
MRI #0
Baseline imaging
MRI #0
End point
MRI #1
Week 1 2 3 4 5 6 7 8 9 10 11 12
Week 1 2 3 4 5 6 7 8 9 10 11 12 13 14 15 16 17 18
End point
MRI #3
1st point
MRI #1
12 weeks study
18 weeks study
Dosing
Dosing
19 mon. 20 mon. 21 mon. 22 mon. 23 mon.
Tg2576 age
Tg2576 age
17 mon. 18 mon. 19 mon. 20 mon. 21 mon. 22 mon. 23 mon.
1st point
MRI #1
2nd point
MRI #2
Baseline imaging
MRI #0
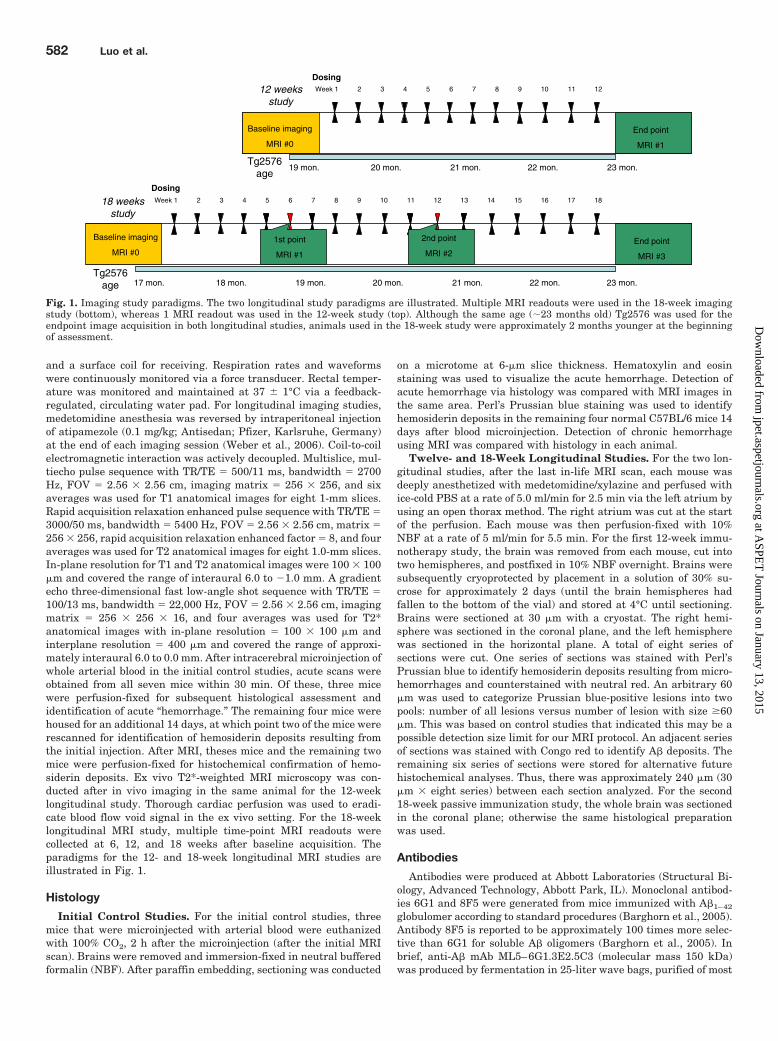
Fig. 1. Imaging study paradigms. The two longitudinal study paradigms are illustrated. Multiple MRI readouts were used in the 18-week imagingstudy (bottom), whereas 1 MRI readout was used in the 12-week study (top). Although the same age (�23 months old) Tg2576 was used for theendpoint image acquisition in both longitudinal studies, animals used in the 18-week study were approximately 2 months younger at the beginningof assessment.
582 Luo et al.
at ASPE
T Journals on January 13, 2015
jpet.aspetjournals.orgD
ownloaded from
endotoxin (approximately 1 EU/mg remained), and provided in avolume of 57 ml and a concentration of 0.96 mg/ml in PBS at pH 7.4.Anti-A� mAb ML5–8F5 (molecular mass 148 kDa) was produced byfermentation in 10-liter wave bags, purified of endotoxin, and pro-vided in a volume of 20 ml and a concentration of 1.65 mg/ml in PBSat pH 7.4. IgG2a, 35 ml at a concentration of 7.03 mg/ml, wasproduced by Abbott Laboratories (Structural Biology, AdvancedTechnology) and used as a negative control for 8F5 in the second18-week vaccination study. Antibody solutions were diluted understerile conditions in PBS pH 7.4 and aliquoted into sterile tubes andstored at 4°C until use. All solutions were prepared fresh on the dayof injection. Each transgenic mouse was dosed with 0.5 mg/week i.p.
Data Analysis
Microhemorrhage incidence identified by MRI was determined bytwo independent, blinded investigators after the completion of thein-life portion of the study. This was conducted by reviewing scans onthe console monitor in the imaging laboratory in a blinded mannerover 4 to 6 h. Scorers were first trained to examine “normal,” non-pathological MRI data from young, healthy mice. This was done toget accustomed to the typical hyperintensities and hypointensitiesthat are present in T2*-weighted scans. Because microhemorrhagesignals often present asymmetrically in the brain, bilateral signalsin congruent brain regions were usually excluded from microhemor-rhage quantification. Microhemorrhage incidence identified by his-tology was also determined by two investigators using the postmor-tem tissue sections. This was conducted in a blinded manner over afull 30-day period using a light microscope (Nikon, Tokyo, Japan).Each section on each slide was evaluated separately in a grid pattern(left to right, top to bottom) under 60� (6� objective lens, 10�eyepiece lens) magnification. Higher magnification (120�, 240�)was used for clarification of unclear points of interest. Microhemor-rhages were counted on a per-site basis in Prussian blue-stainedsections. Using a stage micrometer, the estimated size, location, andnature (intensity of staining) of each cluster site was individuallyrecorded. To account for differences in every cluster site that couldcontain several hemosiderin deposits close together or spread furtherapart, microhemorrhage data collected by histology were trans-formed into microhemorrhage scores (Pfeifer et al., 2002; Racke etal., 2005), based on the number of hemosiderin-positive cells de-tected in each deposit. Each deposit was rated with a score of 1 to3 based on the following criteria: 1 � one to three hemosiderin-positive cells, 2 � four to 10 hemosiderin-positive cells, and 3 �10 hemosiderin-positive cells. Each mouse’s microhemorrhagescore was calculated by multiplying the rating of each deposit bythe total number of deposits, which provided a general estimate ofthe extent of microhemorrhage (Pfeifer et al., 2002; Racke et al.,2005). All calculations were made by using Prism version 4.0 forWindows (GraphPad Software Inc., San Diego, CA). Quantifiedmicrohemorrhage data were analyzed by one- or two-way analysisof variance (with repeated-measures where appropriate), and sig-nificant main effects and interactions were analyzed by Bonfer-roni post hoc tests. An level of p � 0.05 was set for statisticalsignificance.
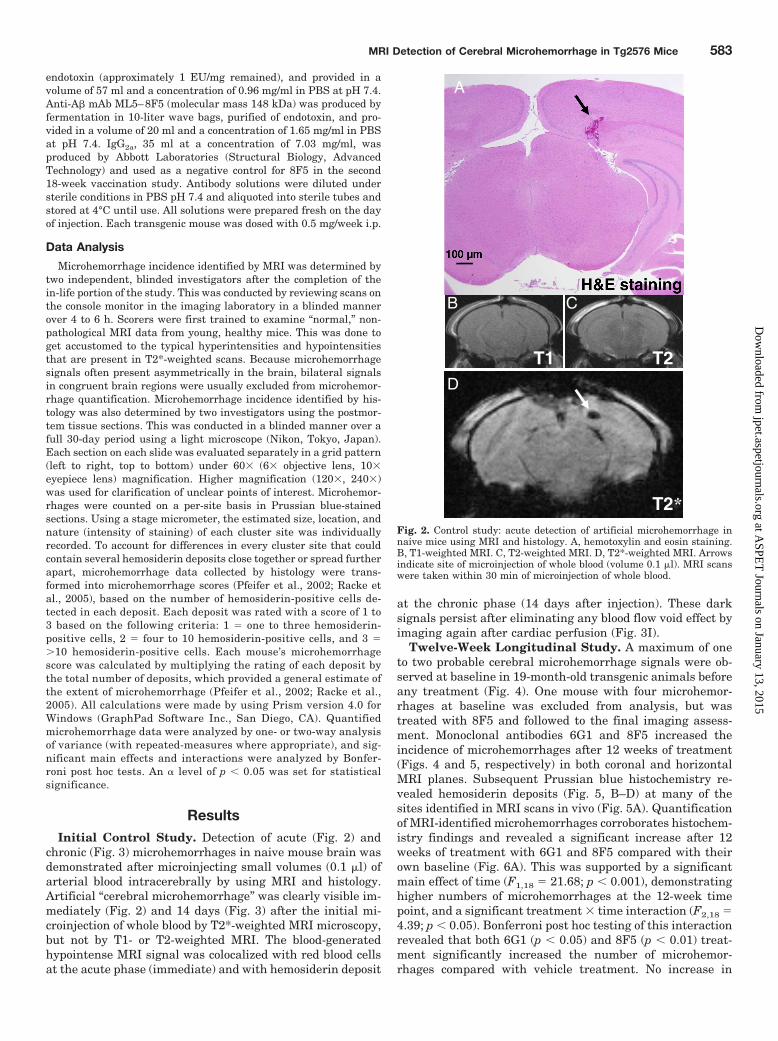
ResultsInitial Control Study. Detection of acute (Fig. 2) and
chronic (Fig. 3) microhemorrhages in naive mouse brain wasdemonstrated after microinjecting small volumes (0.1 �l) ofarterial blood intracerebrally by using MRI and histology.Artificial “cerebral microhemorrhage” was clearly visible im-mediately (Fig. 2) and 14 days (Fig. 3) after the initial mi-croinjection of whole blood by T2*-weighted MRI microscopy,but not by T1- or T2-weighted MRI. The blood-generatedhypointense MRI signal was colocalized with red blood cellsat the acute phase (immediate) and with hemosiderin deposit
at the chronic phase (14 days after injection). These darksignals persist after eliminating any blood flow void effect byimaging again after cardiac perfusion (Fig. 3I).
Twelve-Week Longitudinal Study. A maximum of oneto two probable cerebral microhemorrhage signals were ob-served at baseline in 19-month-old transgenic animals beforeany treatment (Fig. 4). One mouse with four microhemor-rhages at baseline was excluded from analysis, but wastreated with 8F5 and followed to the final imaging assess-ment. Monoclonal antibodies 6G1 and 8F5 increased theincidence of microhemorrhages after 12 weeks of treatment(Figs. 4 and 5, respectively) in both coronal and horizontalMRI planes. Subsequent Prussian blue histochemistry re-vealed hemosiderin deposits (Fig. 5, B–D) at many of thesites identified in MRI scans in vivo (Fig. 5A). Quantificationof MRI-identified microhemorrhages corroborates histochem-istry findings and revealed a significant increase after 12weeks of treatment with 6G1 and 8F5 compared with theirown baseline (Fig. 6A). This was supported by a significantmain effect of time (F1,18 � 21.68; p � 0.001), demonstratinghigher numbers of microhemorrhages at the 12-week timepoint, and a significant treatment � time interaction (F2,18 �4.39; p � 0.05). Bonferroni post hoc testing of this interactionrevealed that both 6G1 (p � 0.05) and 8F5 (p � 0.01) treat-ment significantly increased the number of microhemor-rhages compared with vehicle treatment. No increase in
T1 T2
T2*
CB
D
A
Fig. 2. Control study: acute detection of artificial microhemorrhage innaive mice using MRI and histology. A, hemotoxylin and eosin staining.B, T1-weighted MRI. C, T2-weighted MRI. D, T2*-weighted MRI. Arrowsindicate site of microinjection of whole blood (volume 0.1 �l). MRI scanswere taken within 30 min of microinjection of whole blood.
MRI Detection of Cerebral Microhemorrhage in Tg2576 Mice 583
at ASPE
T Journals on January 13, 2015
jpet.aspetjournals.orgD
ownloaded from
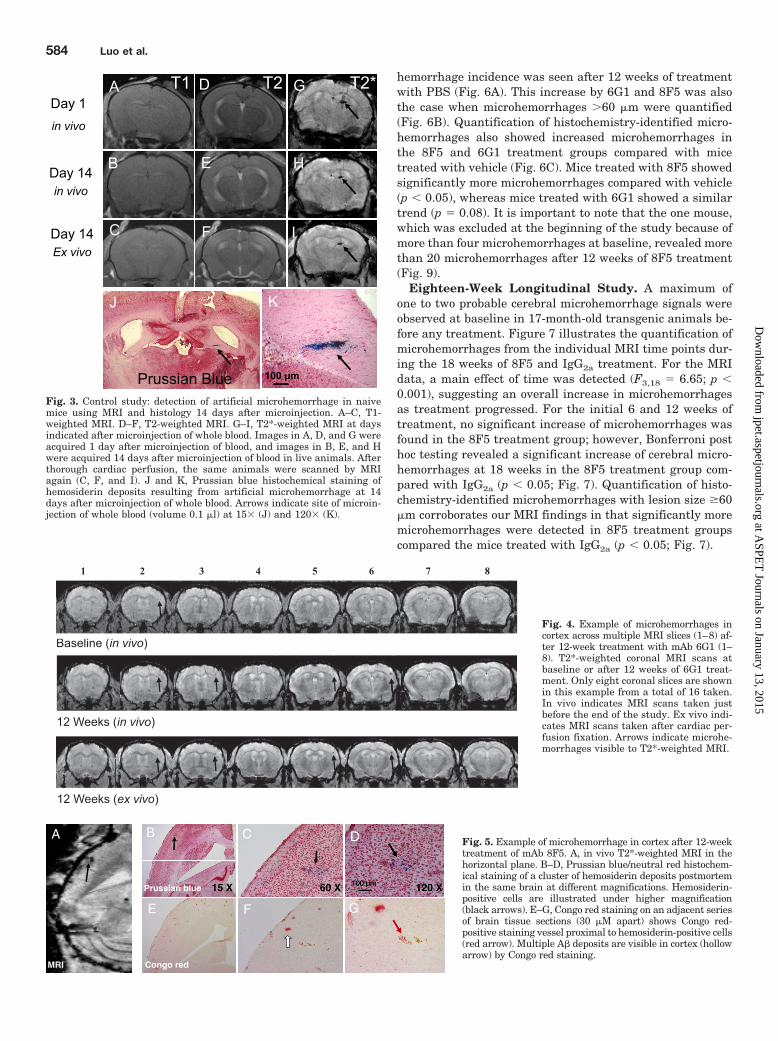
hemorrhage incidence was seen after 12 weeks of treatmentwith PBS (Fig. 6A). This increase by 6G1 and 8F5 was alsothe case when microhemorrhages 60 �m were quantified(Fig. 6B). Quantification of histochemistry-identified micro-hemorrhages also showed increased microhemorrhages inthe 8F5 and 6G1 treatment groups compared with micetreated with vehicle (Fig. 6C). Mice treated with 8F5 showedsignificantly more microhemorrhages compared with vehicle(p � 0.05), whereas mice treated with 6G1 showed a similartrend (p � 0.08). It is important to note that the one mouse,which was excluded at the beginning of the study because ofmore than four microhemorrhages at baseline, revealed morethan 20 microhemorrhages after 12 weeks of 8F5 treatment(Fig. 9).
Eighteen-Week Longitudinal Study. A maximum ofone to two probable cerebral microhemorrhage signals wereobserved at baseline in 17-month-old transgenic animals be-fore any treatment. Figure 7 illustrates the quantification ofmicrohemorrhages from the individual MRI time points dur-ing the 18 weeks of 8F5 and IgG2a treatment. For the MRIdata, a main effect of time was detected (F3,18 � 6.65; p �0.001), suggesting an overall increase in microhemorrhagesas treatment progressed. For the initial 6 and 12 weeks oftreatment, no significant increase of microhemorrhages wasfound in the 8F5 treatment group; however, Bonferroni posthoc testing revealed a significant increase of cerebral micro-hemorrhages at 18 weeks in the 8F5 treatment group com-pared with IgG2a (p � 0.05; Fig. 7). Quantification of histo-chemistry-identified microhemorrhages with lesion size �60�m corroborates our MRI findings in that significantly moremicrohemorrhages were detected in 8F5 treatment groupscompared the mice treated with IgG2a (p � 0.05; Fig. 7).
Day 1in vivo
T1 T2 T2*
Day 14in vivo
Day 14Ex vivo
Prussian Blue 100 µm
Fig. 3. Control study: detection of artificial microhemorrhage in naivemice using MRI and histology 14 days after microinjection. A–C, T1-weighted MRI. D–F, T2-weighted MRI. G–I, T2*-weighted MRI at daysindicated after microinjection of whole blood. Images in A, D, and G wereacquired 1 day after microinjection of blood, and images in B, E, and Hwere acquired 14 days after microinjection of blood in live animals. Afterthorough cardiac perfusion, the same animals were scanned by MRIagain (C, F, and I). J and K, Prussian blue histochemical staining ofhemosiderin deposits resulting from artificial microhemorrhage at 14days after microinjection of whole blood. Arrows indicate site of microin-jection of whole blood (volume 0.1 �l) at 15� (J) and 120� (K).
Baseline (in i o)
1 2 3 4 5 6 7 8
Baseline (in vivo)Baseline (in vivo)
12 Weeks (in vivo)
12 Weeks (ex vivo)
12 Weeks (in vivo)
12 Weeks (in vivo)
12 Weeks (ex vivo)
12 Weeks (ex vivo)
Fig. 4. Example of microhemorrhages incortex across multiple MRI slices (1–8) af-ter 12-week treatment with mAb 6G1 (1–8). T2*-weighted coronal MRI scans atbaseline or after 12 weeks of 6G1 treat-ment. Only eight coronal slices are shownin this example from a total of 16 taken.In vivo indicates MRI scans taken justbefore the end of the study. Ex vivo indi-cates MRI scans taken after cardiac per-fusion fixation. Arrows indicate microhe-morrhages visible to T2*-weighted MRI.
MRI
15 X 60 X
B C D
E F G
A
Prussian blue
Congo red
Fig. 5. Example of microhemorrhage in cortex after 12-weektreatment of mAb 8F5. A, in vivo T2*-weighted MRI in thehorizontal plane. B–D, Prussian blue/neutral red histochem-ical staining of a cluster of hemosiderin deposits postmortemin the same brain at different magnifications. Hemosiderin-positive cells are illustrated under higher magnification(black arrows). E–G, Congo red staining on an adjacent seriesof brain tissue sections (30 �M apart) shows Congo red-positive staining vessel proximal to hemosiderin-positive cells(red arrow). Multiple A� deposits are visible in cortex (hollowarrow) by Congo red staining.
584 Luo et al.
at ASPE
T Journals on January 13, 2015
jpet.aspetjournals.orgD
ownloaded from

Correlation of MRI and Histology. Figure 8 shows thecorrelation plot for microhemorrhage findings by MRI andhistology in the two longitudinal studies. A significant corre-lation was observed for all microhemorrhages identified byhistology versus microhemorrhages identified by MRI (r2 �0.5492; p � 0.0001). An improved correlation was found whenplotting lesion size �60 �m identified by histology versusMRI findings (r2 � 0.7511; p � 0.0001). Noticeably, a near 1:1ratio was observed in Fig. 8B, which implies that microhem-orrhages of �60 �m are quite likely to be detected by T2*-weighted MR microscopy using our current protocol.
DiscussionAn independent safety monitoring committee has found
that patients with AD given the highest dose of an experi-mental monoclonal antibody, bapineuzumab, were morelikely to develop cerebral vasogenic edema; the highest dosewas subsequently discontinued from the clinical trial (Sallo-way et al., 2009). The Food and Drug Administration has also
posted concerns regarding the safety of immunotherapy ap-proaches, stating that microhemorrhage susceptibility is arisk factor for vasogenic edema. This highlights the impor-tance of such safety assessments while developing immuno-therapy strategies for the treatment of AD.
Although the diagnosis of microhemorrhages in humanbrain by gradient-echo sequence or T2*-weighted MRI (Of-fenbacher et al., 1996; Fazekas et al., 1999; Greenberg et al.,2004) has been established, the preclinical identification ofcerebral microhemorrhage is challenging because microhem-orrhage in a mouse brain is approximately two orders ofmagnitude smaller (in the range 20 to 400 �m) than thatfound in human brain (�5 mm in size) (Viswanathan andChabriat, 2006). In our initial control study, we demon-strated the feasibility of detecting cerebral microhemorrhagein living transgenic mice. We were able to visualize a hypoin-tense MRI signal immediately after microinjection of 0.1 �l ofarterial blood, which represents the proposed upper limit ofmicrohemorrhage size (400 � 400 � 500 �m3) induced byimmunotherapy in aged transgenic mice (Pfeifer et al., 2002;Racke et al., 2005; Wilcock et al., 2007; Thakker et al., 2009).Second, we observed the hypointense MRI signal 14 daysafter exogenous blood injection, which remained even afterperfusion of the brain with PBS. Although deoxygenatedblood signal may contribute to the hypointensity MRI findingin the acute phase (Linfante et al., 1999), hemosiderin depos-its after macrophage phagocytosis of red blood cells (Bradley,1993; Viswanathan and Chabriat, 2006) during the chronicphase of bleeding results in the hypointense signal in T2*-weighted MRI demonstrated in Fig. 2. That the hypointenseMRI signal is detectable at the location of blood microinjec-tion even after 14 days rules out the possibility of a vascularflow void effect (Fig. 2) and is supported by the detection ofhemosiderin deposits via Prussian blue histochemistry(Bradley, 1993; Viswanathan and Chabriat, 2006).
Immunotherapy-induced cerebral microhemorrhages weredetected in aged living transgenic mice by T2*-weighted MRImicroscopy (Figs. 4–6). Support for the use of MRI for detec-tion of microhemorrhages comes from the fact that thoseidentified by MRI microscopy quite often colocalized withthose determined by histology. It is important to note that apoint-to-point comparison between histology and MRI is notfeasible (Jack et al., 2004), because of the different in-planeand interplane resolution used in MRI (in-plane: 100 � 100�m; interplane: 400 �m) and histology (in-plane: �; inter-
MRI Histology
**
**
CB
Vehicl
e6G
18F
50
1
2
3
4
5
6
Nu
mb
er N
EW
Hs
(> 6
0um
)Veh
icle
6G1
8F5
0
1
2
3
4
5
6
Nu
mb
erH
s (>
60u
m)
Vehicl
e bas
eline
Vehic
le 12
wee
ks
6G1 b
aseli
ne
6G1 1
2 wee
ks
8F5 b
aseli
ne
8F5 1
2 wee
ks0
1
2
3
4
5
6
Num
berµ
Hs
MRIA
*
*
µ
µ
Fig. 6. A, MRI findings of microhemor-rhages are illustrated (mean � S.E.M.) atbaseline and after 12 weeks of treatmentwith vehicle, 6G1, and 8F5. B, number ofnew �H 60 �m detected by MRI after 12weeks of treatment. C, histology: quanti-fication of microhemorrhage (mean �S.E.M.) with lesion size �60 �m after12-week treatment of vehicle, 6G1, and8F5 is illustrated. �, P � 0.05 comparedwith vehicle at 12-week time point (Bon-ferroni post hoc test).
week 0
week 6
week 1
2
week 1
8
histolo
gy0.0
1.0
2.0
3.0
4.0
5.0
6.0
Nu
mb
erµ H
s
*
*
Fig. 7. Time course of MRI findings of microhemorrhage (mean � S.E.M.)at baseline, 6 weeks, 12 weeks, and 18 weeks in IgG2a or 8F5 treatmentgroups. Œ, 8F5, …, IgG2a. Histology: quantification of microhemorrhage(mean � S.E.M.) with lesion size �60 �m after 18-week treatment ofIgG2a or 8F5 is shown. �, P � 0.05 compared with IgG2a (Bonferroni posthoc test) for MRI data or IgG2a (one-tailed t test) for histology data.
MRI Detection of Cerebral Microhemorrhage in Tg2576 Mice 585
at ASPE
T Journals on January 13, 2015
jpet.aspetjournals.orgD
ownloaded from

plane: 240 �m). Because of this, there is not a perfect slice-to-slice comparison for MRI and histology. Nevertheless, ourfindings in histology significantly correlated with MRI find-ings in the current data set (Fig. 8), and one might speculatean improved correlation if entire histology sections wereused.
There is the potential that hypointensities found in T2 orT2*-weighted MRI microscopy could be attributed to A�plaques in transgenic mice (Jack et al., 2004; Lee et al., 2004;Zhang et al., 2004). This is unlikely in our study, because wedid not use an extremely high resolution in MRI (100 �mversus �50 to 60 �m; Jack et al., 2004; Lee et al., 2004;Zhang et al., 2004) as is required for potential interference byA� plaques. Sigurdsson et al. (2008) have shown that verylarge plaque deposits are detectable in aged Tg2576 mice viaT2*-weighted MRI at 100-�m resolution. However, given thesize of the plaques detected by Congo red in our work (Fig. 5),which seem smaller than 100 �m (the reported maximalplaque size in mice; Jack et al., 2004), we do not believe thatmany plaques would be detected by MRI in our studies. Inaddition, there was a greater correspondence between thelocation of MR hypointensities and hemosiderin deposits;Congo red-positive plaques tended not to colocalize with he-mosiderin deposits (see Fig. 5).
Although we were able to successfully implement the use ofT2*-weighted MRI microscopy to identify cerebral microhe-morrhage in living mouse brain, the mechanisms of anti-A�immunotherapy-induced microhemorrhages in aged trans-genic mice are still not fully understood. Although we repli-cated the effect of monoclonal mouse antibody 6G1 (structur-ally equivalent to antibody 6E10; see Barghorn et al., 2005)
to exacerbate cerebral microhemorrhages in aged transgenicmice (Thakker et al., 2009), 8F5, a more selective antibody tosoluble oligomers, was also associated with cerebral micro-hemorrhage examined in the first and confirmed in the sec-ond longitudinal study (Figs. 6 and 7). It is possible thatbecause of the high relative concentration of insoluble tosoluble A� in the brain of Tg2576 mice at older ages(Kawarabayashi et al., 2001) that the more selective antibody8F5 demonstrated some nonspecific binding to fibrillar A�and the vasculature. This may have contributed to the sim-ilar effects on microhemorrhage production in both 6G1- and8F5-treated groups.
A study by Racke et al. (2005) demonstrated that theoccurrence of cerebral microhemorrhage depends on the an-tibody being used. Although 3D6, an N-terminal antibodywith fibril plaque binding capacity, resulted in an increasedincidence of microhemorrhage, 266, a mid-domain antibodywithout plaque binding, did not show such a liability signalin aged PDAPP transgenic mice after a 6-week dosing regi-men (Racke et al., 2005). The authors suggest that the resultsindicate plaque binding is necessary for increased microhe-morrhage to occur, although it is possible that 6 weeks ofexposure was not enough to detect a treatment effect. Ourresults from the second 18-week longitudinal study furtheremphasize the complexity of these microhemorrhage mecha-nisms, because none were observed at the 6- and 12-weekimaging time points during 8F5 treatment. The same anti-body titer is expected across all treatment durations (al-though not measured in the current studies), although mi-crohemorrhage was detected only at the 18-week time point.By taking the advantage of imaging in a longitudinal man-
A B(r2=0.7511; p<0.0001)
0 10 20 30 40 50 600
10
20
30
Total histology
MR
I en
dp
oin
t re
ado
ut
(r2=0.5492; p<0.0001)
0 10 20 300
10
20
30
���� 60um Histology
MR
I en
dp
oin
t rea
do
ut
Fig. 8. Correlation of MRI and histology in two longitudi-nal studies. A, MRI quantification of microhemorrhagesversus histology quantification of all detectable microhem-orrhages. B, MRI quantification of microhemorrhages ver-sus histology quantification of microhemorrhages with le-sion size �60 �m.
xRbAm 5F8 retfAenilesaB
Fig. 9. One mouse that was excluded at the beginning ofthe 12-week longitudinal study (because of multiple abnor-mal MRI findings at baseline) revealed massive exacerba-tion of microhemorrhages (red circles) after 8F5 treatment.Second slices in the middle rows were magnified (�10�)for better visualization of microhemorrhage-induced hy-pointensity signal in MRI.
586 Luo et al.
at ASPE
T Journals on January 13, 2015
jpet.aspetjournals.orgD
ownloaded from

ner, we provide evidence that a sufficient antibody dosingduration, here 12 to 18 weeks, may be necessary for im-munotherapy-induced cerebral microhemorrhage in agedTg2576 mice. Nevertheless, the mechanisms involved in A�immunization-associated risk of cerebral hemorrhage war-rant further investigation.
Despite the unknown mechanism by which immunother-apy may cause cerebral microhemorrhage, it seems that ageis a significant factor. This is supported by the work ofseveral groups showing microhemorrhage liability in differ-ent lines of APP transgenic mice over 19 months of age(Pfeifer et al., 2002; Wilcock et al., 2004, 2007; Racke et al.,2005), and others who reported no microhemorrhage signalin mice under 16 months of age (Pfeifer et al., 2002; Seabrooket al., 2006). In our second longitudinal study of 18 weeks induration, we did not observe increased incidence of microhe-morrhage until Tg2576 mice reached 21 months of age, illus-trated in Fig. 6. By using a multiple time-point readout, ourlongitudinal MRI study provides the first direct evidencethat age is an important factor for the development ofcerebral microhemorrhage during immunotherapy. Signif-icant development of CAA in aged transgenic mice (Pfeiferet al., 2002; Wilcock et al., 2004; Kumar-Singh et al., 2005;Racke et al., 2005) is presumably the cause, althoughspontaneous cerebral microhemorrhage in aged transgenicmice does occur (Kumar-Singh et al., 2005). This corrobo-rates our baseline MRI findings of very few microhemor-rhages (Figs. 4 and 7).
Because it is feasible to diagnose cerebral microhemorrhagein transgenic mice and humans using the T2*-weighted MRItechnique, the success of A� immunotherapy may be improvedby screening patients with Alzheimer’s for the presence andseverity of CAA and baseline microhemorrhages before suchtherapies are undertaken, especially for those patients under-going treatment with anticoagulants. Although clinical trialfindings with bapineuzumab in general showed good safety andtolerability, it is very important to note that all trials are ex-cluding patients with cerebrovascular disease or MRI vascularabnormalities. Our findings in Tg2576 mice (Fig. 9) imply thatpatients with AD and preexisting cerebrovascular disease orMRI vascular abnormalities could be susceptible to severe ad-verse effects during immunotherapy.
In conclusion, a new preclinical safety biomarker for anti-body-induced cerebral microhemorrhages is described. Anti-A�antibodies 6G1 and 8F5 increased the incidence of microhem-orrhage in aged Tg2576 mice compared with baseline and ve-hicle-treated controls. This is the first example of exacerbationof cerebral microhemorrhages by a soluble oligomeric A�-selec-tive antibody. A highly selective antibody for soluble oligomersthat demonstrates little or no vascular plaque binding warrantsfurther investigation. T2*-weighted MR microscopy can bereadily applied to screening all A�-targeted immunotherapeu-tics in a longitudinal manner. This methodology can also beused in the evaluation of compounds directly targeting CAA,which is a disorder of growing societal importance and with fewtherapeutic options (Towfighi et al., 2005). Therefore, the infor-mation generated using this technology has the potential todirectly translate to human clinical trials and thus may accel-erate drug innovation.
ReferencesBarghorn S, Nimmrich V, Striebinger A, Krantz C, Keller P, Janson B, Bahr M,
Schmidt M, Bitner RS, Harlan J, et al. (2005) Globular amyloid �-peptide oligomer
- a homogenous and stable neuropathological protein in Alzheimer’s disease.J Neurochem 95:834–847.
Boche D, Zotova E, Weller RO, Love S, Neal JW, Pickering RM, Wilkinson D, HolmesC, and Nicoll JA (2008) Consequence of A� immunization on the vasculature ofhuman Alzheimer’s disease brain. Brain 131:3299–3310.
Bradley WG Jr (1993) MR appearance of hemorrhage in the brain. Radiology 189:15–26.
Fazekas F, Kleinert R, Roob G, Kleinert G, Kapeller P, Schmidt R, and Hartung HP(1999) Histopathologic analysis of foci of signal loss on gradient-echo T2*-weightedMR images in patients with spontaneous intracerebral hemorrhage: evidence ofmicroangiopathy-related microbleeds. AJNR Am J Neuroradiol 20:637–642.
Greenberg SM, Eng JA, Ning M, Smith EE, and Rosand J (2004) Hemorrhage burdenpredicts recurrent intracerebral hemorrhage after lobar hemorrhage. Stroke 35:1415–1420.
Hardy J and Selkoe DJ (2002) The amyloid hypothesis of Alzheimer’s disease:progress and problems on the road to therapeutics. Science 297:353–356.
Hsiao K, Chapman P, Nilsen S, Eckman C, Harigaya Y, Younkin S, Yang F, and ColeG (1996) Correlative memory deficits, A� elevation, and amyloid plaques in trans-genic mice. Science 274:99–102.
Jack CR Jr, Garwood M, Wengenack TM, Borowski B, Curran GL, Lin J, Adriany G,Grohn OH, Grimm R, and Poduslo JF (2004) In vivo visualization of Alzheimer’samyloid plaques by magnetic resonance imaging in transgenic mice without acontrast agent. Magn Reson Med 52:1263–1271.
Janus C, Pearson J, McLaurin J, Mathews PM, Jiang Y, Schmidt SD, Chishti MA,Horne P, Heslin D, French J, et al. (2000) A � peptide immunization reducesbehavioural impairment and plaques in a model of Alzheimer’s disease. Nature408:979–982.
Kawarabayashi T, Younkin LH, Saido TC, Shoji M, Ashe KH, and Younkin SG (2001)Age-dependent changes in brain, CSF, and plasma amyloid (�) protein in theTg2576 transgenic mouse model of Alzheimer’s disease. J Neurosci 21:372–381.
Kumar-Singh S, Pirici D, McGowan E, Serneels S, Ceuterick C, Hardy J, Duff K,Dickson D, and Van Broeckhoven C (2005) Dense-core plaques in Tg2576 andPSAPP mouse models of Alzheimer’s disease are centered on vessel walls. Am JPathol 167:527–543.
Lee SP, Falangola MF, Nixon RA, Duff K, and Helpern JA (2004) Visualization of�-amyloid plaques in a transgenic mouse model of Alzheimer’s disease using MRmicroscopy without contrast reagents. Magn Reson Med 52:538–544.
Linfante I, Llinas RH, Caplan LR, and Warach S (1999) MRI features of intracere-bral hemorrhage within 2 hours from symptom onset. Stroke 30:2263–2267.
Luo F, Seifert TR, Edalji R, Loebbert RW, Hradil VP, Harlan J, Schmidt M, Nim-mrich V, Cox BF, and Fox GB (2008) Noninvasive characterization of �-amyloid(1–40) vasoactivity by functional magnetic resonance imaging in mice. Neuroscience155:263–269.
Morgan D, Diamond DM, Gottschall PE, Ugen KE, Dickey C, Hardy J, Duff K,Jantzen P, DiCarlo G, Wilcock D, et al. (2000) A � peptide vaccination preventsmemory loss in an animal model of Alzheimer’s disease. Nature 408:982–985.
Offenbacher H, Fazekas F, Schmidt R, Koch M, Fazekas G, and Kapeller P (1996)MR of cerebral abnormalities concomitant with primary intracerebral hematomas.AJNR Am J Neuroradiol 17:573–578.
Pfeifer M, Boncristiano S, Bondolfi L, Stalder A, Deller T, Staufenbiel M, MathewsPM, and Jucker M (2002) Cerebral hemorrhage after passive anti-A� immuno-therapy. Science 298:1379.
Racke MM, Boone LI, Hepburn DL, Parsadainian M, Bryan MT, Ness DK, PirooziKS, Jordan WH, Brown DD, Hoffman WP, et al. (2005) Exacerbation of cerebralamyloid angiopathy-associated microhemorrhage in amyloid precursor proteintransgenic mice by immunotherapy is dependent on antibody recognition of de-posited forms of amyloid �. J Neurosci 25:629–636.
Salloway S, Sperling R, Gilman S, Fox NC, Blennow K, Raskind M, Sabbagh M,Honig LS, Doody R, van Dyck CH, et al. (2009) A phase 2 multiple ascending dosetrial of bapineuzumab in mild to moderate Alzheimer disease. Neurology 73:2061–2070.
Schenk D (2002) Amyloid-� immunotherapy for Alzheimer’s disease: the end of thebeginning. Nat Rev Neurosci 3:824–828.
Schenk D, Barbour R, Dunn W, Gordon G, Grajeda H, Guido T, Hu K, Huang J,Johnson-Wood K, Khan K, et al. (1999) Immunization with amyloid-� attenuatesAlzheimer-disease-like pathology in the PDAPP mouse. Nature 400:173–177.
Schroeter S, Khan K, Barbour R, Doan M, Chen M, Guido T, Gill D, Basi G, SchenkD, Seubert P, et al. (2008) Immunotherapy reduces vascular amyloid-� in PDAPPmice. J Neurosci 28:6787–6793.
Seabrook TJ, Jiang L, Thomas K, and Lemere CA (2006) Boosting with intranasaldendrimeric A�1–15 but not A�1–15 peptide leads to an effective immune re-sponse following a single injection of A�1–40/42 in APP-tg mice. J Neuroinflam-mation 3:14.
Sigurdsson EM, Wadghiri YZ, Mosconi L, Blind JA, Knudsen E, Asuni A, ScholtzovaH, Tsui WH, Li Y, Sadowski M, et al. (2008) A nontoxic ligand for voxel-based MRIanalysis of plaques in AD transgenic mice. Neurobiol Aging 29:836–847.
Spires TL and Hyman BT (2005) Transgenic models of Alzheimer’s disease: learningfrom animals. NeuroRx 2:423–437.
Thakker DR, Weatherspoon MR, Harrison J, Keene TE, Lane DS, Kaemmerer WF,Stewart GR, and Shafer LL (2009) Intracerebroventricular amyloid-� antibodiesreduce cerebral amyloid angiopathy and associated micro-hemorrhages in agedTg2576 mice. Proc Natl Acad Sci USA 106:4501–4506.
Towfighi A, Greenberg SM, and Rosand J (2005) Treatment and prevention ofprimary intracerebral hemorrhage. Semin Neurol 25:445–452.
Viswanathan A and Chabriat H (2006) Cerebral microhemorrhage. Stroke 37:550–555.
Weber R, Ramos-Cabrer P, Wiedermann D, van Camp N, and Hoehn M (2006) A fullynoninvasive and robust experimental protocol for longitudinal fMRI studies in therat. NeuroImage 29:1303–1310.
Wilcock DM, Jantzen PT, Li Q, Morgan D, and Gordon MN (2007) Amyloid-�
MRI Detection of Cerebral Microhemorrhage in Tg2576 Mice 587
at ASPE
T Journals on January 13, 2015
jpet.aspetjournals.orgD
ownloaded from

vaccination, but not nitro-nonsteroidal anti-inflammatory drug treatment, in-creases vascular amyloid and microhemorrhage while both reduce parenchymalamyloid. Neuroscience 144:950–960.
Wilcock DM, Rojiani A, Rosenthal A, Subbarao S, Freeman MJ, Gordon MN, andMorgan D (2004) Passive immunotherapy against A� in aged APP-transgenic micereverses cognitive deficits and depletes parenchymal amyloid deposits in spite ofincreased vascular amyloid and microhemorrhage. J Neuroinflammation 1:24.
Zhang J, Yarowsky P, Gordon MN, Di Carlo G, Munireddy S, van Zijl PC, and Mori
S (2004) Detection of amyloid plaques in mouse models of Alzheimer’s disease bymagnetic resonance imaging. Magn Reson Med 51:452–457.
Address correspondence to: Dr. Feng Luo, Translational Imaging andBiochemical Biomarkers, Global Pharmaceutical Research and Development,Abbott Laboratories, Dept. R4DF, Bldg AP4-2, 100 Abbott Park Road, AbbottPark, IL 60064. E-mail: [email protected]
588 Luo et al.
at ASPE
T Journals on January 13, 2015
jpet.aspetjournals.orgD
ownloaded from