magyar telecom b.v. investor presentation · c 31% 46% 21% 38% 58% 70% q3 2014 q3 2015 351k 522k...
TRANSCRIPT
Magyar Telecom B.V.Investor Presentation
for the period ended September 30, 2015
November 13, 2015
David Blunck, CEO InvitelAndrea Rába, co-CFO Invitel
This presentation of Magyar Telecom B.V. (the ”Company”) contains “forward-looking statements”. These and allforward-looking statements are only predictions or statements of current plans that are constantly under review bythe Company. Forward-looking statements by their nature address matters that are, to different degrees, uncertain.These forward-looking statements are all based on currently available operating, financial, and competitiveinformation and are subject to various risks and uncertainties. Actual results could differ materially from thoseexpressed in the forward-looking statements for a variety of reasons, including but not limited to: fluctuation inforeign exchange rates and interest rates; changes in Hungarian and Central and Eastern European economicconditions and consumer and business spending; the amount that the Company invests in new businessopportunities and the timing of those investments; the mix of services sold; competition; management of growthand expansion; future integration of acquired businesses; the performance of IT Systems; technological changes;the Company's indebtedness; and government regulation. Additional information concerning factors that couldcause actual results to differ materially from those in the forward-looking statements is contained in the Company'sfinancial reports, which are available on the Company’s website, www.invitel.hu. Accordingly, investors arecautioned not to place undue reliance on forward-looking statements, which speak only as of the date on whichthey are made. The Company does not undertake to update such statements to reflect the impact of circumstancesor events that arise after the date the statements are made.
Safe Harbor Statement 2
Overview
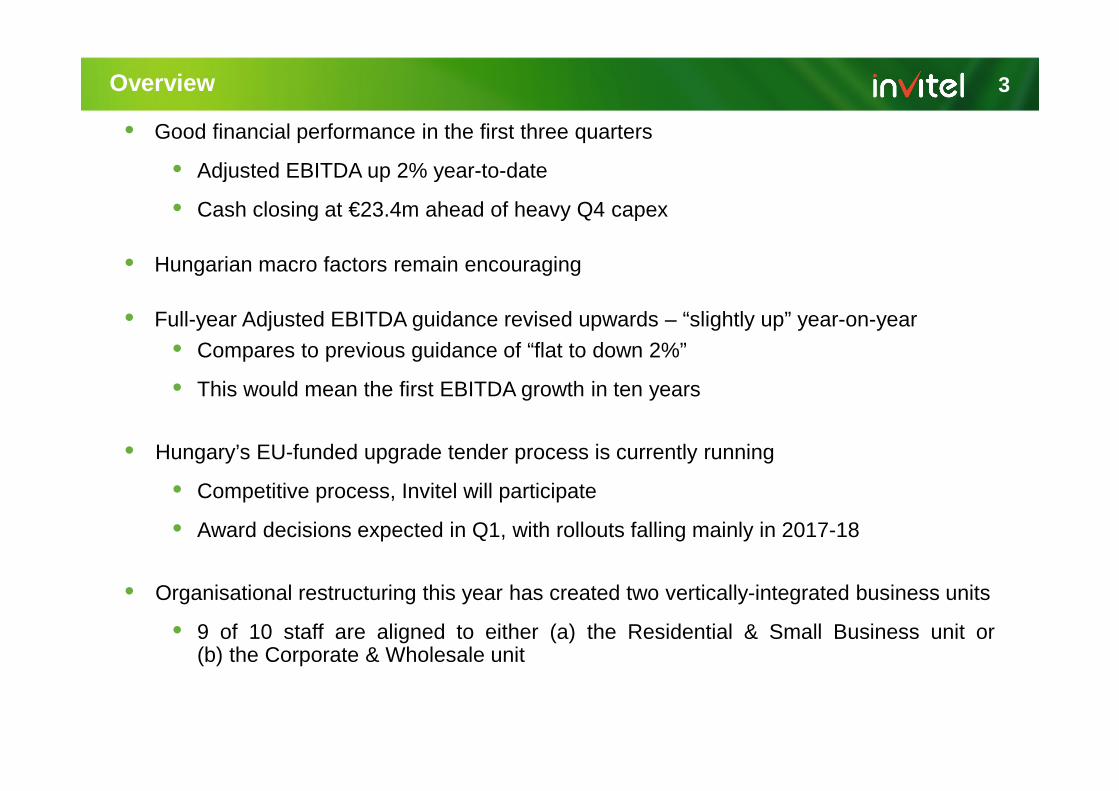
• Good financial performance in the first three quarters
• Adjusted EBITDA up 2% year-to-date
• Cash closing at €23.4m ahead of heavy Q4 capex
• Hungarian macro factors remain encouraging
• Full-year Adjusted EBITDA guidance revised upwards – “slightly up” year-on-year
• Compares to previous guidance of “flat to down 2%”
• This would mean the first EBITDA growth in ten years
• Hungary’s EU-funded upgrade tender process is currently running
• Competitive process, Invitel will participate
• Award decisions expected in Q1, with rollouts falling mainly in 2017-18
• Organisational restructuring this year has created two vertically-integrated business units
• 9 of 10 staff are aligned to either (a) the Residential & Small Business unit or(b) the Corporate & Wholesale unit
3
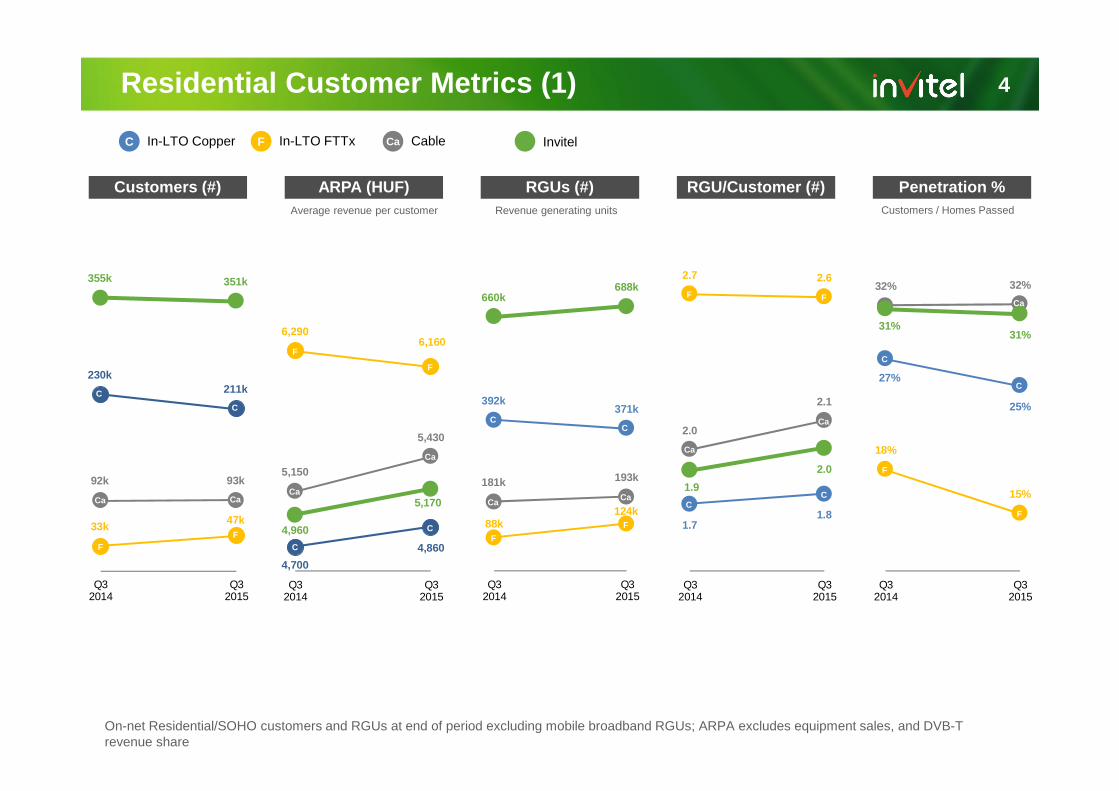
27%
25%
18%
15%
32% 32%
31%31%
Q32014
Q32015
4,960
5,170
4,700
4,860
6,2906,160
5,150
5,430
Q32014
Q32015
4
On-net Residential/SOHO customers and RGUs at end of period excluding mobile broadband RGUs; ARPA excludes equipment sales, and DVB-T revenue share
RGU/Customer (#)Customers (#) Penetration %ARPA (HUF) RGUs (#)Customers / Homes PassedAverage revenue per customer
Residential Customer Metrics (1)
355k 351k
230k211k
33k47k
92k 93k
Q32014
Q32015
Ca
660k688k
392k371k
88k124k
181k 193k
Q32014
Q32015
1.9
2.0
1.71.8
2.7 2.6
2.0
2.1
Q32014
Q32015
CaCa
Ca
Ca Ca
Ca
Ca
Ca
C
C
C
C
CC
CC
C
C
F
F
FF
F
F
F
FF
F
F CaC InvitelIn-LTO Copper In-LTO FTTx Cable
Revenue generating units
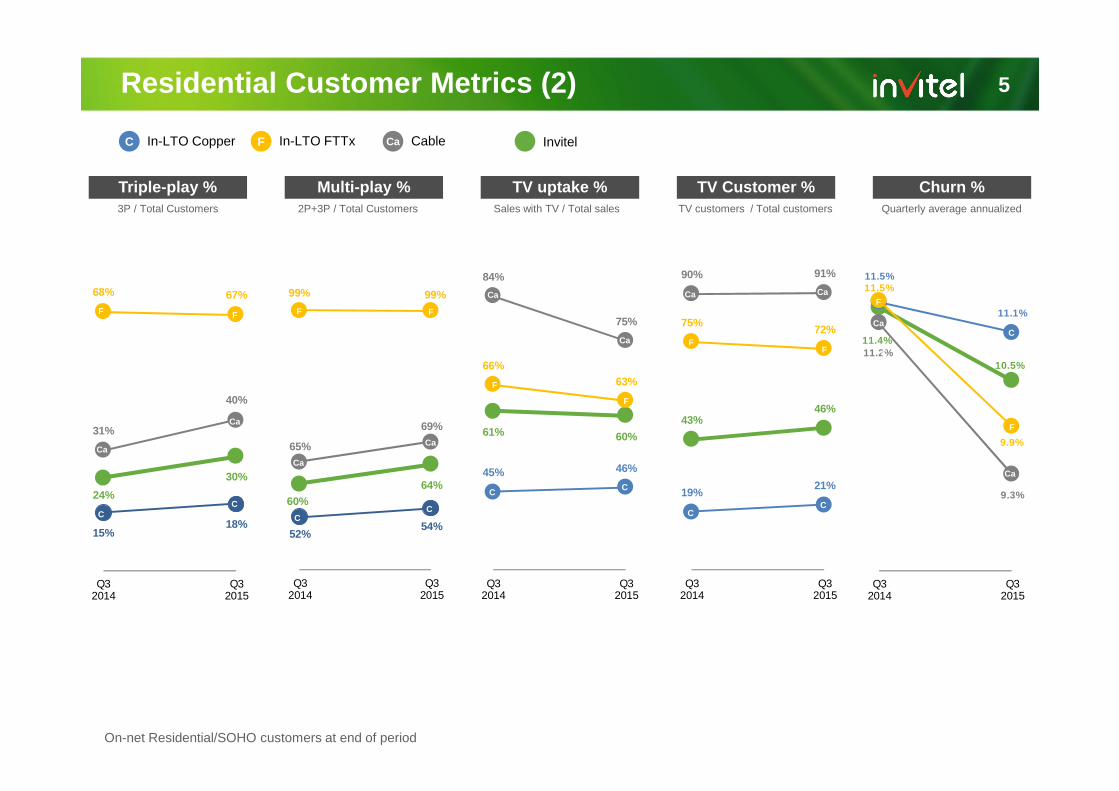
5Residential Customer Metrics (2)
On-net Residential/SOHO customers at end of period
Sales with TV / Total sales3P / Total Customers 2P+3P / Total Customers TV customers / Total customers Quarterly average annualized
TV Customer %Triple-play % Churn %Multi-play % TV uptake %
43%46%
19%21%
75%72%
90% 91%
Q32014
Q32015
24%
30%
15%18%
68% 67%
31%
40%
Q32014
Q32015
60%64%
52%54%
99% 99%
65%
69%
Q32014
Q32015
61% 60%
45% 46%
66%63%
84%
75%
Q32014
Q32015
11.4%
10.5%
11.5%
11.1%
11.5%
9.9%
11.2%
9.3%
Q32014
Q32015
FFF F
F
F
FF
F
C
C
CC
CC
CC
CC
Ca
Ca
Ca
Ca
Ca
Ca
Ca Ca
Ca
Ca
F
F CaC InvitelIn-LTO Copper In-LTO FTTx Cable
C
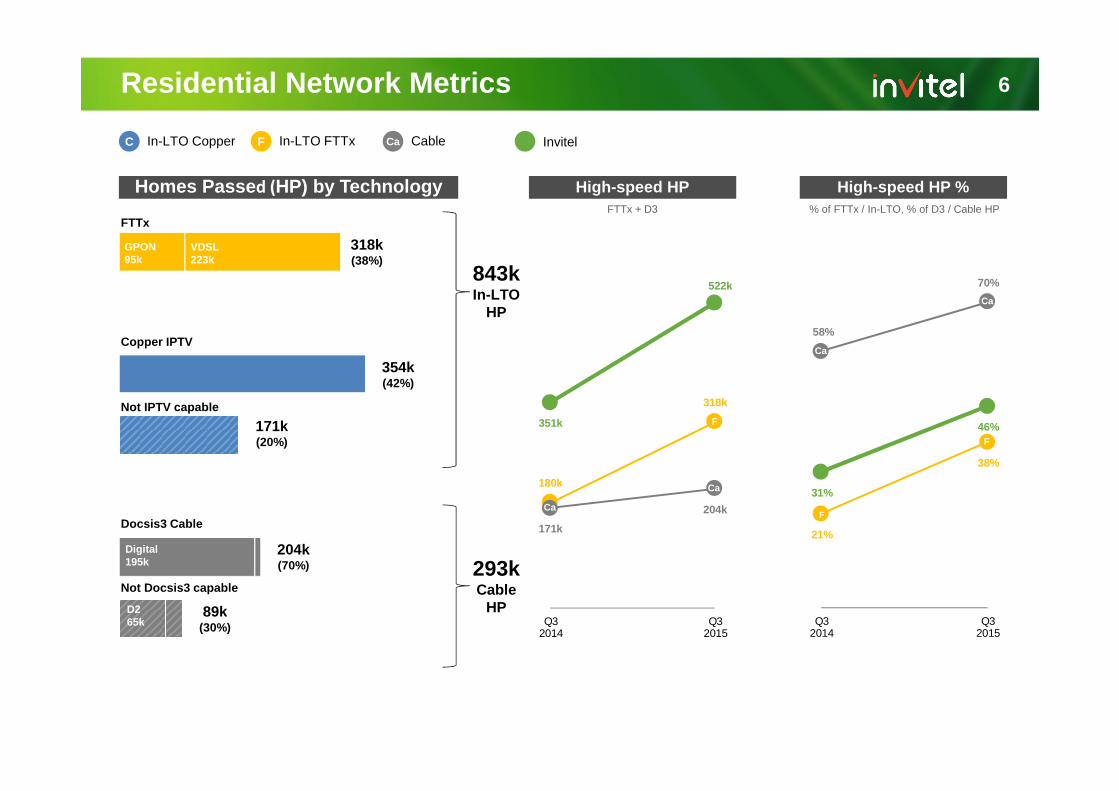
31%
46%
21%
38%
58%
70%
Q32014
Q32015
351k
522k
180k
318k
171k
204k
Q32014
Q32015
6Residential Network Metrics
Homes Passed (HP) by Technology
FTTx
Copper IPTV
Not IPTV capable
Docsis3 Cable
Not Docsis3 capable
318k(38%)
354k(42%)
GPON95k
VDSL223k
Digital195k
171k(20%)
High-speed HP High-speed HP %
204k(70%)
89k(30%)
Ca
F
F
Ca
Ca
Ca
C
F
% of FTTx / In-LTO, % of D3 / Cable HP
D265k
843kIn-LTO
HP
293kCable
HP
F CaC InvitelIn-LTO Copper In-LTO FTTx Cable
FTTx + D3
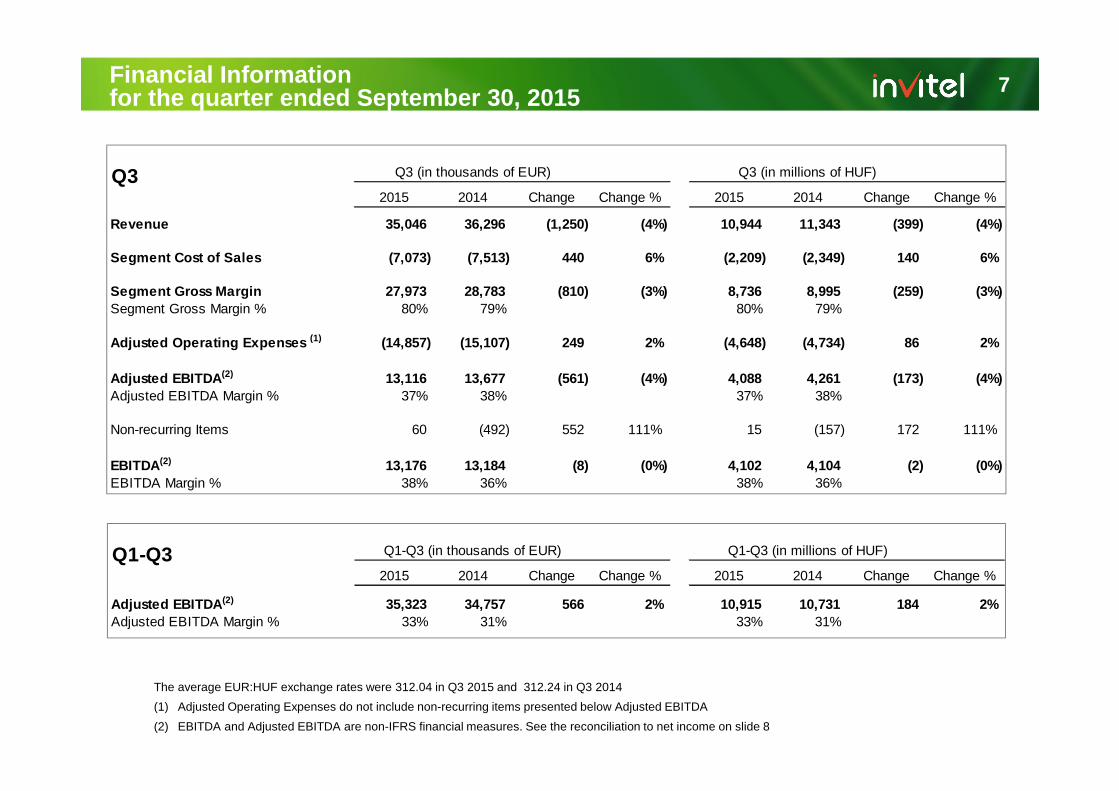
Financial Information for the quarter ended September 30, 2015
The average EUR:HUF exchange rates were 312.04 in Q3 2015 and 312.24 in Q3 2014
(1) Adjusted Operating Expenses do not include non-recurring items presented below Adjusted EBITDA
(2) EBITDA and Adjusted EBITDA are non-IFRS financial measures. See the reconciliation to net income on slide 8
7
2015 2014 Change Change % 2015 2014 Change Change %
Revenue 35,046 36,296 (1,250) (4%) 10,944 11,343 (399) (4%)
Segment Cost of Sales (7,073) (7,513) 440 6% (2,209) (2,349) 140 6%
Segment Gross Margin 27,973 28,783 (810) (3%) 8,736 8,995 (259) (3%)Segment Gross Margin % 80% 79% 80% 79%
(14,857) (15,107) 249 2% (4,648) (4,734) 86 2%
Adjusted EBITDA(2) 13,116 13,677 (561) (4%) 4,088 4,261 (173) (4%)Adjusted EBITDA Margin % 37% 38% 37% 38%
Non-recurring Items 60 (492) 552 111% 15 (157) 172 111%
EBITDA(2) 13,176 13,184 (8) (0%) 4,102 4,104 (2) (0%)EBITDA Margin % 38% 36% 38% 36%
Adjusted Operating Expenses (1)
Q3 Q3 (in thousands of EUR) Q3 (in millions of HUF)
2015 2014 Change Change % 2015 2014 Change Change %
Adjusted EBITDA(2) 35,323 34,757 566 2% 10,915 10,731 184 2% Adjusted EBITDA Margin % 33% 31% 33% 31%
Q1-Q3 (in thousands of EUR) Q1-Q3 (in millions of HUF)Q1-Q3
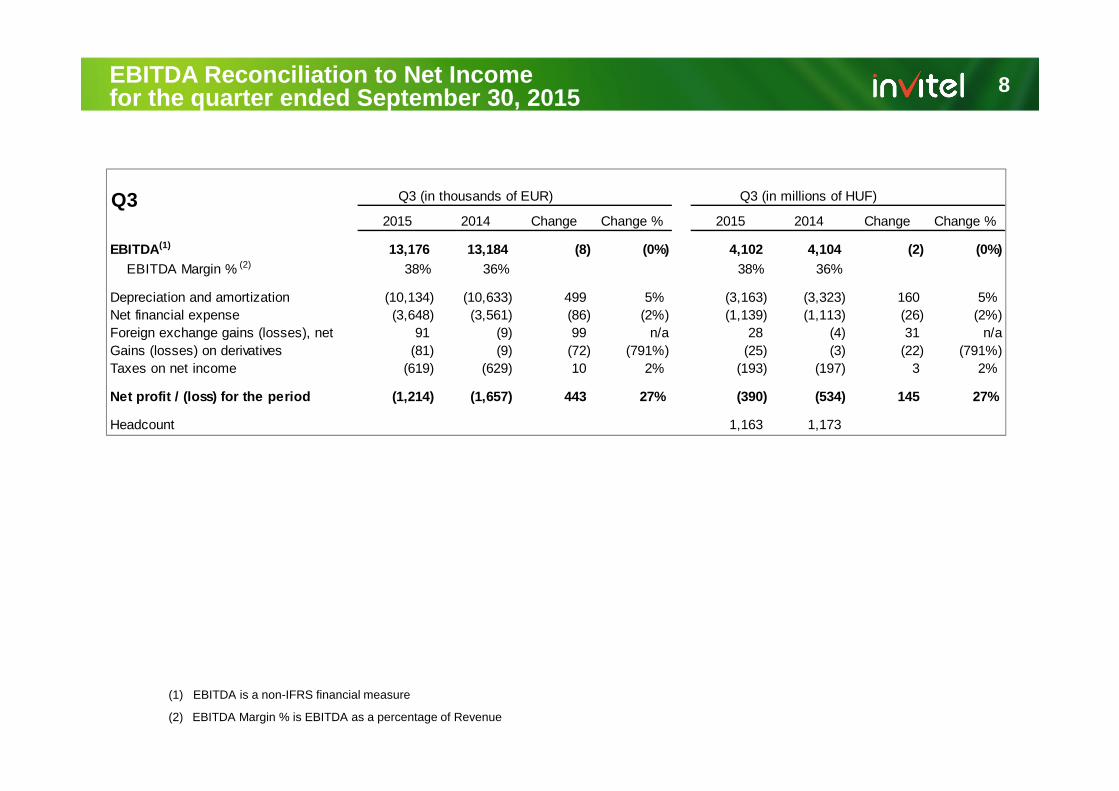
EBITDA Reconciliation to Net Incomefor the quarter ended September 30, 2015
(1) EBITDA is a non-IFRS financial measure
(2) EBITDA Margin % is EBITDA as a percentage of Revenue
8
2015 2014 Change Change % 2015 2014 Change Change %
EBITDA(1) 13,176 13,184 (8) (0%) 4,102 4,104 (2) (0%) EBITDA Margin % (2) 38% 36% 38% 36%
Depreciation and amortization (10,134) (10,633) 499 5% (3,163) (3,323) 160 5% Net financial expense (3,648) (3,561) (86) (2%) (1,139) (1,113) (26) (2%)Foreign exchange gains (losses), net 91 (9) 99 n/a 28 (4) 31 n/aGains (losses) on derivatives (81) (9) (72) (791%) (25) (3) (22) (791%)Taxes on net income (619) (629) 10 2% (193) (197) 3 2%
Net profit / (loss) for the period (1,214) (1,657) 443 27% (390) (534) 145 27%
Headcount 1,163 1,173
Q3 (in thousands of EUR) Q3 (in millions of HUF)Q3
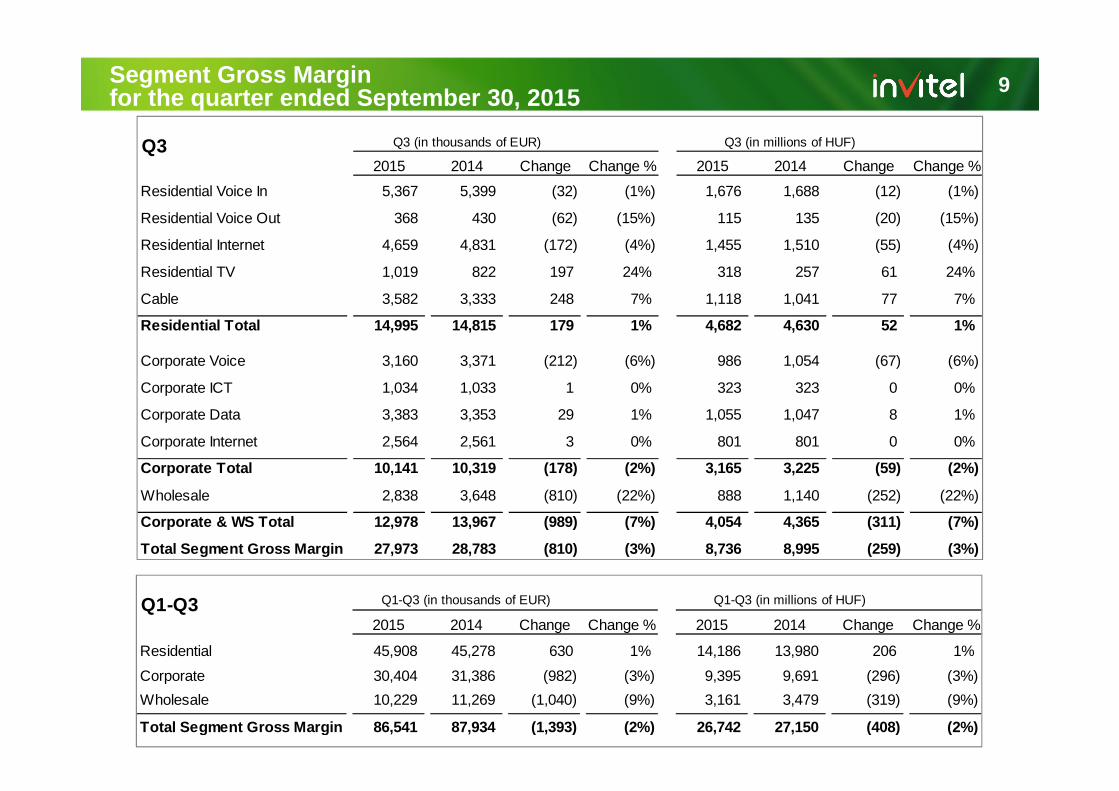
Segment Gross Marginfor the quarter ended September 30, 2015 9
2015 2014 Change Change % 2015 2014 Change Change %
Residential Voice In 5,367 5,399 (32) (1%) 1,676 1,688 (12) (1%)
Residential Voice Out 368 430 (62) (15%) 115 135 (20) (15%)
Residential Internet 4,659 4,831 (172) (4%) 1,455 1,510 (55) (4%)
Residential TV 1,019 822 197 24% 318 257 61 24%
Cable 3,582 3,333 248 7% 1,118 1,041 77 7%
Residential Total 14,995 14,815 179 1% 4,682 4,630 52 1%
Corporate Voice 3,160 3,371 (212) (6%) 986 1,054 (67) (6%)
Corporate ICT 1,034 1,033 1 0% 323 323 0 0%
Corporate Data 3,383 3,353 29 1% 1,055 1,047 8 1%
Corporate Internet 2,564 2,561 3 0% 801 801 0 0%
Corporate Total 10,141 10,319 (178) (2%) 3,165 3,225 (59) (2%)
Wholesale 2,838 3,648 (810) (22%) 888 1,140 (252) (22%)
Corporate & WS Total 12,978 13,967 (989) (7%) 4,054 4,365 (311) (7%)
Total Segment Gross Margin 27,973 28,783 (810) (3%) 8,736 8,995 (259) (3%)
Q3 (in thousands of EUR) Q3 (in millions of HUF)Q3
2015 2014 Change Change % 2015 2014 Change Change %
Residential 45,908 45,278 630 1% 14,186 13,980 206 1%
Corporate 30,404 31,386 (982) (3%) 9,395 9,691 (296) (3%)
Wholesale 10,229 11,269 (1,040) (9%) 3,161 3,479 (319) (9%)
Total Segment Gross Margin 86,541 87,934 (1,393) (2%) 26,742 27,150 (408) (2%)
Q1-Q3 (in thousands of EUR) Q1-Q3 (in millions of HUF)Q1-Q3
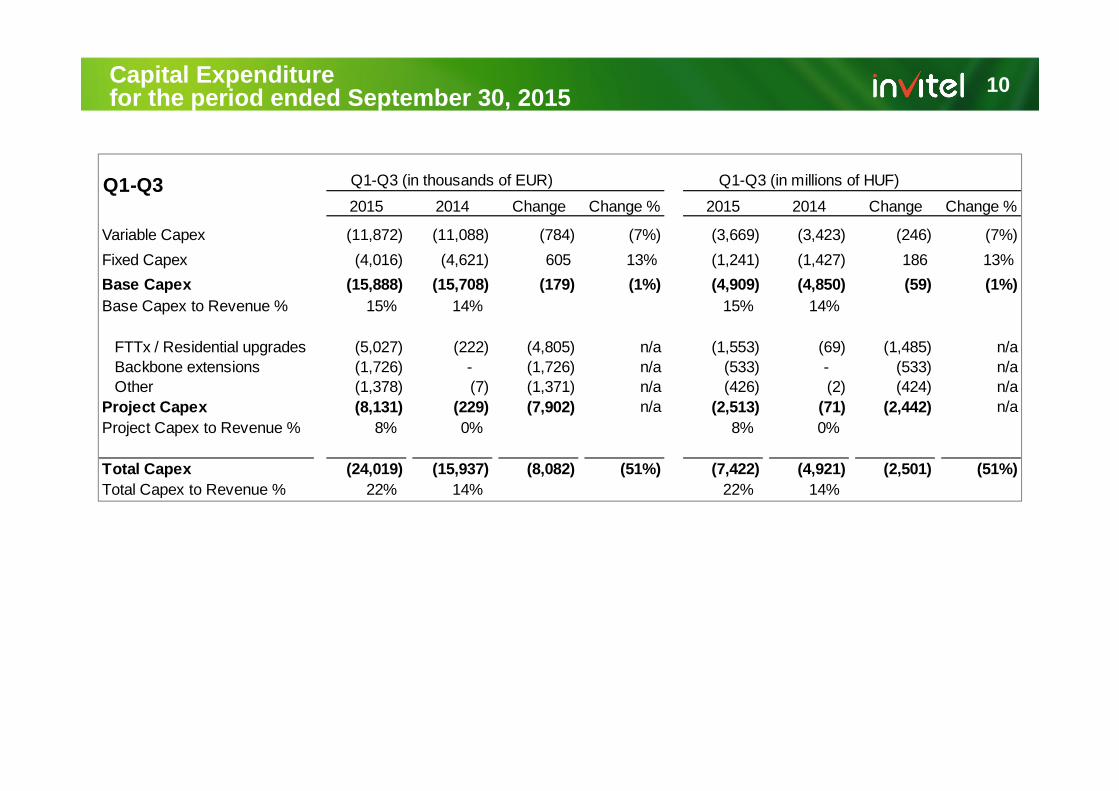
Capital Expenditurefor the period ended September 30, 2015 10
2015 2014 Change Change % 2015 2014 Change Change %
Variable Capex (11,872) (11,088) (784) (7%) (3,669) (3,423) (246) (7%)
Fixed Capex (4,016) (4,621) 605 13% (1,241) (1,427) 186 13%
Base Capex (15,888) (15,708) (179) (1%) (4,909) (4,850) (59) (1%)Base Capex to Revenue % 15% 14% 15% 14%
FTTx / Residential upgrades (5,027) (222) (4,805) n/a (1,553) (69) (1,485) n/aBackbone extensions (1,726) - (1,726) n/a (533) - (533) n/aOther (1,378) (7) (1,371) n/a (426) (2) (424) n/a
Project Capex (8,131) (229) (7,902) n/a (2,513) (71) (2,442) n/aProject Capex to Revenue % 8% 0% 8% 0%
Total Capex (24,019) (15,937) (8,082) (51%) (7,422) (4,921) (2,501) (51%)Total Capex to Revenue % 22% 14% 22% 14%
Q1-Q3 (in thousands of EUR) Q1-Q3 (in millions of HUF)Q1-Q3
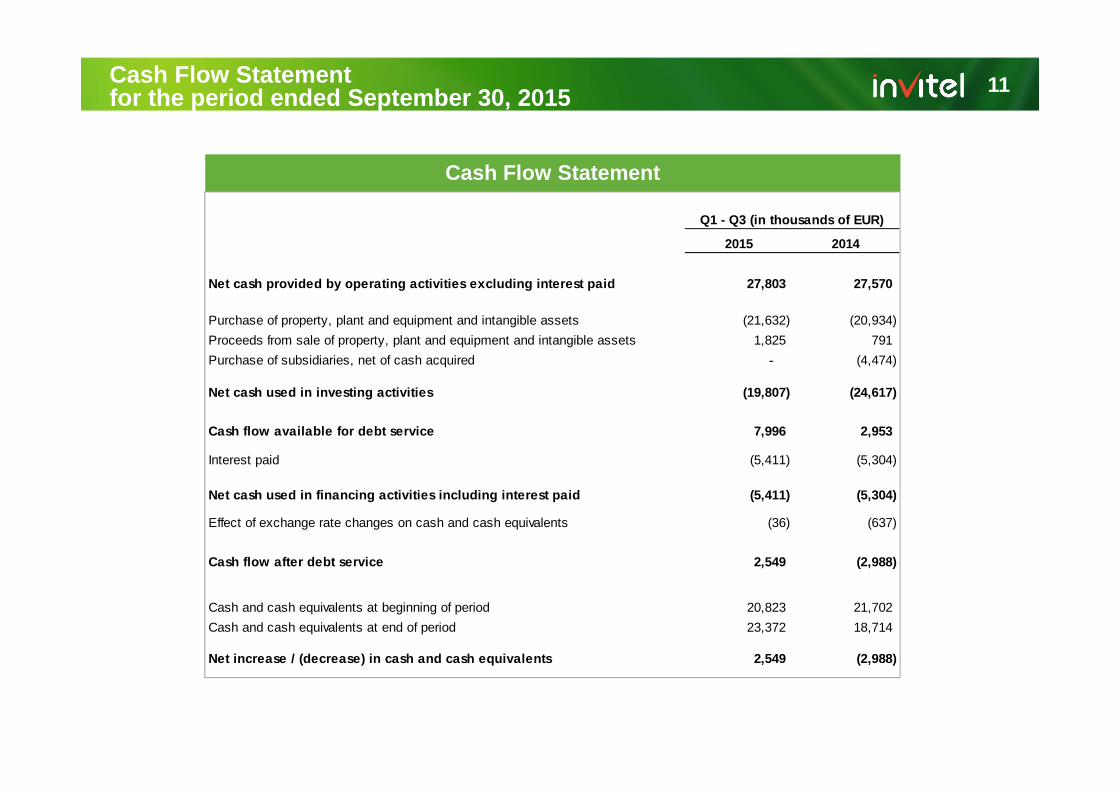
Cash Flow Statement
Cash Flow Statementfor the period ended September 30, 2015 11
2015 2014
Net cash provided by operating activities excluding interest paid 27,803 27,570
Purchase of property, plant and equipment and intangible assets (21,632) (20,934)
Proceeds from sale of property, plant and equipment and intangible assets 1,825 791
Purchase of subsidiaries, net of cash acquired - (4,474)
Net cash used in investing activities (19,807) (24,617)
Cash flow available for debt service 7,996 2,953
Interest paid (5,411) (5,304)
Net cash used in financing activities including interest paid (5,411) (5,304)
Effect of exchange rate changes on cash and cash equivalents (36) (637)
Cash flow after debt service 2,549 (2,988)
Cash and cash equivalents at beginning of period 20,823 21,702
Cash and cash equivalents at end of period 23,372 18,714
Net increase / (decrease) in cash and cash equivalents 2,549 (2,988)
Q1 - Q3 (in thousands of EUR)
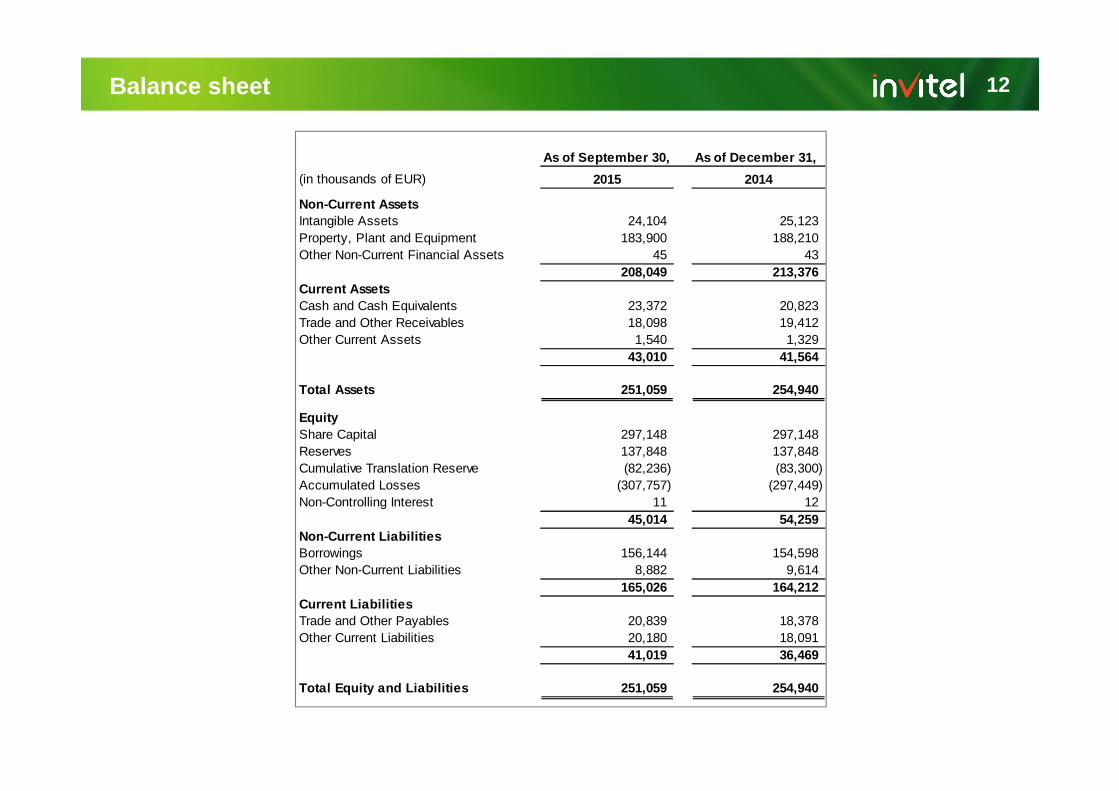
Balance sheet 12
As of September 30, As of December 31,
(in thousands of EUR) 2015 2014
Non-Current AssetsIntangible Assets 24,104 25,123 Property, Plant and Equipment 183,900 188,210 Other Non-Current Financial Assets 45 43
208,049 213,376 Current AssetsCash and Cash Equivalents 23,372 20,823 Trade and Other Receivables 18,098 19,412 Other Current Assets 1,540 1,329
43,010 41,564
Total Assets 251,059 254,940
EquityShare Capital 297,148 297,148 Reserves 137,848 137,848 Cumulative Translation Reserve (82,236) (83,300)Accumulated Losses (307,757) (297,449)Non-Controlling Interest 11 12
45,014 54,259 Non-Current LiabilitiesBorrowings 156,144 154,598 Other Non-Current Liabilities 8,882 9,614
165,026 164,212 Current LiabilitiesTrade and Other Payables 20,839 18,378 Other Current Liabilities 20,180 18,091
41,019 36,469
Total Equity and Liabilities 251,059 254,940
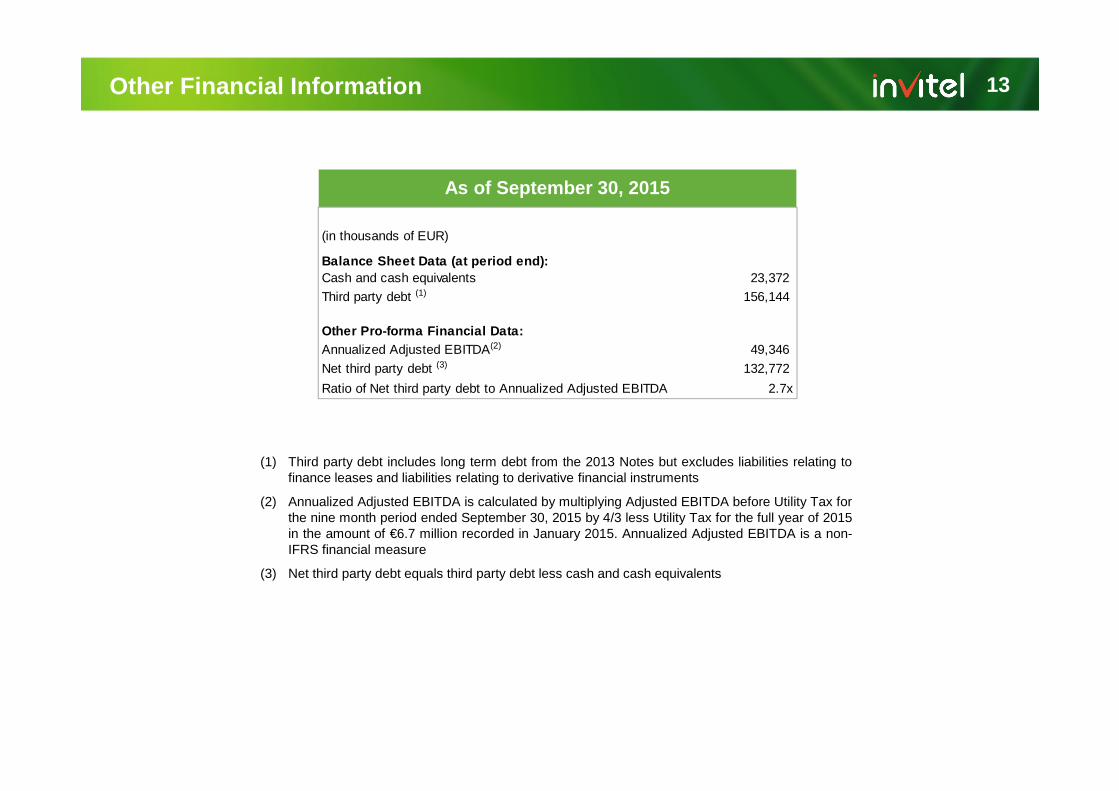
As of September 30, 2015
(1) Third party debt includes long term debt from the 2013 Notes but excludes liabilities relating tofinance leases and liabilities relating to derivative financial instruments
(2) Annualized Adjusted EBITDA is calculated by multiplying Adjusted EBITDA before Utility Tax forthe nine month period ended September 30, 2015 by 4/3 less Utility Tax for the full year of 2015in the amount of €6.7 million recorded in January 2015. Annualized Adjusted EBITDA is a non-IFRS financial measure
(3) Net third party debt equals third party debt less cash and cash equivalents
Other Financial Information 13
(in thousands of EUR)
Balance Sheet Data (at period end): Cash and cash equivalents 23,372
Third party debt (1) 156,144
Other Pro-forma Financial Data: Annualized Adjusted EBITDA(2) 49,346
Net third party debt (3) 132,772
Ratio of Net third party debt to Annualized Adjusted EBITDA 2.7x
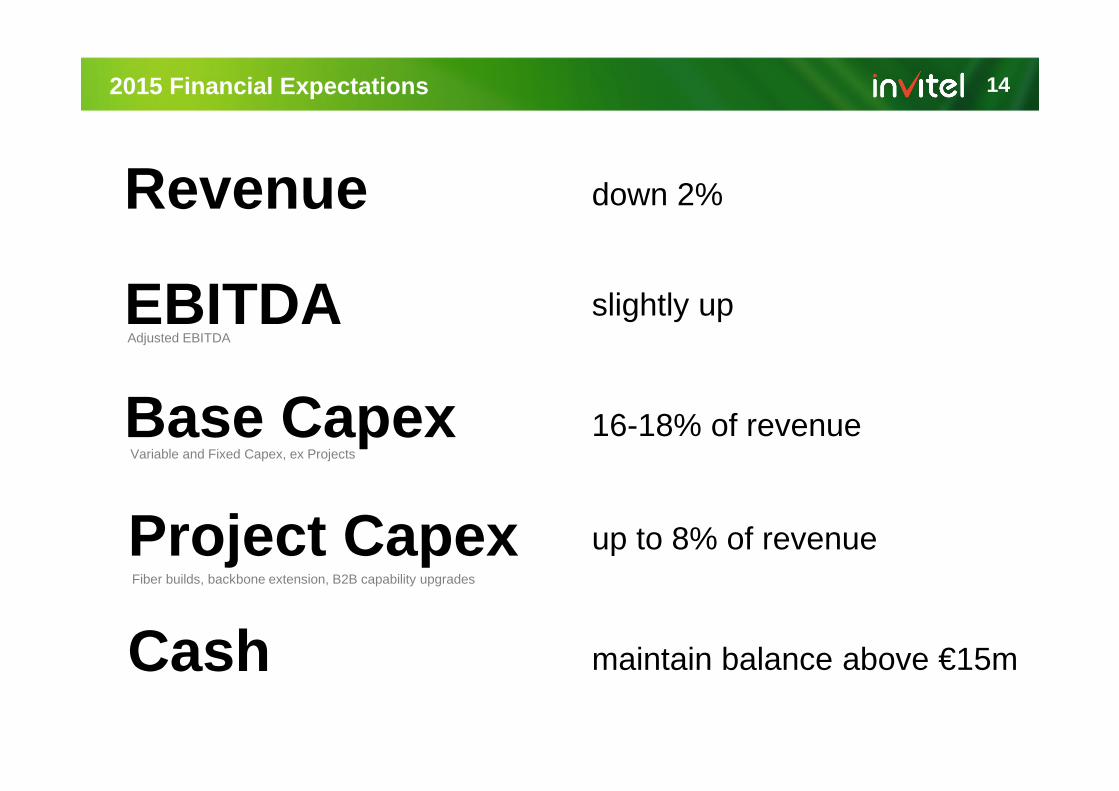
2015 Financial Expectations
Revenue down 2%
EBITDAAdjusted EBITDA
slightly up
Project Capex up to 8% of revenue Fiber builds, backbone extension, B2B capability upgrades
Base CapexVariable and Fixed Capex, ex Projects
16-18% of revenue
Cash maintain balance above €15m
14
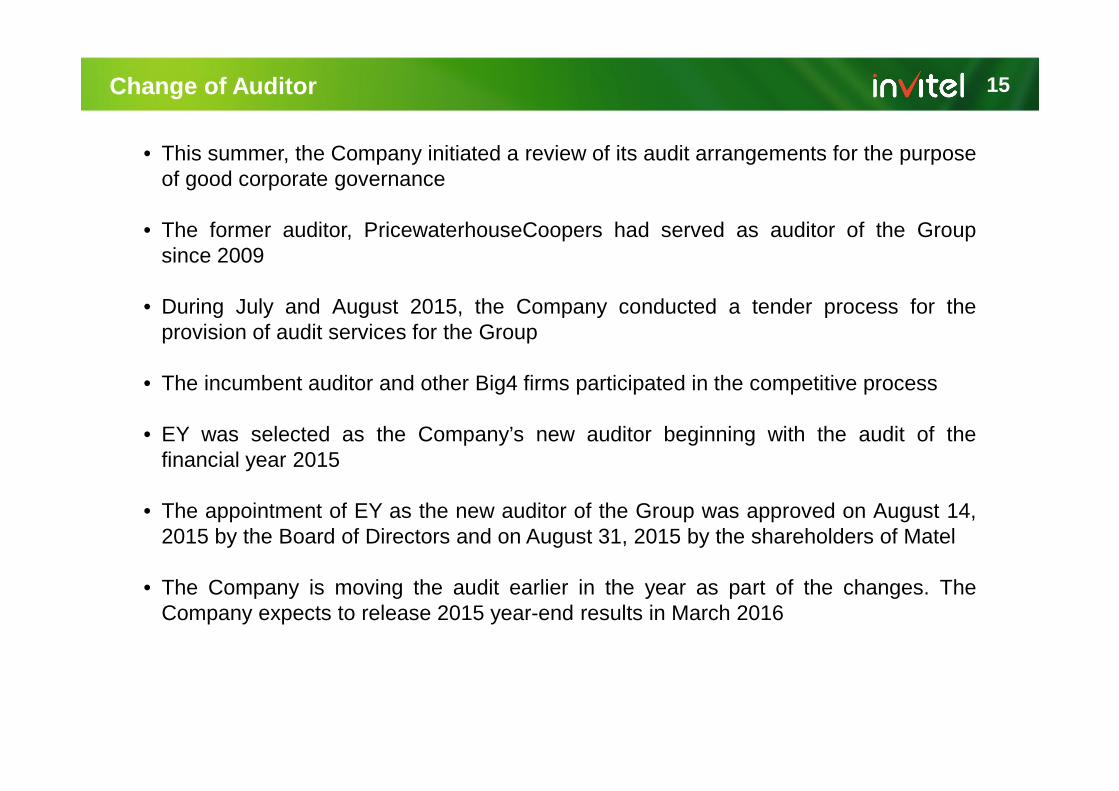
Change of Auditor 15
• This summer, the Company initiated a review of its audit arrangements for the purposeof good corporate governance
• The former auditor, PricewaterhouseCoopers had served as auditor of the Groupsince 2009
• During July and August 2015, the Company conducted a tender process for theprovision of audit services for the Group
• The incumbent auditor and other Big4 firms participated in the competitive process
• EY was selected as the Company’s new auditor beginning with the audit of thefinancial year 2015
• The appointment of EY as the new auditor of the Group was approved on August 14,2015 by the Board of Directors and on August 31, 2015 by the shareholders of Matel
• The Company is moving the audit earlier in the year as part of the changes. TheCompany expects to release 2015 year-end results in March 2016
Non-IFRS Financial Measures
Magyar Telecom B.V. has included certain non-IFRS financial measures in this presentation, including EBITDA andAdjusted EBITDA. Reconciliations of the differences between EBITDA and Adjusted EBITDA and the most directlycomparable financial measure calculated and presented in accordance with IFRS is included in this presentation.The non-IFRS financial measures presented are by definition not a measure of financial performance or financialcondition under IFRS and are not alternatives to operating income or net income/loss reflected in the incomestatement and statement of comprehensive income (loss) and are not necessarily indicative of cash available to fundall cash flow needs. These non-IFRS financial measures used may not be comparable to similarly titled measures ofother companies. Management uses these non-IFRS financial measures for various purposes including: measuringand evaluating the Company’s financial and operational performance and its financial condition; makingcompensation decisions; planning and budgeting decisions; and financial planning purposes. Magyar Telecom B.V.believes that presentation of these non-IFRS financial measures is useful to investors because it (i) reflectsmanagement’s view of core operations and cash flow generation and financial condition upon which managementbases financial, operational, compensation and planning decisions and (ii) presents a measurement that equity anddebt investors and lending banks have indicated to management is important in assessing the Company's financialperformance and financial condition. While Magyar Telecom B.V. utilizes these non-IFRS financial measures inmanaging its business and believes that they are useful to management and to investors for the reasons describedabove, these non-IFRS financial measures have certain shortcomings. In particular, these EBITDA and AdjustedEBITDA measurements do not take into account changes in working capital and financial statement items belowincome from operations, and the resultant effect of these items on the Company’s cash flows. Managementcompensates for the shortcomings of these measures by utilizing them in conjunction with their comparable IFRSfinancial measures. The information in this presentation should be read in conjunction with the financial statementsand footnotes contained in the Company's financial reports.
Appendix 16