magyar telekom telecommunications public limited company · 2 magyar telekom telecommunications...
TRANSCRIPT

1
MAGYAR TELEKOM TELECOMMUNICATIONS
PUBLIC LIMITED COMPANY
ANNUAL REPORT AND BUSINESS REPORT FOR THE YEAR ENDED DECEMBER 31, 2016

2
MAGYAR TELEKOM TELECOMMUNICATIONS
PUBLIC LIMITED COMPANY
ANNUAL REPORT
FOR THE YEAR ENDED DECEMBER 31, 2016 PREPARED IN ACCORDANCE WITH
THE HUNGARIAN ACCOUNTING LAW
(HAR)

3

4

5
6

7

8
BALANCE SHEET AS OF DECEMBER 31, 2016

9
BALANCE SHEET AS OF DECEMBER 31, 2016

10
INCOME STATEMENT FOR THE PERIOD ENDED DECEMBER 31, 2016

11
MAGYAR TELEKOM TELECOMMUNICATIONS
PUBLIC LIMITED COMPANY
NOTES TO THE FINANCIAL STATEMENTS
DECEMBER 31, 2016

12
0 NOTE ADDED FOR TRANSLATION
This annual report for December 31, 2016 is the English translation of the Annual Report issued in Hungarian language and prepared in accordance with Act C of 2000 on Accounting and with generally accepted accounting principles in Hungary.
These principles may be different from International Financial Reporting Standards or accounting principles of any other country. No adjustments have been made to conform the Annual Report with any accounting principles other than Hungarian.
The Auditors’ report is a translation of the Auditors’ report issued in Hungarian language on the Hungarian Annual Report as outlined above.
In the event of any discrepancy, whether in the Auditors’ report or in the Annual Report, the Hungarian original version prevails.

13
1 BACKGROUND AND GENERAL INFORMATION
1.1 General Information about Magyar Telekom Plc.
Official name of the Company: Magyar Telekom Telecommunications Public Limited Company
Abbreviated name of the Company: Magyar Telekom Plc.
Registered office of the Company: 1013 Budapest, Krisztina krt. 55.
Name of the Court of Registration: Metropolitan Court as Court of Registration. Registration number of the Company: Cg: 01-10-041928
The Hungarian Telecommunications Company, the legal predecessor of Magyar Telekom Telecommunications Public Limited Company (“Magyar Telekom Plc.” or the “Company”) was founded by the Ministry of Transport, Communications and Construction on January 1, 1990. The Company was transformed by the Board of Directors of the State Asset Holding Ltd. into a wholly owned company limited by shares as of December 31, 1991. The Company was privatized on December 22, 1993, when the MagyarCom consortium acquired a 30.1 per cent stake in the Company. At the second stage of the privatization, which took place in December 1995, MagyarCom became the majority owner.
On November 14, 1997 the Company was listed on both the Budapest and the New York Stock Exchanges.
In June 1999, the State Privatization and Holding Company sold its remaining stake (5.75 per cent) through a secondary offering. After this transaction, the proportion of publicly traded shares increased to 40.47 per cent. Share of MagyarCom in the Company decreased to 59.53 per cent.
In 2000, the Company increased its common stock through issuing new shares in the amount of HUF 63 million, which were held mainly within Magyar Telekom Group. As a result of this transaction, the proportion of publicly traded shares increased to 40.51 per cent and MagyarCom’s ownership changed to 59.49 per cent.
In 2002, the Company carried out HUF 490 million additional increase in common stock, which shares were repurchased. As a result of this transaction, the proportion of publicly traded shares changed to 40.32 per cent, the proportion of repurchased treasury stock to 0.47 per cent and MagyarCom’s ownership changed to 59.21 per cent.
The Extraordinary General Meeting of the Company held on February 22, 2005 approved the decision of the Board of Directors to change the official name of Magyar Telecommunications Company Ltd. into Magyar Telekom Telecommunications Company Ltd., with short name of Magyar Telekom Ltd. The change was registered by the Court of Registry on May 6, 2005.
In 2006 the name of Magyar Telekom Telecommunications Company Ltd. changed to Magyar Telekom Telecommunications Public Limited Company, with short name of Magyar Telekom Plc. The change was registered by the Court of Registry on February 28, 2006.
The Company’s American Depository Shares (ADSs) were traded on the New York Stock Exchange until November 12, 2010, when the ADSs were delisted. Magyar Telekom Plc. terminated the registration of its shares in the US in February 2012. The Company maintains its American Depositary Receipt (ADR) program on a Level I basis.
On October 4, 2013 MagyarCom Holding GmbH owned by Deutsche Telekom AG merged into T-Mobile Global Holding Nr. 2 GmbH which is also owned by Deutsche Telekom AG in 100 per cent. Subsequently, on December 18, 2013 T-Mobile Global Holding Nr. 2 GmbH contributed its shares as capital increase into its fully owned subsidiary, CMobil B.V. with headquarters in the Netherlands (Stationsplein 8, 6221 BT Maastricht, the Netherlands). As a result of this transaction CMobil B.V. became Magyar Telekom Plc.’s shareholder with direct voting right of 59.21 per cent (registered in Share Register on February 7, 2014). The name of the company changed to Deutsche Telekom Europe B.V. with effect from March 1, 2015. Considering that the Deutsche Telekom Europe B.V. is the 100 per cent subsidiary of T-Mobile Global Holding Nr. 2 GmbH and T-Mobile Global Holding Nr. 2 is the 100 per cent subsidiary of Deutsche Telekom AG, after the transaction the indirect voting right and influence of Deutsche Telekom AG in Magyar Telekom Plc. remained unchanged.

14
Persons authorized to sign the annual report:
Christopher Mattheisen - Chief Executive Officer, member of the Board (residence: Budapest)
János Szabó - Chief Financial Officer (residence: Budapest)
In Magyar Telekom Plc., the accounting services are supervised by the Director of Accounting and Tax, Tamás Deák (certificate number: 188739. Area of speciality: entrepreneurial activity. Status: registered. Residence: Sukoró).
The Company is subject to compulsory audit. The Company’s auditor is PricewaterhouseCoopers Könyvvizsgáló Kft. (its register number is 01-09-063022, its taxation number is 10256161-2-44), the responsible person for carrying out the audit is Árpád Balázs (membership number at Chamber of Hungarian Auditors: 006931).
Magyar Telekom Plc.’s corporate website: www. telekom.hu
1.2 The Company’s activity
Magyar Telekom Plc.’s primary activity is providing fixed line and mobile telecommunication services for public and business customers. The Company provides voice and non-voice (SMS, MMS, internet, data and content provision) within mobile services; voice, data, internet and TV services within fixed line services.
In addition, the Company sells equipment needed for using fixed line and mobile services (telephones, tablets, notebooks, TV sets etc.).
The Company started its electricity and natural gas retail activities in 2010.
The purpose of Magyar Telekom Plc.’s participation in the energy market is to provide more integrated domestic services in case of residential customers and business services in case of business customers.
Business model related to energy supply activity of Magyar Telekom Plc. is subject to review regularly. After the latest review the Company decided to discontinue its natural gas supply provided for residential customers with effect of July 31, 2015.
On July 9, 2015 the Company made an agreement with MET Holding AG to establish E2 Hungary Zrt. as a jointly controlled entity. From January 1, 2016 the E2 Hungary Zrt. provides both electricity and gas supply services for business customers.
1.3 Employee share ownership program (ESOP)
In July 2016 Magyar Telekom launched a Remuneration Policy based employee share ownership program (ESOP) under which Magyar Telekom shares will be distributed to the vast majority of the employees of Magyar Telekom Plc. and T-Systems Hungary Ltd. This program is in addition to the Company’s regular remuneration package. The award of shares is contingent on the Company’s actual internal operating Free Cash Flow of MT-Hungary segment of the year ending December 31, 2016 exceeding that of the year ended December 31, 2015. Each eligible individual will be entitled to receive 226 Magyar Telekom shares (in the value of HUF 100,000 calculated on the unweighted average share price of 20 trading days prior to June 30, 2016), along with any entitlement to the dividends attached to such shares and with no lock-up restrictions. In July 2016, the Company purchased 1,261,204 Magyar Telekom shares in the open market, which was completed by 272,432 treasury shares to finance the program. In order to distribute the shares an employee share ownership organization (ESOP Organization) was established by the Company and registered by the Metropolitan Court in 2016, which has its supreme body and management appointed by the founder (i.e. the Company). Upon the confirmation of the improvement of the oFCF of MT-Hungary segment by the Board of Directors in late February 2017, the ESOP Organization is expected to distribute the shares amongst 6,646 employees in April 2017, where each eligible individual will be entitled to receive 226 shares.
In accordance with the ESOP Act the ESOP Organization shall manage the financial instruments provided to the ESOP Organization in accordance with the effective remuneration policies and the Articles of Association of the ESOP Organization.
The ESOP Organization is managed and represented by the managing director. The managing director is vested with powers to solely represent the ESOP Organization. The managing director is nominated and recalled by the Attorney. The managing director shall not be instructed by the Founder or the Participants.

15
Magyar Telekom transferred 1,533,636 treasury shares in August 2016 to the established ESOP Organization of which it sold 25,764 shares due to the revision of the number of the participants in the program. The ESOP Organization was fully consolidated as at December 31, 2016 as it was controlled by the Company.
In 2016 HUF 493 million was recognized as expenses for the program.
2 ACCOUNTING POLICIES
The accounting policies of Magyar Telekom Plc. include basic accounting principles, measurement methods and procedures as well as methods and tools used for enforcing the provisions of the Hungarian Accounting Regulations.
Magyar Telekom Plc. maintains its records both in accordance with the Hungarian Accounting Regulations (HAR) and International Financial Reporting Standards (IFRS). The differences between the two reports are solely due to differences in the respective accounting principles.
The closing day of the Company’s business year is December 31. The balance sheet preparation date is January 2, 2017 in respect of the annual report for 2016.
Magyar Telekom Plc. uses version “A” of the balance sheet and version “A” of the income statement (total cost method) when preparing its annual report in accordance with the Hungarian Accounting Regulations. Amounts in the annual report are stated in HUF millions. The currency of accounting is the Hungarian Forint (HUF).
The Hungarian Act on Accounting allows for certain captions in the balance sheet to be broken-down or omitted so Magyar Telekom Plc. breaks down
Land and buildings and related rights: Land Buildings Telecommunication network Other properties Real estate related rights
Technical equipment, machinery and vehicles: Telecommunication equipment and machinery Other technical equipment, machinery and vehicles
and the following captions are omitted:
Adjusted value of intangible assets Breeding stock Adjusted value of tangible assets Non-current loans granted to independent undertakings Adjusted value of financial investments Valuation difference of invested financial assets Animals for breeding and fattening and other livestock Finished products Valuation difference of receivables Valuation difference of derivative instruments (positive) Valuation difference of securities Valuation reserve for adjustments Fair value reserve Subordinated liabilities to related parties Subordinated liabilities to companies linked by virtue of major participating interests Subordinated liabilities to independent undertakings Subordinated liabilities to other economic entities Valuation difference of liabilities Valuation difference of derivative instruments (negative)

16
Moreover the Company does not disclose in the balance sheet and in the income statement those captions marked with Arabic characters where there were no data either for the previous year or this year.
In 2016, these captions were as follows: Capitalized costs of foundation and restructuring Capitalized costs of experimental development Advance payments on intangible assets Non-current loans granted to related parties Non-current major participating interest Non-current loans granted to companies linked by virtue of major participating interests Other investments (Financial investments) Non-current loans granted to independent undertakings Non-current bonds and other securities Advance payments on inventories Receivables from companies linked by virtue of major participating interests Receivables from other related companies Bills receivable Major participating interest Other investments (Securities) Marketable securities Deferred expenses Provision for expected expenses Other provisions Non-current borrowings Convertible bonds Debt from issuance of bonds Investment and development loans Other non-current loans Non-current liabilities to related parties Non-current liabilities to companies linked by virtue of major participating interests Bills of exchange payable Current liabilities to companies linked by virtue of major participating interests Income and gains on financial investments (from securities and loans) Expenditure and loss on financial investments (from securities and loans) Since January 1, 2005 the Company has complied with its obligation to prepare the consolidated financial statements by preparing those in accordance with the International Financial Reporting Standards.
The consolidated financial statements of Deutsche Telekom AG (Friedrich-Ebert-Alle 140, 53113 Bonn, Germany) also includes Magyar Telekom Plc. and its subsidiaries.
2.1 Definition of the accounting principles, guidelines and methods
Magyar Telekom Plc. interprets the significant error in preparing its annual report as follows:
Items must be considered significant in all cases if, in the year when discovered by any form of audit, the total of all errors (whether negative or positive) for a given financial year and the impacts thereof - increasing or decreasing the profit or loss or the equity - exceeds 2 per cent of the balance sheet total of the financial year. If the Company reveals a significant error through self-revision, then modifications relating to prior years are presented next to the prior years’ figures for each balance sheet and income statement item.
The Company has set up regulations for valuation of assets and liabilities, scrapping, cost calculation, stocktaking, cash management, and system of documentation as required by the Hungarian Accounting Regulations.
Until further decision, the Company does not use the allowed alternative treatment in the Hungarian Accounting Regulations for the valuation of fixed assets at market value and valuation of certain financial instruments at fair value.

17
2.2 Basic principles applied to the separation of accounts related to energy supply
From 2010, Magyar Telekom Plc.’s activity expanded with providing electricity and natural gas services based on individual authorization.
Magyar Telekom Plc. worked out the rules for accounting separation based on the Act LXXXVI of 2007 on electricity and on the Act XL of 2008 on natural gas supply and the principles connected to this are recorded in its accounting policies. These principles are defined for each general ledger account in its chart of accounts.
Every general ledger account is assigned to one of the following categories:
Telecommunication or Other activity: those general ledger accounts which contain items connected exclusively to either telecommunication activity or non-telecommunication and non-energy supply activities (e.g. property rental fee revenues).
Energy: contains items connected exclusively to energy supply activity and can be allocated definitely to electricity or to natural gas services activity.
To be allocated: settlements on these accounts are connected to telecommunication, to other and to energy supply activities. Amounts on these accounts are allocated to energy supply, telecommunication or other activities based on further allocation rules.
As a result of allocation, the difference between the Assets and Liabilities sides of the balance sheet is disclosed as “difference because of separation” in Liabilities.
The Company discloses its separated balance sheet and income statement in Appendix 1.
General rule applied during allocation is that if a general ledger account contains the settlement of energy activities (directly or indirectly from an allocation process) and there is no any subledger then the separation of the balance between electricity and gas activities are based on the weighted proportion of the point of delivery (POD) numbers.
At a significant part of general ledger accounts the allocation is based on proportion of direct margin because of the different profit of telecommunication and energy products. The direct margin is the difference between revenues and direct costs related to it; corrected by the effect of utility costs reduction, the amount of discount related to energy services connected to telecommunication services. Items are separated to energy services and to telecommunication/other services in the proportion of direct margin.
In case of the information are available in subledger then allocated amounts on energy activities are defined by individual items based on data supply.
In case of some items the allocation ratio depends on costs. The cost ratio on energy services is equal to the quotient of the material-type expenses for energy services in 100 per cent (electricity and/or gas) and the total material-type expenses of the Company. Other cost dependent items are allocated in the proportion of employee related expenses.
Items related to IT systems connected to energy retail services are directly allocated to energy activities.
Magyar Telekom Plc.’s individual authorized activities also include the operation of gas-engine small power plant. Since the Company uses the gas-engine small power plant for its own purposes the volume of sales is very low and this economic activity is not meaningful. Because of this the comparability of assets and liabilities in the balance sheet cannot be ensured and neither the income statement would contain meaningful economic information. The amounts related to this activity are not significant compared to the figures disclosed in the balance sheet and income statement of the Company so in connection with the accounting separation of gas-engine small power plant only the main indicators are disclosed in the Notes.

18
2.3 Valuation methods used for the preparation of the Balance Sheet
2.3.1 Assets
2.3.1.1 Recognition and measurement of non-current assets
Intangible and tangible fixed assets
Magyar Telekom Plc. carries intangible and tangible fixed assets at historical cost less accumulated depreciation, in case of advance payments on intangible assets and on construction-in-progress at historical cost less impairment. Property, plant and equipment includes the capitalized value of improvements and refurbishment that extend the useful life of the asset, increase its capacity and/or functionality.
One-off and regular usage fees of the acquired frequency usage rights are payable by the Company. If the regular (monthly, quarterly or annual) charges are reliably estimable based on the related Authority Contract and the Company does not expect any further services for these charges in the future (meaning that the one-off and regular charges are paid for the same substance), the total amount of regular charges are considered part of the acquisition cost of the frequency usage rights. These charges are capitalized as part of the concession rights and recognized as current and non-current liabilities. Otherwise the amount of usage fee paid regularly and proportionally to time is recognized as cost of other services in the income statement.
Borrowing costs connected directly to loans taken for the acquisition or production of fixed assets are capitalized by the Company.
Depreciation policy
In case of tangible and intangible fixed assets the depreciation and amortization are based on the gross value of the asset or in case a residual value is defined for tangible fixed asset then the gross value reduced by the residual value.
The method of depreciation is straight-line based on gross value using rates derived from useful lives.
Depreciation starts on the day when the asset is placed into operation and it is over when the useful life of the asset elapsed or the day the asset is derecognized from the books for any reason. The Company records depreciation and amortization monthly in proportion to the days of the given month.
The Company records depreciation of intangible and tangible fixed assets based on the useful lives as follows:
In case of intangible fixed assets:
Years
Concession rights and licenses 8–25
Goodwill 5-10
Other intangibles 3–15
In case of tangible fixed assets:
Years
Buildings 10–50
Networks and other real estate related rights 7–38
Technical equipment, machinery and vehicles 2–25
Other equipment 2–12
Useful lives are determined based on generally accepted international telecommunication industry practices and development potentials. Magyar Telekom Plc. regularly reviews the useful lives of fixed assets and modifies them if necessary.
The Company determines residual values for those groups of assets where the residual values are considered to be significant. Residual value is considered to be significant if the expected realizable value exceeds the expected scrap value when the asset is

19
taken out of service. The Company determines residual value for buildings, vehicles and customer premises equipment (CE routers, 3play equipment etc.) installed at customer premises (purchased through closed-end lease contracts). Determination of residual value is carried out on an individual basis. Residual value is not considered to be significant for intangible assets and other groups of the tangible fixed assets so zero residual value were determined for these assets.
The Company applies residual values only for assets capitalized after January 1, 2001. No residual value is calculated for additional capitalization on assets purchased before January 1, 2001.
The Company does not use the option given in Section 80. (2) of Act on Accounting which allows that the acquisition value of intangible and tangible assets with an individual purchase cost below HUF 100,000 may be charged in one sum as depreciation upon the commencement of use. These assets are recorded individually and their purchase cost are settled following their commencement of use as depreciation during their expected useful lives.
The Company records extraordinary depreciation in cases where the value of the asset permanently decreased due to the fact that it is no longer needed, damaged or destroyed, or if the book value is permanently and significantly in excess of the market value.
If the reasons for the extraordinary depreciation of intangible and tangible assets on the basis of market value no longer exist or have changed, the recognized extraordinary depreciation shall be eliminated and the affected intangible and tangible assets shall be adjusted back to their market value (not to exceed their net value determined in consideration of the straight-line depreciation). The Company records the reversal of extraordinary depreciation as other income.
In case of goodwill the reversal of extraordinary depreciation is inapplicable.
Capitalized value of foundation, restructuring and experimental development
The Company does not capitalize foundation, restructuring and experimental development costs.
Goodwill
As from January 1, 2016 the Company records the difference between the acquisition cost of the purchased business line, sites of operation or store chain and the market value of assets less the value of liabilities assumed as goodwill if the acquisition cost is higher. That amount has to be considered also as acquisition cost which is part of the purchase price but it is under warranty, assurance or guarantee retention agreed in the sales contract and its financial settlement occurs at a different time.
In case the acquisition cost is lower the Company records negative goodwill which is recognized as Deferred income and is amortized to Other income over a period of five years.
No goodwill may be recognized relating to purchase of investments representing ownership, management or influence rights.
As the Act on Accounting allows, the Company still discloses the goodwill related to such investments which were purchased and settled before January 1, 2016 but are not recorded in the books due to termination for any reasons as goodwill.
Intellectual property
Since 2005 only those assets have been recorded as intellectual property which are in the ownership of the Company.
Those intellectual properties where the Company has only the rights of use are recorded as Rights. Their useful lives are the same as those of the intellectual property.
Own work capitalized
Direct costs incurred in the construction of property, plant and equipment constructed by the Company are capitalized. The Company records materials provided to subcontractors at delivery as construction in progress.
Financial investments
Long term investments in subsidiaries are recorded at cost when established or at original purchase price less goodwill when acquired. At the end of the financial year, the Company’s investments are impaired if the market value of the equity investment is permanently and significantly lower than its book value. The impairment review is carried out on an individual basis.

20
Loans granted include loans to subsidiaries, associated companies and other companies as well as long term loans given to employees for housing purposes.
In case of accounts receivables with installments, the Company recognizes impairment on receivables not yet due (recorded as non current receivables) considering the amount estimated to be recovered. This impairment proportion is governed by the rules related to determining the proportion of impairment of receivables.
2.3.1.2 Recognition and measurement of current assets
Inventories
The Company discloses the purchased inventories in its balance sheet at purchase price.
The records are based on rolling average price in case of raw materials and on standard price plus variance in case of goods for resale.
Inventories include materials and assets which future usage can not be determined at the time of purchase (i.e. whether they will be used for an investment project or maintenance). Inventories also include advance payments on inventories and assets held for sale reclassified from tangible and intangible fixed assets.
Tangible and intangible fixed assets reclassified to inventories are valued on an individual basis. Besides these assets Magyar Telekom Plc. considers its inventories as low value items.
The Company records impairment on inventories purchased if: the purchased inventories are of reduced value or the reliable current market price known at the balance sheet preparation date is permanently and substantially lower than the
book value of the inventories or they have low turnover or none
The Company follows the valuation on individual basis for determination and recognition of impairment.
Phone sets are often sold below purchase price under campaigns for acquiring or retaining subscribers which requires commitments for a minimum period of time. However the defined selling price under these campaigns by itself gives no reason for impairment.
If the market value of the previously impaired inventory substantially and permanently exceeds its book value the Company reduces the difference with the reversal of the impairment recorded earlier.
Trade receivables and other receivables
The balance of trade receivables reflects invoiced and acknowledged amounts. The Company discloses in the balance sheet only those receivables which are accepted by customers. If the customer does not (or only partly) accept the amount of the claim then the unaccepted part is not disclosed in the balance sheet. In case of receivables under legal procedures when the debtor accepted the claim earlier but does not pay for some reason, the amount of the claim is disclosed in the balance sheet but its book value is 100 per cent impaired.
Impairment of trade receivables is assessed on two levels. Trade receivables that are individually significant and the ones that are not individually significant are separated. Magyar Telekom Plc. decided to consider items above HUF 200 million to be individually significant for the purposes of assessing accounts receivables for impairment. In case of these items the existence of objective evidence is assessed individually.
In case of items that are individually not significant it is also assessed individually whether objective evidence of impairment exists.
Based on the Section 55. (2) of Act on Accounting the amount of impairment may also be established as a percentage of the amount of such receivables recorded in the books (collective assessment of impairment). Magyar Telekom Plc. evaluates the telecommunications customers - concerning their high volume - using the method of collective assessment (ageing) and the impairment is applied in percentage terms.
The Company set up the impairment categories according to customer groups with similar credit risk exposure.

21
The Company does not impair receivables from related parties and non-current loans granted to related parties except an individual item has an objective evidence for impairment. The Company uses the following rates for impairment:
Overdue Rate of impairment1
Not due yet2 0%-21%
1-30 days 0%-70%
31-60 days 0%-70%
61-90 days 0%-85%
91-180 days 0%-95%
181-360 days 0%-100%
361-720 days 50%-100%
more than 720 days 50%-100%
Customers in state of bankruptcy 100%
1 The Company uses different impairment rates for different groups of customers within overdue terms based on the previous years’ payment experiments. Considering the basis of impairment the installment receivables from equipment sales is treated as a separate group of customers and the used rates of impairment are generally in the higher sections of the indicated intervals. 2 21 per cent impairment is recognized on receivables not due yet in case of defaults on installment receivables from mobile equipment sales. In case of non-overdue receivables 5 per cent or 11 per cent impairment were recognized.
Securities
The Company discloses the original cost of bonds, shares, other securities held for sale and the repurchase value of treasury stock as Securities in current assets. It also contains the book value of related parties decided to be sold in a year.
The Company discloses in all cases among current assets the following items: repurchased treasury stock debt securities with a maturity of less than one year
2.3.1.3 Accruals (asset)
Accrued income
The Company discloses the revenues which are only invoiced after the balance sheet date (revenues not yet accounted for as receivables) but are to be accounted for as revenue in respect of the period concluded by the balance sheet date as accrued income. In particular: revenues from current year traffic and international settlements etc. to be invoiced in the following period.
Prepayments for costs and expenses
The Company discloses the expenses incurred prior to the balance sheet date which can only be accounted for as costs or expenditures in respect of the period following the balance sheet date as prepayments. In particular: rental fees, insurance fees, subscription fees, etc.
2.3.2 Liabilities and Shareholders’ equity
2.3.2.1 Valuation reserve
Until further decision, Magyar Telekom Plc. does not apply the allowed alternative treatment in the Hungarian Accounting Regulations for the recognition of a valuation reserve.

22
2.3.2.2 Restricted reserve
Magyar Telekom Plc. records restricted amounts from capital reserves and retained earnings as restricted reserve. These items include the acquisition cost of the repurchased treasury stock and the amount of development reserves according to the Corporate Tax Law.
2.3.2.3 Provisions
Provisions include the following uncertain liabilities and commitments:
severance payments due to dismissals before retiring age, pending legal cases, environmental liabilities, guarantee liabilities determined by law, future demolition or recovery liabilities deriving from a contract, provision in respect of valuation of derivatives, liabilities related to customer loyalty program,
2.3.2.4 Accruals (liability)
Deferred revenue
Amounts received prior to the balance sheet date but not to be accounted for as income in the current year are disclosed as deferred revenue. In particular, revenues of monthly tariff packages collected (invoiced) in advance, unearned prepaid card traffic revenues which will be earned as revenues following the current year, etc.
Accrued expenses
Costs or expenditures recognized in the current period for which no invoice had been received by the balance sheet date are disclosed as accrued expenses. In particular: co-provider and roaming fees, commission fees, consultancy, maintenance expenses etc. related to the current year but not yet invoiced.
Deferred income
The Company accounts as deferred income among others the following items:
financially settled amount of subsidies for development projects, amount of liability cancelled or assumed by a third party related to assets carried as fixed assets, market value of assets received without consideration or discovered as a surplus
The Company releases the deferred income to extraordinary revenue in proportion to the related asset accounted for as cost or expenditure.
2.3.3 Valuation of items in foreign currencies
Receivables and liabilities denominated in foreign currencies are valued at the official exchange rate of the Central Bank of Hungary (MNB) on December 31.
2.3.4 Derivatives
The Company records derivatives (forward, swap and energy swap deals) among off-balance sheet items as commitments of future receivables or liabilities on transaction price. The Company calculates the fair value of every derivative (with the original aim of delivery and of non-deliverable/clearing transaction) as of the balance sheet date and discloses it in the Notes. In addition the Company creates provision for expected losses related to commitments from derivatives with the original aim of delivery, represented by the negative fair value of the transactions. In case of deals with the original aim of non-delivery the negative fair value of the transactions is accounted for as accrued expenses and disclosed as other expenses on financial transactions in the income statement.

23
2.4 Measurement principles applied in the preparation of the Income Statement
The Company considers those economic events as income, expense or expenditure of exceptional size or incidence which resulted (after taxation) an increase or decrease in shareholders’ equity with 20 per cent or more. The Company discloses in all cases the income, expense or expenditure of exceptional size or incidence in the Notes.
The Company discloses the consideration, excluding value added tax, received for the sale of inventories purchased and for services rendered during the period of contractual performance in the financial year, increased by any price subsidies and extra charges and reduced by discounts as net sales revenues.
Revenues corresponding to invoices issued to the customer based on performance under the conditions defined in the contract, as acknowledged or approved by the customer, or the consideration received in cash excluding any value added tax are recorded as revenue by the Company.
The Company discloses as domestic sales revenues in particular:
sale of inventories purchased or own production for domestic customers, the value of services supplied to resident customers regardless of whether they are paid for in HUF, foreign exchange, foreign
currency or by import purchases, the value of direct sales to a free zone company or to a company operating in a transit area.
Based on the Section 74. (2) of Act on Accounting the exports sales revenue includes the value of sales and services supplied to non-resident customers regardless of the location of the services provided, except the customer is non-residential in the territory of Hungary and has not officially informed Magyar Telekom Plc. (e.g. non-resident customer - whose registered office, place of abode or permanent residence is situated abroad - buys phone sets in the distribution network).
The Company discloses as export sales in particular:
visitor fees invoiced for roaming partners, services provided for foreign vendors, revenues from international co-providers.
Revenues and expenses are recognized in line with the accrual concept of accounting.
Non-realized exchange rate differences are recognized as follows:
if the net balance of non-realized foreign exchange gains and losses is a gain, it is recorded as other income from financial transactions,
if the net balance is a loss, it is recorded as other expenses from financial transactions.
The Company recognizes dividends approved by the General Meeting of the subsidiaries and associates in the year when declared. Interim dividends paid by the subsidiaries and associates are recorded as liability until final approval.
The fees paid by Magyar Telekom Plc. to carrier, mobile and international service providers for call termination are invoiced to the customers by Magyar Telekom Plc. Therefore the payments for calls initiated in Magyar Telekom Plc.’s network and terminated by carrier, mobile and international service providers as well as payments for leased lines (both domestic and international) are recorded and disclosed as Costs of mediated services sold.
2.5 Application of HAR standards related to business year started January 1, 2016
In the Annual Report for the business year started January 1, 2016 the Company discloses the data in effect on the balance sheet date of the previous financial year as data carried over from the previous financial year according to the breakdown prescribed for the balance sheet and profit and loss statement in the Act on Accounting. As a result the prior year’s assets and liabilities arising in connection with related parties and other related parties, income from financial transactions - except dividends received or due - and expenses on financial transactions, dividends declared (payable) and extraordinary income and extraordinary expenses were reclassified from January 1, 2016 as prescribed and applicable according to the Act on Accounting. These reclassifications are disclosed in details in the Notes.

24
2.6 Application of International Financial Reporting Standards (IFRS) for Magyar Telekom Plc.’s Annual Report
According to the Act on Accounting the Company maintains its records and will prepare its Annual Report in accordance with IFRS from the business year started January 1, 2017.
2.7 Other
Magyar Telekom Plc. pays special attention to meeting environmental protection guidelines and regulations in its activities. The necessary power supply batteries used in switches and power generators and used cell phones are stored and neutralized in accordance with the applicable environmental protection laws.
The Company did not have penalty expenses due to environmental liabilities in 2016 or in any previous years.
3 SUMMARY OF THE COMPANY’S FINANCIAL POSITION AND LIQUIDITY
The Company’s financial position and liquidity as of December 31, 2015 and 2016 are represented by the following financial ratios:
2015 2016
Liquidity ratio (= current assets / current liabilities) 0.39 0.55
Operating margin (= operating profit / (sales revenues + other income)) 0.06 0.07
Operating return on assets (= operating profit / total assets) 0.03 0.04
Leverage ratio (= non-current liabilities / (non-current liabilities + equity)) 0.41 0.42

25
The following is the cash-flow statement for the years ended on December 31, 2015 and 2016:
2015 2016
I. Cash flows from operating activities (lines 1-14) 99,753 122,967
1. Profit before taxes (before dividend received) 15,713 14,479 2. Depreciation and amortization 91,125 97,591 3. Impairment losses charged and reversed 15,648 17,355 4. Change in provisions 4,329 257 5. Profit or loss on the sale of non-current assets -953 -3,403 6. Change in accounts payable -80 1,188 7. Change in other current liabilities1 -3,006 1,626 8. Change in accruals (liability) -1,909 13,983 9. Change in accounts receivable -16,437 -9,195 10. Change in current assets (without accounts receivable and cash and cash equivalents) -5,042
475
11. Change in accruals (asset) 115 1,240 12. Income tax paid (on profit and loss) -953 -1,625 13. Dividend and shares paid/payable1 0 -15,635 14. Other non cash items 1,203 4,631
II. Cash flows from investing activities (lines 15-17) -73,122 -71,005
15. Acquisition of fixed assets and financial investments -79,210 -84,514 16. Proceeds from sale of fixed assets and financial investments 954 2,907 17. Dividends and advance dividends received 5,134 10,601
III. Cash flows from financing activities (lines 18-29) -28,632 -51,549
18. Proceeds from issue of shares 0 0 19. Proceeds from the issuance of bonds 0 0 20. Loans received 135,129 125,521 21. Redemption from non-current loans granted and bank deposits 741 687 22. Non-repayable liquid assets received 445 123 23. Share capital decrease 0 0 24. Treasury stock repurchases 0 0 25. Repayment of bonds -3 -1 26. Repayment of loans -165,412 -176,629 27. Non-current loans granted and bank deposits -224 -152 28. Non-repayable donations given 0 0 29. Change in liabilities to founders and other non-current liabilities 692 -1,098
IV. Change in liquid assets (lines I. + II. + III.) -2,001 413
Cash at the beginning of the year 2,847
846
Cash at year-end 846 1,259 1 From 2016, in consequence of the change in Act on Accounting the dividends shall be settled in the year of approval. Accordingly the previous year’s lines of other current liabilities and dividend and shares paid/payable were corrected with HUF 15,635 million dividend related to 2015 and paid in 2016.

26
4 INTANGIBLE ASSETS
The following table is a summary of intangible fixed asset movements between January 1, 2015 and December 31, 2016:
GROSS BOOK VALUE
Rights Intellectual
property Goodwill
Advances on
intangible assets Total
Opening balance as of January 1, 2015 420,837 18,083 221,905
467 661,292
Additions 22,008 1,555 6,116 0 29,679 Disposals -4,048 -57 -2,961 -467 -7,533 Reclassifications 1,410 -1,499 0 0 -89 Closing balance as of December 31, 2015 440,207 18,082 225,060
0 683,349
Additions 17,803 6,034 0 0 23,837 Disposals -642 0 -32,511 0 -33,153 Reclassifications 477 -477 0 0 0 Closing balance as of December 31, 2016 457,845 23,639 192,549
0 674,033
AMORTIZATION
Opening balance as of January 1, 2015 165,304 12,142 138,065
0 315,511
Charge for the year 28,810 857 10,096
0 39,763 Impairment 0 0 0 0 0 Disposals -3,937 -57 -2,961 0 -6,955 Reclassifications 587 -676 0 0 -89 Closing balance as of December 31, 2015 190,764 12,266 145,200
0 348,230
Charge for the year 33,525 2,261 9,724 0 45,510 Impairment 0 0 0 0 0 Disposals -466 0 -9,179 0 -9,645 Reclassifications 394 -394 0 0 0 Closing balance as of December 31, 2016 224,217 14,133 145,745
0 384,095
NET BOOK VALUE as of December 31, 2015 249,444 5,816 79,860
0 335,120
NET BOOK VALUE as of December 31, 2016 233,629 9,506 46,804
0 289,939

27
The main components of the changes in 2016:
Rights
The gross value of rights increased by HUF 17,803 million in the current year. Significant part of this increase was caused by the software rights of use connected to SAP and related systems due to the implementation of the new SAP One.ERP system (HUF 3,263 million), to a new, integrated customer relations and billing system (HUF 2,063 million) and to the Webshop application (HUF 1,918 million), as well as the upgrade of business warehouse (HUF 595 million) and IMS software and licence (HUF 560 million).
Intellectual properties
The increase is mainly due to the upgrades of the billing software for mobile services (HUF 230 million) and the development of Bingo Big Data (HUF 208 million).
In 2016, the Company reviewed the useful life of rights and intellectual properties and changed the useful life where the Company deemed it necessary. Due to the changes HUF 33 million more amortization was charged in 2016.
Goodwill
The movements of goodwill in 2016 are summarized as follows:
Description
Net value as of December 31,
2015 Reclassification to Investments
Amortization charge/
extraordinary amortization in
2016
Net value as of December 31,
2016
T-Mobile Magyarország Távközlési Rt.1 54,417 0 -9,116 45,301
GTS Hungary Kft.2 6,097 -6,097 0 0
T-Systems Magyarország Zrt. (KFKI Zrt.)2 4,345 -4,345 0 0
Stonebridge A.D.2
2,934 -2,934 0 0
Combridge S.R.L.2 818 -818 0 0
Novatel E.O.O.D.2 447 -447 0 0
Other1,2 10,802 -8,691 -608 1,503
Total
79,860
-23,332
-9,724
46,804
1 As the Act on Accounting allows, the Company still discloses the goodwill related to such investments which were purchased and settled before January 1, 2016 but are not recorded in the books due to termination for any reasons as goodwill. In these cases the depreciation and amortization is based on the useful lives determined earlier. 2 Goodwill related to purchased and existing investments which were disclosed in the books as of December 31, 2015 were reclassified to investments from January 1, 2016 according to the Act on Accounting.

28
5 TANGIBLE FIXED ASSETS
The following table is a summary of tangible fixed asset movements – without construction in progress and advance payments for construction in progress – between January 1, 2015 and December 31, 2016:
GROSS BOOK VALUE Land and
buildings and related rights
Technical equipment,
machinery and vehicles
Other equipment
and vehicles Total
Opening balance as of January 1, 2015 472,240 586,817 57,092 1,116,149
Additions 19,702 35,474 4,054 59,230
Disposals -8,482 -94,984 -6,825 -110,291
Reclassifications 9,208 -12,923 1,022 -2,693
Closing balance as of December 31, 2015 492,668 514,384 55,343 1,062,395
Additions 13,514 23,085 4,657 41,256
Disposals -12,612 -78,524 -3,380 -94,516
Reclassifications 184 -12,224 12,107 67
Closing balance as of December 31, 2016 493,754 446,721 68,727 1,009,202
DEPRECIATION
Opening balance as of January 1, 2015 237,823 486,691 49,480 773,994
Charge for the year 17,386 30,699 3,277 51,362
Impairment 0 0 0 0
Disposals -4,854 -92,358 -6,744 -103,956
Reclassifications 10,345 -12,309 803 -1,161
Closing balance as of December 31, 2015 260,700 412,723 46,816 720,239
Charge for the year 18,557 30,382 2,807 51,746
Impairment 0 0 0 0
Disposals -6,676 -76,381 -3,148 -86,205
Reclassifications -23 -9,946 10,021 52
Closing balance as of December 31, 2016 272,558 356,778 56,496 685,832
NET BOOK VALUE as of December 31, 2015 231,968 101,661 8,527 342,156
NET BOOK VALUE as of December 31, 2016 221,196 89,943 12,231 323,370
Further details are disclosed in Appendix 2.

29
The main reasons of the changes in 2016 are as follows:
Land and buildings and related rights
The increase in buildings and other real estate (HUF 1,164 million) is mainly due to the expansion and capitalization on rented buildings (HUF 482 million).
The gross value of telecommunication networks increased by HUF 12,320 million (see Appendix 2) of which the significant items are:
client-side copper based network (HUF 4,515 million), fiber optic telecom cables of local network (HUF 3,723 million), ducts (HUF 1,026 million).
The decrease in real estate and related rights is mainly due to the sale of Infopark building G (gross value is HUF 7,245 million, net value is HUF 4,875 million).
Technical equipment, machinery and vehicles
The increase is due to the capitalization and extension of telecommunication equipment of HUF 23,085 million in gross value, of which the significant items are:
MSAN equipment for TV and internet services (HUF 9,513 million), routers (HUF 2,476 million), Internet KTV modems (HUF 1,365 million), DVBS infrastructure and set top box (HUF 1,307 million), telecommunication equipment purchased from GTS (HUF 1,295 million), closed-end leased set-top boxes (HUF 1,165 million), FTTx equipment (HUF 1,048 million). HUF 78,524 million decrease in gross value of technical equipment is mainly due to the following sales and scrappings:
subscriber telecommunication switches (gross value is HUF 29,952 million, net value is zero), mobile micro- and data transmission equipment (gross value is HUF 6,555 million, net value is HUF 1,406 million), digital telecom transmission equipment (gross value is HUF 5,170 million, net value is HUF 0 million), MLLN node equipment (gross value is HUF 8,253 million, net value is HUF 1 million), ADSL node equipment (gross value is HUF 3,677 million, net value is HUF 124 million), CE routers (gross value is HUF 2,564 million, net value is HUF 51 million). In 2016, HUF 12,107 million gross value (HUF 2,086 million net value) was reclassified from Technical equipment, machinery and vehicles to Other equipment and vehicles due to the revised classification of measuring, installation and testing equipment.

30
Other equipment and vehicles
Other equipment and vehicles increased by HUF 4,657 million in gross value, of which the significant items are:
capitalization and extension of IT application and other servers (HUF 2,776 million), capitalization and extension of computers and peripheral devices not serving the core activities (HUF 604 million). The HUF 3,380 million decrease in gross value of other equipment and vehicles is mostly due to scrapping and sales.
Scrappings mainly related to the following assets:
furniture (gross value is HUF 408 million, net value is HUF 20 million), Intranet equipment (gross value is HUF 380 million, net value is HUF 1 million), measuring and development-purpose equipment (gross value is HUF 317 million, net value is HUF 14 million).
Sales mainly related to the following assets:
passenger cars for personal use (gross value is 809 million, net value is HUF 129 million), IT application and other server (gross value is HUF 375 million, net value is zero). In 2016, the Company reviewed the useful life of tangible assets and changed the useful lives where the Company deemed it necessary. In consequence, HUF 529 million less depreciation was charged in 2016.
6 NON-CURRENT INVESTMENTS IN RELATED PARTIES
6.1 Changes of Non-current investments in 2016
As of December 31, 2015 and 2016, the Company's significant non-current investments are summarized as follows (further details on investments (ownership, voting rights, shareholders' equity data) are disclosed in Appendix 3):
Ownership direct (%)
Ownership indirect (%)
Net book value
Effect of
correction due
to goodwill in
investments December 31, 2016 2015 2016
Stonebridge A.D. 100.00% 75,065 77,476 2,934
Crnogorski Telekom A.D. 76.53% 39,979 39,713 0
T-Systems Magyarország Zrt. 100.00% 19,944 32,451 12,506
GTS Hungary Kft. 100.00% 8,172 9,779 6,097
Combridge S.R.L. 100.00% 2,317 3,114 818
Novatel E.O.O.D. 100.00% 1,723 2,155 447
E2 Hungary Zrt. 50.00% 1,000 1,000 0
Telekom New Media Zrt. 100.00% 700 700 0
Other 5,892 6,099 530
154,792 172,487 23,332
At the end of 2016, non-current investments decreased by HUF 824 million due to the balance sheet date revaluation of the book value of investments. In 2016, the book value of certain investments was corrected with the net value (as of January 1, 2016) of the earlier recognized goodwill related to purchased investments which resulted an increase of HUF 23,332 million in investments. In 2016, HUF 4,490 million impairment was recorded in connection with GTS Hungary Kft.

31
6.2 Short descriptions of companies in which Magyar Telekom Plc. has significant shares
Stonebridge Communications A.D. Skopje (Stonebridge A.D.)
In December 2000, Magyar Telekom Plc., on behalf of a consortium, reached an agreement with the government of Macedonia to purchase 51 percent of Makedonski Telekom A.D., the leading telecommunication provider of Macedonia. The 51 percent ownership acquired by Magyar Telekom Plc. was contributed in 2001 to a newly established Macedonian holding company, Stonebridge A.D. residing in Skopje. Magyar Telekom Plc. has 100 per cent share in Stonebridge A.D. since 2004 and the company has 51 per cent share in Makedonski Telekom. The company suspended its liquidation procedure and restored its normal activities in January 2014.
Crnogorski Telekom A.D.
In 2004, Magyar Telekom Plc. won the tender for the sale of a 51.12 per cent stake in Crnogorski Telekom A.D. issued by the Montenegrin Privatization Agency. Crnogorski Telekom is the leading telecommunication service provider of Montenegro. The share purchase agreement was signed in 2005 in the amount of EUR 114 million. In 2005, Magyar Telekom Plc. acquired a further 25.41 per cent share for EUR 27 million based on an agreement with minority shareholders.
T-Systems Magyarország Zrt.
In 2006 Magyar Telekom Plc. purchased the 100 per cent ownership in KFKI Zrt. Thereafter the company has undergone several transformations whereby ICON Zrt., BCN Rendszerház Kft., KFKI-DIREKT Kft. and EPT Zrt. were merged into the company. In 2012, the company changed its name and continues its activities under the name of T-Systems Magyarország Zrt. Also in 2012, the company concluded a merger contract with Dataplex Kft., IQSYS Kft. and ISH Informatika Kft. and these companies merged into T-Systems Magyarország Zrt. In 2013, after the conclusion of another merger contract, DATEN-KONTOR Kft. merged into T-Systems Magyarország Zrt.
GTS Hungary Távközlési Kft. (GTS Hungary Kft.)
The Magyar Telekom Plc.’s Board of Directors approved the contract on acquiring the 100 per cent share of GTS Hungary Kft. on February 25, 2015. After the acquisition the transaction was registered at Court of Registry of Budapest Environs Regional Court on April 1, 2015. GTS Hungary Kft. is a leading alternative infocommunication service provider in Hungary, provides fixed line voice, data, internet and IT services for business and residential customers.
Combridge S.R.L.
The company is an alternative telecommunication service provider of Romania. Its main activities are: international and domestic leased line connection, international internet access, international IPVPN services, roaming services and international VoIP call termination.
Novatel E.O.O.D.
The company was established in 2004 with headquarters in Bulgaria. The company's main activities are: international and domestic leased line connection, international internet access and IPVPN services, roaming services, infocommunication business solutions and international call termination.
E2 Hungary Energiakereskedelmi és Szolgáltató Zrt. (E2 Hungary Zrt.)
In the first quarter of 2015, Magyar Telekom Plc. signed an agreement with MET Holding AG, one of the leading energy retail suppliers of the region, to establish a joint venture which provides natural gas and electricity services for primarily business customers. The primary aim of the company is to improve and optimize the energy operations serving the business customers in the energy market presence. The joint venture was registered at Metropolitan Court as Court of Registration as of July 7, 2015.

32
Telekom New Media Szolgáltató Zártkörűen Működő Részvénytársaság (Telekom New Media Zrt.)
The company was established by a merger of three companies when Telekom New Media Kft. and Telekom Content & Rights Kft. merged into Telekom New Média Holding Zrt. with effect from July 31, 2010. After the merger the company continues its activities under the name of Telekom New Media Szolgáltató Zártkörűen Működő Részvénytársaság (Telekom New Media Zrt.). Telekom New Media Zrt. is the leading participant of the premium rated interactive market.
7 OTHER NON-CURRENT LOANS GRANTED
Other non-current loans granted as of December 31, 2015 and 2016 are summarized as follows:
2015 2016
Long term part of installment receivables from equipment sales
7,481
6,649
Long term part of housing loans granted to employees
2,729 2,230
Other deposits given 153 74
Total 10,363 8,953
8 INVENTORIES
Materials mainly include network maintenance materials, while the majority of goods are telecommunication goods and unused fixed assets held for sale.
The following is a movement table of inventories between January 1, 2015 and December 31, 2016:
2015 2016
Opening balance 9,828 10,249
Change in inventories 928 2,178
Impairment loss -507 -203
Closing balance 10,249 12,224
The impairments on inventories between January 1, 2015 and December 31, 2016 are as follows:
2015
2016
Opening balance 4,639
5,146
Current year increase 507
203
Current year decrease/disposal 0
0
Closing balance 5,146
5,349

33
9 ACCOUNTS RECEIVABLE
As of December 31, 2015 and 2016 accounts receivable include the following:
2015 2016
Domestic accounts receivable 75,120 75,527
Foreign accounts receivable 1,130 1,176
Impairment of receivables -19,866 -20,744 Total 56,384 55,959
The impairments on receivables between January 1, 2015 and December 31, 2016 are as follows:
2015 2016
Opening balance 17,334 19,866
Current year increase 9,896 9,282
Current year decrease/disposal -7,364 -8,404 Total 19,866 20,744
10 RECEIVABLES FROM RELATED PARTIES
Receivables from related parties as of December 31, 2015 and 2016 are summarized as follows:
2015 2016
Receivables from T-Systems Magyarország Zrt.1 9,017 12,124
Receivables from Crnogorski Telekom A.D.2 44 2,096
Receivables from Novatel E.O.O.D.3 1,593 1,601
Receivables from E2 Hungary Zrt.4 3,338 1,165
Receivables from GTS Hungary Kft. 302 251
Receivables from Telekom New Media Zrt. 161 152
Receivables from Origo Zrt.5 403 0
Other2,6 1,682 1,182
Total 16,540 18,571
1 The vast majority of the balance is the Cash-pool receivable from T-Systems Magyarország Zrt. (HUF 11,852 million). 2 The major part of the receivables from Crnogorski Telekom A.D. is the loan granted (HUF 2,022 million). In 2015, this receivable was in Other. 3 The major part of the receivables from Novatel E.O.O.D. is also the loan granted (HUF 1,590 million). 4 The complete energy trade for business customers has been transferred to E2 Hungary Kft. (a joint venture company of Magyar Telekom Plc. and MET Holding AG) from January 1, 2016. The significant decrease in receivables is due to the use of advance payments in the E2 Hungary Zrt.’s invoices. 5 The Company signed an agreement with New Wave Media Kft. on the sale of its 100 per cent ownership in Origo Zrt. The transaction was finished on February 5, 2016. 6 Other contains the receivables from Makedonski Telekom A.D. which was disclosed on a separate line in previous year, while the receivables from Crnogorski Telekom A.D. was in Other in 2015.

34
11 OTHER RECEIVABLES
The Company's other receivables as of December 31, 2015 and 2016 are as follows:
2015 2016
Roaming discount receivables 2,029 3,108
Tax receivables 1,287 2,643
Advance payments given 1,141 1,076
Receivables from dealers 792 719
Receivables from employees 717 555
Receivables from forward deals 80 0
Other 1,609 989
Total 7,655 9,090
12 SECURITIES
The amount of HUF 35 million includes the cost of the repurchased treasury stock.
In 2016, shares with book value of HUF 272 million was derecognized from repurchased treasury stock and transferred to ESOP Organization. Also in 2016, the sale of investment in Origo Zrt. was finished and so the book value of securities further decreased by HUF 4,200 million.
The number and face value of repurchased treasury stock are detailed in Note 14.
13 ACCRUALS (ASSETS)
2015 2016
Accrued income from telecommunication activities 31,650 32,320
Accrued income from related parties 657 1,836
Accrued income from electricity and gas retail services 4,568 660
Other 2,279 1,197
Accrued income 39,154 36,013 Rental fees and operating costs 1,307 1,345
License fees 142 395
Employee share ownership program (ESOP) 0 190
Insurance fees 121 102 Prepaid costs and expenses related to electricity and gas retail services 233 54
Other 144 1,762 Prepaid costs and expenses 1,947 3,848
Total 41,101 39,861
35
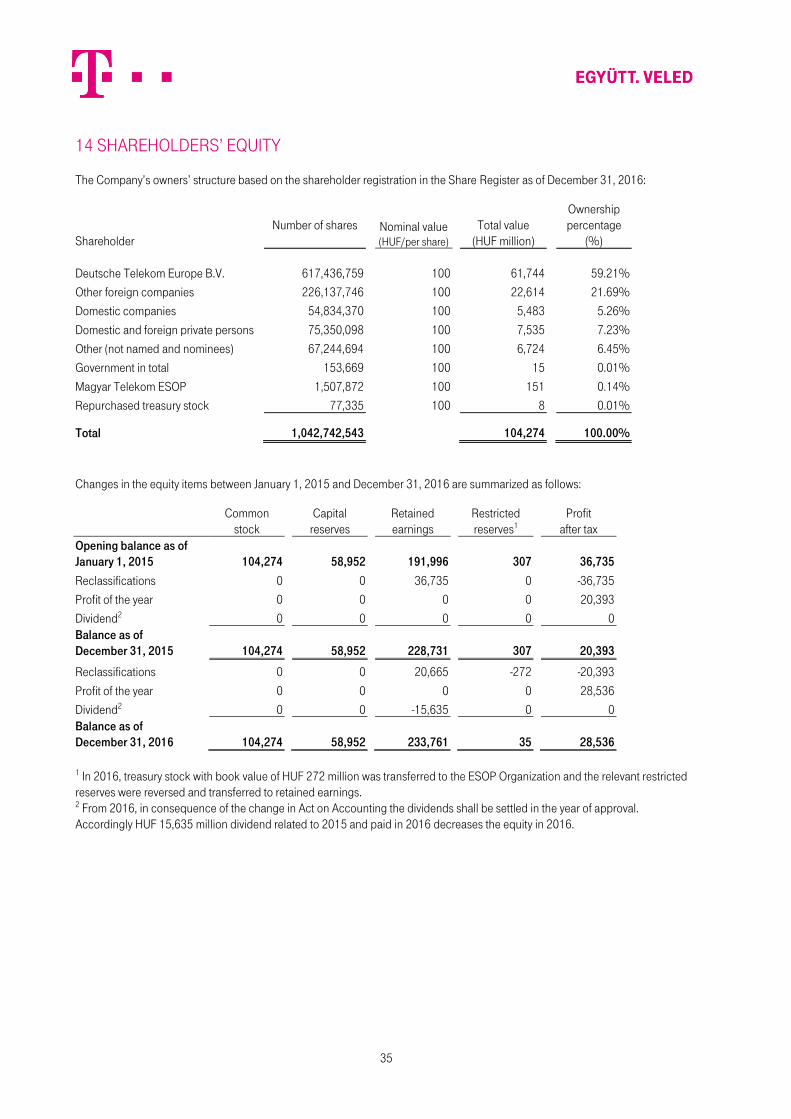
14 SHAREHOLDERS’ EQUITY
The Company’s owners’ structure based on the shareholder registration in the Share Register as of December 31, 2016:
Shareholder Number of shares
Nominal value (HUF/per share)
Total value
(HUF million)
Ownership percentage
(%)
Deutsche Telekom Europe B.V. 617,436,759 100 61,744 59.21%
Other foreign companies 226,137,746 100 22,614 21.69%
Domestic companies 54,834,370 100 5,483 5.26%
Domestic and foreign private persons 75,350,098 100 7,535 7.23%
Other (not named and nominees) 67,244,694 100 6,724 6.45%
Government in total 153,669 100 15 0.01%
Magyar Telekom ESOP 1,507,872 100 151 0.14%
Repurchased treasury stock 77,335 100 8 0.01%
Total 1,042,742,543
104,274 100.00%
Changes in the equity items between January 1, 2015 and December 31, 2016 are summarized as follows:
Common
stock
Capital reserves
Retained earnings
Restricted reserves1
Profit
after tax Opening balance as of January 1, 2015 104,274 58,952 191,996 307 36,735
Reclassifications 0 0 36,735 0 -36,735
Profit of the year 0 0 0 0 20,393
Dividend2 0 0 0 0 0 Balance as of December 31, 2015 104,274 58,952 228,731 307 20,393
Reclassifications 0 0 20,665 -272 -20,393
Profit of the year 0 0 0 0 28,536
Dividend2 0 0 -15,635 0 0 Balance as of December 31, 2016 104,274 58,952 233,761 35 28,536
1 In 2016, treasury stock with book value of HUF 272 million was transferred to the ESOP Organization and the relevant restricted reserves were reversed and transferred to retained earnings. 2 From 2016, in consequence of the change in Act on Accounting the dividends shall be settled in the year of approval. Accordingly HUF 15,635 million dividend related to 2015 and paid in 2016 decreases the equity in 2016.

36
15 PROVISIONS
Provisions were increased and reversed under the following titles between January 1, 2015 and December 31, 2016:
Severance payments, employee bonuses
Asset retirement
obligation and environmental
liabilities
Customer loyalty
program Derivatives
Legal cases
Other Total
Opening Balance as of January 1, 2015 3,816 6,660 1,614 95 444 491 13,120
Increase 4,631 534 1,051 808 255 626 7,905
Decrease -2,099 -252 -628 -46 -96 -455 -3,576 Closing Balance as of December 31, 2015 6,348 6,942 2,037 857 603 662 17,449
Increase 1,168 511 1,110 2,597 639 596 6,621
Decrease -4,196 -460 -859 0 -216 -633 -6,364
Closing Balance as of December 31, 2016 3,320 6,993 2,288 3,454 1,026 625 17,706
16 NON-CURRENT LIABILITIES TO OTHER RELATED PARTIES
This caption contains the non-current portion of other related party loans received from Deutsche Telekom Finance B.V and Deutsche Telekom AG. The following is a movement table of non-current liabilities to other related parties between January 1, 2015 and December 31, 2016:
2015 2016
Opening balance 240,428 218,563
Drawdown 90,107 40,334
Reclassification -112,440 -22,272
Foreign exchange difference 468 -209
Closing balance 218,563 236,416
The short term portion of related party loans (HUF 22,153 million) is disclosed in Note 21.
The installments due over one year of non-current loans are as follows:
Maturity Amount
2018 15,551
2019 105,000
2020 35,000
2021 80,865
Total 236,416

37
17 OTHER NON-CURRENT LIABILITIES
This caption mainly contains the non-current part (HUF 65,264 million) of the frequency fees to be paid by the Company until the end of the frequency usage rights term based on the conditions in the Authority Contract related to frequency usage rights concluded with the NMIAH. In addition this caption contains HUF 311 million long term finance lease.
18 CURRENT LOANS
The following is a movement table of current loans between January 1, 2015 and December 31, 2016:
2015 2016
Opening balance 43,833 13,066
Drawdown 9,500 0
Repayment -41,691 -1,574
Reclassification 1,515 0
Foreign exchange difference -91 8
Closing balance 13,066 11,500
19 ACCOUNTS PAYABLE
The accounts payable as of December 31, 2015 and 2016 contain the following main items:
2015 2016
Domestic suppliers 46,852 35,325
Foreign suppliers 8,506 10,829
Total 55,358 46,154
38
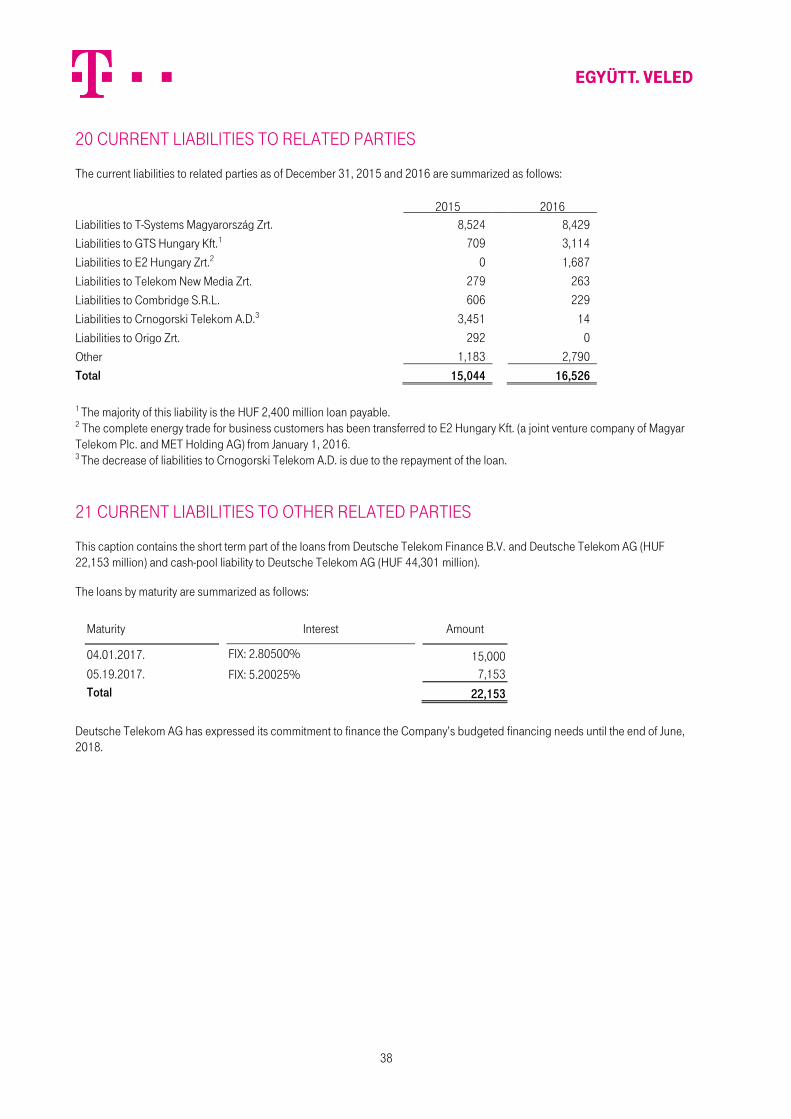
20 CURRENT LIABILITIES TO RELATED PARTIES
The current liabilities to related parties as of December 31, 2015 and 2016 are summarized as follows:
2015 2016
Liabilities to T-Systems Magyarország Zrt. 8,524 8,429
Liabilities to GTS Hungary Kft.1 709 3,114
Liabilities to E2 Hungary Zrt.2 0 1,687
Liabilities to Telekom New Media Zrt. 279 263
Liabilities to Combridge S.R.L. 606 229
Liabilities to Crnogorski Telekom A.D.3 3,451 14
Liabilities to Origo Zrt. 292 0
Other 1,183 2,790
Total 15,044 16,526
1 The majority of this liability is the HUF 2,400 million loan payable. 2 The complete energy trade for business customers has been transferred to E2 Hungary Kft. (a joint venture company of Magyar Telekom Plc. and MET Holding AG) from January 1, 2016. 3 The decrease of liabilities to Crnogorski Telekom A.D. is due to the repayment of the loan.
21 CURRENT LIABILITIES TO OTHER RELATED PARTIES
This caption contains the short term part of the loans from Deutsche Telekom Finance B.V. and Deutsche Telekom AG (HUF 22,153 million) and cash-pool liability to Deutsche Telekom AG (HUF 44,301 million).
The loans by maturity are summarized as follows:
Maturity Interest Amount
04.01.2017. FIX: 2.80500% 15,000
05.19.2017. FIX: 5.20025% 7,153
Total 22,153
Deutsche Telekom AG has expressed its commitment to finance the Company’s budgeted financing needs until the end of June, 2018.

39
22 OTHER CURRENT LIABILITIES
Other current liabilities as of December 31, 2015 and 2016 are summarized as follows:
2015 2016
Liability from topping up the universal balance 6,808 7,179
Annual frequency fee1 6,009 6,022
Liabilities to government2 6,006 5,232
SIP government grant3 0 5,104
Discount granted subsequently on roaming traffic 3,405 3,857
Value Added Tax 1,359 2,957
Finance lease liabilities 2,779 2,054
Customer overpayments 1,329 1,144
Payables to employees and related contributions 985 598
Personal income tax 915 551
Liabilities to mobile service providers related to wholesale call termination fees4 1,286 334
Dividends payable5 0 0
Other6 636 460
Total 31,517 35,492
1 Contains the sum of frequency fees becoming due within one year based on the conditions in the Authority Contract related to frequency usage rights concluded with the NMIAH. 2 In 2016, the main part of liabilities to government is telecommunication tax (HUF 4,012 million) and social contribution (HUF 888 million). 3 Advance payment gained for the Superfast Internet Program (SIP) investment project. 4 The National Media and Infocommunications Authority of Hungary (NMIAH) further reduced the mobile wholesale termination fees from April 1, 2015. The Company appealed against this decision and applied the higher fees in the invoices after April 1, 2015 in conjunction with the interconnect partners. The Company’s appeal for restoring the fees was rejected by the court decision on September 24, 2015 and the providers correct retrospectively the invoices with the higher fee. After these corrections the overpayments will be refunded. Liabilities currently still existing from the pending settlements are disclosed in this line. 5 From 2016, in consequence of the change in Act on Accounting the dividends shall be settled in the year of approval. Accordingly the previous year’s other current liabilities was corrected with HUF 15,635 million dividend related to 2015 and paid in 2016. Dividends payable after the result of 2016 shall be decided by the General Meeting in 2017. 6 Dividends payable for previous years unsettled financially are disclosed in Other.

40
23 ACCRUALS (LIABILITIES)
2015 2016
Financial transactions (premium on bonds)1 725 7,275
Deferred subscription and traffic fees 1,422 908
Deferred revenue from related parties 189 179
Other1, 2 804 882 Deferred revenue 3,140 9,244
Accrued expenses to related parties 3,481 8,319
Interest on owners’ loans 6,112 5,942
Rental fees 4,782 5,565
Expenses related to TV services 3,566 4,286
Charges for public utility services 1,443 3,803
Payroll related expenses 4,644 3,255
Payments to mobile operators 2,680 3,324
Marketing expenses 2,367 2,272
Maintenance expenses 1,717 2,410
Commission fees 1,782 1,793
Insurance fees related to services3 460 1,289
Consultancy fees 774 867
Fees related to contracted employees3 757 820
Expenses from energy services 1,092 656 Expenses related to value added services and content providing 122
402
Payment to other fixed line network operators 388 230
Mediated SI/IT services 219 111
Other (vendor accruals)3,4 7,226 6,228
Accrued expenses 43,612 51,572
Deferred income 1,482 1,476
Total 48,234 62,292
1 In 2015, financial transactions were disclosed in Other according to the breakdown as of 2015. 2 Deferred revenues from energy services (HUF 272 million) were disclosed on a separate line in 2015. 3 In 2015, these items were disclosed in Other (vendor accruals). 4 In 2015, accrued interest expenses (HUF 4 million) were disclosed on a separate line, this year the Other (vendor accruals) contains them.

41
24 NET DOMESTIC SALES
Net domestic sales in the years ending December 31, 2015 and 2016 were as follows:
2015 2016 Voice retail 137,787 133,659
Voice wholesale 8,816 5,445
Non-voice 76,819 82,410
Sale of handsets and other devices 37,064 40,168
Other mobile revenues 16,470 17,023
Revenues from mobile services 276,956 278,705
Voice retail 48,964 45,305
Voice wholesale 1,202 957
Internet 43,036 43,843
Data 7,941 7,709
TV 34,500 36,364
Sale of handsets and other devices 6,783 5,376
Other fixed line services 7,515 8,553
Revenues from fixed line services 149,941 148,107 System integration and IT revenues 5,322 6,154
Energy revenues 50,924 6,891
Other sales revenues 4,933 8,427
Total net domestic sales 488,076 448,284
25 NET EXPORT SALES BY GEOGRAPHICAL AREAS
Net export sales by geographical areas in the years ending December 31, 2015 and 2016 are summarized as follows (sales are solely connected with services provided):
2015 2016
% %
Europe (inside the EU) 11,941 84.10% 18,291 91.59%
Europe (outside the EU) 1,068 7.52% 853 4.27%
Asia 676 4.76% 397 1.99%
America 290 2.05% 296 1.48%
Africa 211 1.48% 98 0.49%
Australia 13 0.09% 36 0.18%
Total net export sales 14,199 100.00% 19,971 100.00%

42
26 OTHER INCOME
Other income in the years ending December 31, 2015 and 2016 are as follows:
2015 2016
Revenue from sale of intangible and tangible fixed assets1 1,891 9,491
Default interest, penalties, damage compensations 8,110 7,472
Reversal of provisions2 3,576 6,364
Discount received subsequently 2,045 3,108
Other income from reversal of impairment 3,449 3,033
Revenue from receivable factoring 685 1,055
Other3 3,494 310 Total 23,250 30,833
1 The increase is due to the other income from sale of two real estates. 2 Details of provisions are disclosed in Note 15. 3 In 2015, certain items were disclosed in Extraordinary expenses. Further details are disclosed in Appendix 5.
27 COSTS OF SERVICES
Costs of services in the years ending December 31, 2015 and 2016 are as follows:
2015 2016
Repair and maintenance costs 18,083 20,289
Rental fees 18,551 18,989
Marketing expenses 9,104 9,816
Commissions paid 9,123 8,835
Other services related to revenues 6,699 8,099
Costs of outsourced sales and management services related to business customers 5,790 6,072
Consultancy 2,733 3,400
Payments to international network operators 3,378 3,340
Postage, costs of delivery and storage 3,162 3,013
Brand license fee 3,996 2,384
Database and ‘infodok’ expenses 1,069 1,949
Expenses of rented workforce and operator activities 1,590 1,900
Property operating costs 3,673 1,623
Education, training expenses 971 926
Costs of property security and cash transport services 669 701
Travel and accommodation costs 491 541
Administrative services and related costs 330 370
Translation and interpretation fees 99 102
Other 3,423 2,224
Total 92,934 94,573

43
28 COST OF GOODS SOLD
Cost of goods sold in the years of 2015 and 2016 contains the following major items:
2015 2016
Goods sold1 63,346 69,815
Energy2 36,759 3,565
Other 135 101
Total 100,240 73,481
1 Contains costs of mobile and fixed devices, accessories and other equipment. 2 The significant decrease is due to that the complete energy trade for business customers has been transferred to E2 Hungary Kft. (a joint venture company of Magyar Telekom Plc. and MET Holding AG) from January 1, 2016.
29 COSTS OF (MEDIATED) SERVICES SOLD
Costs of mediated services sold in the years ending December 31, 2015 and 2016 are as follows:
2015 2016
Payment to mobile operators 16,622 15,847
Costs of TV services 14,224 14,758
Costs of content providing and mobile trade services sold 8,444 9,279
Costs of mediated SI/IT services 4,029 4,353
System usage and other charges related to electricity and gas retail services1 11,155 3,215
Payment to other fixed line network operators 2,062 1,757
Other 961 712
Total 57,497 49,921
1 The significant decrease is due to that the complete energy trade for business customers has been transferred to E2 Hungary Kft. (a joint venture company of Magyar Telekom Plc. and MET Holding AG) from January 1, 2016.

44
30 EMPLOYEES
The average statistical number of employees in 2015 and 2016 are as follows (by function):
2015
Average statistical number of employees
(person)
Salaries
and wages
Employee related contributions Other payroll
related expenses
Social contribution
tax
Healthcare contributions
Vocational
training contributions
Full-time employees
blue collar 771
2,828 770 84 87
822
white collar 5,994
41,367 11,269 597 1,272
5,868
total 6,765
44,195 12,039 681 1,359
6,690
Part-time employees
blue collar 1
3 1 0 0
1
white collar 133
511 139 12 16
114
total 134
514 140 12 16
115
Employees total
blue collar 772
2,831 771 84 87
823
white collar 6,127
41,878 11,408 609 1,288
5,982
total 6,899
44,709 12,179 693 1,375
6,805
Employees not in headcount 1 0
1,033 281 7 32
70
Total 6,899
45,742 12,460 700 1,407
6,875
2016
Average statistical number of employees
(person)
Salaries
and wages
Employee related contributions Other payroll
related expenses
Social contribution
tax
Healthcare contributions
Vocational
training contributions
Full-time employees
blue collar 694
2,726 730 171 42
809
white collar 5,427
38,991 10,441 1,233 595
5,838
total 6,121
41,717 11,171 1,404 637
6,647
Part-time employees
blue collar 0
0 0 0 0
0
white collar 100
463 124 19 7
91
total 100
463 124 19 7
91
Employees total
blue collar 694
2,726 730 171 42
809
white collar 5,527
39,454 10,565 1,252 602
5,929
total 6,221
42,180 11,295 1,423 644
6,738
Employees not in headcount 1 0
1,130 303 21 17
99
Total 6,221
43,310 11,598 1,444 661
6,837
1 Includes employees absent permanently, who are excluded from the average statistical number of employees.
Due to the change in Section 91. a) of Act on Accounting the employee related contributions are disclosed by function and title in 2016.

45
31 REMUNERATION OF THE BOARD OF DIRECTORS AND THE SUPERVISORY BOARD
The compensation granted to members of the Board of Directors and the Supervisory Board of the Company in the years ending December 31, 2015 and 2016 is summarized below:
2015 2016 Board of Directors 16
16
Supervisory Board 63
63
Total 79
79
The members of the Board of Directors and the Supervisory Board have not received any advance payments or loans in 2016. Loans granted to the members of the Supervisory Board are limited to the employee delegates and had been granted to them in their capacity as employees. The changes in these loans in 2016 were as follows:
2016
Balance as of December 31, 2015 4
Loans repaid in 2016 -2
Closing balance as of December 31, 2016 2
The loans are repayable monthly, the average remaining payment term is 21 months. Interest rate of loans: 6.14 per cent or free of interest. The Company did not offer guarantees on behalf of the members of the Board of Directors and the Supervisory Board and has no retirement pension liability to them.
32 OTHER EXPENSES
Other expenses in the years ending December 31, 2015 and 2016 were as follows:
2015 2016
Taxes, contributions, fees (Government taxes) 42,916 40,587 Impairment of receivables and inventories, extraordinary depreciation of intangible and tangible fixed assets 16,430
12,864
Provisions1 7,905 6,621
Net book value of fixed assets sold 938 5,521
Discount granted subsequently on roaming traffic 2,834 3,037
Factored receivables 1,746 2,661
Assets contributed and service provided free of charge2 928 393
Write-off of uncollectible receivables 186 158
Dimenzió contributions2 206 141
Receivables waived2 3,065 134
Other 1,889 781
Total 79,043 72,898
1 Details of provisions are disclosed in Note 15. 2 These items were disclosed in Extraordinary expenses in 2015. Further details are disclosed in Appendix 5.
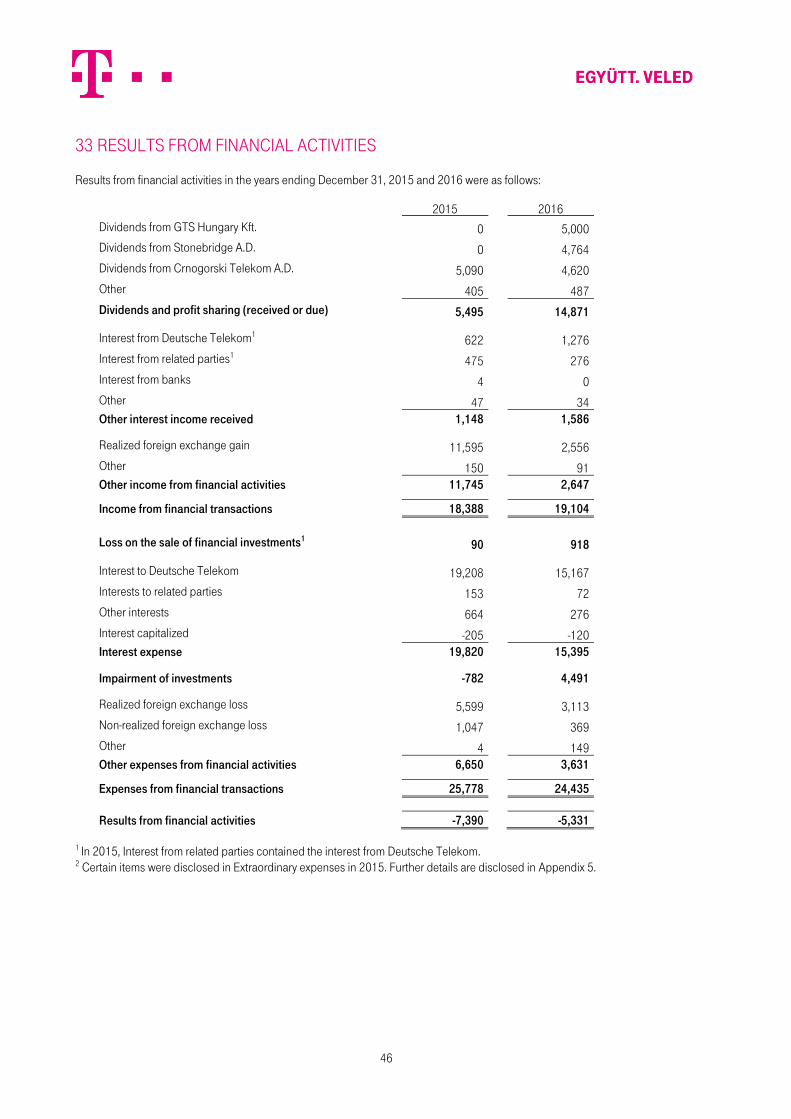
46
33 RESULTS FROM FINANCIAL ACTIVITIES
Results from financial activities in the years ending December 31, 2015 and 2016 were as follows:
2015 2016
Dividends from GTS Hungary Kft. 0 5,000
Dividends from Stonebridge A.D. 0 4,764
Dividends from Crnogorski Telekom A.D. 5,090 4,620
Other 405 487
Dividends and profit sharing (received or due) 5,495 14,871 Interest from Deutsche Telekom1 622 1,276
Interest from related parties1 475 276
Interest from banks 4 0
Other 47 34 Other interest income received 1,148 1,586 Realized foreign exchange gain 11,595 2,556
Other 150 91 Other income from financial activities 11,745 2,647 Income from financial transactions 18,388 19,104
Loss on the sale of financial investments1 90 918 Interest to Deutsche Telekom 19,208 15,167
Interests to related parties 153 72
Other interests 664 276
Interest capitalized -205 -120 Interest expense 19,820 15,395 Impairment of investments -782 4,491 Realized foreign exchange loss 5,599 3,113
Non-realized foreign exchange loss 1,047 369
Other 4 149 Other expenses from financial activities 6,650 3,631 Expenses from financial transactions 25,778 24,435
Results from financial activities -7,390 -5,331
1 In 2015, Interest from related parties contained the interest from Deutsche Telekom. 2 Certain items were disclosed in Extraordinary expenses in 2015. Further details are disclosed in Appendix 5.

47
34 TRANSACTIONS WITH RELATED PARTIES AND MEMBERS OF DEUTSCHE TELEKOM GROUP
Balances of transactions with related parties not disclosed in the balance sheet and income statement separately are detailed as follows.
Loans received from owners are disclosed as Non-current liabilities to other related parties or Current liabilities to other related parties. Their interests are disclosed separately as expenses from financial transactions in the income statement.
Revenues and expenses (mainly relating to telecommunication services) from the members of Deutsche Telekom Group were not disclosed separately as transactions with related parties.
Transactions with related parties and members of Deutsche Telekom Group in the years ending December 31, 2015 and 2016 are summarized as follows:
2015 2016
Net domestic sales 488,076
448,284
- of which: related parties 6,608 7,609
- of which: members of Deutsche Telekom Group 2,237 5,545
Net export sales 14,199 19,971
- of which: related parties 874 699
- of which: members of Deutsche Telekom Group 6,667 5,011
Other income1 23,250 30,833
- of which: related parties 1,014 46
- of which: members of Deutsche Telekom Group 2,398 2,152
Accounts receivable 56,384 55,959
- of which: members of Deutsche Telekom Group 1,184 1,587
Other receivables 7,655 9,090
- of which: related parties 0 69
- of which: members of Deutsche Telekom Group 2,004 3,037
Accrued income 39,154 36,013
- of which: related parties 0 1,836
- of which: members of Deutsche Telekom Group 888 1,045
Prepaid expenses 1,947 3,848
- of which: related parties 0 203
- of which: members of Deutsche Telekom Group 132 1,742
Accounts payable 55,358 46,154
- of which: members of Deutsche Telekom Group 2,531 4,988
Current liabilities to other related parties 130,689 66,454
- of which: members of Deutsche Telekom Group 130,689 66,454
Other current liabilities 47,152 35,492
- of which: members of Deutsche Telekom Group 12,678 3,372
Deferred Income 3,140 9,244
- of which: related parties 0 179
- of which: members of Deutsche Telekom Group 938 7,465
Accrued expenses 43,612 51,572
- of which: related parties 0 8,319
- of which: members of Deutsche Telekom Group 10,319 9,728
1 Certain items were disclosed in Extraordinary expenses in 2015. Further details are disclosed in Appendix 5.

48
35 CORPORATE INCOME TAX
The differences between profit before tax and the tax base for the years ending December 31, 2015 and 2016 are presented below:
2015 2016 Profit before tax 21,537 29,398
Depreciation according to the Act on Accounting 103,913 101,011
Impairment of receivables, recognized impairment in previous year 9,681 9,217
Recognition of provisions 7,905 6,621
Increase of expenditure and decrease of income discovered by tax audit or self-revision 1,714 1,179 Non-repayable donations, assets and services given free of charge, assumed liabilities 329 360
Penalty, sanction 611 297
Recoverable receivables waived and expired 2,980 29
Non-realized foreign exchange difference taken into account in previous years 2,649 0
Other tax base increasing items 487 445
Tax base increasing items 130,269 119,159
Depreciation according to the Tax Law -100,776 -107,596
Dividend income -5,495 -14,871
Reversal of provisions -3,576 -6,364
Bad debt write-off, received payments on uncollectible receivables, reversal of impairment -4,358 -4,514
Decrease of expenditure and increase of income discovered by tax audit or self-revision -1,269 -2,630
Donations -2 -1
Realized gain on disposal of investments -1,580 0
Other tax base decreasing items -782 0
Tax base decreasing items -117,838 -135,976
Tax base 33,968 12,581
Calculated amount of tax 6,409 2,345
Tax credit -5,792 -1,976
Corporate Income Tax 617 369
Energy suppliers' tax 343 41
Withholding tax paid abroad 257 469
Tax liability 1,217 879
Tax liability (self-revision) -73 -17
Total tax liability 1,144 862

49
35.1 Information on investment tax credits
Tax credit on broadband Internet investments announced for 2006: "Tax credit cannot exceed HUF 2,292 million at present value."
Tax credit on broadband Internet investments announced for 2007: "Investment tax credit cannot exceed HUF 1,318 million at present value."
12.724/2005 Ministry of Finance Resolution: "The tax credit is applicable in connection with construction of WLAN put into service by T-Mobile Magyarország Rt. which also provides broadband internet service and cannot exceed HUF 334 million at present value."
Tax credit on broadband Internet investments announced for 2006 by T-Mobile. The tax credit is applicable in connection with construction of WLAN which also provides broadband internet service and cannot exceed HUF 835 million at present value.
Based on the claim filed to the Ministry of Finance on February 3, 2012, the investment tax credit to be utilized relating to the 2012 fixed line telecommunication investment cannot exceed HUF 4,317 million at present value.
Based on the claim filed to the Ministry of Finance on February 3, 2012, the investment tax credit to be utilized relating to the 2012 mobile telecommunication investment cannot exceed HUF 4,769 million at present value.
Based on the claim filed to the Ministry of Finance on 31 October 2012, the investment tax credit to be utilized relating to the 2013 fixed line telecommunication investment cannot exceed HUF 2,986 million at present value.
Based on the claim filed to the Ministry of Finance on 31 October 2012, the investment tax credit to be utilized relating to the 2013 mobile telecommunication investment cannot exceed HUF 2,418 million at present value.
35.2 Other tax related information
Since January 1, 2013 Magyar Telekom Plc. is subject to utility network tax. Owners of ducts, pipes, cables, etc. used for electricity, telecommunication, natural gas, heating, water and wastewater services are subject to a tax based on the length of their utilities. The Company, which is also subject to this tax for the ducts and cables, recognized a utility tax expense of HUF 7,259 million in 2016.
Since July 1, 2012 Magyar Telekom Plc. is subject to telecommunication tax. The telecommunication tax was imposed on SMS/MMS services, as well as on mobile and fixed line telecommunication voice services provided on the telecommunication network. The amount of telecommunication tax was HUF 24,142 million in 2016.
36 DIVIDEND
Together with the approval of these financial statements for issue, the Board of Directors of the Company proposes a HUF 25 per share dividend distribution (in total HUF 26,067 million) to be approved by the Annual General Meeting of the Company in April 2017. In 2016 Magyar Telekom Plc. declared HUF 15 dividend per share (in total HUF 15,635 million).
37 OFF-BALANCE SHEET ITEMS
Off-balance sheet items mainly derive from contractual commitments (contracted construction-in-progress and other development commitments, guarantee obligations, acquisition obligations etc.).
Off-balance sheet items also include receivables and liabilities related to forward and swap deals not closed until the balance sheet date.
Off-balance sheet items are detailed in Appendix 4.

50
38 HAZARDOUS WASTE
The following table shows the movement of hazardous waste at the Company in 2016:
Hazardous waste (kg)
December 31, 2015 2,849
Increase:
Lead batteries 210,406
Other 1,955
Increase in total 212,361
Decrease:
Lead batteries -211,364
Other -3,876
Decrease in total -215,210
December 31, 2016 0
HUF 405 million environmental expenses were recorded in 2015 and HUF 356 million in 2016.
39 RESEARCH & EXPERIMENTAL DEVELOPMENT COSTS
At Magyar Telekom Plc. the research and experimental development costs was HUF 46.3 million as of December 31, 2016.
40 SELF-REVISIONS
At Magyar Telekom Plc., financial events that are related to prior years are recorded in the current year through self-revision.
In 2016, the total of all errors (whether negative or positive) for a given financial year (separately for each year) and the impacts thereof – increasing or decreasing the profit or loss or the equity – do not exceed the value limit set out in the Act on Accounting and in the accounting policy i.e. the 2 per cent of the balance sheet total of the financial year. Accordingly, the discovered errors related to previous years were not disclosed in a separate column in the balance sheet and income statement and so they are part of the current year figures of the income statement.

51
41 IMPORT PURCHASES
Import purchases by geographical areas in the years ending December 31, 2015 and 2016 are summarized as follows:
2015 2016
Services
Products Total Services Products Total
Europe (inside EU) 19,604 29,170 48,774 25,585 32,895 58,480
Asia 2,295 1,062 3,357 2,436 1,427 3,863
Europe (outside the EU) 1,197 7,700 8,897 756 2,936 3,692
America 371 14 385 772 443 1,215
Africa 137 0 137 115 0 115
Australia 12 0 12 3 0 3
Total 23,616 37,946 61,562
29,667 37,701 67,368
During 2016, Magyar Telekom Plc. purchased HUF 37,701 million import products of which less than 30 per cent were recognized as fixed assets, while the rest was goods for resale.
During 2016, the amount of imported services was HUF 29,667 million. 53 per cent of these are included in cost of services, 45 per cent mediated services and the remaining part in other services and other payroll related expenses.
42 REMUNERATION OF AUDITOR
Fees charged by the auditors for the years ending December 31, 2015 and 2016 are summarized as follows:
2015 2016
Audit 232 248
Other assurance services 146 129
Other non-audit services 168 117
Total 546 494
Budapest, February 22, 2017

52
AP
PEN
DIX
1A
B
ALA
NC
E S
HEE
T R
ELA
TED
TO
EN
ERG
Y S
ERV
ICES
– A
SS
ETS
data
in m
illio
ns o
f HU
F
Elec
tric
ityG
asO
ther
Tota
lEl
ectr
icity
Gas
Oth
erTo
tal
A.
FIX
ED
AS
SE
TS
AN
D F
INA
NC
IAL
INV
ES
TM
EN
TS
583
687
877
565
878
83
54
84
213
84
6 8
788
47
575
I.In
tang
ible
ass
ets
458
377
33
4 2
85
33
5 1
204
222
70
289
247
289
939
3.
Rig
hts
458
377
248
609
249
444
422
270
232
937
233
629
4.
Inte
llect
ual p
rope
rty0
05
816
5 81
60
09
506
9 50
6
5.G
oodw
ill0
079
860
79 8
600
046
804
46 8
04
II.
Tan
gib
le a
sset
s1
092
98
378
153
378
560
62
-57
376
191
376
196
1.
Land
and
bui
ldin
gs a
nd re
late
d rig
hts
9726
623
1 60
523
1 96
854
-50
221
192
221
196
- Lan
d4
102
744
2 75
82
-22
659
2 65
9
- Bui
ldin
gs80
220
58 4
2158
721
44-4
152
148
52 1
51
- Tel
ecom
mun
icat
ion
netw
ork
00
160
415
160
415
00
156
742
156
742
- Oth
er p
rope
rties
1336
9 52
99
578
8-7
9 16
09
161
- Rea
l est
ate
rela
ted
right
s0
049
649
60
048
348
3
2.Te
chni
cal e
quip
men
t, m
achi
nery
and
veh
icle
s0
010
1 66
110
1 66
10
089
943
89 9
43
- Tel
ecom
mun
icat
ion
equi
pmen
t and
mac
hine
ry0
010
0 52
610
0 52
60
089
048
89 0
48
- Oth
er te
chni
cal e
quip
men
t, m
achi
nery
and
veh
icle
s0
01
135
1 13
50
089
589
5
3.
Oth
er e
quip
men
t and
veh
icle
s1
23
28
483
8 52
78
-712
230
12 2
31
5.C
onst
ruct
ion-
in-p
rogr
ess
00
36 3
9236
392
00
52 8
2652
826
6.A
dvan
ce p
aym
ents
on
con
stru
ctio
n-in
-pro
gres
s0
01
21
20
00
0
III.
Fina
ncia
l inv
estm
ents
16
12
165
127
165
155
00
18
1 4
40
18
1 4
40
1.
Non
cur
rent
inve
stm
ents
in re
late
d pa
rties
00
154
792
154
792
00
172
487
172
487
7.O
ther
non
cur
rent
loan
s gr
ante
d1
61
210
335
10 3
630
08
953
8 95
3
B.
CU
RR
EN
T A
SS
ET
S2
726
2 98
590
470
96 1
81
83
13
096
277
97 1
38
I. In
vent
orie
s0
-11
0 25
01
0 24
90
01
2 22
41
2 22
4
1.
Raw
mat
eria
ls0
-117
217
10
028
828
8
2.W
ork
in p
rogr
ess
and
sem
i-fin
ishe
d pr
oduc
ts0
07
70
064
64
5.G
oods
for r
esal
e0
010
071
10 0
710
011
872
11 8
72
II.
Rec
eiva
ble
s2
725
2 98
274
872
80
579
83
03
18
2 75
98
3 6
20
1.
Acc
ount
s re
ceiv
able
2 58
32
838
50 9
6356
384
743
14
55 2
0255
959
2.R
ecei
vabl
es fr
om re
late
d pa
rties
5256
16 4
3216
540
16
-14
18 5
6918
571
6.O
ther
rece
ivab
les
908
87
477
7 65
571
31
8 98
89
090
III.
Sec
urit
ies
00
4 5
074
507
00
35
35
1.
Inve
stm
ents
in re
late
d pa
rties
00
4 20
04
200
00
00
4.
Trea
sury
sto
ck, q
uota
s0
030
730
70
03
53
5
IV.
Liq
uid
ass
ets
14
84
18
46
1-1
1 2
591
259
1.
Cas
h an
d ch
eque
s0
115
916
00
063
63
2.B
ank
depo
sits
13
682
686
1-1
1 19
61
196
C.
AC
CR
UA
LS1
84
22
967
36
292
41
101
50
82
05
39
14
83
9 8
61
1.
Acc
rued
inco
me
1 84
02
728
34 5
8639
154
507
153
35 3
5336
013
2.P
repa
id c
osts
and
exp
ense
s2
239
1 70
61
947
152
3 79
53
848
TO
TA
L A
SS
ET
S5
151
6 63
91
004
327
1 0
16
11
71
823
44
898
2 3
0398
4 5
74
Dec
embe
r 31,
201
5D
ecem
ber 3
1, 2
016
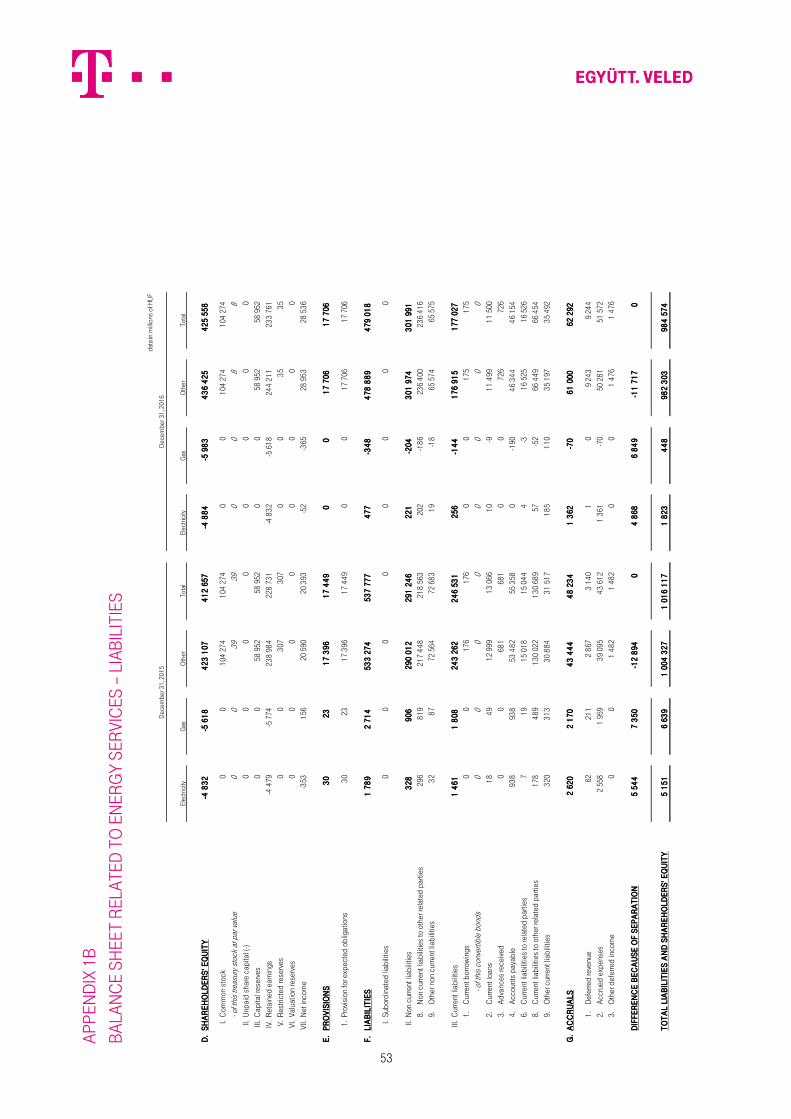
53
AP
PEN
DIX
1B
BA
LAN
CE
SH
EET
REL
ATE
D T
O E
NER
GY
SER
VIC
ES –
LIA
BIL
ITIE
S
data
in m
illio
ns o
f HU
F
Elec
tric
ityG
asO
ther
Tota
lEl
ectr
icity
Gas
Oth
erTo
tal
D.
SH
AR
EH
OL
DE
RS
' EQ
UIT
Y-4
83
2
-5 6
18
4
23
10
7
41
2 6
57
-4
88
4
-5 9
83
4
36
42
5
42
5 5
58
I.C
omm
on s
tock
0 0
104
274
1
04 2
74
0 0
104
274
1
04 2
74
- of t
his
treas
ury
stoc
k at
par
val
ue0
0 39
39
0
0 8
8
II.U
npai
d s
hare
cap
ital (
-)0
0 0
0 0
0 0
0
III.
Cap
ital r
eser
ves
0 0
58 9
52
58 9
52
0 0
58 9
52
58 9
52
IV.
Ret
aine
d e
arni
ngs
-4 4
79
-5 7
74
238
98
4
228
73
1
-4 8
32
-5 6
18
24
4 2
11
23
3 7
61
V.
Res
tric
ted
rese
rves
0 0
307
3
07
0 0
35
35
VI.
Val
uatio
n re
serv
es0
0 0
0 0
0 0
0
VII.
Net
inco
me
-353
1
56
20 5
90
20 3
93
-52
-365
28
953
28
53
6
E.
PR
OV
ISIO
NS
30
2
3
17
39
6
17
44
9
0
0
17
70
6
17
70
6
1.
Pro
visi
on fo
r exp
ecte
d o
blig
atio
ns3
0 23
1
7 3
96
17
44
9 0
0 1
7 70
6 1
7 70
6
F.
LIA
BIL
ITIE
S1
78
9
2 7
14
5
33
27
4
53
7 7
77
4
77
-3
48
4
78
88
9
47
9 0
18
I.S
ubor
din
ated
liab
ilitie
s0
0 0
0 0
0 0
0
II.N
on c
urre
nt li
abili
ties
32
8
90
6
29
0 0
12
2
91
24
6
22
1
-20
4
30
1 9
74
3
01
99
1
8.
296
81
9 21
7 4
48
21
8 5
63
202
-18
6 23
6 4
00
236
41
6
9.O
ther
non
cur
rent
liab
ilitie
s3
2 8
7 72
564
72
68
3
19
-18
65
574
65
575
III.
Cur
rent
liab
ilitie
s1
46
1
1 8
08
2
43
26
2
24
6 5
31
2
56
-1
44
1
76
91
5
17
7 0
27
1.
Cur
rent
bor
row
ings
0 0
176
1
76
0 0
175
1
75
- of t
his
conv
ertib
le b
onds
0 0
0 0
0 0
0 0
2.C
urre
nt lo
ans
18
4
9 1
2 99
9 1
3 0
66
10
-9
11
499
1
1 5
00
3.
Ad
vanc
es re
ceiv
ed0
0 68
1
681
0
0 72
6 72
6
4.
Acc
ount
s p
ayab
le93
8
938
53
48
2 55
358
0
-190
4
6 3
44
4
6 1
54
6.7
19
15
018
1
5 04
4
4
-3
16
525
16
526
8.
178
4
89
13
0 02
2 1
30
689
57
-52
66 4
49
66 4
54
9.O
ther
cur
rent
liab
ilitie
s3
20
31
3
30
88
4
31
51
7 1
85
11
0 3
5 1
97
35
492
G.
AC
CR
UA
LS
2 6
20
2
17
0
43
44
4
48
23
4
1 3
62
-7
0
61
00
0
62
29
2
1.
Def
erre
d re
venu
e62
21
1
2 8
67
3 1
40
1
0 9
243
9
244
2.A
ccru
ed e
xpen
ses
2 55
8
1 9
59
39
095
43
61
2 1
361
-7
0 50
28
1
51 5
72
3.
Oth
er d
efer
red
inco
me
0 0
1 4
82
1 4
82
0 0
1 4
76
1 4
76
DIF
FE
RE
NC
E B
EC
AU
SE
OF
SE
PA
RA
TIO
N5
54
4
7 3
50
-1
2 8
94
0
4
86
8
6 8
49
-1
1 7
17
0
TO
TA
L L
IAB
ILIT
IES
AN
D S
HA
RE
HO
LD
ER
S' E
QU
ITY
5 1
51
6
63
9
1 0
04
32
7
1 0
16
11
7
1 8
23
4
48
9
82
30
3
98
4 5
74
Dec
embe
r 31,
201
5
Non
cur
rent
liab
ilitie
s to
oth
er re
late
d p
artie
s
Cur
rent
liab
ilitie
s to
oth
er re
late
d p
artie
s
Cur
rent
liab
ilitie
s to
rela
ted
par
ties
Dec
embe
r 31,
201
6

54
APPENDIX 1C INCOME STATEMENT RELATED TO ENERGY SERVICES
data in HUF millions
Electricity Gas Other Total Electricity Gas Other Total
1. Net domestic sales 25 315 25 612 437 149 488 076 6 414 477 441 393 448 284
2. Net export sales 0 0 14 199 14 199 0 0 19 971 19 971
I. Sales revenues 25 315 25 612 451 348 502 275 6 414 477 461 364 468 255
3. Change in self-manufactured inventories 0 0 -8 -8 0 0 57 57
4. Capitalised value of self-manufactured assets 37 101 26 802 26 940 9 -9 10 883 10 883
II. Own work capitalized 37 101 26 794 26 932 9 -9 10 940 10 940
III. Other income 119 107 23 024 23 250 12 9 30 812 30 833
of which: reversal of impairment 0 0 3 449 3 449 0 0 3 033 3 033
5. Costs of raw material 40 97 27 269 27 406 4 -4 14 245 14 245
6. Costs of services 86 187 92 661 92 934 62 26 94 485 94 573
7. Costs of other services 25 34 8 042 8 101 4 -3 8 739 8 740
8. Cost of goods sold 18 905 17 855 63 480 100 240 3 081 483 69 917 73 481
9. Costs of (mediated) services sold 5 672 5 486 46 339 57 497 3 080 134 46 707 49 921
IV. Material-type expenses 24 728 23 659 237 791 286 178 6 231 636 234 093 240 960
10. Salaries and wages 258 199 45 285 45 742 0 0 43 310 43 310
11. Other employee related expenses 42 32 6 801 6 875 0 0 6 837 6 837
12. Employee related contributions 84 65 14 418 14 567 0 0 13 703 13 703
V. Employee related expenses 384 296 66 504 67 184 0 0 63 850 63 850
VI. Depreciation and Amortization 135 122 90 868 91 125 179 116 97 296 97 591
VII. Other expenses 480 1 373 77 190 79 043 47 71 72 780 72 898
of which: impairment 28 180 16 222 16 430 7 -212 13 069 12 864
A. PROFIT FROM OPERATING ACTIVITIES -256 370 28 813 28 927 -22 -346 35 097 34 729
13. Dividends and profit sharing (received or due) 7 21 5 467 5 495 13 -12 14 870 14 871
of which: received from related parties 7 21 5 467 5 495 13 -12 14 870 14 87116. Other interest income received 2 4 1 142 1 148 1 -1 1 586 1 586
of which: received from related parties 1 2 472 475 0 0 276 27617. Other income from financial activities 323 197 11 225 11 745 6 3 2 638 2 647
VIII. Income from financial transactions 332 222 17 834 18 388 20 -10 19 094 19 104
18. Loss on the sale of financial investments 0 0 90 90 0 0 918 918
of which: related to related parties 0 0 0 0 0 0 0 020. Interest expense 27 74 19 719 19 820 13 -12 15 394 15 395
of which: to related parties 0 1 152 153 0 0 72 7221. Impairment of investments, securities and bank deposits 0 0 -782 -782 0 0 4 491 4 491
22. Other expenses on financial transactions 207 210 6 233 6 650 11 6 3 614 3 631
IX. Expenses from financial transactions 234 284 25 260 25 778 24 -6 24 417 24 435
B. RESULT FROM FINANCIAL TRANSACTIONS 98 -62 -7 426 -7 390 -4 -4 -5 323 -5 331
C. PROFIT BEFORE TAXES -158 308 21 387 21 537 -26 -350 29 774 29 398
X. Tax expense 195 152 797 1 144 26 15 821 862
D. PROFIT AFTER TAX -353 156 20 590 20 393 -52 -365 28 953 28 536
January - December, 2015 January - December, 2016

55
APPENDIX 1D
GAS-ENGINE SMALL POWER PLANT
data in HUF millions
2015 2016
Technical equipment, machinery and vehicles 224 184Net domestic sales 2 2
Costs of raw material 60 65
Costs of services 56 58Salaries and wages 6 6
Employee related contributions 2 2
Depreciation and Amortization 41 41
Other expenses 4 5

56
AP
PEN
DIX
2A
LAN
D A
ND
BU
ILD
ING
S A
ND
REL
ATE
D R
IGH
TS
(i
n H
UF
mil
lio
ns)
De
sc
rip
tio
nL
an
dB
uil
din
gT
ele
co
mm
un
ica
tio
n
Ne
two
rkO
the
r P
rop
ert
ies
Re
al
Es
tate
re
late
d R
igh
ts
Re
al
Es
tate
an
d
rela
ted
Rig
hts
To
tal
1.
Gro
ss v
alu
e
11
. O
pe
nin
g g
ros
s v
alu
e (
on
Ja
nu
ary
1,
20
16
)2
75
88
9 7
63
37
7 5
46
18
19
44
40
74
92
66
8
12
. A
dd
itio
ns
01
01
61
2 3
20
14
83
01
3 5
14
1
3.
Dis
po
sals
-99
-8 9
30
-3 2
92
-16
8-1
23
-12
61
2
14
R
ec
lass
ific
ati
on
s0
-49
32
6-9
31
84
1
5.
Clo
sin
g g
ros
s v
alu
e (
on
De
ce
mb
er
31
, 2
01
6)
2 6
59
81
80
03
86
90
01
8 0
81
4 3
14
49
3 7
54
2.
Ac
cu
mu
late
d d
ep
rec
iati
on
2
1.
Op
en
ing
de
pre
cia
tio
n (
on
Ja
nu
ary
1,
20
16
)0
31
04
22
17
13
18
61
63
91
12
60
70
0
22
. A
nn
ua
l d
ep
rec
iati
on
02
29
61
5 7
14
50
44
31
8 5
57
2
3.
Ext
rao
rdin
ary
de
pre
cia
tio
n0
00
00
0
24
. D
isp
osa
ls0
-3 6
85
-2 7
42
-12
6-1
23
-6 6
76
2
5.
Re
cla
ssif
ica
tio
ns
0-4
55
-74
-23
2
6.
Clo
sin
g d
ep
rec
iati
on
(o
n D
ec
em
be
r 3
1,
20
16
)0
29
64
92
30
15
88
92
03
83
12
72
55
8
3.
Ne
t b
oo
k v
alu
e (
on
De
ce
mb
er
31
, 2
01
6)
2 6
59
52
15
11
56
74
29
16
14
83
22
1 1
96
Of
wh
ich
re
sid
ua
l v
alu
e0
00
00
0

57
AP
PEN
DIX
2B
TEC
HN
ICA
L A
ND
OTH
ER E
QU
IPM
ENT,
MA
CH
INER
Y A
ND
VEH
ICLE
S
(in H
UF
mill
ions
)
De
scri
pti
on
Tele
com
mun
icat
ion
Equi
pmen
t, M
achi
nery
Oth
er T
echn
ical
Equi
pmen
t, M
achi
nery
an
d ve
hicl
es
Tec
hn
ical
E
qu
ipm
ent,
M
ach
iner
y an
d
Veh
icle
s T
ota
l
Oth
er E
qu
ipm
ent
To
tal
Tec
hn
ical
an
d
Oth
er E
qu
ipm
ent
To
tal
Tec
hn
ical
an
d
Oth
er E
qu
ipm
ent
use
d f
or
envi
ron
men
tal
pro
tect
ion
1. G
ross
val
ue
11
. O
pe
nin
g g
ross
va
lue
(o
n J
an
ua
ry 1
, 2
01
6)
50
9 8
23
4 5
61
51
4 3
84
55
34
35
69
72
73
3
12. A
dditi
ons
22 4
0068
52
3 0
85
4 65
72
7 7
42
0
13. D
ispo
sals
-78
139
-385
-78
52
4-3
380
-81
90
40
14
. Rec
lass
ifica
tions
-12
365
141
-12
22
412
107
-11
70
1
5.
Clo
sin
g g
ross
va
lue
(o
n D
ec
em
be
r 3
1,
20
16
)4
41
71
95
00
24
46
72
16
8 7
27
51
5 4
48
33
2. A
ccum
ulat
ed d
epre
ciat
ion
2
1.
Op
en
ing
de
pre
cia
tio
n (
on
Ja
nu
ary
1,
20
16
)4
09
29
73
42
64
12
72
34
6 8
16
45
9 5
39
33
22.
Ann
ual d
epre
ciat
ion
29 8
1257
03
0 3
82
2 80
73
3 1
89
0 2
3. E
xtra
ordi
nary
dep
reci
atio
n0
00
00
0 2
4. D
ispo
sals
-76
023
-358
-76
38
1-3
148
-79
52
90
25.
Rec
lass
ifica
tions
-10
415
469
-9 9
46
10 0
217
50
2
6.
Clo
sin
g d
ep
rec
iati
on
(o
n D
ec
em
be
r 3
1,
20
16
)3
52
67
14
10
73
56
77
85
6 4
96
41
3 2
74
33
3.
Ne
t b
oo
k v
alu
e (
on
De
ce
mb
er
31
, 2
01
6)
89
04
88
95
89
94
31
2 2
31
10
2 1
74
0
Of
wh
ich
re
sid
ua
l va
lue
1 9
22
01
92
26
34
2 5
56
0

58
AP
PEN
DIX
3
SIG
NIF
ICA
NT
DIR
ECT
INV
ESTM
ENTS
OF
MA
GYA
R T
ELEK
OM
PLC
.
Com
brid
ge S
.R.L
.1Sf
. Ghe
orgh
e, V
iitor
ului
24.
7 C
16
100.
00%
100.
00%
100.
00%
2 04
245
816
2 51
6
Crn
ogor
ski T
elek
om A
.D. P
odgo
rica1
Mos
kovs
ka 2
9, P
odgo
rica
8100
0, M
onte
negr
o76
.53%
76.5
3%76
.53%
38 5
2226
2 91
341
461
E2 H
unga
ry Z
rt.11
17 B
udap
est,
Info
park
sét
ány
1.50
.00%
50.0
0%50
.00%
200
1 75
625
42
210
GTS
Hun
gary
Kft.
2040
Bud
aörs
, Ipar
tele
p ut
ca 1
3-15
.10
0.00
%10
0.00
%10
0.00
%2
043
2 39
070
25
135
Nov
atel
E.O
.O.D
. 116
80 S
ofia
, Bul
garia
blvd
98,
bul
ding
Ast
ra,
entra
nce
D, f
l. 3, o
ffice
5G
100.
00%
100.
00%
100.
00%
1 75
8-5
5-3
1 70
0
Ston
ebrid
ge C
omm
unic
atio
ns A
.D.1
1000
Sko
pje,
Kej
13
Noe
mvr
i, No.
6., M
unic
ipal
ity
of C
enta
r10
0.00
%10
0.00
%10
0.00
%61
051
5 37
7-1
577
64 8
51
Tele
kom
New
Med
ia Z
rt.12
22 B
udap
est,
Nag
ytét
ényi
út 2
9.10
0.00
%10
0.00
%10
0.00
%67
0-2
649
693
T-Sy
stem
s M
agya
rors
zág
Zrt.
1117
Bud
apes
t, B
udaf
oki ú
t 56.
100.
00%
100.
00%
100.
00%
2 00
218
478
1 67
422
154
Ow
ner
ship
Dir
ect
and
In
dir
ect
(%)
Vo
tin
g
Rig
hts
(%
)C
om
mo
n
Sto
ckR
eser
ves
All
dat
a in
th
e ta
ble
rel
ated
to
th
e ca
pit
al is
th
e la
st k
no
wn
fig
ure
s b
y M
agya
r T
elek
om
Plc
. an
d n
ot
yet
aud
ited
.1 T
he e
quity
figu
res
of fo
reig
n su
bsid
iarie
s ar
e ba
sed
on IF
RS
repo
rts a
nd w
ere
trans
late
d us
ing
fore
ign
exch
ange
rate
s as
of D
ecem
ber 3
1, 2
016.
Eq
uit
y
Pro
fit
or
loss
aft
er
tax
(in
HU
F m
illion
s)
Co
mp
any
Hea
dq
uar
ter
Ow
ner
ship
D
irec
t (%
)
Ow
ner
ship
Ind
irec
t (%
)

59
AP
PEN
DIX
4
OFF
-BA
LAN
CE
SH
EET
ITEM
S
(HU
F m
illio
n)
Tot
al
Gua
rant
ee o
blig
atio
n10
076
Com
mitm
ent f
or c
apita
l exp
endi
ture
and
oth
er d
evel
opm
ents
6 16
5C
omm
itmen
t for
cap
ital e
xpen
ditu
re w
ith re
late
d pa
rties
72En
viro
nmen
tal p
rote
ctio
n, re
stor
atio
n an
d ot
her o
blig
atio
ns20
0C
omm
itmen
t for
acq
uisi
tion
0
IDD
ate
Off-
bala
nce
shee
t lia
bilit
y (H
UF
mill
ion)
Off-
bala
nce
shee
t rec
eiva
ble
Valu
e da
teEx
chan
ge ra
teFa
ir va
lue
(Pro
fit+
/ Lo
ss-)
(HU
F m
illio
n)1Z
4000
198
07.0
6.20
11-1
3 25
0 E
UR
50
000
000
11.2
0.20
1826
5.00
3 76
31Z
4000
200
07.0
6.20
11-6
095
EU
R 2
3 00
0 00
005
.19.
2017
265.
001
404
1Z50
0003
505
.22.
2015
-40
625
EU
R 1
30 0
00 0
0001
.18.
2021
312.
50-2
748
1
1Z60
0003
409
.13.
2016
-40
126
EU
R 1
30 0
00 0
0007
.27.
2021
308.
67-7
041
Tot
al-1
00
09
6 T
otal
EU
R 3
33
00
0 0
00
1 7
14
1 Exp
ecte
d, fi
nanc
ially
not
real
ized
am
ount
of n
egat
ive
diffe
renc
e is
reco
gniz
ed a
s ac
crue
d ex
pens
e.
(HU
F m
illio
n)
IDD
ate
Off-
bala
nce
shee
t lia
bilit
y on
stri
ke p
rice
(HU
F m
illio
ns)
Off-
bala
nce
shee
t rec
eiva
ble
Valu
e D
ate
Exch
ange
rate
Fair
valu
e (P
rofit
+ /
Loss
-)(H
UF
mill
ion)
1X60
0508
009
.22.
2016
-1 5
42 E
UR
5 0
00 0
0001
.24.
2017
308.
4014
1X60
0508
409
.22.
2016
-1 5
43 E
UR
5 0
00 0
0002
.21.
2017
308.
5214
1X60
0510
409
.22.
2016
-1 5
45 E
UR
5 0
00 0
0003
.21.
2017
308.
9313
1X60
0564
510
.24.
2016
-565
USD
2 0
00 0
0001
.17.
2017
282.
6622
1X60
0565
310
.24.
2016
-4 6
36 E
UR
15
000
000
01.0
2.20
1730
9.06
291X
6006
360
12.0
6.20
16-1
021
USD
3 5
00 0
0001
.09.
2017
291.
647
1X60
0636
212
.06.
2016
-379
USD
1 3
00 0
0002
.13.
2017
291.
403
Tot
al-1
1 2
30
Tot
al U
SD
6 8
00
00
01
01
Tot
al E
UR
30
00
0 0
00
Op
en f
orw
ard
F/X
dea
ls o
n D
ecem
ber
31
, 20
16
wer
e co
ntra
cted
on
the
OT
C m
arke
t w
ith
the
orig
inal
aim
of
del
iver
y
Forw
ard
and
sw
ap d
eals
Ope
n sw
ap F
/X d
eals
on
Dec
embe
r 31,
201
6 w
ere
cont
ract
ed o
n th
e O
TC m
arke
t with
the
orig
inal
aim
of d
eliv
ery

60
APPENDIX 5
RECLASSIFICATIONS DUE TO THE CHANGE IN ACT ON ACCOUNTING
January-December, 2015
January-December, 2016
1. Net domestic sales 488 076 488 076 1. Net domestic sales
2. Net export sales 14 199 14 199 2. Net export sales
I. Sales revenues 502 275 502 275 I. Sales revenues
3. Change in self-manufactured inventories -8 -8 3. Change in self-manufactured inventories
4. Capitalized value of self-manufactured assets 26 940 26 940 4. Capitalized value of self-manufactured assets
II. Own work capitalized 26 932 26 932 II. Own work capitalized
III. Other income 22 719 531 23 250 III. Other income
From Extraordinary income - Assets received free of charge 104
From Extraordinary income - Development contributions 51
From Extraordinary income - Other extraordinary income 376
of which: reversal of impairment 3 449 3 449 of which: reversal of impairment
5. Costs of raw material 27 406 27 406 5. Costs of raw material
6. Costs of services 92 934 92 934 6. Costs of services
7. Costs of other services 8 101 8 101 7. Costs of other services
8. Cost of goods sold 100 240 100 240 8. Cost of goods sold
9. Costs of (mediated) services sold 57 497 57 497 9. Costs of (mediated) services sold
IV. Material-type expenses 286 178 286 178 IV. Material-type expenses
10. Salaries and wages 45 742 45 742 10. Salaries and wages
11. Other employee related expenses 6 875 6 875 11. Other employee related expenses
12. Employee related contributions 14 567 14 567 12. Employee related contributions
V. Employee related expenses 67 184 67 184 V. Employee related expenses
VI. Depreciation and Amortization 91 125 91 125 VI. Depreciation and Amortization
VII. Other expenses 74 844 4 199 79 043 VII. Other expensesFrom Extraordinary expense -Loans forgiven to T-Systems Magyarország Zrt. 2 900
From Extraordinary expense - Assets contributed and service provided free of charge 918
From Extraordinary expense - Dimenzió contributions 206
From Extraordinary expense - Receivables waived 165
From Extraordinary expense - Other extraordinary expense 10
of which: impairment 16 430 16 430 of which: impairment
A. PROFIT FROM OPERATING ACTIVITIES 32 595 -3 668 28 927 PROFIT FROM OPERATING ACTIVITIES
13. Dividends and profit sharing (received or due) 5 495 5 495 13. Dividends and profit sharing (received or due)
of which: received from related parties 5 495 5 495 of which: received from related parties
16. Other interest income received 1 148 1 148 16. Other interest income received
of which: received from related parties 475 475 of which: received from related parties
17. Other income from financial transaction 11 745 11 745 17. Other income from financial transaction
VIII. Income from financial transactions 18 388 0 18 388 VIII. Income from financial transactions
90 90 18. Loss on the sale of financial investmentsFrom Extraordinary income - Capital decrease of Stonebridge A.D. -9 988
From Extraordinary expense - Capital decrease of Stonebridge A.D. 10 053
From Extraordinary expense - Derecognition of Telemacedonia’s book value (liquidation) 25
19. Interest expense 19 820 19 820 20. Interest expense
of which: to related parties 153 153 of which: to related parties
to other related party 19 208 19 208 to other related party
20. Impairment of investments, securities and bank deposits -782 -782 21. Impairment of investments, securities and bank deposits
21. Other expenses from financial transactions 6 650 6 650 22. Other expenses from financial transactions
IX. Expenses from financial transactions 25 688 90 25 778 IX. Expenses from financial transactions
RESULT FROM FINANCIAL TRANSACTIONS -7 300 -90 -7 390 RESULT FROM FINANCIAL TRANSACTIONS
PROFIT FROM ORDINARY ACTIVITIES 25 295 -3 758
X. Extraordinary income 10 519 -10 519To Loss on the sale of financial investments - Capital decrease of Stonebridge A.D. -9 988
To Other income - Assets received free of charge -104
To Other income - Development contributions -51
To Other income - Other extraordinary income -376
XI. Extraordinary expenses 14 277 -14 277To Loss on the sale of financial investments - Capital decrease of Stonebridge A.D. -10 053
To Loss on the sale of financial investments - Derecognition of Telemacedonia’s book value (liquidation) -25
To Other expenses -Loans forgiven to T-Systems Magyarország Zrt. -2 900
To Other expenses - Assets contributed and service provided free of charge -918
To Other expenses - Dimenzió contributions -206
To Other expenses - Receivables waived -165
To Other expenses - Other extraordinary expense -10
B. RESULT FROM EXTRAORDINARY ACTIVITIES -3 758 3 758
C. PROFIT BEFORE TAXES 21 537 0 21 537 PROFIT BEFORE TAXES
XII. Tax expense 1 144 1 144 X. Tax expese
D. PROFIT AFTER TAX 20 393 0 20 393 PROFIT AFTER TAX
Reclassifications
due to the
Act on Accounting
Annual Report as of 2015 Annual Report as of 2016

61
MAGYAR TELEKOM TELECOMMUNICATIONS
PUBLIC LIMITED COMPANY
Business ReporT
FOR THE YEAR ENDED DECEMBER 31, 2016

62
INTRODUCTION
The Company’s activities are described in Notes to the Financial Statements (1.2 The Company’s area of activity), while the business report provides additional information on the following topics:
THE COMPANY’S SHARE CAPITAL, VOTING RIGHTS AND TRANSFER OF SHARES CORPORATE GOVERNANCE PEOPLE POLICY COMPENSATION OF MEMBERS OF THE BOARD OF DIRECTORS, SUPERVISORY BOARD, AND MANAGEMENT COMMITTEE RESEARCH AND DEVELOPMENT REAL ESTATE, SITES OF OPERATION SUSTAINABILITY ENVIRONMENT PROTECTION CORPORATE COMPLIANCE ECONOMIC ENVIRONMENT TARGETS AND STRATEGY INTERNAL CONTROLS , RISKS AND UNCERTAINTIES ANALYSIS OF FINANCIAL RESULTS FOR 2016 SUBSEQUENT EVENTS BETWEEN THE END OF THE YEAR AND THE RELEASE OF THE REPORT
1 THE COMPANY’S SHARE CAPITAL, VOTING RIGHTS AND TRANSFER OF SHARES
As of December 31, 2016, the share capital of Magyar Telekom Plc. was HUF 104,274,254,300, consisting of 1,042,742,543 Series “A” dematerialized ordinary shares. All Series “A” ordinary shares have a nominal value of HUF 100. Rights and obligations related to Series “A” ordinary shares are described in detail in the Articles of Association Section 2 (http://www.telekom.hu/about_us/investor_relations/ corporate_governance/corporate_governance_documents). Information concerning our ownership structure as of December 31, 2016 is described in the following table:
Percentage of
Shareholder Number of shares share capital
Deutsche Telekom Europe B.V. ................................................................................... 617,436,759 59.21
Publicly traded ............................................................................................................... 425,228,449 40.78
Treasury shares .............................................................................................................. 77,335 0.01
1,042,742,543 100.00
Deutsche Telekom Europe B.V. owning 59.21% of the Company’s voting rights is member of the Deutsche Telekom Group. The ultimate controlling parent of Magyar Telekom is Deutsche Telekom AG (DT or DTAG).
Deutsche Telekom Europe B.V. does not have different voting rights than our other shareholders and, as with our other shareholders, Deutsche Telekom Europe B.V. is entitled to one vote per each ordinary share that it owns.
1.1 Voting Rights and Voting
The holder of each Series “A” ordinary share shall be entitled to one vote at the General Meeting of the Company. The names of shareholders and nominees who intend to participate at the General Meeting shall be registered in the Share Register on the second working day prior to the starting date of the General Meeting. The General Meeting shall adopt its resolutions by a simple majority vote except for resolutions on issues listed in the Articles of Associations, which shall require at least a three-quarters majority of the votes cast. There is no limitation on the rights of shareholders to hold or exercise voting rights on the ordinary shares. There is no limitation of voting rights for ordinary shares in the Articles of Association. The Company has no shares assigned with special management rights.
1.2 Transfer of Shares
For the transfer of dematerialized share a contract for transfer or other legal title is required and, in that context, the transferor’s securities account shall be debited and the new holder’s securities account shall be credited with the transferred dematerialized

63
shares. The holder of dematerialized share shall be considered the holder of the securities account on which the dematerialized shares are recorded.
The transfer of any Series “A” ordinary shares is not bound to any restriction or attainment of agreement.
2 CORPORATE GOVERNANCE
2.1 Annual General Meeting
The General Meeting has the exclusive right to approve and amend the Articles of Association (section 5.2. (a)) unless otherwise provided by law or the Articles of Association. According to the Articles of Association, the Board of Directors is entitled to make decisions regarding any change in the sites, branch offices and – except for the main activity – the scope of activities of the Company and in relation to this, to modify the Articles of Association (section 6.4.(p)).
2.2 Board of Directors
The detailed rules on the scope of authorities and operation of the Board of Directors are detailed in 6.4 of the Articles of Association and in the Rules of Procedure of the Board of Directors (http://www.telekom.hu/about_us/investor_relations/corporate_governance/corporate_governance_documents). The rules of competence regarding the capital increase and purchase of treasury shares are detailed in Sections 5.2 (b) and (p) as well as 6.4. (l) and (m) of the Articles of Association. The General Meeting by its Resolution No. 8/2016 (IV.12.) authorized the Board of Directors to purchase Magyar Telekom ordinary shares for 18 months starting from the date of approval of the resolution. See the detailed description of the authorization on the General Meetings section of our website.
Under Hungarian laws, the Board of Directors is responsible for all matters relating to the Company’s management and course o f business not otherwise reserved to the General Meeting or to other corporate bodies by the Articles of Association or by the Hungarian laws. The Board of Directors draws up, at the end of each business year, a report for the General Meeting and quarterly to the Supervisory Board on the management of the Company, the assets of the Company, the financial situation of the Company and the business policy of the Company.
Pursuant to the Articles of Association, the Board of Directors consists of a minimum of six and a maximum of eleven members elected by the General Meeting for a term of three years, unless otherwise provided by the General Meeting. Members of the Board of Directors can be removed or re-elected at any time by the General Meeting. On December 31, 2016, there were eight members of the Board of Directors.
Meetings of the Board of Directors are held at least four times a year. Meetings of the Board of Directors require the presence of at least the majority of the members for a quorum. Each member has one vote. The Board of Directors passes resolutions by a simple majority vote.

64
On December 31, 2016, members of the Board of Directors, their principal occupation and the years of their original election were as follows:
Name Born Principal Occupation Member since
Christopher Mattheisen ................ 1961 Chief Executive Officer of Magyar Telekom Plc. 2006
Dr. Mihály Patai.............................. 1953 Chairman-CEO of Unicredit Bank Hungary Ltd. 2012
Günter Mossal ............................... 1961 Vice President for Area Management, Board Area Europe, DT AG 2012
György Mosonyi ............................ 1949 Chairman of the Supervisory Board of MOL 2012
Ralf Nejedl ...................................... 1970 Senior Vice President B2B , DT AG 2016
Frank Odzuck ................................ 1959 Chief Executive Officer of Zwack Unicum Plc. 2006
Dr. Ralph Rentschler .................... 1960 Senior Vice President Finance, Group Headquarters and Group Services, DT AG
2003
Kerstin Günther ............................. 1967 Chairman of the Board of Directors of Magyar Telekom Plc Managing Director of Deutsche Telekom Pan-Net, DT AG
2013
The members’ assignment lasts until May 31, 2019.
2.3 Management Committee
Pursuant to the Rules of Procedure of the Board of Directors, the Board of Directors established a Management Committee in 2000. The Management Committee carries out its activities based on its Rules of Procedure approved by the Board of Directors, which is available on the Company’s website (http://www.telekom.hu/about_us/investor_relations/corporate_governance/ management_committee).
Management Committee membership shall last from the date of the assignment or from the date set forth therein as the date of the assignment, to the termination of the assignment, due to any reasons.
On December 31, 2016, the members of the Management Committee and the years of their original election were as follows:
Name Born Current position Member since Christopher Mattheisen .................... 1961 Chief Executive Officer of Magyar Telekom Plc. 2006
András Gyenesi .................................. 1969 Chief Commercial Officer Residential 2015
János Szabó ........................................ 1961 Chief Financial Officer 2013
Dr. Balázs Máthé ................................ 1968 Chief Legal and Corporate Affairs Officer 2010
Tibor Rékasi ........................................ 1973 Chief Commercial Officer Enterprise, Chief Executive Officer of T-Systems Hungary Ltd.
2013
Éva Somorjaiii ...................................... 1966 Chief Human Resources Officer 2007
Walter Goldenitsii ............................... 1970 Chief Technology and IT Officer 2013
Péter Lakatos ...................................... 1975 Chief Commercial Officer SMB 2013
i MC membership terminated on January 10, 2017. ii MC membership terminated on December 31, 2016
2.4 Supervisory Board
The Supervisory Board carries out its activities based on Section 7 of the Articles of Association and its Rules of Procedure approved by the General Meeting (http://www.telekom.hu/static/sw/download/SB_RulesofProcedure_20150415.pdf). The Supervisory Board shall examine all submissions to be submitted to the General Meeting and present its opinion thereof at the General Meeting. The General Meeting may pass a resolution on a report pursuant to the Accounting Act and the use of the profit after income tax only upon

65
receipt of the written report of the Supervisory Board. The Supervisory Board makes a proposal directly to the General Meeting regarding the election, remuneration and removal of the Statutory Auditor.
Pursuant to the Company’s Articles of Association, the Supervisory Board consists of a minimum of three and a maximum of fifteen members elected by the General Meeting for a term of three years, unless otherwise provided by the General Meeting. The Central Workers’ Council of Magyar Telekom nominates one-third of the Supervisory Board members (employee representatives). Meetings of the Supervisory Board have a quorum if two-thirds of its elected members but at least 3 members are present.
On December 31, 2016, the members of the Supervisory Board, their principal occupation and the years of their original election were as follows:
Name Born Principal Occupation Member since
Dr. László Pap ................................ 1943 Budapest University of Technology and Economics, Professor 1997
Dr. János Bitó ................................. 1936 Chairman of the Thesis and Final Examination Board at Pázmány Péter Catholic University, Information Technology Faculty
2010
Sándor Hartai 1966 Expert of TU Wholesale Directorate, Magyar Telekom
2016
Dr. János Illéssy ............................. 1962 Managing Director, Lebona Kft. 2006
Dr. Sándor Kerekes ....................... 1948 Director of Institute of Environmental Sciences, Corvinus University Budapest
2006
Konrad Kreuzer ............................. 1948 Managing Director of EUTOP Vienna, Budapest and Prague
2006
Tamás Lichnovszky ...................... 1962 Chairman of the Central Workers’ Council, Magyar Telekom 2010
Martin Meffert ................................ 1960 Responsible for Corporate Governance issues of Magyar Telekom, Makedonski Telekom and Slovak Telekom at the Group Headquarters of Deutsche Telekom AG.
2009
Éva Őz ............................................. 1957 Controlling Manager of Controlling Directorate, Chairwoman of the Workers’ Council of Central Functions, Magyar Telekom
2012
Dr. Károly Salamon ....................... 1954 Managing Director, MIS Kft.
2010
Zsoltné Varga ................................. 1969 Quality Manager, Magyar Telekom 2008
Dr. Konrad Wetzker ....................... 1950 Chairman, School of Management of Corvinus University of Budapest
2011
The members’ assignment lasts until May 31, 2019.
2.5 Audit Committee
The Audit Committee executes its duties pursuant to the Articles of Association Section 7.8, and its own Rules of Procedure (http://www.telekom.hu/static/sw/download/AC_Rules_of_Procedure_03_12_2015.pdf). The members of the Audit Committee have been elected by the General Meeting from the independent members of the Supervisory Board for the same period as their membership in the Supervisory Board.

66
On December 31, 2016, the members of the Audit Committee were as follows:
Dr. János Illéssy Dr. János Bitó Dr. Sándor Kerekes Dr. László Pap Dr. Károly Salamon
2.6 Remuneration and Nomination Committee
As of September 20, 2013 certain nomination related tasks were assigned to the Remuneration Committee and its name was changed to Remuneration and Nomination Committee.
The Remuneration and Nomination Committee is established by the Board of Directors of the Company to function as supporting body of the Board of Directors of the Company regarding the remuneration and certain nomination related issues of the members of the corporate bodies and the top executives of the Company in accordance with the Rules of Procedure. (http://www.telekom.hu/static/sw/download/Rules_of_Procedure_of_the_Remuneration_and_Nomination_Committee_ENG_20130920.pdf).
The Remuneration and Nomination Committee, among others, makes recommendations to the Board of Directors on the establishment and/or termination of employment, and the modification of the employment contract of the chief officers, as well as the remuneration package of the chief officers, including setting and evaluating annual individual targets. The Remuneration and Nomination Committee holds at least two meetings each year.
The Remuneration and Nomination Committee consists of three members. The members are elected by the Board of Directors from among its members.
On December 31, 2016, the members of the Remuneration and Nomination Committee were as follows:
Dr. Ralph Rentschler Frank Odzuck Kerstin Günther
2.7 Corporate Governance and Management Report
Magyar Telekom Plc. is a public limited company listed on the Budapest Stock Exchange. In 2004, the Budapest Stock Exchange issued its Corporate Governance Recommendations (the Recommendations) containing recommendations related to the corporate governance practice of companies listed on the Budapest Stock Exchange, taking account of the most commonly used international principles, of experiences gathered in Hungary, and of the characteristics of the Hungarian market as well as the Companies Act. The Recommendations were updated in 2007, 2008 and in 2012. The Recommendations effective from time to time is avalailable at he website of the Budapest Stock Exchange: https://www.bse.hu/Products-And-Services/Rules-and-Regulations/BSE-Rules
In line with the current regulations, the Board of Directors of Magyar Telekom Plc. approved the Corporate Governance and Management Report of the Company (report) prepared in accordance with the Corporate Governance Recommendations and submitted it to the General Meeting. The report – along with other corporate governance related documents - is published at the Corporate Governance section of the website:
http://www.telekom.hu/about_us/investor_relations/corporate_governance/corporate_governance_documents
Companies listed on the stock exchange are required to express their views on their corporate governance practices in two ways. In the first part of the report they have to give account of the corporate governance practices applied by their company in the given business year, including their corporate governance policy, and a description of any unusual circumstances. In the second part of the report, in accordance with the "comply or explain" principle, they have to indicate their compliance with those recommendations included in specified sections of the CGR ("R" - recommendation) and whether they apply the different suggestions formulated in the CGR ("S" - suggestion). In the case of suggestions, companies shall only indicate whether they apply the given guideline or not; there is no need for a specific explanation.
The Corporate Governance Declaration on the Compliance with the Corporate Governance Recommendations, and regarding certain

67
questions the possible alterations and their explanations are included in the report. Sections 1 to 5 of the above report include the description and operation of the Board of Directors, the Supervisory Board, the relevant committees and executive management. Section 6 of the report includes a description of the internal controls and risk management procedures, while Section 8 of the report describes our disclosure policies and insider trading guidelines. In Sections 9 to 10 the method of excersising shareholders’ right and the rules on conducting the General Meeting is summarized, while Section 11 contains the Remuneration Statement. The Company complies with the vast majority of the 150 recommendations and suggestions, however in the busuiness year of 2016 in case of 10 recommendations and 6 suggestions it has not or not completely complied with due to the ownership and oragnizational structure or processes of the Company.
The Board of Directors, through the internal audit area, carried out an evaluation of the Company’s disclosure processes in 2016 again. Based on the evaluation, the disclosure controls and procedures of the Company were effective and designed to ensure a proper basis for the timely and accurate disclosures to the market participants required under the respective accounting, capital markets and company law regulations.
2.8 Diversity
The Social Charter, Diversity Policy and the updated Equal Opportunities Plan of Magyar Telekom set the general human rights principles of the Company. Magyar Telekom rejects any discrimination on gender, age, disability, ethnic origin and race, religion and sexual orientation, and rejects all forms of discrimination in the workplace, and expressly support the realization of equal opportunities and diversity among colleagues, by taking into consideration the cultural and legal particularities. To ensure non-discrimination and equal opportunities at workplace has high priority. The achievement of diversity goals is practiced by the company under the equal opportunities plan, which covers all employees. Our aim is to sensitize our employees, for which a program has been launched and we supported the young romas catching up by participating in the Integrom Program. Social Charter: http://www.telekom.hu/static-tr/sw/file/Social_Charter.pdf Diversity Policy: http://www.telekom.hu/static-tr/sw/file/Diversity_Policy.pdf Equal Opportunities Plan: https://www.telekom.hu/static-tr/sw/file/Magyar_Telekom_Eselyegyenlosegi_Terv_2016_2020_en.pdf

68
3 PEOPLE POLICY
We have renewed our People Strategy and identified its pillars we wish to focus on in 2016 and 2017 in line with Magyar Telekom’s Business Strategy. Prior to and in preparation for that, we transformed our HR organization and operating model in the second half of 2015 in order to support the achievement of the ambitious goals set forth in our Business Strategy by an efficient and customer-focused HR. The implementation of our corporate-level People Strategy encompassing two years is a task shared by the whole company, i.e. managerial and non-managerial personnel alike. HR facilitates the process by actions, tools and solutions.
3.1 People strategy from the aspect of the Company’s
Efficient company – focus on Total Workforce Management (TWM) cost, thus enabling flexible and efficient management of expenses
Competitive company – elaboration and safeguard of competitive edge based on human capital through recruitment-selection, supported by training development and remuneration
Energized company – international, diverse and healthy organization focused on wellbeing (physical, mental and social wellbeing), that experiences success
3.2 People strategy from the aspect of the employees
The message of our Business Strategy is that “We are building a successful ICT company with satisfied customers and dedicated colleagues”. Our colleagues are the building blocks of that success. We implement our strategic goals with them.
We are building a competitive edge on the skills and attitude of future Telekom people.
In 2016-2017, we build our People Strategy around 4 pillars: brand and recruitment, training-development, remuneration and wellbeing.
We keep an eye on the required personal traits of the future Telekom people even in course of recruitment-selection. We segment our positions in recruitment to reach the right people by our ads. We have reviewed and renewed our online recruitment means and channels.
The objective set by another pillar of the People Strategy is achieved through the development of our employees and the expansion of their experience. The emphasis is on self-development, for which we provide the necessary funds, digital content and online means.
We can improve the satisfaction and commitment of our employees by continuing to provide competitive remuneration packages and our diverse and wide range of benefits.
Magyar Telekom has placed in the focus of its strategy for 2017 the implementation of the digital business model, the essence of which is the exploitation to the fullest extent of new technologies in maintaining contact with customers, enhancing confidence and, eventually, value creation. In order to support the achievement of the above, HR has reviewed its internal operating model and introduced online services for non-managerial and managerial employees alike, as well as strives to incorporate the HR tools that influence corporate culture into online solutions, thus supporting the successful introduction of the new business model. People strategy pillars in 2016-2017:
Employer brand building – we create a livable and likeable workplace, which is satisfactory for our employees and offers an attractive perspective in the labor market through its future oriented methods of work. We put greater emphasis on using social media solutions in building the brand.
Recruitment-selection – We use segment-based online recruitment channels and means to select the best candidate for the specific positions. During the selection process, we seek the attitude and personal traits defined as requirements for future Telekom employees.
Remuneration – We retain our competitive edge in the market with our total compensation package and we are forerunners in the market with our innovations in compensation methods. We make our company attractive for employees by means of our wide range of benefits. We have a transparent, simpler and consistent job grading model, which reflects primarily the respective values of jobs, and provides for market comparison, as a basis for a competitive remuneration policy.

69
Training development– We are building a digital Telekom, thus put an increasing emphasis on collaborative digital tools and solutions that enable and inspire self-development. Online training catalogue, online training materials, online coachbank and mentoring, online knowledge sharing (Share).
Wellbeing – We take action for each other and ourselves in order to maintain our physical, mental and social wellbeing. Energized employees make us successful. We draw employees’ attention to conscious preventive health efforts, volunteer work, sustainability and work-life balance.
The principles of justice and equal footing are set out in the basic standards articulated in our Code of Ethics published in 1997. Alternative forms of employment like telework, part-time work, flex-work, employment of disabled persons provide possibilities for the practical implementation of the principle of equal footing.
Equality at work and in life – is a principle that manifests in Telekom’s operation. In order to enforce the principle, we adopted for the fourth time an Equal Opportunity Plan together with the employee representative bodies. The Equal Opportunity Plan contains the goals and tasks the company plans to support colleagues. In the period of 2016-2020, our equal opportunity efforts focus on
promoting physical and mental wellbeing, a family-friendly mentality, equal opportunities for women, including female executives, and the cooperation of different generations.
3.3 Headcount
The following table provides information on the number of full-time employees, including full-time equivalents, of Magyar Telekom Plc.:
2014 2015 2016
Magyar Telekom Plc. .................................................................................. 7,046 6,670 6,281
3.4 Total Workforce Management
From 2009, Magyar Telekom introduced the TWM system. This scheme focuses on the total labor cost and not solely on headcount number and employee-related expenses. As a result, it enables us to increase the flexibility and efficiency with which all human resource-related expenses are managed, including contracted or temporary employees as well as outsourcing and entrepreneurial contracts.
3.5 Workforce Reduction and Redeployment
In recent years centralization, technological improvements and attrition have allowed us to reduce the size of our workforce. While overall personnel levels are falling, the number of highly skilled employees is increasing. We plan to further reduce the number of our employees in the long term, though in 2017 we do not have plans for headcount reduction at the Hungarian operation.
According to the terms of the agreement with Employee Representative Bodies, in order to keep salaries at competitive levels, as from January 1, 2017, employee salaries, excluding senior management, at the Company will rise by 5.5% on average.
3.6 Employee Representation and Labor Relations
Magyar Telekom Plc. has entered into a collective bargaining agreement with the Hungarian telecommunications trade unions (Távközlési Szakszervezet, TÁVSZAK and Magyar Távközlési Ágazati Szakszevezet, MATÁSZ). The agreement, which can be terminated by either party with three months' notice, applies to all Magyar Telekom Plc. employees except the CEO, regardless of their union membership status. Wage terms in the collective bargaining agreement must be renegotiated annually. If the employment is terminated due to reasons related to the employer’s operation, employees are entitled to a specific amount of severance pay surplus, which depends on the tenure of the employee.
In addition to the collective bargaining agreement, employees of our Hungarian operations are generally covered by the Act I of 2012 on the Labor Code, which imposes various restrictions on the involuntary termination of employment. The Labor Code protects employee interests through two different labor organizations: the Trade Union and the Workers’ Council.
The Trade Union, as the official representative of employee interests in negotiations relating to the terms of employment, has the right to be informed of all corporate measures that may significantly affect the interests of employees and to commence legal action against the Company for employment-related conduct that infringes an employment rule. In addition, the Workers’ Council directly represents

70
employee interests in dealings with management and decides jointly with management on matters involving employee welfare funds and institutions. The Workers’ Council must be informed semi-annually on issues affecting our economic performance and changes in wages, employment conditions and working hours. The Workers’ Council must also be consulted on corporate measures affecting employees.
Under the Act V of 2013 on the Civil Code one third of the Supervisory Board shall consist of employee representatives. The employee representatives in the Supervisory Board are nominated by the Central Workers’ Council considering the opinion of the trade unions operating at the Company. Persons nominated by the Central Workers’ Council shall be elected by the General Meeting to the member of the Supervisory Board, except if disqualifications exist in respect of the nominated persons. On December 31, 2016, four members of the Supervisory Board were employee representatives. These members were Tamás Lichnovszky, Zsoltné Varga, Éva Őz and Sándor Hartai.
We believe that our relations with our employees are good. We have not experienced any labor strikes or disruptions since our formation.
3.7 Pensions and Benefit Programs
Magyar Telekom’s welfare and social benefits constitute an exceedingly wide-ranging pool. A part of them is granted to every employee, while others are available on certain conditions or are of an insurance nature. In case of certain benefits, employee’s individual contribution is a prerequisite of the employer’s contribution. The way social benefits and discretionary benefits are granted is set out in the Collective Agreement and related regulations.
We provide employees with telecommunication allowances, subsidized meals, interest-free housing loans (such loans are not offered or extended to the Company's Board of Directors), discount holiday facilities and other fringe benefits. In addition to our statutory contributions to governmental health, retirement and unemployment schemes, we contribute to the employees' pension, health and self-aid savings, provided he is member of the voluntary fund, which provides private pension and health insurance as well as social benefits supplementing government pension and health benefits. We do not, however, guarantee payment by the fund to its members. At December 31, 2016 approximately 68% of employees of Magyar Telekom Plc. participated in the pension-, 44% in the self-aid-, and 63% in the health fund.
3.8 Human rights
Social Charta of Deutsche Telekom Group and Magyar Telekom is a voluntary commitment (based on the Decree of July 22, 2003 of the Group Board of Directors) on behalf of the employer side to comply with the minimal social standards throughout the entire company. It contains basic principles regarding labor relationships and conditions of employment. We expect compliance with the standards from our vendors as well. Via the Social Charta, these social standards are mandatory for the entire company, and are available to anyone. Magyar Telekom submits annual reports on the compliance with the 9 basic principles set forth in the Social Charta.
The Social Charta and more details: https://www.telekom.hu/static-tr/sw/file/Social_Charter.pdf and http://www.telekom.hu/about_us/society_and_environment/society/equal_opportunities).
Magyar Telekom strives to ensure equal chances for its employees, and to improve the situation of certain underprivileged employee groups. As part of this effort, from 2008 Magyar Telekom have accepted Equal Opportunities plans valid for periods of several years. Currently the Equal Opportunities Plan IV is in force, which determined guiding principles and an action plan for the 2016-2020 period. In addition, Magyar Telekom is open to join similar government, business and civil initiatives in order to achieve equal social opportunities. Equal Opportunities Plan IV: (http://www.telekom.hu/static-tr/sw/file/Magyar_Telekom_Eselyegyenlosegi_Terv_2016_2020_en.pdf).
These policies are published and declare measurable indicators concerning the human rights, and developing goals on these fields. The existence of these policies helps to fortify the employee’s awareness and the engagement to legitimate behavior.
Giving support to the respective disadvantaged employee groups and to provide them equal opportunities require additional efforts and human resources.
Magyar Telekom can rely on its top management that is committed to sustainability and expects high performance regarding the compliance with human rights. These extra efforts are supported by the Chief Executive Officer and the Chief Human Resources Officer personally.

71
3.9 ESOP Organization
In July 2016 Magyar Telekom launched a Remuneration Policy based employee share ownership program (ESOP) under which Magyar Telekom shares will be distributed to the vast majority of the employees of Magyar Telekom Plc. and T-Systems Hungary Ltd. This program is in addition to the Company’s regular remuneration package. Please refer to Note 1.3 of the Financial Statements for detailed system of control and mechanism of the employee share scheme.
4 COMPENSATION OF MEMBERS OF THE BOARD OF DIRECTORS, SUPERVISORY BOARD, AND MANAGEMENT COMMITTEE
The aggregate compensation of the members of the Board of Directors in their capacity as Board members was HUF 16 million in 2016.
The aggregate compensation of the members of the Supervisory Board in their capacity as Supervisory Board members was HUF 63 million in 2016.
The total compensation expenses (including social security and other payroll-related taxes as well as contractual termination expenses) of the members of the Management Committee (MC) was HUF 1,750 million in 2016.
On December 31, 2016, three of the eight MC members have an employment contract with fixed duration. Pursuant to Hungarian legislation, if an employment contract is terminated before the end of its term, the absence fee received for the remaining period is up to 12 months. The notice period is two months for three of the five indefinite contracts, and six months for the remaining two contracts. For two contracts the severance payment is in accordance with the Labour Code and the Collective Agreement, for the rest of the contracts the severance payment is between 3 and 16 months.
In addition to the above, the affected persons are bound by the non-compete clause, under which the employee is barred from entering into employment with any Hungarian or international competitor of Magyar Telekom and is required to refrain from providing direct or indirect services or activities of any kind to such companies for a definite period (not longer than one year) upon termination of his/her employment. Furthermore, such employee is barred from any action aimed to recruit employees of Magyar Telekom for any other company. This limitation entails certain compensation which is proportional with the above obligation. If the employee is in breach of the agreement, he/she will reimburse the net amount of compensation to the employer. In addition, the employee will be liable for a payment of compensation to the employer.
The MC members from foreign countries may be entitled to housing subsidies.
In line with the Company’s remuneration guidelines, the Company provides contribution-based personal pension scheme and personal insurance scheme on behalf of the MC members. In addition, the MC members are entitled to the use of company cars.
5 RESEARCH AND DEVELOPMENT
In 2016, the Research and Development activities at Magyar Telekom covered the maintenance of R&D grant project launched and won in the frame of a tender obligation of the National Research, Development and Innovation Office.
In 2016, in addition of the tender obligation, we have launched several products and services projects developments, which are based on the R&D activities of 2015, for example, Big Data related "Mobile Insight" data acquisition module. Besides that, certain functionalities have begun its real operation within the topic of smart watch R&D (for example: Smart Watch Mobile Payment application)
In 2016, we have launched new, smaller R&D projects, especially in the area of Big Data, IoT and TV/ Entertainment. These first results are expected at the beginning of 2017.
In addition to innovative domestic SMEs, the R&D tasks are performed by Magyar Telekom’s own research, product and service development staff. Besides the above, the Company exploits synergies resulting from its internal and external knowledge base, and takes efforts to establish partnerships with well-known innovation centers and institutions of university education. Our main partners are renowned Hungarian universities, research institutes such as Budapest University of Technology and Economics, Corvinus

72
University of Budapest, University of Szeged, University of Debrecen, and the Hungarian Academy of Sciences.
In the school year of 2016/17, in cooperation with Technical University of Berlin, data science and data technology department has been established at the Faculty of Informatics, Eötvös Loránd University. The department sponsored by Magyar Telekom's parent company, Deutsche Telekom's research and development division, the Berlin Telekom Innovation Laboratories (T-Labs in brief). In the frame of the cooperation, Magyar Telekom will support the department’s research and development activities. In 2016, we have launched R&D themes about Smart City and Fraud.
Beyond the above, Magyar Telekom deems it important to support knowledge transfer projects of R&D nature as well; thus it participates actively as a professional cooperating partner and in the EU knowledge transfer program EIT ICT Labs KIC the Company joined in 2012, they are working together in more international R&D tender initiatives.
6 REAL ESTATE, SITES OF OPERATION
We have one of the largest real estate holdings in Hungary. We use substantially all of these properties for telecommunications installations, offices, warehouses, garages and shops. Our equipment and machinery primarily consist of switches, communication towers and other telecommunications equipment. In order to increase the utilization of real estates and increase efficiency, we make efforts to sell our surplus properties.
6.1 The registered office of the Company:
1013 Budapest, Krisztina krt. 55.
6.2 Sites of the Company:
1117 Budapest, Magyar tudósok krt. 9. 1073 Budapest, Dob u. 76-78. 1051 Budapest, Petőfi Sándor u. 17-19. 1117 Budapest, Kaposvár u. 5-7. 1117 Budapest, Budafoki u. 103-107. 1107 Budapest, Száva u. 3-5. 1117 Budapest, Szerémi út 4. 1117 Budapest, Budafoki út 56. 1106 Budapest, Örs vezér tere 25. 1. em. 1138 Budapest, Váci út 178. 1195 Budapest, Üllői út 201. 1191 Budapest, Vak Bottyán u. 75. a-c. 1024 Budapest, Lövőház u. 2-6. 2. em. 1123 Budapest, Alkotás út 53. 1152 Budapest, Szentmihályi út 131. 1062 Budapest, Váci út 1-3. 1117 Budapest, Október huszonharmadika utca 8-10. 1119 Budapest, Fehérvári út 79. 1033 Budapest, Huszti út 32. 1082 Budapest, József utca 19-23. 1095 Budapest, Soroksári út 166/A. 1098 Budapest, Távíró utca 3-5. 1156 Budapest, Száraznád utca 1-3.
Out of the number of 1,723 buildings that take place on the 1,481 sites of Magyar Telekom Plc, 56% is owned by the company, 5 % is jointly owned and the rest 39% is leased. These figures do not contain the technology sites, from these type of sites we have 5936.

73
The total area of properties used by Magyar Telekom Plc. as of December 31, 2016 was 557 680 m2. The majority of sites used in our operations are smaller than 100 m2. The largest site is our headquarters building located at Krisztina krt. 55 in Budapest, with floor space of over 30,000 m2
7 SUSTAINABILITY
Magyar Telekom has been addressing the sustainability implications of its operations for close to twenty years, and in 2000, it was one of the first Hungarian companies to establish a sustainability unit that managed environmental issues in the beginning and coordinates sustainability processes now. Its sustainability activities are characterized by comprehensive, long-term plans, and the Company is currently implementing its fourth five-year sustainability strategy.
Being a leading ICT provider of the region, we set an example and provide opportunities by our forward-looking thinking, innovative, sustainable products and services and responsible conduct, we contribute to the establishment of a renewable society and environment.
Magyar Telekom committed to support the ten principles set forth by the UN Global Compact since 2009 in the areas of human rights, environment and anti-corruption, the results of which are also addressed by our Sustainability Reports.
Magyar Telekom’s sustainability activities and achievements are comprehensively discussed in the annual Sustainability Reports, which aims to make the Company’s environmental, social and economic activities transparent to everyone.
The present report includes reference only to certain key topics of our sustainability approach, namely human rights, employees, environment protection and compliance.
7.1 Sustainability strategy
Magyar Telekom’s fourth Sustainability Strategy, encompassing the 2016-2020 five-year period, has been compiled in harmony with the Company’s other strategies. Its main objective is to make sustainability an integral part of Magyar Telekom’s business.
The main directions of creating the new strategy have been influenced by not only the strategic achievements we have already made in the previous period, but also the expectations of responsible investors, EU directives, industrial and corporate trends, as well as local, i.e. Hungarian conditions and consumption patterns.
To achieve that aim, we defined three major areas of focus:
Climate protection
Our goal is to make our customers climate-conscious, too, and to be an authentic and responsible company that helps them along that journey. It is our ambitious objective to generate revenue from our climate protection activities, as the ICT world offers especially great potential for that, at the same time to push Magyar Telekom’s actual CO2 emission below 100,000 tons. In order to achieve the above, in addition to the emission decreasing initiatives, we also need to work on elaborating “green” services specifically.
Education
We want to assume a role in educating the public and our customers. Our goal is to directly or indirectly reach 100,000 people in Hungary with our trainings by the end of the period covered by the strategy. We shall primarily focus these trainings on two areas: programs aimed at eliminating the digital gap and the succession pool of the industry.

74
Digitally enabled sustainability
Being a sustainable digital company, it is our clear expectation that our customers should also use sustainable digital services. To
that end, we strive to pursue responsible marketing and activities that enable and inspire others, as well as are based on sharing. In
this context, our goal is that awareness about Magyar Telekom, as a sustainable company should reach 50%.Awards and
recognitions achieved in 2016:
CEERIUS sustainability index membership
Experience Leader Award
The Most Innovative Partner Of The Year: T-Systems Hungary
The survey conducted among the public in 2016 showed that 20.7% of the responders name Magyar Telekom and its offer brands as a company of a leading role in sustainability, while 63% cannot name any companies at all. The concept of sustainability is known by 30% among the public in 2016. 86% of our employees familiar with the concept of sustainability and 64% named Magyar Telekom as a sustainability leader.
7.2 Initiatives concerning stakeholders
In 2016 we organized the Sustainability Roundtable Discussion for the 17th time, the objective of which is to have an open dialogue with our stakeholders for the sake of understanding the demands towards Magyar Telekom, discussing the arising problems, and to provide a suitable background for thinking together and co-operating in building a sustainable future.
In 2008 our Company founded the DELFIN (the word for dolphin in Hungarian) award, which in Hungarian stands for “Award for a Committed, Sustainable, and Innovative Generation”. With the DELFIN award Magyar Telekom wants to promote the idea of a sustainable development and recognize efforts made towards this goal. The award is given to suppliers offering outstanding performance in the field of sustainability, in four categories:
Support of equal opportunity and promotion of non-discrimination inside and outside the Company; Innovation in the interest of sustainability; Sustainability education and awareness raising; Investment and development related to climate protection.
A jury of experts decides which submitted project should receive the award. The ninth award ceremony took place on June 10, 2016, as part of the Sustainability Roundtable. In 2016, we recognized organizations and businesses promoting sustainable, innovative solutions and sustainability education and awareness raising.
The ninth Sustainability Day event took place on September 24, 2016. The topic of the day was revolving around the chance of smart age. Record number, five thousand visitors attended the event where they participated in panel discussions on the three pillars of sustainability and examined pieces of works submitted to the creative design exhibition as well as exhibitors.
The event presented an opportunity to hand over the Sustainability Media Award for the sixth time by the members of the Sustainability Media Club - established by Magyar Telekom. Awards were distributed in three categories: “Bottom View” - for case studies describing NGO and local community matters, “Wide-angle view” - for the description of nationwide environmental and economic issues and “E-world” - for case studies describing digital education and digital literacy initiatives primarily focusing on children. The award amounted to HUF 500 000 for each category.
In 2016, we continued to sensitize our employees to social issues by organizing volunteer work events. Those interested could join our volunteer efforts as part of the Telekom Smart Digital programs, as well as other program like charitable teambuilding exercises. In 2016 was the first Telekom Volunteer Day, where 1000 employees and their relatives participated and planted 1000 plants. In 2016 1500 colleagues worked 11,412 hours of volunteer work, by means of which a theoretical amount of HUF 53.6 million was thus donated to the society.
In 2016 we continued the “hello holnap!” employee point collection. In the third year of the initiative 2,321 points were collected by 1,017 colleagues. The first three employees who collected the most points were given a Csepel bike voucher.
The children’s protection website of Magyar Telekom dedicated to threats caused by children’s media consumption. The website provides information to parents not only about ICT technologies, devices and content, but also about threats caused by their usage and consumption, as well as possible preventive measures. More details are available on: http://www.telekom.hu/about_us/society_and_environment/society/protection_of_our_children.

75
On November 1, 2013, Magyar Telekom introduced its tariff package called “hello holnap!”, which was designed to accommodate specific needs of handicapped people. Since 2014, the tariff package is also available for members of the Hungarian National Autistic Society. In 2016 we renewed the fleet package, by providing more services for lower price. New, that our subscriber can involve one family member or helper into the package.
We launched the “hello holnap!” mobile app on September 27, 2014, by which we drew attention to Telekom’s sustainability efforts in particular and sustainable lifestyles in general. By using the app, users can collect “hello holnap!” points and donate them, converted into real money by Telekom, to non-governmental organizations of their choice. The success of the mobile application in 2016 is best represented by the fact that it has more than 9,000 downloads and it is one of the most popular Telekom applications.
One pillar of atypical staffing is telework, which is one of the most important sustainability aspects of the Future Work project. Working from home in the framework of the project launched in July 2014 enabled the Company’s employees to save time and mileage. Thus, drivers can relieve the environment of as much as 1.8 million kilometers and ten years of travel.
In 2013 Magyar Telekom was among the first Hungarian companies that supported civilian organizations to cultivate community gardens in empty properties of the Company. In 2015 three community gardens started their operation. One of them, the 2600 square meter ”Kerthatár” garden in Soroksári street offers land for 100 gardens. It is one of the biggest of such facilities in Budapest. The initiative ran successfully in the three community garden in 2016 as well.
7.3 Annual Sustainability Report
Magyar Telekom has committed, among other things, to publish reports about its sustainability performance annually. When the reports are compiled the GRI (Global Reporting Initiative) guidelines are applied, thus ensuring compliance with the principle that the reports have to be the cornerstones ensuring transparency and international comparability. Since 2007 Magyar Telekom has prepared reports adhering to the highest level of compliance with international standards each year, thus the 2013 Sustainability Report was the seventh to meet the requirements of the GRI A+ application level. The 2014 and 2015 Sustainability Report was compiled along the new Fourth-Generation Principles set forth by the Global Reporting Initiative (GRI G4). It was applied on comprehensive level and includes more information about the Company’s sustainability performance. The independent assurance and certification of compliance with the GRI G4 criteria was conducted by PricewaterhouseCoopers along the ISAE 3000 international standard. Further details on the sustainability performance of the Company can be found in the annual reports available on: https://www.telekom.hu/about_us/society_and_environment/sustainability_reports
8 ENVIRONMENT PROTECTION
Magyar Telekom as one of the leading info-communication service provider in Hungary – in harmony with its mission – is committed to the idea of sustainable development and within it to the environmental issues. The Company, realizing its role and potential in the information society, contributes to the decrease of negative environmental impacts in Hungary by performing its activities in a regulated and controlled way, fulfilling the EU requirements and complying with international standards. Magyar Telekom's environmental commitment and responsibilities are published in Magyar Telekom’s Environmental Policy which contains obligations for the Company: https://www.telekom.hu/static-tr/sw/file/Magyar_Telekom_environmental_policy.pdf
Environment and climate protection performance
In 2016, Magyar Telekom procured 201 GWhs of electric power from renewing resources, which is 100% of the Company’s total electric power consumption.
In spring 2016, we relaunched again TeleBike, Magyar Telekom’s employee bike rental system. In 2016, TeleBike offered 53 regular bikes and six electric bikes, which were added to the fleet in 2014. Employees can commute between five sites, the offices of the Company located in Budapest and the sites of T-Systems Magyarország Zrt. In 2016, TeleBike had 1,561 registered users and 5,965 rents. During the year 10,200 kms were ridden and due the system 2 tons of CO2 emission was eliminated.
We introduced a bonus-malus system based on compliance with or deviation from average emission values of benefit cars. We spent 50% of the amount collected as malus payment by users of cars with emissions above the reference values on decreasing our CO2

76
footprint. One of our objectives for 2016 was that we still operate as a carbon neutral company. To this end we purchase electric power from power plants that use renewable energy sources and we entirely carbon-neutralized our fossil energy consumption footprint. With this we achieved that we are the one and only carbon neutral major enterprise in Hungary.
In 2016 Magyar Telekom continued its efforts to operate as an energy effective company. These days instead of solutions that would represent a huge leap forward, the aggregate of several smaller transformation and caring projects may jointly help us to further reduce energy consumption. Our proven ventilation technology has been upgraded this year. We implemented the so-called wardrobe type equipment thereby reduced the operation time of air-conditioners in order to save electric energy. Currently the main objective is to fine-tune the existing solutions. But new solutions are also implemented as a result of the global PSTN (Public Switched Telephone Network) replacement project. With this we take a huge step forward in the field of air conditioner replacement (reducing R22 gas consumption) and we implement lower performance power supply equipment as well. We have replaced our power supply equipment in several huge machine rooms; the improved efficiency rate resulted in millions of savings. A similar magnitude of savings is generated by the replacement of hundreds of smaller power supply units. We continued the merge of fixed line and mobile power supply operations at specific sites. Due to lower consumption we reduced our forecast electricity demand at our service provider. Smart cooling technology also develops quickly and it brings continuous results. This year we also replaced several boilers. The increase of the temperature of machine rooms is managed as a global project from containers to entire exchanges, regardless of their size. The use of temperature resistant accumulators and accumulator coating is a preparatory phase of the project. As a pilot project we equipped four buildings with LED lighting. We also take care of saving water: We installed perlators in various premises. The investment in this equipment may return within a period of six months. This represents almost 1 million HUF saving per year. For us, the decrease of energy consumption is a global project. We strive to reduce energy consumption directly or indirectly within the frame of every development. This will result in lower consumption figures in the long run.
9 CORPORATE COMPLIANCE
When shaping the compliance program of the Magyar Telekom, the goal was to ensure that the Magyar Telekom pursues its business activity with maximum awareness of and commitment to the compliance with the applicable laws and legal provisions, in accordance with the strictest norms of ethical business conduct. To this end, we issued decrees addressing the potentially arising compliance-related risks, and we apply the procedures set out in these decrees and arrange continuous training courses for our employees related to these procedures. We established clear concise processes to report, examine, follow up and correct suspected cases of non-compliance.
The Corporate compliance program is supervised by the Group compliance officer. The Group compliance officer reports directly to the Audit Committee, and cooperates with the Board of Directors, the Supervisory Board and the management. The Corporate compliance program focuses on the Code of Conduct.
Code of Conduct of the Magyar Telekom contains the summary of the compliance requirement within the company, sets common values of the Company and is a key to the strong position, reputation and successful future of Telekom. The Code of Conduct applies to everyone within the Magyar Telekom from the employees to the members of the Board. In addition, contracted partners of the Magyar Telekom also have to know and accept these values, when registering to the procurement website.
In the year 2010 an external independent party audited the implementation of the Compliance program, and we were awarded a certificate of compliance with the external expectations and of the implementation of the system. The program was revised in 2013, including other related areas as well – such as procurement, internal audit, HR, sales. The audit was not aimed only at the implementation and control of the system in the different areas, but it measured the operational efficiency of the control system. We met the expectations and were awarded by a certificate issued by Ernst&Young as independent external party.
The first distance learning course addressing compliance was started in 2008 in the topic of “Conscious recognition of fraud and corruption”. Since then we have been providing a general eLearning course for our new employees, mandatory for all colleagues joining to the company. The course is completed with the acceptance of the Code of Conduct. Since the start of the program, 65 581
distance learning courses were completed by the employees, related to topics, such as compliance awareness, supplier due diligence, anti-corruption measures, incompatibility or insider trading.
On the top of that, our company has arranged personal training sessions for employees working in professional areas exposed to compliance and abuse related risks – both within the parent company and Hungarian and international subsidiaries – in the topics of organized anti-corruption behavior, screening of contracted partners and rules of giving and accepting gifts.

77
In 2016 – similarly to the practice of the previous years – risk analyses were conducted with the participation of organizations and subsidiaries of Magyar Telekom Nyrt. Based on the results of the survey, a comprehensive audit was prepared for the potential compliance and abuse risks, the result of which was submitted to the Audit Committee of the Company.
During the year we check the soundness of the reports submitted to our company in connection with unethical behavior, and if necessary, we act on these reports. In case we identify actual abuses, we take care of the necessary and adequate countermeasures. Magyar Telekom published all cases of corruption and the related countermeasures in accordance with the related applicable laws and legal provisions.
10 ECONOMIC ENVIRONMENTS
The telecommunications industry is undergoing a major change globally. Worldwide trends are driving towards an integrated telecommunications, information, media and entertainment market. The increasing need for mobility and interactivity together with local specifics create a new set-up in our economic environment in terms of infrastructure, servicing and new types of business models. Traditional telco markets are shrinking on midterm. Market for voice services (both mobile and fixed) is saturated resulting in decreasing pricing and revenues. There is an increasing demand for data services driven by content consumption but strong competition puts pressure on prices. The fixed voice market as a major revenue and profit source is declining, mobile has started to follow this trend with stagnant customer base and lower prices. The fixed market is characterized by fixed-mobile integrated bundles, with broadband becoming a core element of service offerings. We expect continued consolidation in the fixed arena with network developments and growing competition. An increasing technology platform-based competition is fueled by the government’s Digital Hungary program. The extensive development program aims to cover every household in Hungary with high-speed internet (HSI > 30 Mbit/s) access until the end of 2018. The digitalization of technology, services and education are key pillars of the country’s competitiveness and the quality of life of its citizens.
Mobile market characterised by great quality and coverage from network perspective. Meanwhile the mobile voice market is characterized by increasing ratio of flat rate packages; the appearance of new market players is expected with strong impact on the market in mid-term. There is a fierce competition in broadband and content services and the battle for customer contracts has shifted from prices to quality in communication, especially focusing on network coverage and speed. The mobile broadband uptake still fuels the overall mobile market. However, the increasing regulation, in particular the abolishment of roaming fees and the decrease in mobile termination rates, is putting further pressure on market players.
The growing economic in recent years had a positive effect on the households’ budget. The growing budgets however are hard to translate into growing telco spending.
11 TARGETS AND STRATEGY
11.1 Outlook
The telecommunications industry is undergoing significant changes globally. We have observed several long-term trends which are changing the structure of the telecommunications market. These long-term trends include changes in technology (e.g., IP-based broadband products and solutions, and cloud based solutions), customer requirements (e.g., increase in mobile usability of content services and terminal devices, 4Play solutions and the growing need for mobile applications) and competition and regulation (e.g. low entry barriers, new business models, convergence in the telecommunications and media broadcast industry).
Magyar Telekom’s current plans and outlook are based on our best knowledge and expected circumstances. Nevertheless, we cannot predict the behavior of our competitors. Therefore, a stronger than assumed impact of other operators, new market entrants and new solutions in any country where we are present could result in a negative impact on our business performance.
Each of our business segments is affected by their own unique business environment, and we are subject to circumstances and events that are unforeseen or are beyond our control. The global economy recovered from the crisis but waiting for the impacts of Brexit and Trump effect. Our business environment is largely depends on the monetary policy of the FED, the growth of the Chinese and European economy and the movements of EU funds.

78
Magyar Telekom is facing several competitive and regulatory risks to growth in 2017: the expected entry of Digi into the mobile market; the ongoing obligation to register for prepaid services; and the prepaid and business mobile segments remaining very competitive. However, as an integrated operator, we believe that we are well positioned to address these challenges by maximizing the telecommunication share of wallet in household spending through further growth in our 4Play Magenta 1 subscriber base and leverage off our HSI network.
By the end of December 2016, more than 2.8 million households were covered by high speed internet, with penetration figures still on an upwards trajectory and the ratio of higher bandwidth package subscribers continuing to grow.
In addition, the SI/IT market is expected to grow further, underpinned by higher EU fund inflows; our intention is to increase our market share through a greater focus on high margin system integration projects.
11.2 Strategy
As a result of our focused strategic efforts, Magyar Telekom maintained its leading position in its Hungarian fixed voice, broadband, pay TV, mobile and ICT businesses in 2016, we successfully improved customer retention and delivered strong volume figures. We built a word class 4g mobile network and massively improved our fixed line HSI coverage in the past years
Based on our improved network capabilities we aim to provide services to all segment and customer on voice, TV broadband and IT markets The strategic objective in the mid-term is to become more agile, enhance efficiency, simplify the product and services portfolio, increase process automation and online customer servicing. As an integrated provider we continue to deliver a unique customer experience supported by our leading brand and best technology.
While anticipating new competencies required by the changing customer behavior, technological advances, and new business models, we aim to exploit our abilities to become a leader in all digital services around the home for both customers and third parties. We continue to identify and leverage new business opportunities in e-health, cloud, IoT, finance and insurance services, support customer retention and new revenue streams both in the residential and business segments. As a result of the changed market environment we decided to exit from the residential gas market. At the same time, we established a joint venture that provides energy services for business customers in order to improve and optimize our energy operations.
Following our strategy enables us to exploit and develop our extended customer base, improve efficiency and capture growth opportunities in an extended market of information and communications technology and related industries, which secures stable cash generation in the long run.
12 INTERNAL CONTROLS, RISKS AND UNCERTAINTIES
12.1 The presentation of the systems of internal controls and the evaluation of the activity in the relevant period
Magyar Telekom’s management is committed to establish and maintain an adequate internal control system to ensure the reliability of the financial reports, and minimize operating and compliance risks. Our internal control system is designed to provide reasonable assurance regarding the reliability of financial reporting and the preparation of financial statements for external purposes in conformity with International Financial Reporting Standards (IFRS) as adopted by the European Union. For the business year 2016 we fully accomplished control documentation and evaluation in the IT supported ICS i system. Transaction Level Controls describe the controls built into our business processes that have been designed and operated to ensure that material misstatements in each significant financial account and disclosure within the financial statements are prevented or detected in a timely manner. Complete evaluation of our internal control system is based on the method established in “Internal Control—Integrated Framework” issued by the Committee of Sponsoring Organizations of the Treadway Commission (COSO). The operation of the internal control system is supported also by the independent internal audit function. Beyond tasks regarding the risk based internal audit work plan, contributes to the enhancement of the internal control processes and to the reduction of existing risks through ad-hoc audits. The Internal Audit area follows up the implementation of the measures defined on the basis of the audits. The Supervisory Board and the Audit Committee receive regular reports on the findings of the audits; measures, based on the findings and fulfilment of tasks.

79
In line with the criteria of the adopted internal control framework, management evaluates the effectiveness of internal control system within each financial year. Management’s assessment for 2016 is still in progress, but based on the already available information, we believe that internal control system has been operating effectively to prevent potential material misstatements in the financial statements, and minimize operating and compliance risks. The Company’s shareholders are being informed about the operation of our internal control system through our public reports. The management and Board of Directors of Magyar Telekom are committed to conduct all business activities of Magyar Telekom according to the highest legal and ethical standards. Based on this commitment the Board of Directors established the Corporate compliance program of Magyar Telekom.
The Corporate compliance program is applicable to all bodies, organizations, employees of Magyar Telekom, and advisors, agents, representatives as well as to all persons and organizations that work on behalf of the Company or its subsidiary.
The Corporate compliance program of Magyar Telekom ensures that the business activities of the Company are conducted with observing and in compliance with the relevant laws to the outmost extent, according to the highest standards of training and commitment. It requires the realization of guidelines and processes that manage potential compliance risks and implement specific processes in order to report, investigate, monitor and correct suspected or actual lack of compliance.
i Internal Control System
12.2 The utilization of financial instruments, risk management and hedging policies
It is our policy that all disclosures made by us to our security holders and the investment community, are accurate and complete, and fairly present our financial condition and results of operations in all material respects. Such disclosures should be made on a timely basis as required by applicable laws, rules and regulations. To achieve these objectives we developed and have continuously enhanced our risk management policies.
Our risk management includes the identification, assessment and evaluation of risks, the development of necessary action plans, as well as the monitoring of performance and results. For the risk management to be effective, we must ensure that the management takes business decisions with full understanding of all relevant risks.
In 1999, we established a formal risk management system. This system has been operating in an integrated way with the risk management system of Deutsche Telekom since 2002.
All risks related to material internal and external operations, financial and legal compliance and certain other risks are evaluated and managed by a well-defined internal mechanism. A risk management handbook and an internal regulation on risk management were issued. A risk management course was developed for employees responsible for risk management in all organizational areas. Risk items affecting our operations are reviewed quarterly throughout the Company. All of our subsidiaries, business units, divisions and entities are obliged to identify and report their operational risks on a quarterly basis. After the evaluation of these risks, results are reported to our management, to the Board of Directors and to the Audit Committee.
For the sake of prompt disclosure of all risk items influencing investors’ decisions, we enhanced our risk management procedures by adding a new element. We complemented our quarterly risk reporting system with a continuous reporting procedure which requires all of our departments and the Company to report on a real-time basis any new material fact, information or risk that comes to their knowledge. Information thus submitted is monitored and evaluated by the risk management area and the CFO is notified when a new material risk or information is identified.
An internal regulation has been issued to define responsibilities of each employee in risk monitoring and management.

80
12.3 Risk factors
Our financial condition, results of operations or the trading prices of our shares could be materially adversely affected by any of the risks described below. These risks are not the only risks we face. Additional risks not currently known to us, or risks that we currently regard as immaterial, could also have a material adverse effect on our financial condition, results of operations or the trading prices of our shares.
Our operations are subject to substantial government regulations, further restrictions related to consumer protection were published; the change of the price setting methodology of already regulated wholesale products and new type of regulated access services are probable, which can result in adverse consequences for our business and results of operations;
Net neutrality regulation has no defined framework in Hungary yet. Case-by-case decisions of the Regulatory Authority may hinder innovation.
Mobile providers have to implement roaming fair use policy and cost control over their subscribers. These ’roam like at home’ regulation may be a base for fraud and a loss of revenues.
We are subject to more intense competition in the fixed business due to meeting our competitors on more and more area as a result of the network roll-outs
Beyond current market players in Hungary, DIGI also acquired 2x5 MHz spectrum block in the 1800 MHz band and 1x20 MHz spectrum block in the 3400-3600 MHz band, and will most probably enter the mobile market as a new player in the first half of 2017;
Prepaid registration obligation might negatively affect our business The future of our current operational model is subject to currently unforeseeable changes in the future business environment; Developments in the technology and telecommunications sectors may result in impairment of the carrying value of certain of our
assets; Our business may be adversely affected by actual or perceived health risks associated with mobile communications technologies; System failures could result in reduced user traffic and revenue and could harm our reputation; Loss of key personnel could weaken our business; Our share price may be volatile, and the ability to sell our shares may be adversely affected due to the relatively illiquid market for
our shares and ADSs; The value of our investments, results of operations and financial condition could be adversely affected by economic developments
in Hungary and other countries; Unpredictable changes in the Hungarian tax regulations may have an adverse effect on our results; Fluctuations in the currency exchange rate could have an adverse effect on our results of operations; Disputes and litigation with regulators, competitors and other parties could have an adverse effect on our results of operations. The number of cyber attacks have been evolving at an exponential rate recently worldwide. Although Magyar Telekom provides
services with highest security-standards and constantly tests and updates its cyber security countermeasures, it cannot be fully excluded that the Company will be subject of a cyber attack.
12.4 Financial risk factors
Magyar Telekom is primarily exposed to credit risks related to its financial assets. In addition, the Company is also exposed to risks from movements in exchange rates, interest rates that affect the fair value and/or the cash flows arising from financial assets and liabilities.
Financial risk management aims to limit these risks through ongoing operational and finance activities. Selected derivative and non-derivative hedging instruments are also used for this purpose, depending on the risk assessment. Magyar Telekom only hedges the risks that affect the Company’s cash flows, no hedges are concluded to hedge fair values. Derivatives are exclusively used as hedging instruments, i.e., not for trading or other speculative purposes. To reduce the counterparty risk, hedging transactions are generally only concluded with leading Hungarian or international financial institutions or Deutsche Telekom.
The detailed descriptions of risks, the management thereof as well as sensitivity analyses are provided below. These sensitivity analyses calculate with reasonably possible changes in the relevant risk variables and their impact on profit before tax. The impacts disclosed below for the reported periods are subject to an average effective income tax rate of approximately 25%, i.e. the impact on Profit for the year would be approximately 75% of the pre tax amount in a year that is free from significant one-off non-deductible pre-tax impacts and significant changes in the tax legislations. The potential impacts disclosed (less tax) would be the same on the Company’s Equity.
There were no major changes in these risks compared to the previous reporting period.

81
12.4.1 Market risk
Market risk is the risk that the fair value or future cash flows of a financial instrument will fluctuate because of changes in market prices. Market risk comprises three types of risk:
foreign currency risk interest rate risk price risk. The fundamentals of Magyar Telekom’s financing strategy are established each year by the Board of Directors. The Company’s policy is to borrow centrally using a balanced combination of medium term and short term loans, and fixed and floating interest rates on those loans. The Board of Directors has approved two debt protection ratio KPIs, and monitors their fulfillment annually. The Company’s Treasury is responsible for implementing the finance policy and for ongoing risk management. The details of foreign exchange, liquidity and counterparty risk management guidelines are determined and monitored by the Company’s Treasury continuously.
Magyar Telekom is exposed to interest and foreign exchange (FX) rate risk associated with its interest bearing assets and liabilities and anticipated transactions. As the vast majority of the revenues and expenses of the Hungarian entities arise in HUF, the functional currency of Magyar Telekom is HUF. Consequently, Magyar Telekom's objective is to minimize the level of its financial risk in HUF terms.
For the presentation of market risks, we also provided sensitivity analyses that show the effects of hypothetical changes of relevant risk variables on Profit before tax. These hypothetical changes were modeled to present a reasonably possible change in the relevant risk variables. The periodic effects are determined by relating the hypothetical changes in the risk variables to the balance of financial instruments at the end of the latest reporting period (2016) and the preceding reporting period (2015). The balances at the end of the reporting period are usually representative for the year as a whole; therefore the impacts are calculated using the year end balances. The methods and assumptions used in the sensitivity calculations did not change significantly compared to the previous period. As a result of the still rather volatile international capital and securities markets, higher fluctuations of the FX and interest rates are also possible.
Foreign currency risk
Foreign currency risk is the risk that the fair value or future cash flows of a financial instrument will fluctuate because of changes in FX rates. Currency risks primarily arise on financial instruments denominated in a currency that is not the functional currency of the Company. Relevant risk variables are generally all non-functional currencies in which Magyar Telekom has financial instruments.
In order to mitigate FX risk in case of FX denominated financial instruments, Magyar Telekom minimized its foreign currency borrowings in the past years, or covered them with derivative instruments to substantially reduce FX risk.
(a) FX risks arising on loans from DTIF and related swaps with DT AG
Several related party loans taken to finance general needs of the Company from the financing vehicle of Deutsche Telekom, Deutsche Telekom International Finance B.V. (DTIF) are denominated in EUR, while, at the same time, cross-currency interest rate swaps are concluded with Deutsche Telekom AG (DT AG) to fix the actual cash flows of Magyar Telekom in HUF for the whole nominal amount and interest payments of these loans. Even though the Company does not apply hedge accounting, the change in the HUF/EUR exchange rate has limited (net) impact on Profit before tax related to the hedged loans and the swaps together.

82
Sensitivity analysis
A reasonably possible strengthening or weakening of the EUR in the table below against HUF as at the end of the reporting period would have affected the measurement of financial instruments denominated in a foreign currency and increased (+)/ decreased (-) equity and profit or loss by the amounts shown below. This analysis assumes that all other variables, in particular interest rates, remain constant and ignores any impact of forecast sales and purchases. As the profit or loss effect would be the same as the equity effect, only the former is disclosed.
In HUF millions Profit or loss
Strengthening Weakening
At December 31, 2016
EUR/HUF (5% movement)
Loan ..................................................................................................................................................... (5,546) 5,546
Swap agreements .............................................................................................................................. 6,041 (6,041)
Net effect ............................................................................................................................................. 495 (495)
At December 31, 2015
EUR/HUF (5% movement)
Loan ..................................................................................................................................................... (3,218) 3,218
Swap agreements .............................................................................................................................. 3,543 (3,543)
Net effect ............................................................................................................................................. 325 (325)
(b) Other FX exposure
The remaining FX exposure of Magyar Telekom is mostly related to (i) holding foreign currency cash balances in its subsidiaries in the Southern and Eastern Europe region, and (ii) operating activities through revenues from, and payments to, international telecommunications operators as well as capital expenditure contracted with vendors in foreign currency. In line with currency hedging policy, the Company holds sufficient amounts of foreign currencies on its bank accounts, the amounts of which are determined considering the balance of short term FX denominated trade and leases payables and trade receivables in order to hedge the currency risk arising in connection with those assets and liabilities. The Company’s foreign currency denominated liabilities (other than the above described loans) exceed the Company’s foreign currency denominated assets, therefore changes of the functional currencies’ exchange rates would have the following impact on the profit of the Company.
In order to reduce the above exposure, Magyar Telekom occasionally enters into derivative contracts. The positive fair value of the open short term forward positions was HUF 0.1 billion as of December 31, 2016 (2015: HUF 0.1 billion asset). These positions were opened to hedge the FX risks of future FX payments exceeding FX income.

83
Sensitivity analysis
A reasonably possible strengthening or weakening of the currencies in the table below against HUF and MKD as at the end of the reporting period would have affected the measurement of financial instruments denominated in a foreign currency and increased (+)/ decreased (-) equity and profit or loss by the amounts shown below. This analysis assumes that all other variables, in particular interest rates, remain constant and ignores any impact of forecast sales and purchases. As the profit or loss effect would be the same as the equity effect, only the former is disclosed.
In HUF millions Profit or loss
Strengthening Weakening
At December 31, 2016
EUR/HUF (5% movement)
Net balance of FX denominated trade payables and trade receivables plus bank balances ...............................................................................................................................................
(655) 655
Forward agreements .......................................................................................................................... 467 (467)
Net effect ............................................................................................................................................. (188) 188
USD/HUF (10% movement)
Net balance of FX denominated trade payables and trade receivables plus bank balances ...............................................................................................................................................
(588) 588
Forward agreements .......................................................................................................................... 200 (200)
Net effect ............................................................................................................................................. (388) 388
EUR/MKD (10% movement)
Net balance of FX denominated trade payables and trade receivables plus bank balances ...............................................................................................................................................
(87) 87
Forward agreements .......................................................................................................................... 0 0
Net effect ............................................................................................................................................. (87) 87
USD/MKD (10% movement)
Net balance of FX denominated trade payables and trade receivables plus bank balances ...............................................................................................................................................
18 (18)
Forward agreements .......................................................................................................................... 0 0
Net effect ............................................................................................................................................. 18 (18)

84
In HUF millions Profit or loss
Strengthening Weakening
At December 31, 2015
EUR/HUF (5% movement)
Net balance of FX denominated trade payables and trade receivables plus bank ................... (1,056) 1,056
Forward agreements .......................................................................................................................... 1,897 (1,897)
Net effect ............................................................................................................................................. 841 (841)
USD/HUF (10% movement)
Net balance of FX denominated trade payables and trade receivables plus bank ................... (931) 931
Forward agreements .......................................................................................................................... 63 (63)
Net effect ............................................................................................................................................. (868) 868
EUR/MKD (10% movement)
Net balance of FX denominated trade payables and trade receivables plus bank ................... (210) 210
Forward agreements .......................................................................................................................... 0 0
Net effect ............................................................................................................................................. (210) 210
USD/MKD (10% movement)
Net balance of FX denominated trade payables and trade receivables plus bank ................... 22 (22)
Forward agreements .......................................................................................................................... 0 0
Net effect ............................................................................................................................................. 22 (22)
As a result of the volatile international capital and securities markets, even a more than 5% fluctuation of the functional currency HUF against EUR, a more than 10% fluctuation of the functional currency HUF against USD and a more than 10% fluctuation of the functional currency MKD against the EUR and USD is possible as extraordinary market conditions may cause extreme volatility on FX markets.
Interest rate risk
Magyar Telekom is also exposed to interest rate fluctuations. This is due to the fact that changing interest rates affect the fair value of the fixed rate instruments and also affect the cash flows through the floating rate instruments.
Changes in the market interest rates of non-derivative financial instruments with fixed interest rates only affect income if these are measured at their fair value. On the other hand, all financial instruments with fixed interest rates (which are carried at amortized cost) are not subject to cash flow interest rate risk.
Changes in the market interest rate of interest rate derivatives (interest rate swaps, cross-currency swaps) that are not part of a hedging relationship as set out in IAS 39 affect Other finance expense - net (net gain/loss from re-measurement of the financial assets to fair value).
Changes in market interest rates affect the interest income or expense of non-derivative floating-interest financial instruments for which no cash flow hedges are in place.
(a) Financial assets
Excess cash of the Company is primarily used to repay loans. Due to the extremely low interest rates, even a reasonably possible change in the interest rates would not have a significant impact on the Company’s interest income.
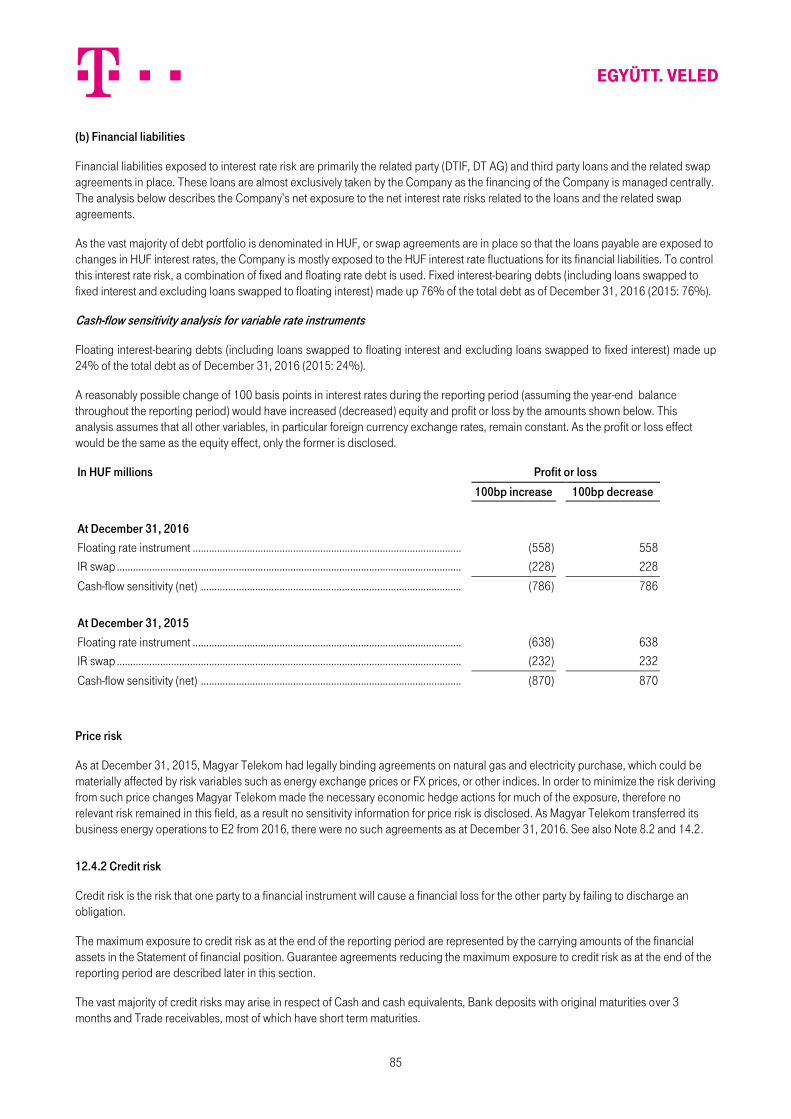
85
(b) Financial liabilities
Financial liabilities exposed to interest rate risk are primarily the related party (DTIF, DT AG) and third party loans and the related swap agreements in place. These loans are almost exclusively taken by the Company as the financing of the Company is managed centrally. The analysis below describes the Company’s net exposure to the net interest rate risks related to the loans and the related swap agreements.
As the vast majority of debt portfolio is denominated in HUF, or swap agreements are in place so that the loans payable are exposed to changes in HUF interest rates, the Company is mostly exposed to the HUF interest rate fluctuations for its financial liabilities. To control this interest rate risk, a combination of fixed and floating rate debt is used. Fixed interest-bearing debts (including loans swapped to fixed interest and excluding loans swapped to floating interest) made up 76% of the total debt as of December 31, 2016 (2015: 76%).
Cash-flow sensitivity analysis for variable rate instruments
Floating interest-bearing debts (including loans swapped to floating interest and excluding loans swapped to fixed interest) made up 24% of the total debt as of December 31, 2016 (2015: 24%).
A reasonably possible change of 100 basis points in interest rates during the reporting period (assuming the year-end balance throughout the reporting period) would have increased (decreased) equity and profit or loss by the amounts shown below. This analysis assumes that all other variables, in particular foreign currency exchange rates, remain constant. As the profit or loss effect would be the same as the equity effect, only the former is disclosed.
In HUF millions Profit or loss
100bp increase 100bp decrease
At December 31, 2016
Floating rate instrument ..................................................................................................................... (558) 558
IR swap ................................................................................................................................................. (228) 228
Cash-flow sensitivity (net) .................................................................................................................. (786) 786
At December 31, 2015
Floating rate instrument ..................................................................................................................... (638) 638
IR swap ................................................................................................................................................. (232) 232
Cash-flow sensitivity (net) .................................................................................................................. (870) 870
Price risk
As at December 31, 2015, Magyar Telekom had legally binding agreements on natural gas and electricity purchase, which could be materially affected by risk variables such as energy exchange prices or FX prices, or other indices. In order to minimize the risk deriving from such price changes Magyar Telekom made the necessary economic hedge actions for much of the exposure, therefore no relevant risk remained in this field, as a result no sensitivity information for price risk is disclosed. As Magyar Telekom transferred its business energy operations to E2 from 2016, there were no such agreements as at December 31, 2016. See also Note 8.2 and 14.2.
12.4.2 Credit risk
Credit risk is the risk that one party to a financial instrument will cause a financial loss for the other party by failing to discharge an obligation.
The maximum exposure to credit risk as at the end of the reporting period are represented by the carrying amounts of the financial assets in the Statement of financial position. Guarantee agreements reducing the maximum exposure to credit risk as at the end of the reporting period are described later in this section.
The vast majority of credit risks may arise in respect of Cash and cash equivalents, Bank deposits with original maturities over 3 months and Trade receivables, most of which have short term maturities.

86
In line with the Company’s risk management policy Magyar Telekom deposits the vast majority of excess cash in banks rated at least BBB+ (or equivalent), or make efforts to get guarantees for these fixed term deposits from banks rated at least BBB+. We, however, also have current accounts in banks with lower rating than this. Moreover, Magyar Telekom prefers to deposit in banks which grants loans to Magyar Telekom to make the compensation of debts and loans possible in case of the default of the bank.
In case of Cash and cash equivalents and Bank deposits with maturities over 3 months held in Hungary concentrations of credit risk are limited as Magyar Telekom places its cash in Hungary with substantial credit institutions. Further, excess HUF cash is also used for repayment of the HUF denominated loans and borrowings, or is deposited at partner banks which grant loans to Magyar Telekom, therefore, the credit risk related to cash held in HUF is very limited.
Concentrations of credit risk relating to trade receivables are limited due to the large number of customers comprising the Company's customer base and their dispersion across many different geographic areas and industries.
No financial assets other than trade and other receivables had to be impaired in the reported years, as they are neither past due nor are there any signs of impairment.
There are varying credit checking practices applied across the Company as described below.
Credit checking at the time of the service request is carried out automatically by the credit checking application. A variety of checks including checking the bankruptcy list, the internal database of risky installation locations, the collection history of the past 6 months, the outstanding debt and the joint database of debtors of the Hungarian mobile operators are performed depending on the service to be used. The Fraud Detecting System monitors extreme usage and fraudulent behavior of customers for mobile, fixed-line and Internet services. In case of business customers, account managers check if the customer has outstanding debts.
Dunning procedures are run automatically by the billing systems and include various reminder tools like SMS, reminder message via Telekom APP, telephone calls, reminder letters, reminder emails, restricted service, termination letters and disconnections. In case of medium and large enterprises dunning process starts manually (first reminder letter). After the first step, this process is also automated. Based on the effective laws and regulations and over a minimum overdue amount we apply varying and customized reminder procedures with specific deadlines to the different customer groups. After the termination of the contract and depending on the expected success of the process, we combine the different collection steps of involving external partners, selling the outstanding debt or initiating legal proceedings. All parts of the process are regulated by internal directives.
12.4.3 Liquidity risk
Liquidity risk is the risk that an entity may encounter difficulty in meeting obligations associated with financial liabilities.
Prudent liquidity risk management implies maintaining sufficient Cash and cash equivalents and Bank deposits as well as available funding through adequate amount of committed credit lines. The Company’s Treasury management aims at maintaining flexibility in funding by keeping committed credit lines available. The undrawn credit lines amounted to HUF 29.7 billion as at December 31, 2016 (2015: HUF 29.0 billion), and the Company also had uncommitted credit lines from Hungarian Banks as at December 31, 2016 and 2015. In addition to the above, Deutsche Telekom confirmed its readiness to finance Magyar Telekom’s budgeted financing needs until the end of June 2018.
The following two tables summarize the maturity structure of Magyar Telekom’s financial liabilities including the interest payable on those liabilities as of December 31, 2016 and 2015. As the majority of the financial liabilities are paid from the cash generated from the ongoing operations, the maturity analysis of the financial assets as at the end of the reporting periods (in comparison with the financial liabilities) would not be useful, therefore, is not included in the tables below.

87
December 31, 2016 (in HUF millions)
Total within 1 year
1 to 5 years after 5 years
Trade payables ................................................................................................... 136,623 136,623 - -
Financial liabilities to related parties ................................................................ 348,842 77,082 271,760 -
Bank loans ........................................................................................................ 11,534 11,534 - -
Finance lease liabilities ................................................................................... 12,429 3,461 4,984 3,984
Other financial liabilities .................................................................................. 55,175 8,755 15,095 31,325
Total other financial liabilities ........................................................................... 79,138 23,750 20,079 35,309
Total cash flows 564,603 237,455 291,839 35,309
Open swap positions’ cash flows
Gross cash inflow in EUR million ..................................................................... 389 36 353 -
Gross cash inflow in HUF million (at spot rate) .............................................. 120,987 11,197 109,790 -
Gross cash outflow in HUF million ................................................................... (124,137) (10,655) (113,482) -
Net cash inflow in HUF million (3,150) 542 (3,692) -
Open forward positions’ cash flows
Gross cash inflow in EUR million ..................................................................... 30 30 - -
Gross cash inflow in USD million ..................................................................... 7 7 - -
Total gross cash inflow in HUF million (at spot rate) ...................................... 11,386 11,386 - -
Gross cash outflow in HUF million ................................................................... (11,230) (11,230) - -
Net cash inflow in HUF million .......................................................................... 156 156 - -

88
December 31, 2015 (in HUF millions)
Total within 1 year 1 to 5 years after 5 years
Trade payables ................................................................................................... 140,182 140,182 - -
Financial liabilities to related parties ................................................................ 392,649 145,087 205,427 42,135
Bank loans ........................................................................................................ 13,278 13,278 - -
Finance lease liabilities ................................................................................... 15,277 4,953 6,057 4,267
Other financial liabilities .................................................................................. 59,559 9,412 34,706 15,441
Total other financial liabilities ........................................................................... 88,114 27,643 40,763 19,708
Total cash flows 620,945 312,912 246,190 61,843
Open swap positions’ cash flows
Gross cash inflow in EUR million ..................................................................... 234 10 90 133
Gross cash inflow in HUF million (at spot rate) .............................................. 73,164 3,243 28,297 41,624
Gross cash outflow in HUF million ................................................................... (72,833) (2,914) (27,438) (42,481)
Net cash inflow in HUF million 330 329 859 (857)
Open forward positions’ cash flows
Gross cash inflow in EUR million ..................................................................... 121 121 - -
Gross cash inflow in USD million ..................................................................... 2 2 - -
Total gross cash inflow in HUF million (at spot rate) ...................................... 38,553 38,553 - -
Gross cash outflow in HUF million ................................................................... (38,607) (38,607) - -
Net cash inflow in HUF million .......................................................................... (55) (55) - -
The average maturity of Magyar Telekom’s debt portfolio was 2.64 years as at December 31, 2016 (2015: 2.46 years). The floating interest payments arising from the financial instruments were calculated using the last interest rates fixed before December 31, 2016 and 2015.
12.3.4 Capital risk management
The Company’s objectives when managing capital are to safeguard the Company’s ability to continue as a going concern in order to provide returns for shareholders and benefits for other stakeholders and to maintain an optimum capital structure to reduce the cost of capital.
The Company’s management proposes to the owners (through the Board) of the Company to approve dividend payments or adopt other changes in the Company’s equity capital in order to optimize the capital structure of the Company. This can be achieved primarily by adjusting the amount of dividends paid to shareholders, or alternatively, by returning capital to shareholders by capital reductions, selling or buying own shares. Consistent with others in the industry, the Company monitors capital on the basis of the gearing ratio.

89
This ratio is calculated as Net debt divided by Equity (including Non-controlling interest) and Net debt. Net debt is calculated as follows:
Current and non current financial liabilities to related parties plus Other current and non current financial liabilities less Cash and cash equivalents less Other current financial assets During 2015 and 2016, the Company’s mid and long term target as approved by the Board was to maintain a gearing ratio within 30% to 40%. The gearing ratio at December 31, 2016 was 39.3% (2015: 42.9%). The Company paid HUF 15 dividend per share in 2016, and as a result of the improving trend, the Company’s Board recommends to declare a HUF 25 dividend per share at the April 2017 Annual General Meeting.
In addition to the above, according to the Hungarian Civil Code, Magyar Telekom Plc. has to ensure that the Company’s Equity under local GAAP does not fall below its Common stock, i.e. the total of the reserves should not be negative. The Company is in compliance with this regulation.
13 ANALYSIS OF FINANCIAL RESULTS FOR 2016
13.1 Revenues
13.1.1 Net sales revenues
Net sales revenues decreased from HUF 502,275 million in 2015 to HUF 468,255 million in 2016.
Net export sales increased within net sales revenues by 40.7%, HUF 5,772 million mainly due to the increase of international mobile handset sales. Net domestic sales decreased by HUF 39,792 million (8.2% decrease) within net sales revenues. The nominal net decrease is due to several positive and negative effects. The largest decrease occurred in energy revenues from HUF 50,924 million to HUF 6,891 million (86.5% decrease) caused by the whole business of energy trading activity transferred to E2 Hungary Kft. The mobile non-voice revenues changed from HUF 76,819 million to HUF 82,410 million, resulting in a 7.3% increase, which is mainly due to the higher revenues from Internet services owing to the increasing number of mobile broadband subscribers and the increase of the average revenue per subscriber. TV services revenues increased from HUF 34,500 million to HUF 36,364 million (5.4% increase) which is caused mainly by the higher number of IP TV subscribers.
The mobil wholesale voice revenues decreased from HUF 8,816 million to HUF 5,445 million, resulting in a 38.2% decrease, which is mainly due to the reduction of roaming revenues. Fixed line voice-retail revenues decreased to HUF 45,305 million in 2016 compared to HUF 48,964 million in 2015 (7.5% decrease), mainly driven by the lower volume of traffic and the decline in the customer base. Mobile equipment sales revenues increased from HUF 37,064 million to HUF 40,168 million, which is mainly due to exports to third parties.
Fixed line equipment sales revenues decreased from HUF 6,783 million to HUF 5,376 million, which is due to the declining retail TV, tablet and laptop sales.

90
13.1.2 Other income
Other income increased from HUF 23,250 million to HUF 30,833 million (32.6% increase) which is due to the growing real estate sales revenue.
13.2 Operating expenses
Operating expenses (including material-type expenses, employee related expenses, depreciation and amortization and other expenses) decreased from HUF 523,530 million in 2015 to HUF 475,299 million in 2016 (9.2% decrease). Material-type expenses decreased from HUF 286,178 million in 2015 to HUF 240,960 million in 2016 (decrease of 15.8%) which is caused by the decrease of cost of goods sold and costs of mediated services sold. Cost of goods sold decreased by 26.7%, from HUF 100,240 million to HUF 73,481 million. The significant decrease is due to that the complete energy trade for business customers has been transferred to E2 Hungary Kft. (a joint venture company of Magyar Telekom Plc. and MET Holding AG) from January 1, 2016. Costs of raw material decreased from HUF 27,406 million to HUF 14,245 million (48 % decrease). The decrease is due to the change in costs of raw material to be capitalized. Employee related expenses decreased from HUF 67,184 million to HUF 63,850 million, however the depreciation and amortization is increased from HUF 91,125 million to HUF 97,591 million. Other expenses decreased from HUF 79,043 million in 2015 to HUF 72,898 million in 2016. The decrease is due to the negative effect of receivables forgiven, impairment of inventories and extraordinary depreciation of intangible and tangible assets. 13.3 Financial result
The negative result from financial transactions decreased from HUF 7,390 million in 2015 to HUF 5,331 million in 2016 which is caused by more contrary effects. The result is increased due to the higher dividends received (from HUF 5,495 million to HUF 14,871 million), less interest expense (from HUF 19,820 million to HUF 15,395 million) and the decrease of foreign exchange loss (from HUF 6,646 million to HUF 3,482 million) which only partly be influenced unfavourably the decrease of realized foreign exchange gain (from HUF 11,595 million to HUF 2,556 million) and the impairment of investment in GTS Hungary Kft. (HUF 4,490 million).

91
14 SUBSEQUENT EVENTS BETWEEN THE END OF THE YEAR AND THE RELEASE OF THE REPORT
14.1 Sale of Crnogorski Telekom A.D.
In January 2017, the Company signed a share purchase agreement with Hrvatski Telekom d.d. for the sale of the total of its 76.53% shareholding in Crnogorski Telekom A.D. for a total consideration of EUR 123.5 million (approximately HUF 38.1 billion).The closing of the transaction also took place in January 2017.
Budapest, February 22, 2017.

92
Declaration
We the undersigned declare that the attached annual financial statements which have been prepared in accordance with the applicable set of accounting
standards and to the best of our knowledge, gives a true and fair view of the assets, liabilities, financial position and profit or loss of Magyar Telekom Plc. and
the business report gives a fair view of the position, development and performance of Magyar Telekom Plc., together with a description of the principal risks and uncertainties of its business.