maharashtra electricity regulatory...
TRANSCRIPT
MAHARASHTRA ELECTRICITY REGULATORY COMMISSION
DETAILED NOTE: FINDINGS & RECOMMENDATIONS ON VIABILITY OF MPECS, ETC.
(ACCOMPANYING MERC LETTER NO. MERC/118 OF 2003-04/0158 DATED 27.01.2004 ADDRESSED TO GOM)
A1: BACKGROUND
1.1 The Mula Pravara Electric Co-operative Society Limited, Shrirampur (MPECS) was established on October 2, 1969, as one of the 5 pilot Co-operative societies established in India through REC, as per the decision of Government of India and based on sponsorship from USAID in collaboration with NRECA, USA.
1.2 MPECS was provided with a 20-year license to distribute electricity in 183 villages spread over 5 Talukas in Ahmednagar District by Government of Maharashtra (GoM) on January 28, 1971.
1.3 As on March 31, 2002, MPECS supplies electricity to 1.37 lakh consumers having sanctioned load of around 207 MW by purchasing power from Maharashtra State Electricity Board (MSEB) at 11kV interface points.
1.4 On May 21, 1999, GoM extended the license of MPECS by 20 years w.e.f. Feb 1, 1991, and spelt out the methodology by which a “Viable Tariff” shall be calculated every year from FY 77-78 for the power purchased from MSEB under GR dated May 21, 1999. In the note accompanying their letter dated January 6, 2003 to the Commission, GoM have stated that "this formula, however, ceased to operate after coming into being of MERC (Maharashtra Electricity Regulatory Commission), which approved a bulk rate for sale of electricity by MSEB to the Society which was higher than the 'viable tariff', giving rise to a fresh problem of arrears."
1.5 Total power purchase overdues of MPECS to MSEB as on March 31, ‘03, including arrears, is estimated to be around Rs 381.27 Crores.
1.6 GoM, vide Order dated March 26, ‘03 have committed around Rs 116 crores as subsidy to MPECS, payable directly to MSEB in 3 annual instalments, leaving arrears of around Rs 265 Crores unsettled.
1.7 On April 30, 2003, the High Court, Nagpur Bench, in the matter of writ petition: 3399/2000 filed by Grahak Panchayat, Nagpur Vs GoM & Others, directed GoM to consider one of the following 3 options in respect of MPECS:
(a) Option 1: To revoke the license and take over MPECS and hand it over to MSEB.
(b) Option 2: To initiate liquidation proceedings in accordance with the Maharashtra Co-operative Societies Act.
(c) Option 3: To appoint MERC to examine as to whether MPECS should be allowed to continue or should be wound up, and advise GoM accordingly.
1.8 Under letter No. RPT-2001/CR-1080/NRG-1 dated June 6, 2003, GoM requested MERC under Section 22(2)(p) of the Electricity Regulatory Commissions (ERC) Act, 1998 to examine as to whether and under what conditions MPECS should be allowed to continue its operation, and to make recommendations to GoM in the matter. In the note (pages 5 and 6) accompanying this letter, GoM have elaborated further on the issues involved and on which the findings, advice and recommendation of MERC was sought. Essentially, these concern the following:
(a) To assess if MPECS’ operations are at least as efficient as comparable distribution areas of MSEB in terms of T&D losses, Collection efficiency, administrative & other costs, level of service in terms of parameters such as transformer failure, response time in fuse calls, time taken to grant new connections, etc.
(b) Preparation of a time bound programme listing out specific milestones to be reached and made conditional for the continuation of its distribution license as well as for support from GoM and MSEB.
(c) The parameters and formula for a viable bulk rate for purchase of electricity by the MPECS from MSEB, whether such a bulk rate is desirable and justifiable and if not, the subsidy which would be required to sustain MPECS.
1.9 The following sections comprise the detailed findings and recommendations of MERC to GoM.
A2: LEGAL FRAMEWORK GOVERNING DISTRIBUTION LICENSEES AND RURAL ELECTRIC CO-OP SOCIETIES
2.1 Electricity distribution is governed by the provisions of the Electricity Act, 2003 (the Act), which came into force on June 10, 2003. (Although GoM's reference dated June 6, 2003 was made under Section 22(2)(p) of the erstwhile ERC Act, Section 86(2) of the new Act also contains a provision for advice to GoM). Key provisions of the Act, which are particularly relevant to the context of GoM's reference, are summarized below.
Rural Electrification
2.2 Under Section 5 of the Act, Govt. of India (GoI) are to formulate a National Policy, in consultation with the State Governments and the State Commissions, for rural electrification and for bulk power purchase and local distribution management in rural areas through Panchayat Institutions, users’ associations, co-operative societies, NGOs or franchisees.
2.3 In order to improve self-sufficiency and long term sustainability of rural supply at cheaper costs, etc., Section 4 of the Act envisages a National Policy permitting establishment of stand alone systems (including those based on renewable and other non-conventional sources of energy) for rural areas.
2.4 In order to expand the coverage of rural electrification and supply at a faster pace, the 8th proviso to Section 14 of the Act exempts from the requirement of a license persons intending to generate and distribute electricity in rural areas notified by GoM. Similarly, MERC is provided with powers under Section 13 of the Act to exempt any local authority, Panchayat Institution, users’ association, co-operative societies, NGOs or franchisees from licensing requirements, in public interest and on recommendations of GoM in accordance with the National Policy formulated under Section 5. Moreover, under the 7th proviso to Section 14, licensees can undertake distribution through other persons, who do not require a license.
2.5 Thus, the law encourages rural electrification and supply management through co-operative societies, user associations and local bodies in order to achieve the socio-economic objectives of the state.
Tariff Fixation & Differentiation
2.6 Section 61 of the Act requires MERC to specify terms and conditions for the determination of tariff, guided, inter alia, by the following (subject to a transitional proviso):
(a) Tariffs should progressively reflect cost of supply and should reduce and eliminate cross subsidies within the period to be specified by MERC
(b) The generation, transmission, distribution and supply of electricity are conducted on commercial principles
(c) The factors which would encourage competition, efficiency and economical use of resources, good performance and optimum investments and the principles rewarding performance efficiency
(d) Safeguarding consumers’ interests and cost recovery in reasonable manner
(e) Promotion of Co-generation and renewable sources of energy
(f) National Electricity Policy and Tariff Policy
2.7 Sec 62(3) allows MERC to differentiate tariffs to consumers according to the consumer’s load factor, power factor, voltage, total consumption, the time at which electricity is supplied or the geographical position of any area, nature of supply and the purpose for which the supply is required. Thus, MERC can differentiate retail tariffs between consumers of MPECS and MSEB, inter alia on the basis of the above factors and cost of supply.
Supply Regulation & Metering
2.8 Section 23 empowers MERC to regulate the distribution and supply of electricity to consumers in order to maintain efficient supply, equitable distribution and promote competition. Thus, on the basis of a regulation on hours of supply to unmetered consumers, the permissible Annual Revenue Requirement (ARR) of the licensee and tariffs to be charged to unmetered consumers can be determined.
2.9 Sec 55 requires licensees to supply electricity only to metered consumers within 2 years from June 10, 2003 or such extended period as notified by MERC. The MERC Tariff Order dated May 5, 2000 in respect of MSEB requires all new connections by MSEB in the State to be released with meters only.
Government Subsidy
2.10 Under Section 65, if GoM requires the grant of subsidy to any consumer or class of consumers in the tariff determined by the MERC, GoM shall pay in advance the amount to compensate the licensee affected by the grant of subsidy. No directions of GoM shall be operative if the subsidy is not so paid, while the tariff fixed by MERC would be applicable from the date of issue of MERC Orders.
Cross Subsidy
2.11 In the matter of levying cross subsidy surcharge to consumers on introduction of open access, the 2nd proviso to Section 42(2) states that “such surcharge shall be utilised to meet the requirements of current level of cross subsidy within the area of supply of the distribution licensee”. Given that the cross subsidy surcharge computations will consider only the current level of cross-subsidy within the area of supply of the distribution licensee, the Act envisages that the cross subsidy available for a distribution licensee (e.g. MSEB) shall be utilised to meet the subsidy requirements of the subsidised consumer categories and shall not be utilised to subsidize tariffs for another licensee (e.g. MPECS).
Revocation of License
2.12 Sections 19(1) and (2) provide for revocation of licence by MERC in various circumstances and if it is satisfied that the public interest so requires. Where such revocation is without the licensee's consent, Section 19 (3) requires MERC to provide 3 months’ notice before such revocation, and state the reasons. Section 19(4) provides for MERC to allow the license to remain in force subject to such terms and conditions as may be imposed.
2.13 To summarize, the Act encourages rural electrification and supply through various alternative structures including co-operative societies like MPECS, MERC has powers to fix tariffs progressively reflecting cost of supply, to reduce and eliminate cross subsidies, differentiate tariffs, stipulate supply regulation to certain categories of consumers, utilise cross subsidies within the licensee’s area of supply, while Government has to provide subsidy support to licensees to the extent of difference between the cost of supply/tariffs fixed by the Commission and the subsidized tariffs charged by the licensees based on Government directions.
A3: TARIFF FIXATION & SUBSIDY PAYMENTS FOR DISTRIBUTION
LICENSEES & ELECTRICITY CO-OPS: EXPERIENCE FROM OTHER STATES
3.1 This section summarizes the basis and methods adopted by different Electricity Regulatory Commissions in fixing the tariffs for RESCOs and distribution licensees, which may be of some relevance. (It may be noted that some of the Commissions were guided in tariff fixation by the provisions of the separate enactments in their own States.)
Andhra Pradesh
3.2 There were 9 RESCOs in AP, of which 5 RESCOs were wound up recently due to high level of inefficiencies and poor quality of supply, while 4 RESCOs are allowed to operate.
3.3 APERC fixes the tariffs to all consumer categories of AP Distribution Companies and RESCOs (treated as HT category VII for tariff fixation) on the basis of Fully Allocated Cost of supply (FAC) to these consumers. APERC fixes the tariff for each category after subjecting the FAC of each subsidized category to the cross-subsidy available from subsidizing categories.
However, such allocation of cross-subsidy to RESCOs (being licensees) may not be possible after the introduction of the Electricity Act, as explained at para 3.11.
3.4 GoAP directs the licensees, under Section 12 (3) of AP Reform Act, to charge subsidised tariffs to Domestic, Agricultural consumers, RESCOs and a few other consumer categories, while committing upon the payment of difference between the tariff fixed by APERC (based on FAC) and the subsidised tariff fixed by GoAP as subsidy to the affected licensees.
3.5 GoAP annual subsidy is paid in equal monthly instalments to the licensees, failing which APERC directs the licensees to charge the tariff to its consumers as fixed by APERC.
3.6 RESCOs’ tariffs ('viable tariffs') are fixed based on the residual cash available for payment towards power purchase after meeting the O&M costs of the RESCOs at the efficiency levels stipulated by APERC and with explicit subsidy commitment from GoAP. Thus, the difference between the FAC of power purchased by RESCO and the viable tariffs is met by cross subsidy available from subsidizing categories of AP DISCOMs and GoAP subsidy, as shown in Table 1.
3.7 In case of RESCOs purchasing power from APTRANSCO/DISCOMs in excess of the power purchase units determined by APERC in any financial year, RESCOs will be charged for the excess power purchased at the Bulk Supply Tariff rates charged by APTRANSCO to the DISCOMs without any GoAP subsidy.
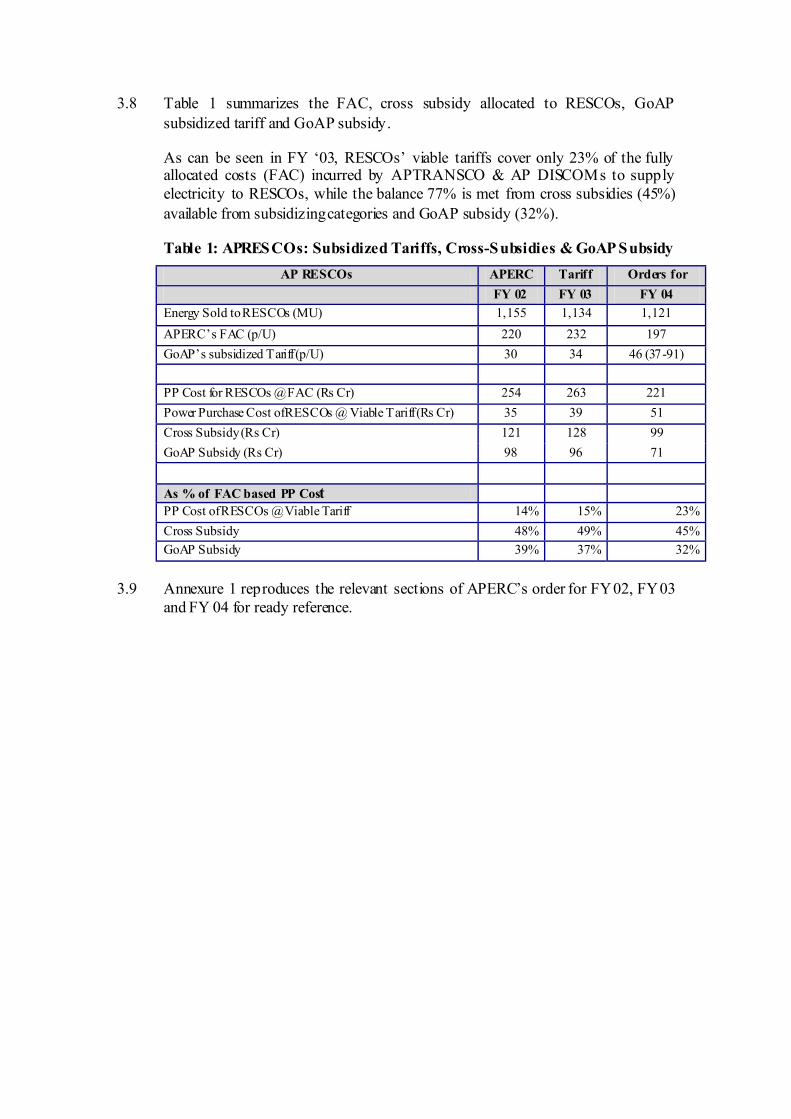
3.8 Table 1 summarizes the FAC, cross subsidy allocated to RESCOs, GoAP subsidized tariff and GoAP subsidy.
As can be seen in FY ‘03, RESCOs’ viable tariffs cover only 23% of the fully allocated costs (FAC) incurred by APTRANSCO & AP DISCOMs to supply electricity to RESCOs, while the balance 77% is met from cross subsidies (45%) available from subsidizing categories and GoAP subsidy (32%).
Table 1: APRESCOs: Subsidized Tariffs, Cross-Subsidies & GoAP Subsidy AP RESCOs APERC Tariff Orders for
FY 02 FY 03 FY 04 Energy Sold to RESCOs (MU) 1,155 1,134 1,121 APERC’s FAC (p/U) 220 232 197 GoAP’s subsidized Tariff (p/U) 30 34 46 (37-91) PP Cost for RESCOs @ FAC (Rs Cr) 254 263 221 Power Purchase Cost of RESCOs @ Viable Tariff (Rs Cr) 35 39 51 Cross Subsidy (Rs Cr) 121 128 99 GoAP Subsidy (Rs Cr) 98 96 71
As % of FAC based PP Cost PP Cost of RESCOs @ Viable Tariff 14% 15% 23% Cross Subsidy 48% 49% 45% GoAP Subsidy 39% 37% 32%
3.9 Annexure 1 reproduces the relevant sections of APERC’s order for FY 02, FY 03
and FY 04 for ready reference.
Karnataka
3.10 Hukeri Rural Electric Co-operative Society Limited, Hukeri, Belgaum district in Karnataka is the only Co-op society in Karnataka and one of the 5 RESCOs established in India in 1970s.
3.11 KERC, in its first tariff order for FY 02, allowed Hukeri RESCO (treated as consumer category HT 4) to retain the then prevailing rate fixed by GoK of 58.18 p/u on the basis of “Capacity to Pay” of Hukeri RESCO, while the balance bulk supply costs of KPTCL are met through Government subsidy to KPTCL.
3.12 For FY03, KPTCL, the bulk supplier to Hukeri RESCO, requested for the bulk supply tariff (BST) of 240 p/u, being cost of supplying power to Hukeri RESCO after taking into consideration power purchase costs, transmission costs & losses. However, KERC, in its tariff order, fixed the bulk supply tariff to Hukeri RESCO for FY03 at 75 p/u, on the basis of “Capacity to Pay” with the consideration that the gap between the bulk supply costs and the tariff fixed by KERC being met by GoK subsidy to KPTCL.
3.13 However, for FY 04, KERC treated Hukeri RESCO as one of the licensees, along with the 4 distribution companies formed, and fixed the transmission & bulk supply tariff at 212.24 p/u. However, since Hukeri RESCO does not have the capacity to pay the bulk supply tariff, KERC computed the viable rate payable by Hukeri RESCO at 100 p/u, on the basis of “Capacity to Pay” by determining the residual cash available for the RESCO for power purchase payment after adjusting the allowable operating costs of the RESCO from the expected revenue from its consumers. KERC also directed KPTCL to adjust the balance of 112.24 p/u out of the subsidy provisions made by GoK for FY04.
3.14 Thus, KERC followed the “viable tariff” basis in all the 3 years after clear indication of subsidy from GoK to KPTCL and setting specific performance targets and permissible operating costs for Hukeri RESCO, while fixing the tariff for Hukeri RESCO.
3.15 As can be seen in Table 2, Hukeri RESCO is able to pay only 47% of Power Purchase (PP) costs, while 53% is compensated through Government subsidy to the bulk supplier, KPTCL.
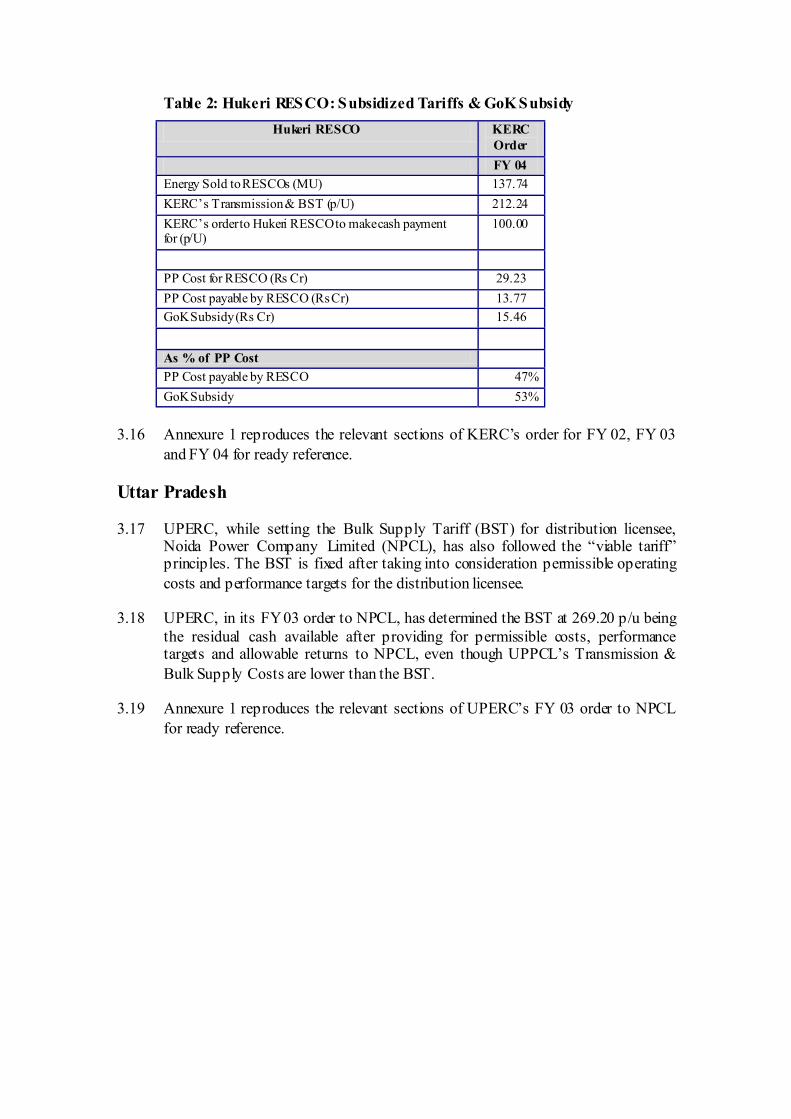
Table 2: Hukeri RESCO: Subsidized Tariffs & GoK Subsidy Hukeri RESCO KERC
Order FY 04
Energy Sold to RESCOs (MU) 137.74 KERC’s Transmission & BST (p/U) 212.24 KERC’s order to Hukeri RESCO to make cash payment for (p/U)
100.00
PP Cost for RESCO (Rs Cr) 29.23 PP Cost payable by RESCO (Rs Cr) 13.77 GoK Subsidy (Rs Cr) 15.46 As % of PP Cost PP Cost payable by RESCO 47% GoK Subsidy 53%
3.16 Annexure 1 reproduces the relevant sections of KERC’s order for FY 02, FY 03
and FY 04 for ready reference.
Uttar Pradesh
3.17 UPERC, while setting the Bulk Supply Tariff (BST) for distribution licensee, Noida Power Company Limited (NPCL), has also followed the “viable tariff” principles. The BST is fixed after taking into consideration permissible operating costs and performance targets for the distribution licensee.
3.18 UPERC, in its FY 03 order to NPCL, has determined the BST at 269.20 p/u being the residual cash available after providing for permissible costs, performance targets and allowable returns to NPCL, even though UPPCL’s Transmission & Bulk Supply Costs are lower than the BST.
3.19 Annexure 1 reproduces the relevant sections of UPERC’s FY 03 order to NPCL for ready reference.
Summary
3.20 In summary, most of the concerned SERCs had determined the “Cost of Supply” based bulk supply tariffs for sale of power to licensees. After clear subsidy commitments from the respective state governments, the SERCs (APERC) have fixed subsidized Bulk Supply Tariff for RESCOs and private distribution licensees, as the retail consumer tariffs needed to be retained at the same level as in the rest of the State. The difference between the Transmission & bulk supply costs of the Bulk supplier and the “Viable BST” set by the SERCs are met through Government subsidy/support and in some cases partly met through cross subsidies available from subsidizing categories (AP).
3.21 SERCs have also ensured that the BST is determined after appropriately determining the permissible operating costs and performance targets for the RESCOs and private distribution licensees.
3.22 If the RESCOs and private distribution licensees fall short of the performance targets or exceed the permissible operating costs set by SERC, then the losses due to such deviations shall be borne by the RESCOs/private distribution licensees.
A4: PERFORMANCE COMPARISON
4.1 Under this section, MPECS’ performance is compared with that of Rural Circles of MSEB having predominantly agricultural load comparable to MPECS as well as the adjoining Rural Divisions of Ahmednagar Circle of MSEB. The Key Performance Indicators compared are: Distribution losses, Collection efficiency, Transformer failure rates, Metered sales and assessed sales as % of total energy sales, consumer receivables, average billings, O&M Costs and consumption/consumer.
4.2 For the purpose of short-listing the MSEB Rural Circles for performance comparison with MPECS, the following parameters were computed for each Circle, keeping in mind that MPECS has a predominantly agricultural load
(a) Share of Agricultural consumers to total consumers of the Circle
(b) Share of Agricultural sanctioned load to total sanctioned load of the Circle
(c) Share of Agricultural consumption to total consumption of the Circle
4.3 Of the above parameters, the criterion selected for short-listing the MSEB rural circles is the share of Agricultural sanctioned load to total sanctioned load (Parameter (b) above).
4.4 The reasons for selecting the sanctioned load as the criterion are:
(a) Share of Agricultural consumers to total consumers was not considered, as the size of each consumer (in terms of HP of the pumpsets) can vary across Circles due to differences in water tables, cropping pattern, rainfall patterns etc. Thus, 2 Circles having similar agricultural consumer size need not have similar agricultural load or similar agricultural consumption
(b) Share of Agricultural consumption to total consumption was not considered, because the basis and assumptions for estimation of agricultural consumption adopted by MPECS and various MSEB Rural Circles are significantly different. Thus, it may not be appropriate to short-list Circles on the basis of share of agricultural consumption to the total consumption
(c) Most of the agricultural consumers are charged on the basis of sanctioned load of the pumpsets for their electricity consumption and hence the quantum of sanctioned load of agriculture has a direct impact on the Circle’s/MPECS’ revenue earning capacity. Hence the share of agricultural sanctioned load to total sanctioned load along with the hours of supply to agriculture in FY 02-03 as considered separately in connection with the tariff petition filed by MSEB has been considered for short-listing the MSEB Rural Circles for performance comparison with MPECS.
Shortlist of MSEB Rural Circles & Divisions for Comparison
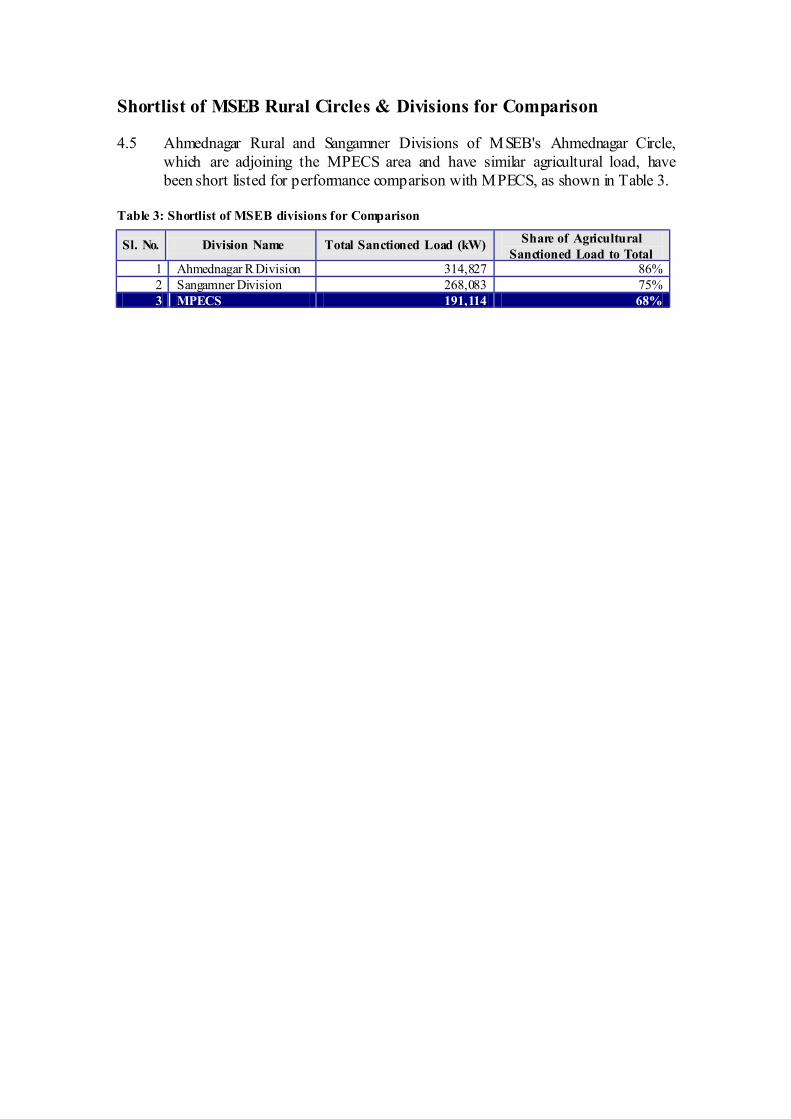
4.5 Ahmednagar Rural and Sangamner Divisions of MSEB's Ahmednagar Circle, which are adjoining the MPECS area and have similar agricultural load, have been short listed for performance comparison with MPECS, as shown in Table 3.
Table 3: Shortlist of MSEB divisions for Comparison
Sl. No. Division Name Total Sanctioned Load (kW) Share of Agricultural Sanctioned Load to Total
1 Ahmednagar R Division 314,827 86% 2 Sangamner Division 268,083 75% 3 MPECS 191,114 68%
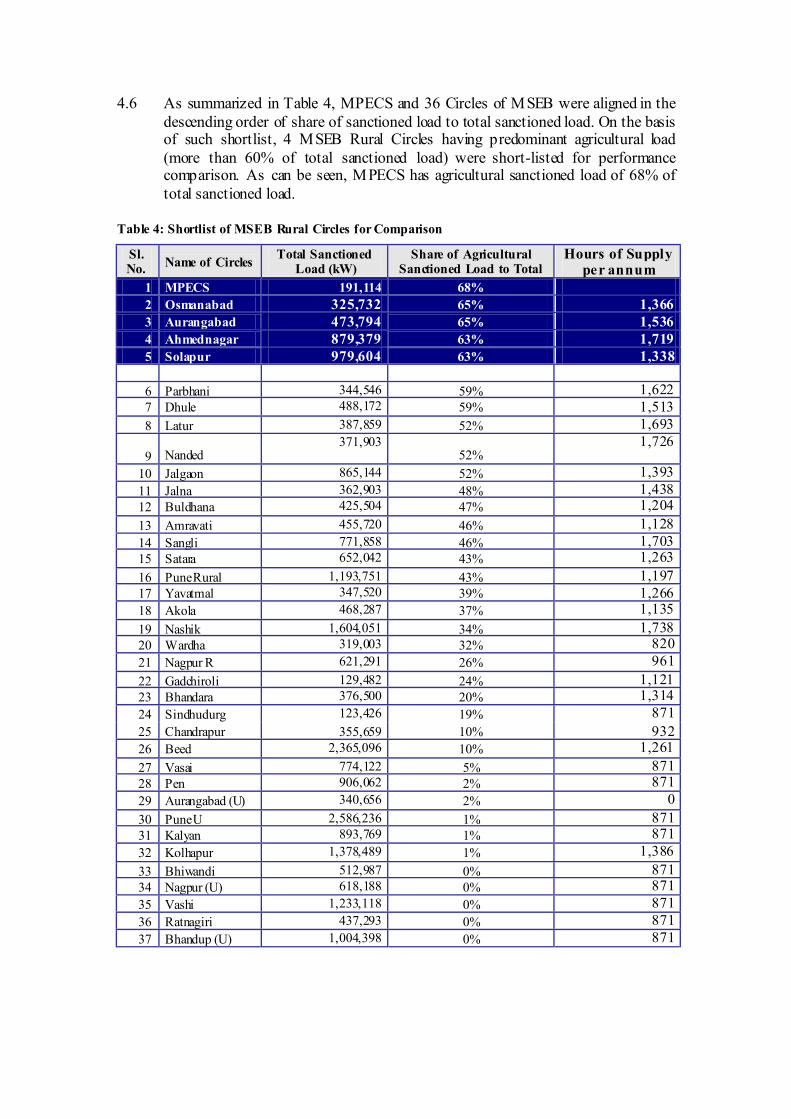
4.6 As summarized in Table 4, MPECS and 36 Circles of MSEB were aligned in the descending order of share of sanctioned load to total sanctioned load. On the basis of such shortlist, 4 MSEB Rural Circles having predominant agricultural load (more than 60% of total sanctioned load) were short-listed for performance comparison. As can be seen, MPECS has agricultural sanctioned load of 68% of total sanctioned load.
Table 4: Shortlist of MSEB Rural Circles for Comparison
Sl. No. Name of Circles Total Sanctioned
Load (kW) Share of Agricultural
Sanctioned Load to Total Hours of Supply
per annum 1 MPECS 191,114 68% 2 Osmanabad 325,732 65% 1,366 3 Aurangabad 473,794 65% 1,536 4 Ahmednagar 879,379 63% 1,719 5 Solapur 979,604 63% 1,338
6 Parbhani 344,546 59% 1,622 7 Dhule 488,172 59% 1,513 8 Latur 387,859 52% 1,693
9 Nanded 371,903
52% 1,726
10 Jalgaon 865,144 52% 1,393 11 Jalna 362,903 48% 1,438 12 Buldhana 425,504 47% 1,204 13 Amravati 455,720 46% 1,128 14 Sangli 771,858 46% 1,703 15 Satara 652,042 43% 1,263 16 Pune Rural 1,193,751 43% 1,197 17 Yavatmal 347,520 39% 1,266 18 Akola 468,287 37% 1,135 19 Nashik 1,604,051 34% 1,738 20 Wardha 319,003 32% 820 21 Nagpur R 621,291 26% 961 22 Gadchiroli 129,482 24% 1,121 23 Bhandara 376,500 20% 1,314 24 Sindhudurg 123,426 19% 871 25 Chandrapur 355,659 10% 932 26 Beed 2,365,096 10% 1,261 27 Vasai 774,122 5% 871 28 Pen 906,062 2% 871 29 Aurangabad (U) 340,656 2% 0 30 Pune U 2,586,236 1% 871 31 Kalyan 893,769 1% 871 32 Kolhapur 1,378,489 1% 1,386 33 Bhiwandi 512,987 0% 871 34 Nagpur (U) 618,188 0% 871 35 Vashi 1,233,118 0% 871 36 Ratnagiri 437,293 0% 871 37 Bhandup (U) 1,004,398 0% 871
Distribution Losses
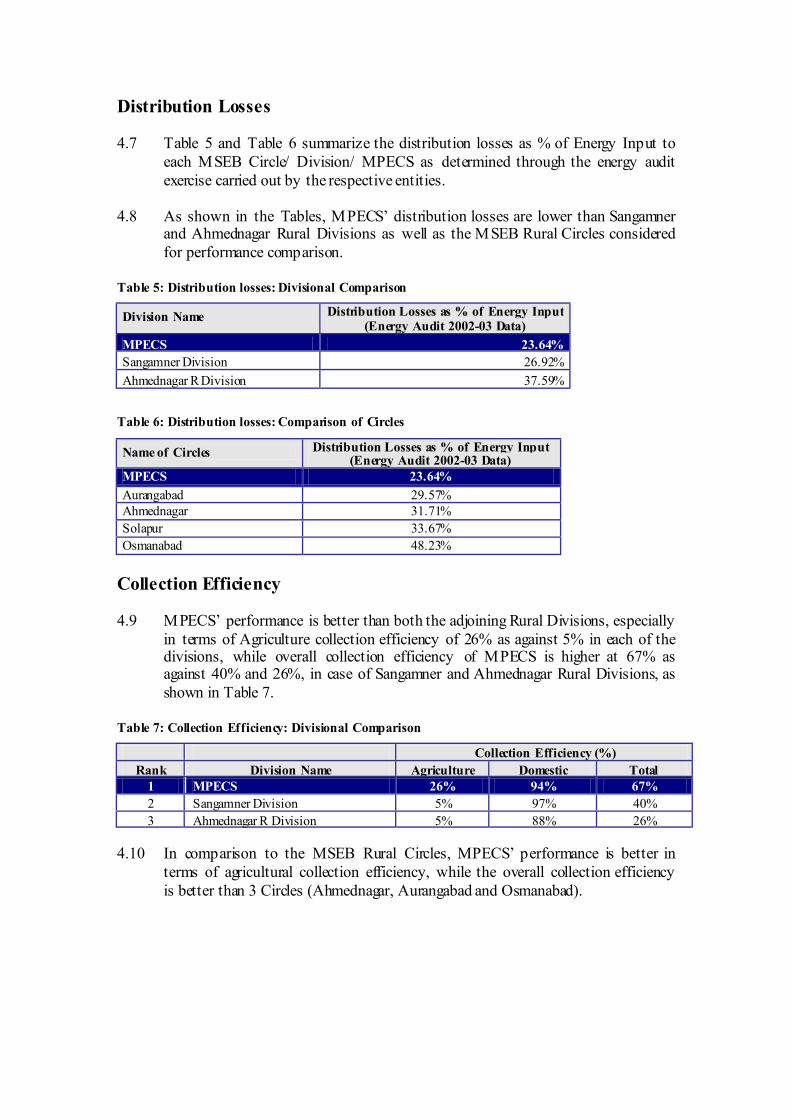
4.7 Table 5 and Table 6 summarize the distribution losses as % of Energy Input to each MSEB Circle/ Division/ MPECS as determined through the energy audit exercise carried out by the respective entities.
4.8 As shown in the Tables, MPECS’ distribution losses are lower than Sangamner and Ahmednagar Rural Divisions as well as the MSEB Rural Circles considered for performance comparison.
Table 5: Distribution losses: Divisional Comparison
Division Name Distribution Losses as % of Energy Input (Energy Audit 2002-03 Data)
MPECS 23.64% Sangamner Division 26.92% Ahmednagar R Division 37.59%
Table 6: Distribution losses: Comparison of Circles
Name of Circles Distribution Losses as % of Energy Input (Energy Audit 2002-03 Data)
MPECS 23.64% Aurangabad 29.57% Ahmednagar 31.71% Solapur 33.67% Osmanabad 48.23%
Collection Efficiency
4.9 MPECS’ performance is better than both the adjoining Rural Divisions, especially in terms of Agriculture collection efficiency of 26% as against 5% in each of the divisions, while overall collection efficiency of MPECS is higher at 67% as against 40% and 26%, in case of Sangamner and Ahmednagar Rural Divisions, as shown in Table 7.
Table 7: Collection Efficiency: Divisional Comparison
Collection Efficiency (%) Rank Division Name Agriculture Domestic Total
1 MPECS 26% 94% 67% 2 Sangamner Division 5% 97% 40% 3 Ahmednagar R Division 5% 88% 26%
4.10 In comparison to the MSEB Rural Circles, MPECS’ performance is better in
terms of agricultural collection efficiency, while the overall collection efficiency is better than 3 Circles (Ahmednagar, Aurangabad and Osmanabad).
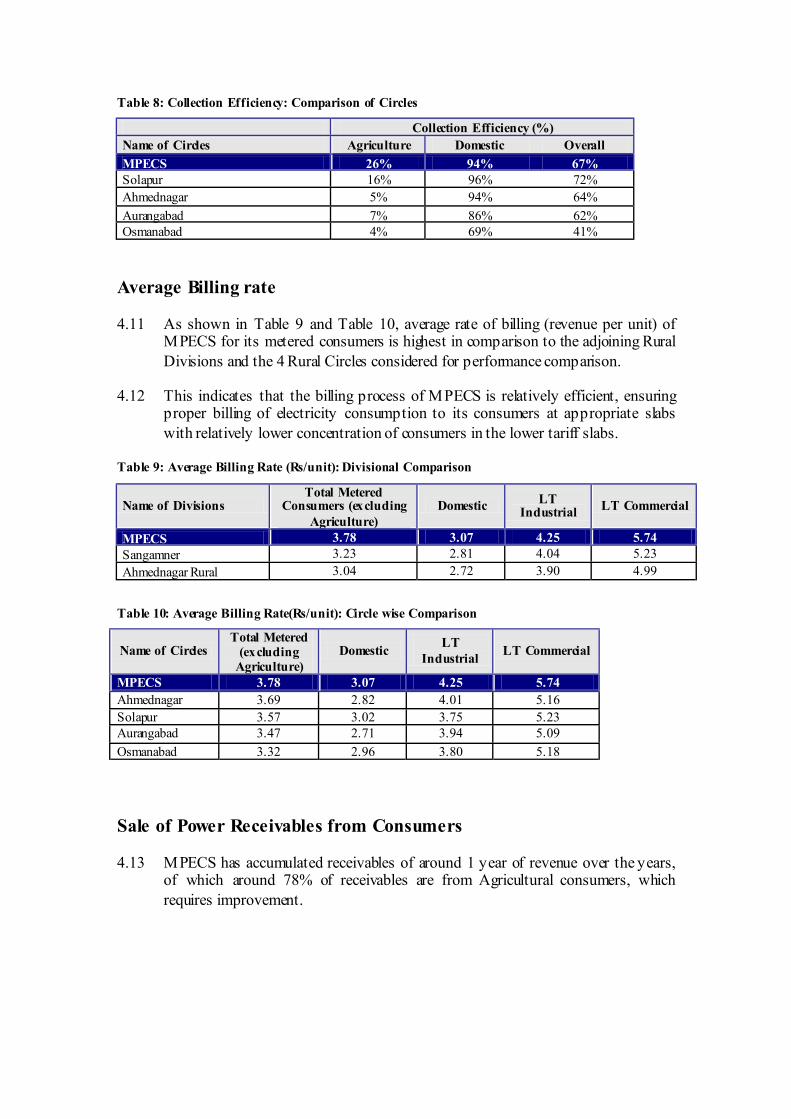
Table 8: Collection Efficiency: Comparison of Circles
Collection Efficiency (%) Name of Circles Agriculture Domestic Overall MPECS 26% 94% 67% Solapur 16% 96% 72% Ahmednagar 5% 94% 64% Aurangabad 7% 86% 62% Osmanabad 4% 69% 41%
Average Billing rate
4.11 As shown in Table 9 and Table 10, average rate of billing (revenue per unit) of MPECS for its metered consumers is highest in comparison to the adjoining Rural Divisions and the 4 Rural Circles considered for performance comparison.
4.12 This indicates that the billing process of MPECS is relatively efficient, ensuring proper billing of electricity consumption to its consumers at appropriate slabs with relatively lower concentration of consumers in the lower tariff slabs.
Table 9: Average Billing Rate (Rs/unit): Divisional Comparison
Name of Divisions Total Metered
Consumers (excluding Agriculture)
Domestic LT Industrial LT Commercial
MPECS 3.78 3.07 4.25 5.74 Sangamner 3.23 2.81 4.04 5.23 Ahmednagar Rural 3.04 2.72 3.90 4.99
Table 10: Average Billing Rate(Rs/unit): Circle wise Comparison
Name of Circles Total Metered
(excluding Agriculture)
Domestic LT Industrial LT Commercial
MPECS 3.78 3.07 4.25 5.74 Ahmednagar 3.69 2.82 4.01 5.16 Solapur 3.57 3.02 3.75 5.23 Aurangabad 3.47 2.71 3.94 5.09 Osmanabad 3.32 2.96 3.80 5.18
Sale of Power Receivables from Consumers
4.13 MPECS has accumulated receivables of around 1 year of revenue over the years, of which around 78% of receivables are from Agricultural consumers, which requires improvement.
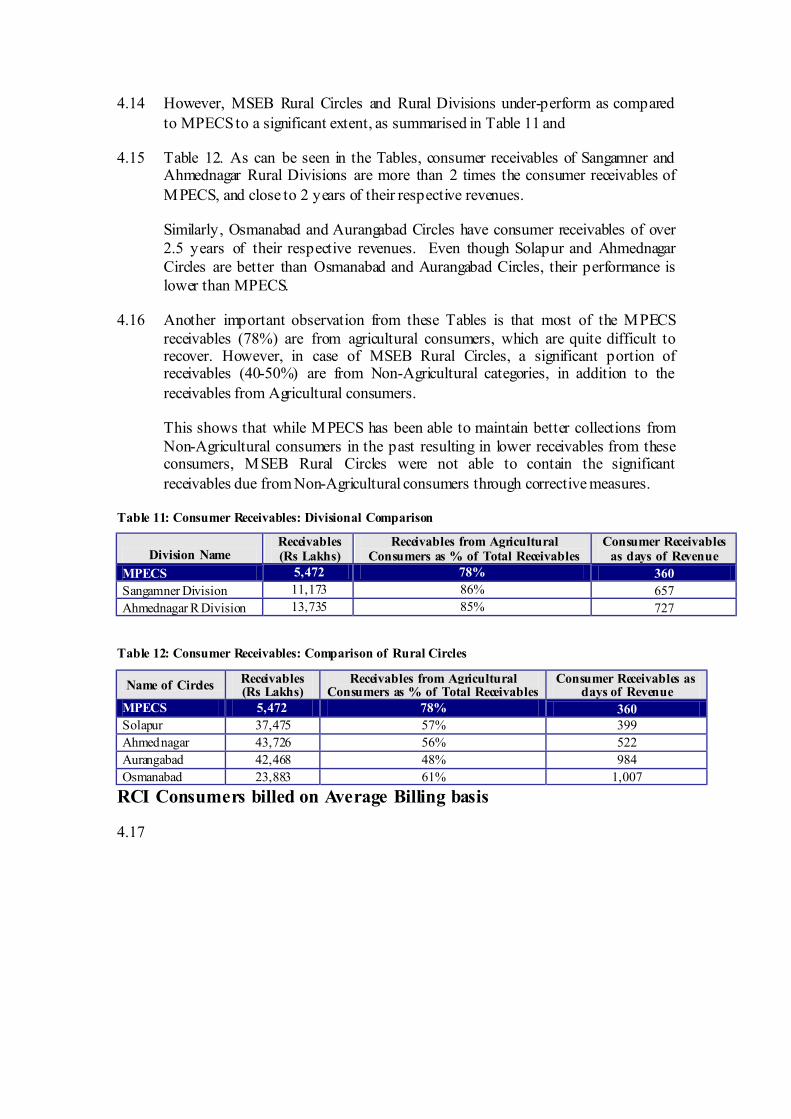
4.14 However, MSEB Rural Circles and Rural Divisions under-perform as compared to MPECS to a significant extent, as summarised in Table 11 and
4.15 Table 12. As can be seen in the Tables, consumer receivables of Sangamner and Ahmednagar Rural Divisions are more than 2 times the consumer receivables of MPECS, and close to 2 years of their respective revenues.
Similarly, Osmanabad and Aurangabad Circles have consumer receivables of over 2.5 years of their respective revenues. Even though Solapur and Ahmednagar Circles are better than Osmanabad and Aurangabad Circles, their performance is lower than MPECS.
4.16 Another important observation from these Tables is that most of the MPECS receivables (78%) are from agricultural consumers, which are quite difficult to recover. However, in case of MSEB Rural Circles, a significant portion of receivables (40-50%) are from Non-Agricultural categories, in addition to the receivables from Agricultural consumers.
This shows that while MPECS has been able to maintain better collections from Non-Agricultural consumers in the past resulting in lower receivables from these consumers, MSEB Rural Circles were not able to contain the significant receivables due from Non-Agricultural consumers through corrective measures.
Table 11: Consumer Receivables: Divisional Comparison
Division Name Receivables (Rs Lakhs)
Receivables from Agricultural Consumers as % of Total Receivables
Consumer Receivables as days of Revenue
MPECS 5,472 78% 360 Sangamner Division 11,173 86% 657 Ahmednagar R Division 13,735 85% 727
Table 12: Consumer Receivables: Comparison of Rural Circles
Name of Circles Receivables (Rs Lakhs)
Receivables from Agricultural Consumers as % of Total Receivables
Consumer Receivables as days of Revenue
MPECS 5,472 78% 360 Solapur 37,475 57% 399 Ahmednagar 43,726 56% 522 Aurangabad 42,468 48% 984 Osmanabad 23,883 61% 1,007
RCI Consumers billed on Average Billing basis
4.17
Table 13 depicts the Circle wise percentage of Residential, Commercial and Industrial (RCI) Consumers billed on the basis of average billing due to defective meters or similar reasons.
4.18 As can be seen, the MPECS performance is better than the Rural Circles of MSEB with just 7.63% of RCI consumers billed on average billing basis.
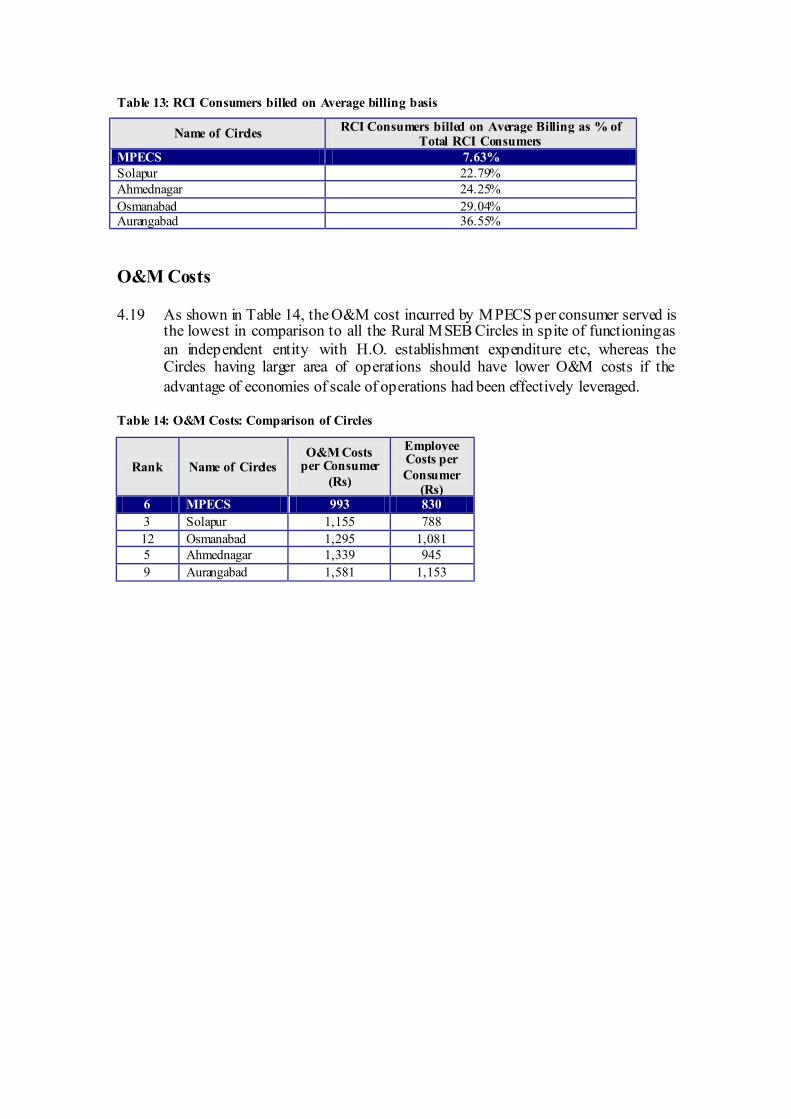
Table 13: RCI Consumers billed on Average billing basis
Name of Circles RCI Consumers billed on Average Billing as % of Total RCI Consumers
MPECS 7.63% Solapur 22.79% Ahmednagar 24.25% Osmanabad 29.04% Aurangabad 36.55%
O&M Costs
4.19 As shown in Table 14, the O&M cost incurred by MPECS per consumer served is the lowest in comparison to all the Rural MSEB Circles in spite of functioning as an independent entity with H.O. establishment expenditure etc, whereas the Circles having larger area of operations should have lower O&M costs if the advantage of economies of scale of operations had been effectively leveraged.
Table 14: O&M Costs: Comparison of Circles
Rank Name of Circles O&M Costs
per Consumer (Rs)
Employee Costs per Consumer
(Rs) 6 MPECS 993 830 3 Solapur 1,155 788 12 Osmanabad 1,295 1,081 5 Ahmednagar 1,339 945 9 Aurangabad 1,581 1,153
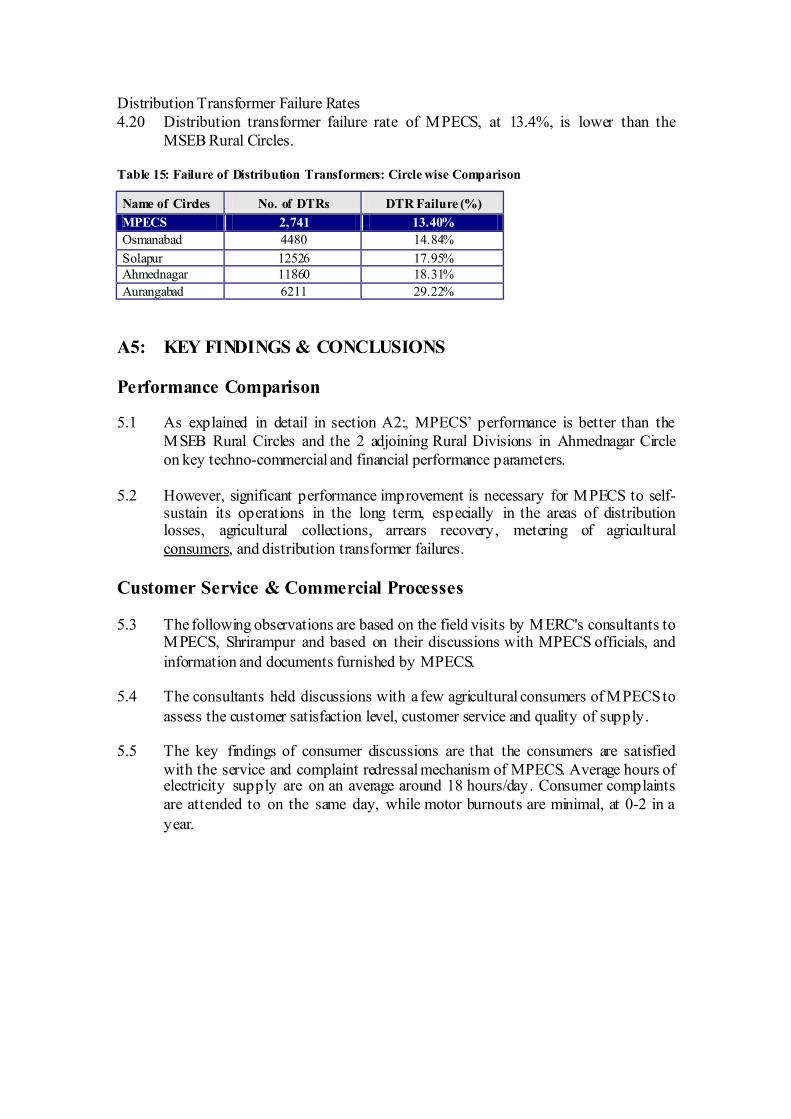
Distribution Transformer Failure Rates 4.20 Distribution transformer failure rate of MPECS, at 13.4%, is lower than the
MSEB Rural Circles.
Table 15: Failure of Distribution Transformers: Circle wise Comparison
Name of Circles No. of DTRs DTR Failure (%) MPECS 2,741 13.40% Osmanabad 4480 14.84% Solapur 12526 17.95% Ahmednagar 11860 18.31% Aurangabad 6211 29.22%
A5: KEY FINDINGS & CONCLUSIONS
Performance Comparison
5.1 As explained in detail in section A2:, MPECS’ performance is better than the MSEB Rural Circles and the 2 adjoining Rural Divisions in Ahmednagar Circle on key techno-commercial and financial performance parameters.
5.2 However, significant performance improvement is necessary for MPECS to self-sustain its operations in the long term, especially in the areas of distribution losses, agricultural collections, arrears recovery, metering of agricultural consumers, and distribution transformer failures.
Customer Service & Commercial Processes
5.3 The following observations are based on the field visits by MERC's consultants to MPECS, Shrirampur and based on their discussions with MPECS officials, and information and documents furnished by MPECS.
5.4 The consultants held discussions with a few agricultural consumers of MPECS to assess the customer satisfaction level, customer service and quality of supply.
5.5 The key findings of consumer discussions are that the consumers are satisfied with the service and complaint redressal mechanism of MPECS. Average hours of electricity supply are on an average around 18 hours/day. Consumer complaints are attended to on the same day, while motor burnouts are minimal, at 0-2 in a year.
5.6 Hours of supply of electricity, revenue recovery from agricultural consumers and metering to agricultural consumers in MPECS area are influenced by the hours of supply, revenue recovery drive and agricultural metering programme in the adjoining MSEB area as well as Government announcements on assured supply to agriculture, as the consumers typically compare MSEB actions on these aspects and want MPECS to follow similar norms as MSEB in their area. This to some extent constrains MPECS from effectively implementing supply regulation, metering and revenue recovery.
Commercial & Consumer Billing Processes
5.7 MPECS releases new connections, does load enhancement, etc., of existing connections for non-agriculture consumers within 2-3 days.
5.8 There is no waitlist of non-agriculture consumers in MPECS area. In case of agriculture consumers, the waitlist is around 500 consumers and a waiting period of 1 year, due to Government policy on release to agricultural consumers.
A6: TIME BOUND TURNAROUND PROGRAM
6.1 The following turnaround programme would enable stakeholders like GoM, MSEB, etc. to monitor MPECS’ actual performance vis-à-vis the programme targets.
Performance Targets
6.2 The time bound turnaround program assumes the following major performance targets to be achieved by MPECS, in order to be eligible for support from GoM, MSEB and REC.
(a) 100% metering of all its existing consumers (including agricultural) shall be done in one year (by the end of FY 04-05), and consumer billing will be based on meter readings only after March 31, 05. GoM may consider providing capital grants and/or concessional loans on similar lines as under the APDRP/PMG scheme of Government of India for this purpose.
(b) All new connections must be metered.
(c) 3-phase supply to Agriculture will be limited to 1,600 units/HP per annum (i.e. 2,145 hours per annum), or as may be stipulated separately by MERC from time to time.
(d) Distribution losses, which stand at 23.64%, shall be reduced to 15.0% by FY 08-09, as per the loss reduction profile shown in
Table 16.
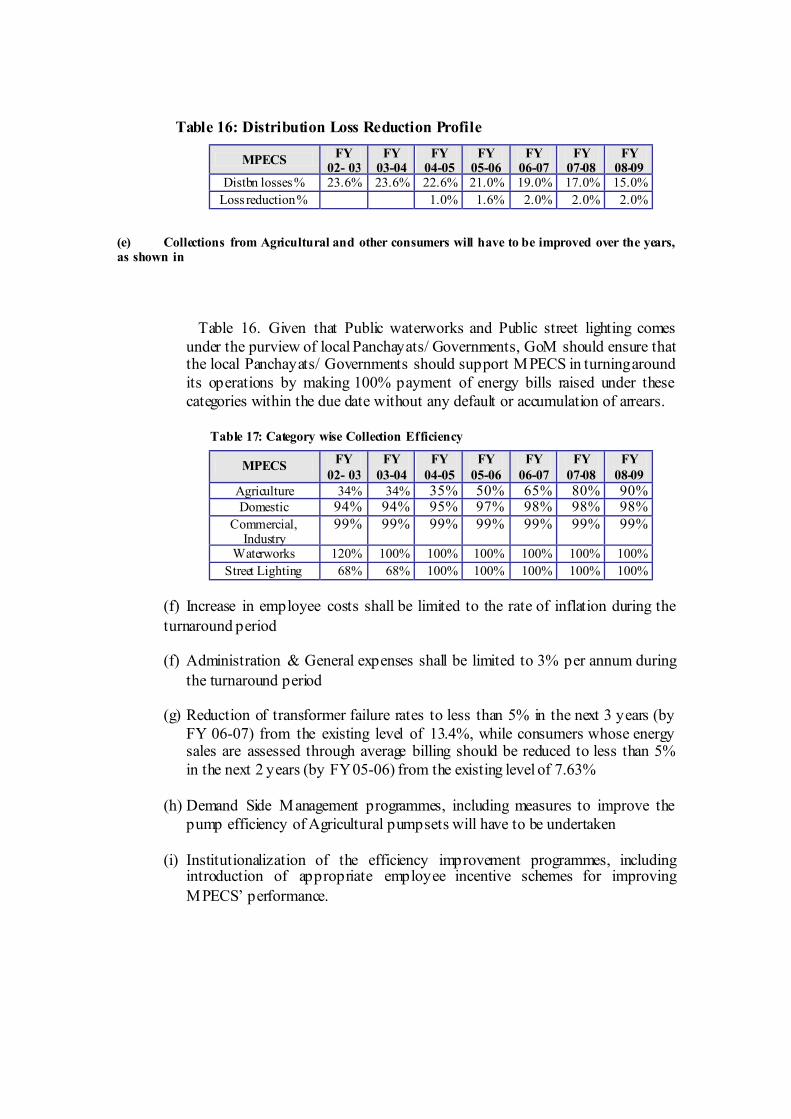
Table 16: Distribution Loss Reduction Profile
MPECS FY 02- 03
FY 03-04
FY 04-05
FY 05-06
FY 06-07
FY 07-08
FY 08-09
Distbn losses % 23.6% 23.6% 22.6% 21.0% 19.0% 17.0% 15.0% Loss reduction % 1.0% 1.6% 2.0% 2.0% 2.0%
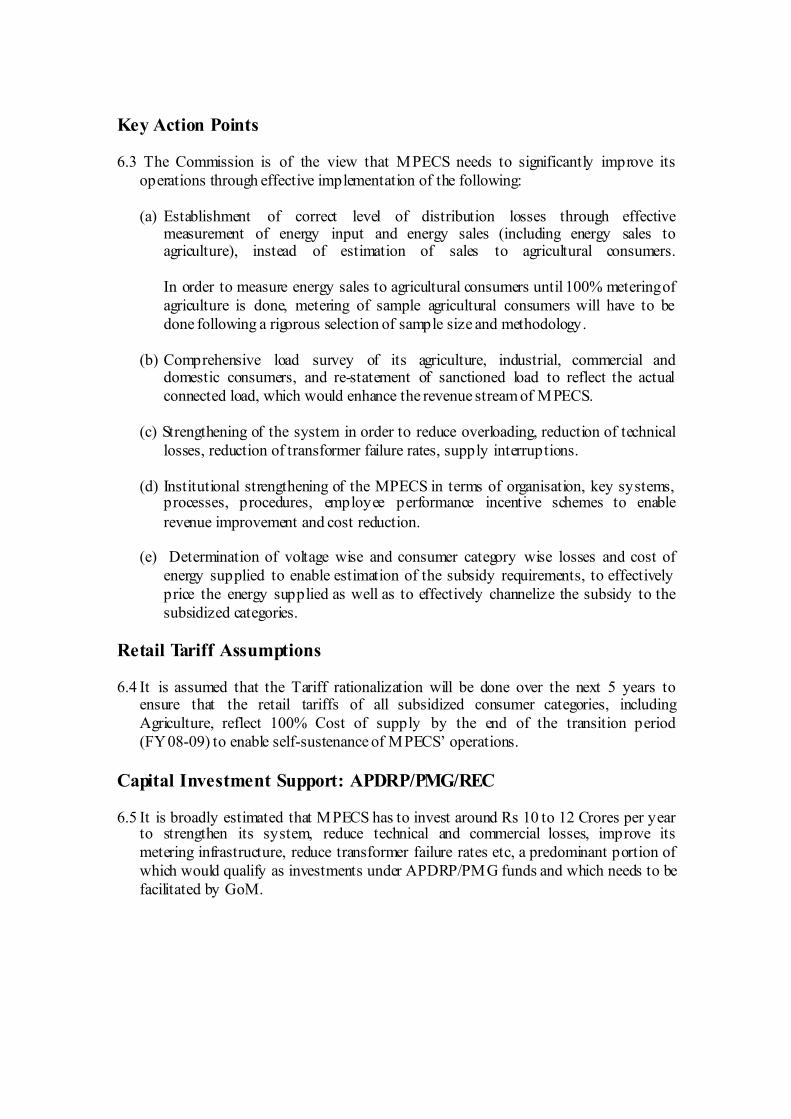
(e) Collections from Agricultural and other consumers will have to be improved over the years, as shown in
Table 16. Given that Public waterworks and Public street lighting comes under the purview of local Panchayats/ Governments, GoM should ensure that the local Panchayats/ Governments should support MPECS in turning around its operations by making 100% payment of energy bills raised under these categories within the due date without any default or accumulation of arrears.
Table 17: Category wise Collection Efficiency
MPECS FY 02- 03
FY 03-04
FY 04-05
FY 05-06
FY 06-07
FY 07-08
FY 08-09
Agriculture 34% 34% 35% 50% 65% 80% 90% Domestic 94% 94% 95% 97% 98% 98% 98%
Commercial, Industry
99% 99% 99% 99% 99% 99% 99%
Waterworks 120% 100% 100% 100% 100% 100% 100% Street Lighting 68% 68% 100% 100% 100% 100% 100%
(f) Increase in employee costs shall be limited to the rate of inflation during the turnaround period
(f) Administration & General expenses shall be limited to 3% per annum during the turnaround period
(g) Reduction of transformer failure rates to less than 5% in the next 3 years (by FY 06-07) from the existing level of 13.4%, while consumers whose energy sales are assessed through average billing should be reduced to less than 5% in the next 2 years (by FY 05-06) from the existing level of 7.63%
(h) Demand Side Management programmes, including measures to improve the pump efficiency of Agricultural pumpsets will have to be undertaken
(i) Institutionalization of the efficiency improvement programmes, including introduction of appropriate employee incentive schemes for improving MPECS’ performance.
Key Action Points
6.3 The Commission is of the view that MPECS needs to significantly improve its operations through effective implementation of the following:
(a) Establishment of correct level of distribution losses through effective measurement of energy input and energy sales (including energy sales to agriculture), instead of estimation of sales to agricultural consumers. In order to measure energy sales to agricultural consumers until 100% metering of agriculture is done, metering of sample agricultural consumers will have to be done following a rigorous selection of sample size and methodology.
(b) Comprehensive load survey of its agriculture, industrial, commercial and domestic consumers, and re-statement of sanctioned load to reflect the actual connected load, which would enhance the revenue stream of MPECS.
(c) Strengthening of the system in order to reduce overloading, reduction of technical losses, reduction of transformer failure rates, supply interruptions.
(d) Institutional strengthening of the MPECS in terms of organisation, key systems, processes, procedures, employee performance incentive schemes to enable revenue improvement and cost reduction.
(e) Determination of voltage wise and consumer category wise losses and cost of energy supplied to enable estimation of the subsidy requirements, to effectively price the energy supplied as well as to effectively channelize the subsidy to the subsidized categories.
Retail Tariff Assumptions
6.4 It is assumed that the Tariff rationalization will be done over the next 5 years to ensure that the retail tariffs of all subsidized consumer categories, including Agriculture, reflect 100% Cost of supply by the end of the transition period (FY 08-09) to enable self-sustenance of MPECS’ operations.
Capital Investment Support: APDRP/PMG/REC
6.5 It is broadly estimated that MPECS has to invest around Rs 10 to 12 Crores per year to strengthen its system, reduce technical and commercial losses, improve its metering infrastructure, reduce transformer failure rates etc, a predominant portion of which would qualify as investments under APDRP/PMG funds and which needs to be facilitated by GoM.
Based on detailed Cost Benefit analysis, MPECS should explore the feasibility of implementing “LT less System” to minimize the distribution losses of the system.
A7: KEY RECOMMENDATIONS
7.1 Given that MPECS is performing better than MSEB in the adjoining rural area as well as comparable areas of MSEB (as explained in detail in Section A4:, MERC recommends that MPECS be allowed to continue to operate in its area.
7.2 In order to enable MPECS to turn around its operations during the transition period, a separate mechanism to discharge the past power purchase dues and accumulated losses of MPECS should be evolved, so that the future operations of MPECS are not overshadowed by the burden of past dues.
7.3 It has to be noted that the rural supply requires some form of continuous assistance in the present context of the economy. In addition to the above, GoM may consider providing capital subsidy for installation of decentralised energy supply systems based on local resources such as bagasse based co-generation, biomass based power plants, etc. by MPECS to meet its demand. This would enable self-sufficiency and long-term sustainability of MPECS’ operations and reduce MPECS’ dependence on GoM for revenue subsidies during the transition period.
7.4 GoM may also consider the findings of the Study Group constituted by GoM on decentralisation of Rural Electrification to Panchayats and alternative structures for supply of electricity in rural areas before taking a final decision on the sustenance of MPECS.
7.5 In the light of the above findings and analysis, the Commission has considered in detail the following 3 options to sustain the operations of MPECS:
7.6 Option 1: MPECS to continue as licensee with transparent direct subsidy arrangements
(a) Following the provisions of the Electricity Act, 2003, the Commission can fix the “Fully Allocated Cost” (FAC) based Bulk Supply Tariff (BST) at which MSEB will supply electricity to MPECS.
MERC could also determine the “Viable” BST based upon the surplus cash revenue available with MPECS towards power purchase after achieving performance improvement targets and meeting the permissible O&M and other costs as may be decided by the Commission. The difference between the “FAC” based BST determined by the Commission and the “Viable Tariff” would have to be provided as subsidy by GoM during the transition period to MPECS directly, subject to the permissible limit of power purchase by MPECS.
(b) However, if MPECS purchases energy over and above the Commission’s permissible limits of power purchase for the year, then such purchases would have to be charged at “FAC” based BST by MSEB to MPECS. Such additional costs will have to be borne and recovered by MPECS through efficiency improvements and additional revenues.
(c) Annual revenue subsidy requirement from GoM to meet the difference between “FAC” based BST and “Viable” BST is estimated to be around Rs 72 Crores per annum. In addition to the revenue subsidy, MPECS would also require Capital Subsidy/Grant and loans from Government to meet its Annual Capital Investment programme towards efficiency improvements, rural electrification and other capital works to the extent of around Rs 4 Crores per annum.
(d) Annual revenue subsidy requirement from GoM would decline in line with the rationalisation of Agricultural tariffs to reflect the Cost of Supply.
7.7 Option 2: MPECS continue as licensee with Creation of “Regulatory Asset”
(a) Under this option, MSEB could be directed to supply power at “viable tariff” to MPECS, as per the power purchase limit prescribed. The gap between the “FAC” based Bulk Supply Tariff and the “Viable Tariff” would be treated as “Regulatory Asset” in the books of MSEB, which would be recovered over a period as may be prescribed by MERC.
7.8 Option 3: MPECS as Management Contractor/ Franchisee
Under this option, MPECS would be only a management contractor or franchisee in the Area of Supply, and all assets of MPECS would be transferred to MSEB in lieu of the current dues to MSEB. Since MPECS operational performance and governance is better than MSEB in similar conditions, it would be allowed to operate as a long-term management contractor of MSEB or its successor entity. The period of contract would be that of the current license period of MPECS, and the entire arrangements can be secured through a formal contractual arrangement. In this arrangement, MPECS would be compensated as a management contractor, and no bulk supply tariff fixation is required for the MPECS supply area.
7.9 Considering the financial implications for GoM and other factors, the Commission is of the view that Option 3 above (at para 7.8) would be the most tenable dispensation, and is accordingly recommended. GoM would, however, have to separately examine in further detail its feasibility, taking into account the legal provisions in particular.
N.B. (1) All figures in this Note are in Rs lakhs or lakh units, as the case may be, and pertain to FY 02-03, unless specifically mentioned otherwise.
(2) The base information used for analysis is collected from MSEB and/or MPECS.
Annexure 1: RELEVANT EXTRACTS OF TARIFF ORDERS OF OTHER SERCS APERC FY 02 Tariff Order
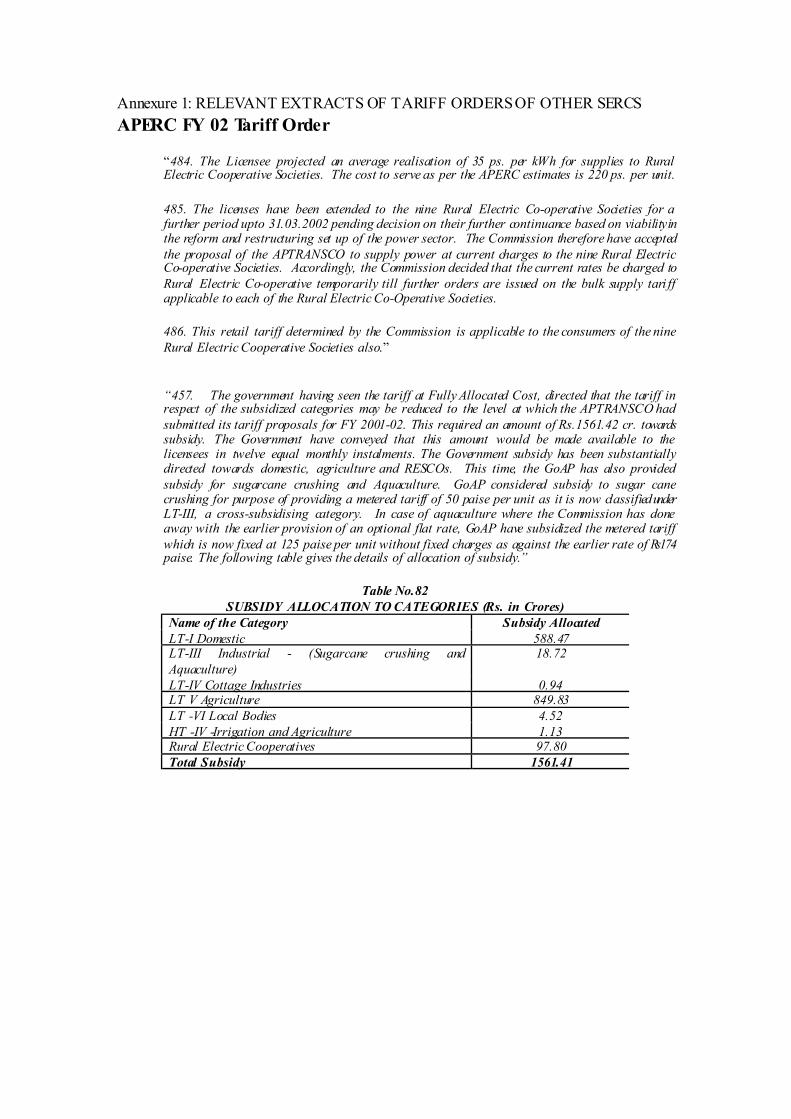
“484. The Licensee projected an average realisation of 35 ps. per kWh for supplies to Rural Electric Cooperative Societies. The cost to serve as per the APERC estimates is 220 ps. per unit.
485. The licenses have been extended to the nine Rural Electric Co-operative Societies for a further period upto 31.03.2002 pending decision on their further continuance based on viability in the reform and restructuring set up of the power sector. The Commission therefore have accepted the proposal of the APTRANSCO to supply power at current charges to the nine Rural Electric Co-operative Societies. Accordingly, the Commission decided that the current rates be charged to Rural Electric Co-operative temporarily till further orders are issued on the bulk supply tari ff applicable to each of the Rural Electric Co-Operative Societies.
486. This retail tariff determined by the Commission is applicable to the consumers of the nine Rural Electric Cooperative Societies also.”
“457. The government having seen the tariff at Fully Allocated Cost, directed that the tariff in respect of the subsidized categories may be reduced to the level at which the APTRANSCO had submitted its tariff proposals for FY 2001-02. This required an amount of Rs.1561.42 cr. towards subsidy. The Government have conveyed that this amount would be made available to the licensees in twelve equal monthly instalments. The Government subsidy has been substantially directed towards domestic, agriculture and RESCOs. This time, the GoAP has also provided subsidy for sugarcane crushing and Aquaculture. GoAP considered subsidy to sugar cane crushing for purpose of providing a metered tariff of 50 paise per unit as it is now classified under LT-III, a cross-subsidising category. In case of aquaculture where the Commission has done away with the earlier provision of an optional flat rate, GoAP have subsidized the metered tariff which is now fixed at 125 paise per unit without fixed charges as against the earlier rate of Rs174 paise. The following table gives the details of allocation of subsidy.”
Table No.82 SUBSIDY ALLOCATION TO CATEGORIES (Rs. in Crores)
Name of the Category Subsidy Allocated LT-I Domestic 588.47 LT-III Industrial - (Sugarcane crushing and Aquaculture)
18.72
LT-IV Cottage Industries 0.94 LT V Agriculture 849.83 LT -VI Local Bodies 4.52 HT -IV -Irrigation and Agriculture 1.13 Rural Electric Cooperatives 97.80 Total Subsidy 1561.41
APERC FY03 Tariff Order
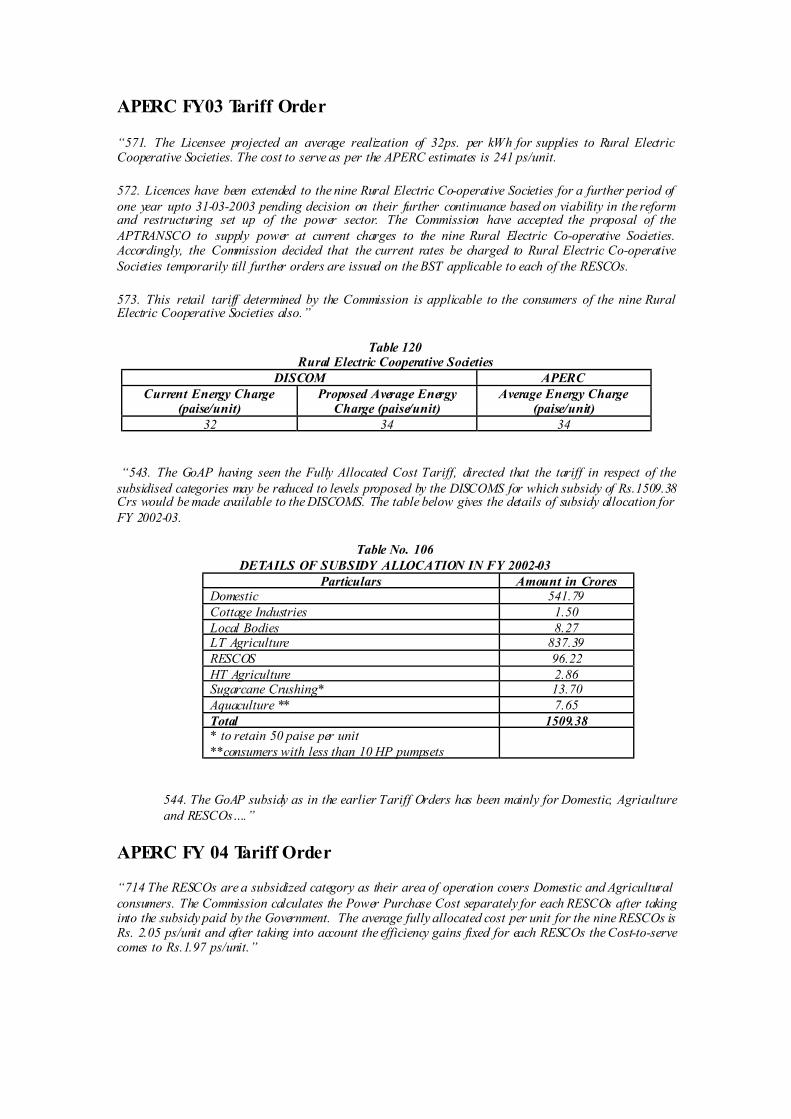
“571. The Licensee projected an average realization of 32ps. per kWh for supplies to Rural Electric Cooperative Societies. The cost to serve as per the APERC estimates is 241 ps/unit.
572. Licences have been extended to the nine Rural Electric Co-operative Societies for a further period of one year upto 31-03-2003 pending decision on their further continuance based on viability in the reform and restructuring set up of the power sector. The Commission have accepted the proposal of the APTRANSCO to supply power at current charges to the nine Rural Electric Co-operative Societies. Accordingly, the Commission decided that the current rates be charged to Rural Electric Co-operative Societies temporarily till further orders are issued on the BST applicable to each of the RESCOs.
573. This retail tariff determined by the Commission is applicable to the consumers of the nine Rural Electric Cooperative Societies also.”
Table 120 Rural Electric Cooperative Societies
DISCOM APERC Current Energy Charge
(paise/unit) Proposed Average Energy
Charge (paise/unit) Average Energy Charge
(paise/unit) 32 34 34
“543. The GoAP having seen the Fully Allocated Cost Tariff, directed that the tariff in respect of the subsidised categories may be reduced to levels proposed by the DISCOMS for which subsidy of Rs.1509.38 Crs would be made available to the DISCOMS. The table below gives the details of subsidy allocation for FY 2002-03.
Table No. 106 DETAILS OF SUBSIDY ALLOCATION IN FY 2002-03
Particulars Amount in Crores Domestic 541.79 Cottage Industries 1.50 Local Bodies 8.27 LT Agriculture 837.39 RESCOS 96.22 HT Agriculture 2.86 Sugarcane Crushing* 13.70 Aquaculture ** 7.65 Total 1509.38 * to retain 50 paise per unit **consumers with less than 10 HP pumpsets
544. The GoAP subsidy as in the earlier Tariff Orders has been mainly for Domestic, Agriculture and RESCOs….”
APERC FY 04 Tariff Order
“714 The RESCOs are a subsidized category as their area of operation covers Domestic and Agricultural consumers. The Commission calculates the Power Purchase Cost separately for each RESCOs after taking into the subsidy paid by the Government. The average fully allocated cost per unit for the nine RESCOs is Rs. 2.05 ps/unit and after taking into account the efficiency gains fixed for each RESCOs the Cost-to-serve comes to Rs.1.97 ps/unit.”
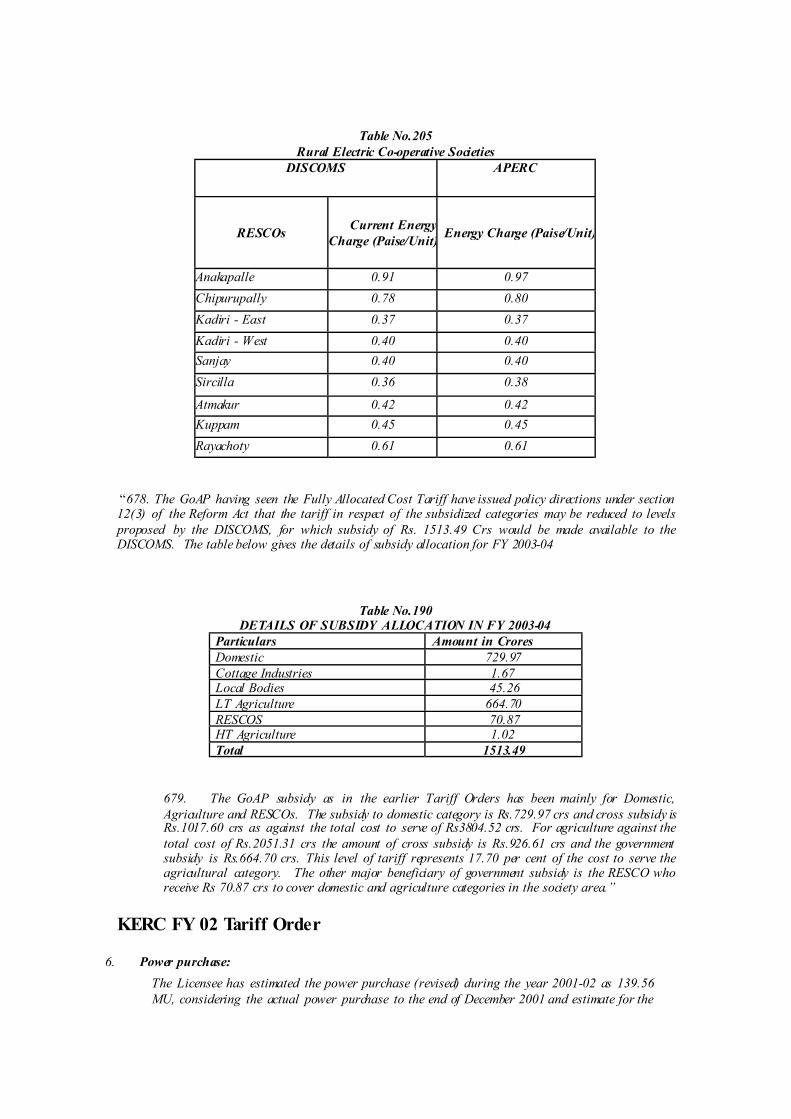
Table No.205 Rural Electric Co-operative Societies
DISCOMS APERC
RESCOs Current Energy Charge (Paise/Unit) Energy Charge (Paise/Unit)
Anakapalle 0.91 0.97 Chipurupally 0.78 0.80 Kadiri - East 0.37 0.37 Kadiri - West 0.40 0.40 Sanjay 0.40 0.40 Sircilla 0.36 0.38
Atmakur 0.42 0.42 Kuppam 0.45 0.45 Rayachoty 0.61 0.61
“678. The GoAP having seen the Fully Allocated Cost Tariff have issued policy directions under section 12(3) of the Reform Act that the tariff in respect of the subsidized categories may be reduced to levels proposed by the DISCOMS, for which subsidy of Rs. 1513.49 Crs would be made available to the DISCOMS. The table below gives the details of subsidy allocation for FY 2003-04
Table No.190 DETAILS OF SUBSIDY ALLOCATION IN FY 2003-04
Particulars Amount in Crores Domestic 729.97 Cottage Industries 1.67 Local Bodies 45.26 LT Agriculture 664.70 RESCOS 70.87 HT Agriculture 1.02 Total 1513.49
679. The GoAP subsidy as in the earlier Tariff Orders has been mainly for Domestic, Agriculture and RESCOs. The subsidy to domestic category is Rs.729.97 crs and cross subsidy is Rs.1017.60 crs as against the total cost to serve of Rs3804.52 crs. For agriculture against the total cost of Rs.2051.31 crs the amount of cross subsidy is Rs.926.61 crs and the government subsidy is Rs.664.70 crs. This level of tariff represents 17.70 per cent of the cost to serve the agricultural category. The other major beneficiary of government subsidy is the RESCO who receive Rs 70.87 crs to cover domestic and agriculture categories in the society area.”
KERC FY 02 Tariff Order
6. Power purchase: The Licensee has estimated the power purchase (revised) during the year 2001-02 as 139.56 MU, considering the actual power purchase to the end of December 2001 and estimate for the
balance period. As the T & D loss approved by the Commission for the year 2001-02 is 16 % as against the Licensee’s estimate of 17.53 % , to account for this reduction in T &D loss, the Commission approves power purchase to an extent of 137.02 MU. The power purchase cost has been considered by the Licensee at the existing rate of 58.18 paise/kwh, which is agreed to by the Commission. This amounts to Rs. 797.18 lakhs for 137.02 MU.
KERC FY 03 Tariff Order
HT-4 Category
1. This represents supply to Hukeri Rural Electric Co-operative society. KPTCL has proposed levy of tariff of Rs.2.40 per unit taking into account the total power purchase cost plus the transmission loss and other transmission costs. The present rate is 58.18 Ps per unit.
2. The Commission had earlier determined the tariff for HT-4 category on the
basis of the amount that the Hukeri Society could pay for the power purchased taking into account the prevalent end customer tariff and the allowable level of operating and administrative expense. On the same basis, the Commission has now estimated the additional income the Hukeri Society would be able to raise considering the tariff now proposed for all categories of end consumers. Taking this into consideration, the Commission determines, that the tariff for Hukeri Society (HT-4) be raised to 75 Ps per unit provisionally subject to passing orders on the ERC of the Hukkeri Society for FY03.
KERC FY 04 Tariff Order
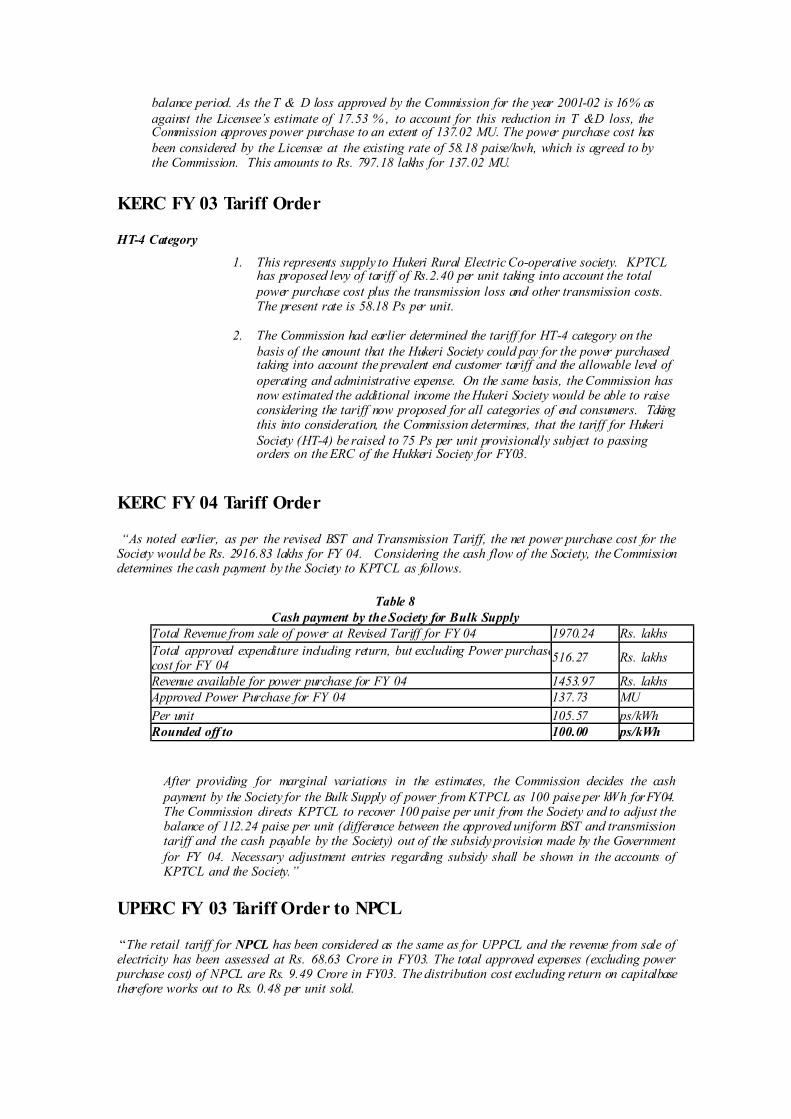
“As noted earlier, as per the revised BST and Transmission Tariff, the net power purchase cost for the Society would be Rs. 2916.83 lakhs for FY 04. Considering the cash flow of the Society, the Commission determines the cash payment by the Society to KPTCL as follows.
Table 8 Cash payment by the Society for Bulk Supply
Total Revenue from sale of power at Revised Tariff for FY 04 1970.24 Rs. lakhs Total approved expenditure including return, but excluding Power purchasecost for FY 04 516.27 Rs. lakhs
Revenue available for power purchase for FY 04 1453.97 Rs. lakhs Approved Power Purchase for FY 04 137.73 MU Per unit 105.57 ps/kWh Rounded off to 100.00 ps/kWh
After providing for marginal variations in the estimates, the Commission decides the cash payment by the Society for the Bulk Supply of power from KTPCL as 100 paise per kWh for FY 04. The Commission directs KPTCL to recover 100 paise per unit from the Society and to adjust the balance of 112.24 paise per unit (difference between the approved uniform BST and transmission tariff and the cash payable by the Society) out of the subsidy provision made by the Government for FY 04. Necessary adjustment entries regarding subsidy shall be shown in the accounts of KPTCL and the Society.”
UPERC FY 03 Tariff Order to NPCL
“The retail tariff for NPCL has been considered as the same as for UPPCL and the revenue from sale of electricity has been assessed at Rs. 68.63 Crore in FY03. The total approved expenses (excluding power purchase cost) of NPCL are Rs. 9.49 Crore in FY03. The distribution cost excluding return on capital base therefore works out to Rs. 0.48 per unit sold.
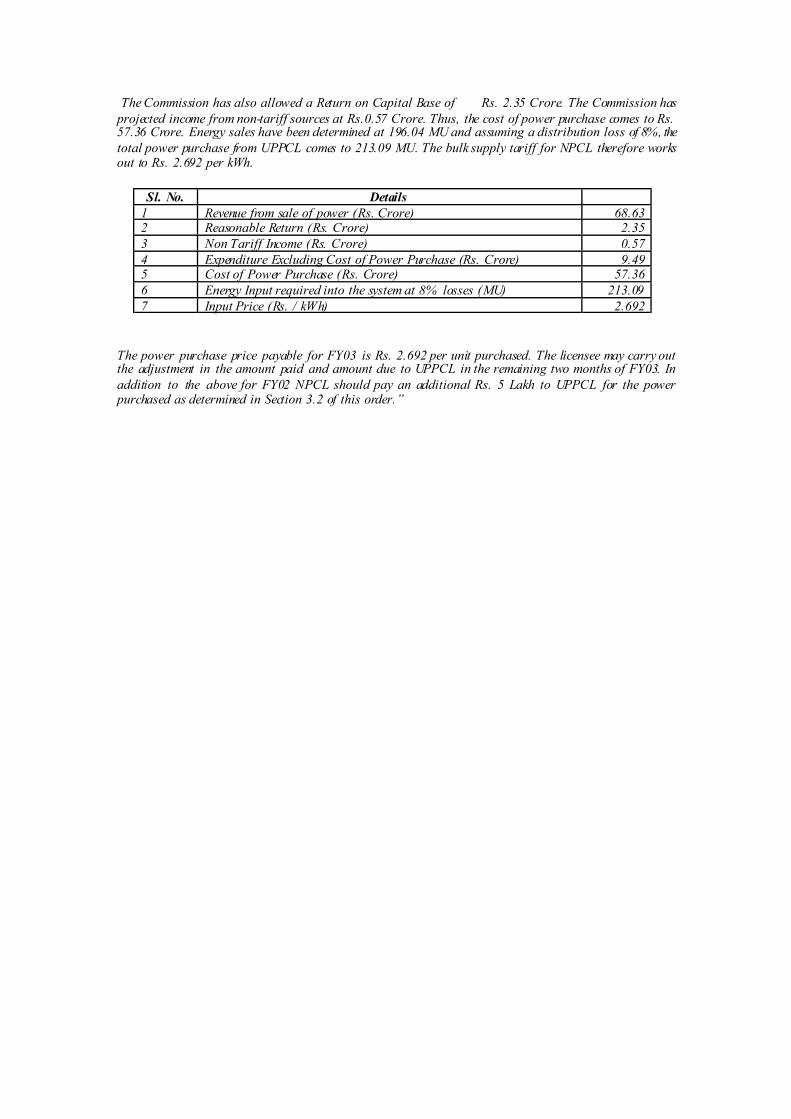
The Commission has also allowed a Return on Capital Base of Rs. 2.35 Crore. The Commission has projected income from non-tariff sources at Rs.0.57 Crore. Thus, the cost of power purchase comes to Rs. 57.36 Crore. Energy sales have been determined at 196.04 MU and assuming a distribution loss of 8%, the total power purchase from UPPCL comes to 213.09 MU. The bulk supply tariff for NPCL therefore works out to Rs. 2.692 per kWh.
Sl. No. Details 1 Revenue from sale of power (Rs. Crore) 68.63 2 Reasonable Return (Rs. Crore) 2.35 3 Non Tariff Income (Rs. Crore) 0.57 4 Expenditure Excluding Cost of Power Purchase (Rs. Crore) 9.49 5 Cost of Power Purchase (Rs. Crore) 57.36 6 Energy Input required into the system at 8% losses (MU) 213.09 7 Input Price (Rs. / kWh) 2.692
The power purchase price payable for FY03 is Rs. 2.692 per unit purchased. The licensee may carry out the adjustment in the amount paid and amount due to UPPCL in the remaining two months of FY03. In addition to the above for FY02 NPCL should pay an additional Rs. 5 Lakh to UPPCL for the power purchased as determined in Section 3.2 of this order.”