mahindra cie automotive (mahaut) - rakesh...
TRANSCRIPT

April 7, 2014
Initiating Coverage
ICICI Securities Ltd | Retail Equity Research
Unique non-linear possibilities emerge! Mahindra CIE Automotive (MCI), an entity formed by the amalgamation of all automotive component companies of Mahindra Systech and CIE’s European forging companies, is one of the world’s largest forger with presence across North/South America, Europe, India and China. Post the consummation of the deal (post completion share swap/purchase procedure after the regulatory/legal approvals), CIE will hold 51% in the entity while Mahindra would directly hold ~20%. MCI has a presence across both commercial vehicles and passenger vehicles with complementary strengths of the dual parents. With cost controls & economic recovery to play out we expect utilisation levels to improve leading to EBIT margins rise to ~8% , RoCE expansion to ~14.5% in FY17E. CIE’s track-record on turnarounds via cost control and high focus on financial metrics gives us confidence. We initiate coverage with BUY rating.
Turnaround possibilities – CIE’s turnaround acumen, economic recovery!! CIE’s management has laid out clear plans for the turnaround of hot spots in MCI. The first one targeted is Mahindra Forgings Europe (MFE), which has seen high operating costs. Along with many others, CIE has targeted a 600 bps EBITDA margin increase on an overall basis in 36 months. CIE is well known for its intense cost focus and decentralised management, which bodes well for turnaround possibilities. An added kicker may emerge in the form of demand/economic recovery in both Europe and India, which may enhance the earnings lever even further.
Strong Tier-1.5 supplier to global OEMs…at an inflection point!! MCI is a strong tier-1.5 supplier to global OEMs, i.e. a supplier of critical components to OEMs. With global car makers moving towards homologation with modular architecture and global platforms and standards, automotive suppliers need to meet the increasing technological intensiveness. With the combined entity’s scale advantage, we believe MCI stands at an inflection point and can reap the benefits of strong parentage and common sourcing, going ahead.
Past rendered irrelevant as bright future beckons! We feel MCI provides a rare, unique Indian auto component play, which has a global footprint with global promoters along with massive turnaround possibilities in the company. An improvement in the financials on the back of cost rationalisation and demand growth could lead to a re-rating for the firm. We forecast ~6% and ~92% CAGR in revenues and earnings, respectively, over FY14E-17E and value the stock on a combination of PE and EV/EBITDA multiples to arrive at a target price of | 130. Exhibit 1: Key financials
| crore FY13P FY14E FY15E FY16E FY17E
Net Sales 4,942.7 5,516.4 5,770.9 6,152.4 6,589.7 EBITDA 328.0 431.9 575.1 718.5 847.4 Net Profit (91.5) 54.0 176.8 289.5 384.3 EPS (|) (2.8) 1.7 5.4 8.9 11.8 P/E (x) - 48.9 14.9 9.1 6.9 EV / EBITDA (x) 12.8 9.6 6.8 5.2 4.2 P/BV (x) 1.6 1.1 1.1 1.0 1.0 RoNW (%) (5.6) 2.3 7.1 11.4 14.4 RoCE (%) 1.6 3.9 7.0 10.8 14.3
Source: Company, ICICIdirect.com Research All financial numbers have been consolidated for ease of comparison
Mahindra CIE Automotive (MAHAUT)| 81
Rating Matrix Rating : Buy
Target : | 130
Target Period : 12-15 months
Potential Upside : 60%
YoY Growth (%) (YoY Growth) FY14E FY15E FY16E FY17ENet Sales 11.6 4.6 6.6 7.1 EBITDA 31.7 33.2 24.9 17.9 Net Profit NA 227.4 63.8 32.7 EPS (Rs) NA 227.4 63.8 32.7
All financial numbers have been consolidated for ease of comparison Valuation Matrix
FY13 FY14E FY15E FY16EP/E - 48.9 14.9 9.1 Target P/E - 87.9 26.9 16.4 EV / EBITDA 12.8 9.6 6.8 5.2 P/BV 1.6 1.1 1.1 1.0 RoNW - 2.3 7.1 11.4 RoCE 1.6 3.9 7.0 10.8
Financial numbers are consolidated unlike company representation
Stock Data Bloomberg/Reuters Code MACA IN / MAHN.NSSensex 22,347.1 Average volumes 290,000.0 Implied market Cap (| crore)* 2,639
52 week H/L 82 / 36Equity Capital (| crore) 325.8 Promoter's Stake (%) 79.5 FII Holding (%) 5.1 DII Holding (%) 0.5
*All financial numbers incorporate merger assumption completed
Comparative return matrix (%) Return % 1M 3M 6M 12M
Mahindra CIE Automotive Ltd 3.5 66.0 20.5 122.3 Motherson Sumi Systems Ltd 8.1 31.5 71.3 113.1 Bharat Forge Limited 10.7 32.0 56.4 96.9
Price movement
0102030405060708090
Apr-14Jan-14Oct-13Jul-13Apr-13
5,000
6,000
7,000
Price (R.H.S) Nifty (L.H.S)
Analyst’s name
Nishant Vass [email protected] Venil Shah [email protected]

Page 2 ICICI Securities Ltd | Retail Equity Research
Company background Mahindra CIE Automotive (MCI) is an automotive component supplier, formed by the alliance of CIE Automotive, a Spanish automotive component major and Mahindra & Mahindra’s (M&M) Systech division. With the merger in place, the company will become the third largest forger in the world with a consolidated revenue size of ~| 5000 crore. MCI would have a presence in Asia (India, China) and Europe (Spain, Germany, UK, Italy, Spain, Lithuania) supplying forgings, castings, gears and stampings, thereby making Mahindra CIE Automotive a strong global player. Exhibit 2: Overview of entity
Source: Company, ICICIdirect.com Research
Exhibit 3: Combined Entity- breakup
Source: Company, ICICIdirect.com Research
M&M
CIE
Mahindra CIE
20.18% 53% 26.82%
Systech India
›Forgings~| 420 core
›Stampings~| 760 core
›Castings & Foundry ~| 480 core
›Gears~| 100 core
›Composites~| 50 core
Systech Europe Germany, UK, Italy
›Forgings~| 1800 core
›Gears ~| 400 core
CIE Forgings EuropeSpain, Lithuania
›~| 1000 core
Public
Shareholding pattern (Q3FY14)
Holdings (%)
Promoters 79.5
Foreign Institutional Investors 5.1
Domestic Institutional Investors 0.5
Others 15.0
Institutional holding trend
0.6 4.
7 6.8
6.8
5.1
10.1
10.1
6.8
0.5
0.5
0.0
2.0
4.0
6.0
8.0
10.0
12.0
Q3FY
13
Q4FY
13
Q1FY
14
Q2FY
14
Q3FY
14
FII DII
Shareholding pattern CIE Automotive (CY13)
Holdings(%)
Gestamp 24.9
Mahindra 13.5
Management Team 15.5
Others 46.1

Page 3 ICICI Securities Ltd | Retail Equity Research
Exhibit 4: Detailed view of Mahindra CIE: Revenue contribution
Mahindra CIE Automotive| 5062 cr
Forgings| 3259 cr
Castings & Magnets | 478 cr
Mahindra Hinoday | 478 cr
Gears | 508 cr
Mahindra Forgings
| 2216 cr
CIE Forgings | 1042 cr
Composites| 50 cr
Stampings| 766 cr
MF India | 424 cr
MF Europe | 1792 cr
Domestic | 331 cr
Exports| 148 cr
Metalcastello SpA
| 402 cr
Mahindra Gears | 106 cr
Domestic | 67 cr
Exports| 39 cr
Mahindra Composites
| 50 cr
MUSCO (Stamping)
| 766cr
Domestic| 46 cr
Exports| 4 cr
Domestic| 752 cr
Exports| 14 cr
Source: Company, ICICIdirect.com Research
About the partners: CIE Automotive is a Spain-based company engaged, through its subsidiaries, in the production of bio-fuels as well as with the supply of components and subassemblies for the automotive industry. The company is a parent of Grupo CIE Automotive, which comprises a number of controlled entities, with operations in Spain, Portugal, France, Lithuania, Morocco, Czech Republic, Romania, Brazil, Argentina, China, Russia, Guatemala and Mexico, among others. Through its subsidiaries, the company is engaged in the supply of components and subassemblies for the automotive industry as well as in production of bio-fuels. CIE Automotive is also engaged in the information technology (IT) sector, providing technological solutions to the healthcare, education, sustainability, transport and communications sectors. The company is a parent of Grupo CIE Automotive, a group that comprises a number of controlled entities with operations in Spain, Portugal, France, Lithuania, Morocco, Czech Republic, Romania, Brazil, Argentina, China, Russia, Guatemala and Mexico, among others. CIE Automotive has such subsidiaries as Global Dominion Access SA, CIE Inversiones e Inmuebles Sociedad Limitada and CIE Berriz Sociedad Limitada, among others. CIE Automotive has emerged from the crisis as one of the leading global players in its area of expertise, ranking within the top 75 global automotive component makers by revenue and the top 1,000 companies in the world in terms of R&D spending.
Exhibit 5: CIE major clientele
Segment CIE Customer
OEM
Daimler Chrysler, GM Group, Toyota, Fiat Group, PSA Peugeot Citröen, VW Group, Ford Group, Renault
Nissan
Tier-1 Suppliers
Antolín, Bosch, Continental, DAF,
Delphi, Faurecia, Filftrauto, GKN, John
Deere, KYB, Lear, Nexteer, NSK, Paulstra, Pierburg, Schaeffler Group,
Trelleborg, TRW, Valeo, Visteon, Woco,
ZF
IndustrialCNH, DAF, John Deere, MAN, Daimler,
IVECO Source: Company, ICICIdirect.com Research
Page 4 ICICI Securities Ltd | Retail Equity Research
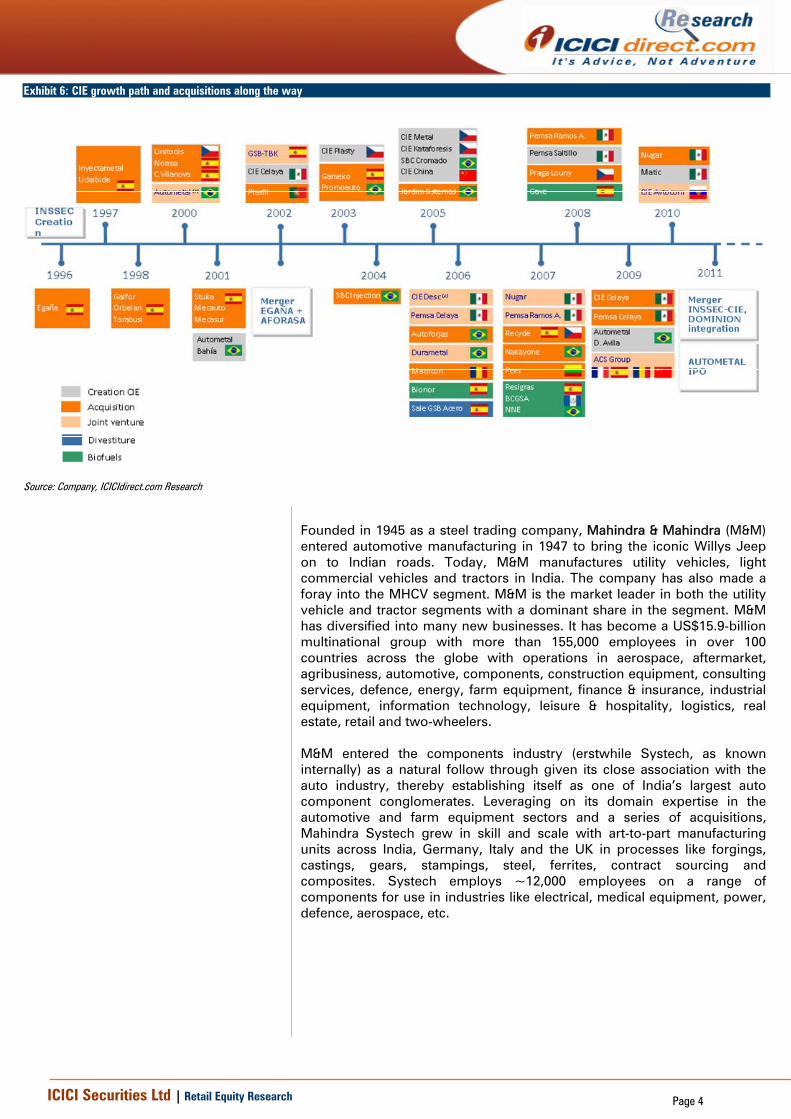
Exhibit 6: CIE growth path and acquisitions along the way
Source: Company, ICICIdirect.com Research
Founded in 1945 as a steel trading company, Mahindra & Mahindra (M&M) entered automotive manufacturing in 1947 to bring the iconic Willys Jeep on to Indian roads. Today, M&M manufactures utility vehicles, light commercial vehicles and tractors in India. The company has also made a foray into the MHCV segment. M&M is the market leader in both the utility vehicle and tractor segments with a dominant share in the segment. M&M has diversified into many new businesses. It has become a US$15.9-billion multinational group with more than 155,000 employees in over 100 countries across the globe with operations in aerospace, aftermarket, agribusiness, automotive, components, construction equipment, consulting services, defence, energy, farm equipment, finance & insurance, industrial equipment, information technology, leisure & hospitality, logistics, real estate, retail and two-wheelers. M&M entered the components industry (erstwhile Systech, as known internally) as a natural follow through given its close association with the auto industry, thereby establishing itself as one of India’s largest auto component conglomerates. Leveraging on its domain expertise in the automotive and farm equipment sectors and a series of acquisitions, Mahindra Systech grew in skill and scale with art-to-part manufacturing units across India, Germany, Italy and the UK in processes like forgings, castings, gears, stampings, steel, ferrites, contract sourcing and composites. Systech employs ~12,000 employees on a range of components for use in industries like electrical, medical equipment, power, defence, aerospace, etc.

Page 5 ICICI Securities Ltd | Retail Equity Research
Exhibit 7: M&M’s erstwhile Systech
Source: Company, ICICIdirect.com Research
Exhibit 8: Systech product line-up
Source: Company, ICICIdirect.com Research
The deal does not include the engineering services division
and the steel business

Page 6 ICICI Securities Ltd | Retail Equity Research
Exhibit 9: Snapshot of product portfolio Business Key segments Key Products Product/Category Description Major clients
Crankshafts A crankshaft transmits the power generated in the engine's cylinders through the connecting rodto the main drive of the vehicle. Crankshafts can be forged from a steel bar, nowadays more andmore manufacturers tend to favor the use of forged crankshafts due to their lighter weight, morecompact dimensions.
Connecting rods and crankshafts
In a piston engine, the connecting rod or conrod connects the piston to the crank or crankshaftwhile the crankshaft is responsible for converting the rotational motion into reciprocating motion
Steering components
Steering knuckles A steering knuckle is that part which contains the wheel hub or spindle and attaches to thesuspension components
Axle & transmission parts
An axle is a central shaft for a rotating wheel or gear. The axles serve to transmit driving torque tothe wheel as well as maintain the position of the wheels relative to each other and to the vehiclebody
Turbine housing Turbine housings direct the gas flow through the turbine, which is a rotary mechanical device(shaft or drum with blades attached) that uses fluid flow to impart rotational energy to the rotor
Brake calliper The job of the caliper is to slow the car's wheels by creating friction with the rotors.The brake caliper fits over the rotor like a clamp and is a pair of metal plates bonded with brakepads
Transmission gears & shaft
Transmission is an assembly of parts including the speed-changing gears and the propeller shaftby which the power is transmitted from an engine to the axle
Engine gears Gears are typically used in engines to drive timing, balance shaft or auxiliary systems
Clutch components Replacement accessories in clutches and assemblies. Clutches are mechanical devices thatprovide transmission of power by connecting and disconnecting two rotating shafts
Skin/non-skin panels Chassis reinforcements, cross members, gussets and sub-assemblies like LCV doors, fifth wheeltop plate, tractor bonnets, dash panels, cross members.
Fuel tank Fuel tank is a safe container for flammable fluids (fuel)
Sheet moulding compounds
Sheet moulding compound (SMC) is a thermosetting polymer reinforced with fibre (usually glassfibre), manufactured in the form of a sheet
Covers Various parts like engine hood, bonnet, muffler guard
CNH, Concentric, Mahindra,New Holland, Turner, Eaton,Mahindra Navistar
Castings & magnets
Forgings
Gears, clutch components
Gears & transmission
Maruti Suzuki, Tata Motors,Renault, Benteler AutomotiveUSA, Fiat, Mahindra Reva,Mahindra TractorsInternational Tractors, Escorts, Tractor and Farm Equipment(TAFE), Same Deutz Fahr,V MMotori
Powertrain. Engine & braking
components
Cummins, Honeywell, JCB,Mahindra, Automotive Axles,New Hollande, Dana,Hyundai, Chassis Brake, JohnDeere
Engine components
Body systems, chassis systems
StampingsM&M, Tata Motors, AshokLeyland, Renault
Ashok Leyland, M&M, Volvo,Swaraj Mazda, TVS, L&T,Schneider, Siemens,Schneider, Siemens,ABB, GEMedical System India, PhilipsIndia, Havells
Moulding compounds, auto
partsComposites
Source: Company, ICICIdirect.com Research

Page 7 ICICI Securities Ltd | Retail Equity Research
Deal structure:- Three-step deal: 1. CIE's 75% subsidiary - Autometal (listed on the Sao Paolo Stock Exchange) will buy a stake in the listed/unlisted Systech group companies (for | 673 crore) through a holding company. 2. M&M will buy a 13.5% stake in CIE (making it the second largest shareholder) for €96.24 million (| 736 crore at the then prevailing exchange rate of 76.5, hence a net cash-outflow of |63 crore). 3. All Systech companies along with CIE's Forging unit in Spain and Lithuania will be merged into Mahindra Forging, which would be re-christened Mahindra CIE. Steps 2 and 3 are complete while step 1 is going through regulatory approvals and is expected to finish by July 2014.
Exhibit 10: Deal Structure
Source: Company, ICICIdirect.com Research
As per the latest holding report, CIE via Autometal holds ~80% in MCI. However, CIE’s shareholding is likely to come down to ~51% once the share swap for both listed/unlisted entities in Systech is complete. The stock has rallied recently and is now being driven by merger ratios of Mahindra Ugine Steel (Musco) (1:2.84) and Mahindra Composites (1:0.9). Post completion of the merger, the stock will behave more on fundamentals and not on share-swap ratios. Regulatory/court approvals are expected in a couple of months, which would pave the way for completion of the deal and complete financial reporting. The complete availability of financials post any acquisitions can act as a near-term positive considering the clarity it would bring.
CIE via a holding company will acquire 79.2% in Mahindra
Forgings (MFL), 61.7% in Mahindra Composites (MCL)
and 64.9% in Mahindra Hinoday Industries (MHIL) via
share purchase & open offer and also fully acquire the
two unlisted entities - Mahindra Investments India
(MIIPL), which holds 100% stake in Mahindra Gears
(MGIL). Mahindra group’s current holdings in the three
listed entities; MFL, MCL & MHIL is at 53%, 30% and
64.9%, respectively. All these entities along with MUSCO
will merge into MCI with swap ratios of 1:1.1(MHIL),
1:0.9 (MCL), 1:0.17(MIIPL), 1:0.2 (MGIL), 1:1.05 (PIA3) and 1:2.84 (MUSCO)
M&M will continue to retain ownership in the automotive business at two levels–CIE Group, Spain & Mahindra CIE, India
Mahindra Systech
CIE Automotive
Composites Forgings
Stampings Castings + MPD
Gears
Autometal
Bio-fuels
Inf. & Comm. Tech
Mahindra CIE Automotive Limited
Machining
M&M
Indicates transaction
Indicates merger
Stampings
Aluminium
Plastics
Forgings*Brazil
Mexico
Listed company
* CIE Forgings plants in Spain & Lithuania
USA
China
Forgings, machining castings, stampings, plastics, painting
Aluminium, forgings, machining, stampings, plastics, painting
Plastics
Forgings
13.5% - 2nd largest shareholder
>50%

Page 8 ICICI Securities Ltd | Retail Equity Research
Investment Rationale Post the completion of the merger of Systech entities with CIE Automotive, the combined entity will become a strong “Tier 1.5” supplier (explained in exhibit 15) to global OEMs. Along with strong scale benefits, pedigree parentage advantage and significant turnaround possibilities, Mahindra CIE Automotive presents an attractive opportunity to play on the recovery theme in both India and Europe. MCI is also placed in a sweet spot with respect to scarcity of strong global automotive ancillary companies with significant visibility of earnings growth as several levers appear in-place for growth. Revenue growth possibilities on favourable macros in Europe and India remain a key upside risk. However, we have factored in moderate revenue growth of ~4-6% CAGR (FY13-17E) in the European business while India is expected to witness a recovery post elections to the tune of ~10% CAGR (FY13-17E). We believe the overall group turnaround may face some outlier roadblocks due to which we expect the management’s target of ~12% EBITDA margin to eventuate close to FY17E. We, however, expect progression of margins to be smooth on the way (~10%-FY15E and ~11% FY16E). Consequently, FY15E, FY16E, FY17E could witness PAT margins of 3%, 4.6%, 5.7% respectively. We expect PAT to increase at ~92% CAGR in FY14E-17E and ~132% CAGR in FY14E-16E.
Exhibit 11: Mahindra CIE Automotive: Financial performance at a glance!
5,06
2.3
5,65
5.4
5,91
4.9
6,30
3.9
6,75
0.5
(91.5)
54.0 176.8 289.5 384.3
9.7
11.412.6
6.57.6
-1000
0
1000
2000
3000
4000
5000
6000
7000
8000
FY13P FY14E FY15E FY16E FY17E
(| c
rore
)
-
2
4
6
8
10
12
14
(%)
Total Operating Income PAT EBITDA Margins(%)
Source: Company, ICICIdirect.com Research
Global OEMs growing & moving towards increased technology intensiveness! On present estimates, the global automotive industry is worth $800 billion a year. Forecasts suggests the world market for cars and other light vehicles will expand from the current rate of ~80 million units/year to over 100 million by 2020, reflecting the enormous growth potential of emerging economies. As per the World Bank’s latest statistics, just 18 people in every 1,000 own a car in India. In China, the corresponding figure is 58 even as developed markets like Europe have more than 500 per 1000. Against this backdrop, it is little wonder that automotive companies, particularly OEMs, continue to pour large investments into these newer markets and newer global products. For example, recently, one of the world’s largest OEMs the “Volkswagen Group” announced a total investment of ~$114 billion in its automotive division between 2014 and 2018. Over two-thirds of the amount would go towards product development of newer efficient vehicles, drives and technologies as well as environmentally friendly production. Investments are significant in powertrain production as well, with VW switching to Euro-6 engines and to new generations of power plants. Globally, the automotive industry is witnessing fast changes due to rapidly changing customer preferences and stricter environmental regulations. This along with increasing competition and availability of products globally has

Page 9 ICICI Securities Ltd | Retail Equity Research
led to a reduction of the single model life in a platform. This, in turn, leads OEMs to increase the number of products per platform, thereby maximising returns on product development expenses. This has led to stiff challenges on supply and geographic presence for automotive components suppliers. As a response, the world’s leading automotive component firms are consolidating their positions by acquiring competitors while at the same time moving towards source designing and modular production. Exhibit 12: Product development expense
Company New Platform launchesResearch & product development expenses
Ford D4 Plus $5.5 billion
VW MQB, PQ12 $12.2 billion
Mercedes Benz "MSA"- modular sports architecture $5 billion
JLR new aluminium platform $3 billion
D-13 LNG in North America $2.3 billion
Pro series in India
UD Quester in APAC
FH16 in Europe
Navistar SCR'd Maxx force engine $400 million
Tata Motors Tata Prima MAV in APAC $300 million
Cummins ISG 11/12 engine global $720 million
MB Actros SLT(250T) in Europe $1.7 billion
Bharat Benz tractor in India
Fuso 'F1" series in APAC, Africa
SML Isuzu XM series in India $2 million
IVECO Stralis Hi-way cursor 11 engine NA
Passenger vehicle
Commercial vehicles
Volvo Group
Daimler
Source: Company, ICICIdirect.com Research All the expenses are Annual in nature
Source designing refers to the process by which OEMs are transferring responsibility for the design and development of certain parts of their vehicles to component manufacturers. The OEMs are doing this to reduce their new product development costs, reduce their design lead times and maximise the benefits of their global marketing and production presence. As reward for their ongoing research and development activities for OEMs these component manufacturers are assured of long-term global ‘lead sourcing’ supplier contracts. This necessitates investment in R&D and mandates global presence as automotive OEMs adopt practices like global platforms, one platform, platform sharing, homologation and modular architecture. Mandating suppliers’ to achieve critical mass & to be partners! With the evolution of the auto industry, several distinct trends have evolved over time with respect to sourcing of components as well as overall assembly/manufacturing methodology. One such secular trend is of modular production, which has over time found acceptance. Modular production is related to lead sourcing and has resulted in the development of modular manufacturers leading to a distinct tier-ing of the automotive industry. OEMs no longer source their components from multi-fold suppliers. They now only have tie-ups with a few first tier suppliers, with these being responsible for the production of particular modules (or sub-assemblies) that require the supply of components from a larger group of second tier component suppliers. These tier-1 suppliers that supply direct to OEMs take on the important role of being systems integrators rather than simply component manufacturers. However, these tier-1 suppliers like Bosch,

Page 10 ICICI Securities Ltd | Retail Equity Research
Wabco, etc. need significant investments to be done for testing and other facilities in order to cater to OEMs exacting specifications.
Exhibit 13: Global auto component supplier tiering in brief
Tier CompanyAutomotive Revenue Products R&D
Robert Bosch GmbH $37 bn
Gasoline systems, diesel systems, chassis system controls, electrical drives, starter motors & generators, car multimedia,electronics, steering systems, battery technology, exhaust gasturbochargers and treatment systems $6 bn*
Denso Corp $34.2 bn Thermal, powertrain control, electronic & electric systems, small motors $3.6 bn
Magna International $30 bn Bodies, chassis, interiors, exteriors, seating, powertrain, electronics, mirrors, closures & roof systems & modules $120 mn
Motherson Sumi $5 bn Bumpers, rocker panel, instrument panels, door panels, cockpit modules, front-end modules $20 mn*
Gestamp Automocion $7.5 bn Body-in-white stamping & assemblies, chassis hinges, power systems NA
Bharat Forge $600 mn Crankshafts, I-beams, connecting rods, steerling knuckles, front axles $2.7 mn
Leoni AG $3 bn Wires & strands, optical fibres, cables, cable systems, wiring systems $150 mn
GKN Drivelines $2.6 bn Sideshafts, propshafts, torque management systems and geared components $78 mn
Ahmednagar Forgings $230 mn* Forged camshafts, connecting rods, crankshafts, crown wheel, hub and shafts and high tensile fasteners NA
Tier 1
Tier 1.5
Tier 2 Source: Company, ICICIdirect.com Research All numbers are last reported annual numbers
The auto component industry can be classified in a three tier structure as follows: Tier 1 who are involved in integrated systems and are key enablers for OEMs and manufacture multiple auto components, Tier 2 supply auto components to Tier 1 suppliers and finally Tier 3 use traditional method of manufacturing (negligible IT systems) involved in raw material and single component manufacturers to Tier 2. In some cases, OEMs themselves are in the Tier 1 group because of criticality of the component (where there is zero tolerance), the brand equity and capital investments being more. Global auto components witnessing consolidation trends… M&A activity in the automotive supply chain is set for further growth in the coming years. This is in part due to pressure from OEMs that want their suppliers to build scale through acquisitions. As OEMs have assembly plants in different parts of the world, automotive component manufacturers will naturally want to develop relationships with them, especially as production and sales volumes increase in markets such as China and India as well as the MINT countries of Mexico, Indonesia, Nigeria and Turkey. The merger is in-line with the global trend of consolidation in the auto ancillary segment. This has largely been due to the fact that increasing technology intensiveness necessitates a certain critical mass for the component manufacturer, which has led to a phase of consolidation in the auto ancillary business globally. In the past years, Indian companies like Bharat Forge, Amtek Auto, and Motherson Sumi have also been on an acquisition spree, reaching global scale by acquiring companies in Europe. Encouraged by automakers, suppliers are not just moving on the technology front. They are also becoming assemblers, building larger and more complex modules, consolidating parts that are then delivered just in time and in production sequence to the car companies’ assembly lines.

Page 11 ICICI Securities Ltd | Retail Equity Research
Exhibit 14: Global M&A activity in auto component segment
35.5
11.6 19
.6
10.2
9.2
4.4
214
278
303
236275
189
0
10
20
30
40
2007 2008 2009 2010 2011 2012
($ b
illion
)
150170190210230250270290310330
Disclosed deal value ($ billion) Deal volume
Source: PWC Automotive M&A Insights, ICICIdirect.com Research
A strong global Tier 1.5 supplier too big to ignore- In a sweet spot! Mahindra CIE post the unique alliance pushed itself ahead as a critical tier-1.5 supplier to OEMs, i.e. the criticality of its products lies between that of a tier-1 component supplier and tier-2 supplier. This also means that MCI does not need significant investments into large R&D projects or for creating component & assembly testing facilities. However, the criticality of the components supplied (crankshafts, steering knuckles, camshafts, etc) limits the competition that it faces via tier-2 suppliers, to a large degree. This puts MCI in a sweet spot in the component industry value chain as the Tier 1.5 suppliers’ have typically high RoCE with relatively strong customer stickiness and repeat business. Also, with global carmakers adopting a local for local approach in component sourcing, MCI’s scale advantage and increased geographic presence augurs well for its relationships with global clients like VW, GM, Ford, Volvo, Daimler, etc. Exhibit 15: Tiered structure of auto component industry
Source: Company, ICICIdirect.com Research
Although, the total deal value has shrunk after the strong
burst seen in 2007, the deal volume has not abated
underlying the trend of consolidation in the industry. We
believe, with the global economic recovery, this trend will only continue further
OEM
Tier 1
Tier 2
Manufacturing, designing, engineering and branding
System suppliers and integrators. High supplier power
Single-product supplier Low technology need Low price control
Tier 1.5 Sells components and assembly to OEMs (multi-technology, multi-product, large scale, good pricing power)

Page 12 ICICI Securities Ltd | Retail Equity Research
One of the top forgers in world:-Powerhouse with difference in the making! With the completion of the process, MCI will become one of the largest forgers in the world along with companies like ThyssenKrupp, Bharat Forge and Sumitomo Metals. With Mahindra's strong presence in the Indian passenger vehicle segment and the truck market in Europe coupled with CIE's strong presence in the passenger car market of Europe, Brazil, Mexico and other markets like America/China, the merged entity will have a wide geographic/segment presence, which is likely to lead to several benefits like synergy from common sourcing, servicing other Asian car makers from Indian operations, etc. Considering that MCI is moving increasingly towards being a multi-product auto ancillary company, and not just forging, would be a key benefit in our understanding. Thus, possibilities of an increase in content per existing customer and across newer customers increase the value proposition of MCI. We have seen a pattern of such an increase in companies like Motherson Sumi, which now supply numerous parts in a car. Thus, such a unique proposition would be unavailable even with the best domestic behemoths, who are majorly into forgings.
Exhibit 16: Global powerhouse….
63
New Mahindra-CIE Forgings Business
Main Products
CIE Forgings
Crankshafts + Spindles + Hubs for cars
Mahindra Forgings Europe
Axle Beams and other CV Forgings
Size (€ mn) 150 258
Mahindra Forgings India
Crankshafts + Steering Knuckles for cars + UVs
Key Markets Car crankshafts in Europe (~2.5mn pcs/ yr)
Commercial vehicle forgings in Europe
Forged crankshafts for cars/ UVs in India (~1mn pcs/ yr)
Source: Company, ICICIdirect.com Research
Exhibit 17: Global Competition!
MCI (| crore) FY13P Bharat Forge (| crore) Thyssen (€ billion)Sales 4943 5702 5.7EBIT 57 434 0.24EBIT Margin (%) 1.1 7.6 4.3Capital Employed 3306 4589 3 Source: Company, ICICIdirect.com Research ThyssenKrupp data refers to Component Technology for SY13 Bharat Forge financials are FY13 reported earnings. FY13P~FY13 provisional data as per our consolidation

Page 13 ICICI Securities Ltd | Retail Equity Research
The TILA factor: - “Global presence” We believe MCI’s greatest advantage lies in its significant geographic spread, which has the “There Is Little Alternative” factor associated with it. With a presence ranging across Europe, Latin America (LatAm), North America Free trade Agreement (Nafta) region and Asia the alliance produces a company with limited competition in terms of presence. With customers seeking global suppliers for global platforms (OEMs and Tier1s) but with local presence in markets to enable localisation, it becomes imperative for suppliers to be close to the major markets. OEMs are increasing assembly operations across the world. Thus, automotive component manufacturers will naturally want and have to develop relationships with them, especially as production and sale volumes increase in markets. Thus, other than ThyssenKrupp, Sumitomo Metals no domestic player would be able to cater to customers in such a similar vein.
Exhibit 18: Geographic presence of CIE Auto and Mahindra Systech
Source: Company, ICICIdirect.com Research
With plans to consolidate complete forging related business into MCI Autometal is expected to incorporate its forging plants into Mahindra CIE Automotive after MCI is able to turn around financials as per CIE’s targets. These plants also have ~€100-120 million revenues which can get added to in future. Mahindra CIE Automotive is, as per CIE, expected to reach a debt/EBITDA of <1.7x (5.1x FY13). In this first phase, CIE has merged the European business only considering its geographic proximity to Mahindra Forgings Europe (MFE) and, thus, presence of management bandwidth for the turnaround. In the next phase, after these critical metrics are achieved

Page 14 ICICI Securities Ltd | Retail Equity Research
there are three more plants for consideration of merger: one in Brazil, one in Mexico and another in China. By the time Mahindra CIE Automotive reaches the required ratio level, Autometal’s plants should have reached maturity. The decision for merger, however, remains with Autometal though the parent remains the same in both cases.
Exhibit 19: Autometal's presence across geographies
Source: Company, ICICIdirect.com Research
Why was CIE interested in this deal? The merger can be looked at from CIE’s perspective as Mahindra Systech allows it to i) reach new markets via the forging segment in potential markets as well as gear segment in Europe and Asia, a high technology segment, ii) boost its presence in existing markets through potential new clients and products (e.g. Europe, Asia, heavy and agricultural vehicles), iii) expand geographically into countries such as Thailand and Indonesia, and iv) obtain gains through synergies, which we consider the main and fastest benefit arising from the deal. Strong twin parentage leads to significant turnaround possibilities In any turnaround scenario, the management’s ability to take hard decisions lies at the core. In today’s global world, we are witnessing a few Indian auto component companies (Motherson Sumi, Bharat Forge) going global and succeeding greatly. Such foreign acquisition led growth, however, always runs the risk of failures owing to lack of management bandwidth and cross cultural differences or lack of market understanding. In MCI’s case, a big positive emanates from the fact that M&M and CIE remain jointly invested in the growth of the company. Thus, this provides strong support needed to grow in markets where each of them lacks direct expertise. CIE capability and track record of strong turnarounds
CIE’s group history shows that focus on financial performance is core to its own fundamentals. They have targets of >10% EBIT margins and >20% RoCE for businesses across the globe. Historically, they have stayed away from high growth, which could risk the parent’s balance sheet. The key points on CIE’s management differentiators are:-
Lean and decentralised management- With CIE, the acquired business is treated as a distinct SBU that needs to grow in its own rights. CIE Automotive views each plant as a complete profit centre, in-charge of its own P/L and revenues.

Page 15 ICICI Securities Ltd | Retail Equity Research
Low corporate overheads- The decentralised nature of operations has an effect on the corporate’s overheads while at the group level the company has less than 1% of sales as corporate overheads. They tend to provide long term incentives for top management. This reflects the high focus on accountability and productivity. However, they provide a strong variable compensation component for all labour depending on performance. High experience in company integration- CIE has a successful track record of acquisitions, which have helped drive its growth over the past decade. This success has much to do with the company’s basic acquisition philosophy, which differs from the approach adopted in the sector. It looks at things like ability to generate EBITDA in three years, which can cover the cost of acquisition, thereby having an operational payback period of about three years. Maintain operational performance at all costs- CIE’s management is known to never leave any lever unturned to improve profitability. Their focus on costs makes them remain equally profitable in good as well as bad times as evident from the exhibit below. Even during the European crisis when many auto component companies like Visiocorp, Peguform (acquired by Motherson Sumi) went deep into the red CIE managed to raise EBITDA margins by ~500 bps to pre-crisis levels. Currently, all its plants are healthy with CIE generating an overall operating margin of ~14-15%. This has been achieved despite the absence of machining in the forging business.
Exhibit 20: Consistent revenue CAGR in 2002-12 at ~13%
481570
670782
910
11091016
1429
16731562
1261
0
200
400
600
800
1000
1200
1400
1600
1800
2002 2003 2004 2005 2006 2007 2008 2009 2010 2011 2012
(Eur
Mn)
13%
Source: Company, ICICIdirect.com Research
Exhibit 21: Consistent operational performance at ~16% CAGR (2002-12)
53
8091
116133
157
116
234224
193181
11
14 1415 15 14 14
141414
11
0
50
100
150
200
250
2002 2003 2004 2005 2006 2007 2008 2009 2010 2011 2012
(Eur
Mn)
0
2
4
6
8
10
12
14
16
16%
Source: Company, ICICIdirect.com Research
CIE’s management also has strict commandments on B/S in which they look at FCF>40% of EBITDA/ RoCE of >20%, debt/EBITDA <2x. In case of CIE it has ~1.8x of net debt/EBITDA (not-inclusive of MCI impact). M&M’s presence as partner provides strategic edge… This partnership between CIE and M&M is unique in the case of the latter as it has ideally never looked at minority stakes in companies that it has been interested in the long term. In this case, with a stake of ~20% in MCI and ~13.5% stake in CIE Automotive Spain, M&M has effective economic interest of ~25%. We feel M&M, led by Anand Mahindra, has constantly endeavoured to create a scale in the auto components business, which can aid the core automotive business. M&M is reputed in India as an efficient allocator of resources and cost manager. Thus, the integration of Systech companies would lead to increased content supply possibilities from OEMs. As M&M is also an OEM it brings a different approach to strategy and product development along with the components expertise of CIE. We feel this collaboration can turn out to be a big win-win situation for all stakeholders.

Page 16 ICICI Securities Ltd | Retail Equity Research
Exhibit 22: Autometal’s financial story in brief
1099 1243
1274 15
70
1563
1613
2553
102 85 110 137 184 157 137
18.0
15.016.9
19.2 18.717.0
13.9
0
700
1400
2100
2800
FY07 FY08 FY09 FY10 FY11 FY12 FY13
(| c
rore
)
0
5
10
15
20
25(%
)
Revenues PAT OPM
Source: Company, ICICIdirect.com Research
The industry witnessing a slowdown and adverse raw
materials prices hurting sentiments, coupled with
manufacturers pressing to maintain vehicle prices led to a
direct impact on margins. However, with additional cost
control efforts undertaken by Autometal, it was able to
maintain margins, which highlights the focus on stable
profitability across business cycles
Autometal – A classic case of CIE’s ambitions of globalising with acquisitions Founded in 1964, Autometal started its operations producing and selling components and accessories for the domestic automotive industry. In 2000, the CIE Automotive group purchased a 50% stake of the share capital of Autometal. In 2003, by acquiring the remaining shares of Autometal and creating CIE Autometal, the CIE Automotive group became the controller of Autometal’s operations in Brazil. CIE Automotive today is present in 14 countries and controlled by INSSEC, an investor group. CIE Automotive started its Brazilian operations in 2000, through the purchase of 50% of Autometal and completed 100% acquisition in 2003. Between 2000 and 2010, Autometal acquired companies with operations in Brazil and Mexico while post the IPO in FY11, Autometal has focused outwards and on opportunities in China and the US. The purpose of the IPO was to prepare a war chest for further acquisitions. The combination of these acquisitions and the strong organic growth throughout this period led the company to report revenues above R$2.5 billion (Brazilian real) in 2013. Autometal has had an impressive track record of topline and EBITDA growth (CAGR of 20% and 17%, respectively, in 2006-13), with strong RoIC of ~20%. The consistency of the financial performance even during the 2008 crisis showing that the company successfully navigated the economic and automotive downturn, has underlined Autometal’s inherent operating strength and tight cost control. The strong EBITDA CAGR reflects not only the organic growth fuelled by the expansion of the automotive industry in Brazil and Mexico but also new product development and acquisitions. Three case studies highlight Autometal’s turnaround capability: Autoforjas (2006): After three years of investment, revenues increased from R$105 million to R$140 million (33%) with higher customer diversification. EBITDA increased 55% through cost reduction and efficiency improvements. Superior quality technology was transferred from Spain Nakayone (2007): After two years of investment, EBITDA has increased 35% through the cancellation of non-profitable products and increase in production of more value-added products. Dependence on one client that used to contribute ~80% to sales reduced to 25% as the company garnered eight clients Pemsa (2007): After three years of investment, revenues have increased 200% with an increase of 3x in EBITDA as Autometal took the decision of tapping new clients by launching new products. It also entered the painting business in Mexico

Page 17 ICICI Securities Ltd | Retail Equity Research
Exhibit 23: Autometal's journey with CIE’s management
Source: Company, ICICIdirect.com Research
How will this turnaround happen?
CIE starts to harness synergies and focuses on cost! The merger can be looked at from CIE’s perspective as Mahindra Systech allows it to i) reach new markets via the forging segment in potential markets as well as gear segment in Europe and Asia, a high technology segment ii) boost its presence in existing markets through potential new clients and products (e.g. Europe, Asia, heavy and agricultural vehicles), iii) expand geographically into countries such as Thailand and Indonesia, and iv) obtain gains through synergies, which we consider the main and fastest benefit arising from the deal.
Exhibit 24: New client & product opportunities
New ProductsNew Global Customers:Market leaders
E.g: Cross Car beams,Common rails, Oil pans
Source: Company, ICICIdirect.com Research
Page 18 ICICI Securities Ltd | Retail Equity Research
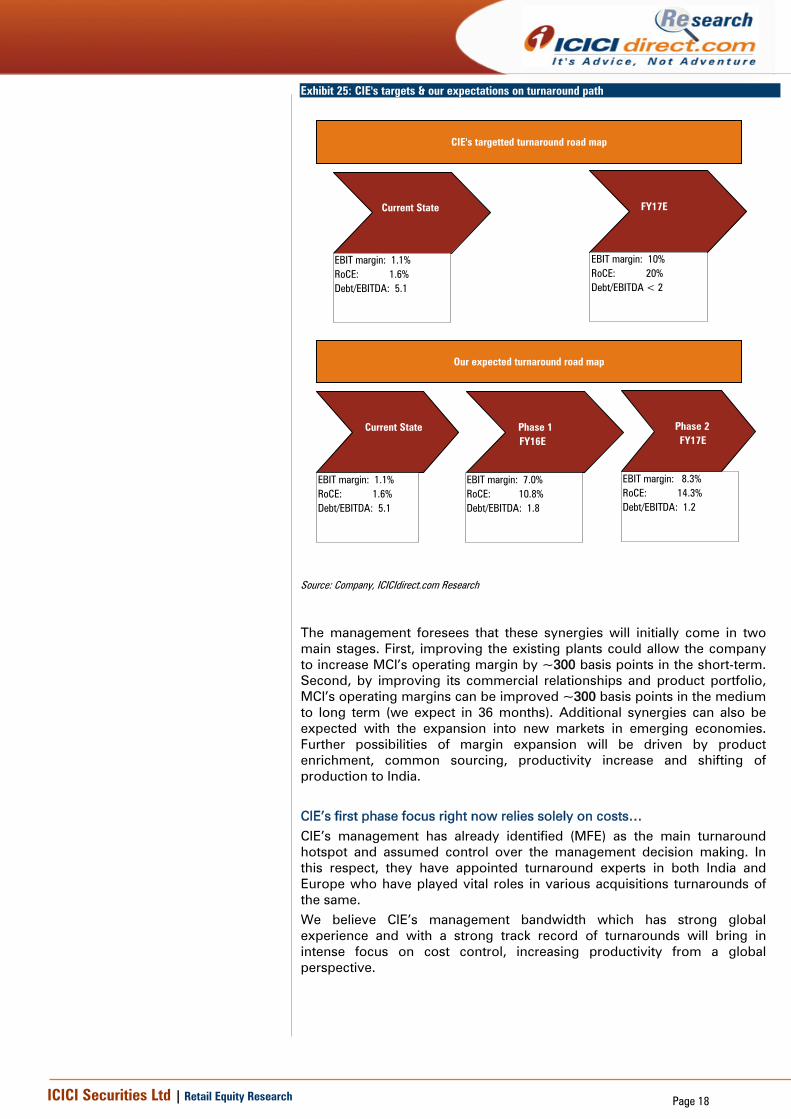
Exhibit 25: CIE's targets & our expectations on turnaround path
Current State FY17E
EBIT margin: 1.1%RoCE: 1.6%Debt/EBITDA: 5.1
EBIT margin: 10%RoCE: 20%Debt/EBITDA < 2
Current State Phase 1 FY16E
Phase 2 FY17E
EBIT margin: 1.1%RoCE: 1.6%Debt/EBITDA: 5.1
EBIT margin: 7.0%RoCE: 10.8%Debt/EBITDA: 1.8
EBIT margin: 8.3%RoCE: 14.3%Debt/EBITDA: 1.2
CIE's targetted turnaround road map
Our expected turnaround road map
Source: Company, ICICIdirect.com Research
The management foresees that these synergies will initially come in two main stages. First, improving the existing plants could allow the company to increase MCI’s operating margin by ~300 basis points in the short-term. Second, by improving its commercial relationships and product portfolio, MCI’s operating margins can be improved ~300 basis points in the medium to long term (we expect in 36 months). Additional synergies can also be expected with the expansion into new markets in emerging economies. Further possibilities of margin expansion will be driven by product enrichment, common sourcing, productivity increase and shifting of production to India. CIE’s first phase focus right now relies solely on costs… CIE’s management has already identified (MFE) as the main turnaround hotspot and assumed control over the management decision making. In this respect, they have appointed turnaround experts in both India and Europe who have played vital roles in various acquisitions turnarounds of the same. We believe CIE’s management bandwidth which has strong global experience and with a strong track record of turnarounds will bring in intense focus on cost control, increasing productivity from a global perspective.

Page 19 ICICI Securities Ltd | Retail Equity Research
Exhibit 26: Brief highlight on who is dragging?
Geography CompaniesRevenues (| crore)
EBITDA(| crore)
EBITDA margin (%) Revenue EBITDA
Mahindra Forgings Europe 1,702.1 -2.7 -0.2 34.4 -0.8
CIE Forgings 1,042.4 139.0 13.3 21.1 41.9
Metalcastello 402.2 44.9 11.2 8.1 13.5
Mahindra Forgings India 394.7 43.0 10.9 8.0 13.0
Mahindra Gears India 105.8 10.9 10.3 2.1 3.3
Mahindra Hinoday 478.8 25.8 5.4 9.7 7.8
MUSCO (Stampings) 766.4 69.1 9.0 15.5 20.8
Mahindra Composites 50.3 1.8 3.6 1.0 0.5
Total Mahindra CIE Automotive 4,942.7 331.9 6.7 100.0 100.0
India
Europe
FY13Contribution to consolidated(%)
Source: Company, ICICIdirect.com Research
Priority No.1 Hot Spot Priority No.2Hot Spot Priority No.3 Hot Spot
Europe:- MFE identifies first addressable point:- MFE remains the biggest hotspot in the consolidated MCI entity making an EBITDA loss of ~| 3 crore (€-0.4 mn) for FY13. One of the major challenges in the operating performance is the unnervingly high employee costs. Our analysis has highlighted the fact that cultural differences between the German entity and erstwhile promoters M&M had led to a lack of reduction in these costs even as sales witnessed declines since FY09, thus causing sharp declines in EBITDA. In comparison, CIE’s management, considering its European expertise, has laid out a clear path towards the reduction on the same. The first signs of the same are visible:-CIE is looking to review performance of the top level management as part of the employee cost reduction process. The company is looking at reducing its temporary workforce, which stands at >200 employees for a total employee base of 1300 employees. This could possibly lead to minimum cost savings of €8-10 million (~| 60-80 crore). Exhibit 27: MFE's sticky labour costs
545
517
341 39
9 551 593
25.9 25.8
33.2
25.527.5
33.4
0
100
200
300
400
500
600
700
FY08 FY09 FY10 FY11 FY12 FY13P
(| c
rore
)
0
5
10
15
20
25
30
35
40(%
)
Employee Cost Employee cost as a % of sales
Source: Company, ICICIdirect.com Research
We estimate a gradual reduction in the same, with employee cost as percentage of sales coming down ~600 bps over the next 36 months as CIE finds ways of reducing the flab and increasing overall productivity per employee. Along with employee cost reduction MFE would also have annual grants from German government amounting to ~€4-5 million due to migration to expensive renewable energy sources for plants.
If we look at Exhibit 22 it is evident that MFE is the major
hot spot for MCI. It has revenue contribution of nearly
~35% to the total business but on the EBITDA front for
FY13 it contributed ~ (1%). This is the key trigger for the
same turnaround, which can successfully make financials look drastically different

Page 20 ICICI Securities Ltd | Retail Equity Research
Along with these savings of ~€12-14million CIE also would look to increase cross sourcing, new products in the European business, which would help improve gross margins and look at removing unprofitable platform lines, if necessary, till FY16E/17E. Thus, on the EBITDA front, we expect MFE to witness EBITDA improvement to ~| 240 crore by FY17E with EBITDA margins of ~10% during the same. Revenue expectations moderate in Europe even as recovery probable! A gradual economic recovery in Portugal, Spain and Italy has boosted auto demand with February witnessing a sixth consecutive month of growth in car sales for the European Union (EU) and European Free Trade Association (EFTA). Europe's car industry has endured a six-year slump, with auto sales falling to a two-decade low, as austerity-hit consumers cut back on expensive purchases. The growth in car sales has been primarily as a result of a mild recovery in the economy and discounts offered by mass car brands. Any sustenance of the economic recovery is likely to lead to an improvement not only in car sales but also in the sale of light trucks, which will augur well for MFE. Exhibit 28: European passenger car growth trend
17.3
17.3
18.3
17.2
15.218
.6
19.6
18.5
18.1
18.3
5.9
13.3
-0.1-5.2
3.1-1.0 2.1
6.1
-5.2
-18.2
0
5
10
15
20
25
2013201220112010200920082007200620052004
(milli
on u
nits
)
-20
-15
-10
-5
0
5
10
15
20
(%)
Passenger Cars Growth (%)
Source: Company, ICICIdirect.com Research
Exhibit 29: European commercial vehicle growth trend
2.32.42.
8
2.5
1.8
3.43.5
3.3
3.2
3.0
9.8
40.1
-3.0-13.3
8.7 5.84.2
6.5
-3.8
-46.5
0
1
2
3
4
2013201220112010200920082007200620052004
(milli
on u
nits
)
-60
-40
-20
0
20
40
60
(%)
Commercial vehicles Growth (%)
Source: Company, ICICIdirect.com Research
The European car segment saw a sustained drop in
volumes in CY12, CY13. However, growth momentum
picked up in the later half of the year while CY14 has also
begun well with cash for clunkers scheme in Spain and
other discounts/incentives aiding demand
The European commercial vehicle segment has been
under pressure with the economic slump leading to a
continued drop in CY12, CY13.However, with a change in
emission norms in Europe, there has been a round of pre-
buy leading to better numbers in CY14E

Page 21 ICICI Securities Ltd | Retail Equity Research
MFE and CIE-Forgings Europe have possibilities also on client mining considering both these entities are working for a separate set of clients. The former is primarily focused on the commercial vehicle side with major clients like Volvo and Daimler while the latter is focused on the passenger vehicle side with major clients like Volkswagen, Renault, General Motors, BMW, Ford, etc. India:- India business also to gain as Systech unification to provide cost levers! Mahindra Systech has been in place from 2003 onwards. However, all companies were managed via different managements, which could not fully capitalise on content opportunities and common sourcing opportunities. Post the merger of all companies-“forgings, stampings, gears, castings & magnetic, composites” it creates a domestic entity, which possibly has a revenue size of ~| 1800 crore & raw material requirements to the tune of ~| 1130 crore. We feel significant savings (~5-10% over longer term) could accrue as sourcing systems get centralised, thereby leading to margins improvement. On the revenue side, the increase of product portfolio of the overall entity would aid increased selling opportunities to existing OEMs like Tata Motors, M&M along with new global MNCs. India automotive recovery: 60% market share in PV segment Mahindra Forgings India enjoys ~60% share in the Indian passenger vehicle business in the crankshafts segment. Thus, any improvement in the domestic demand scenario will aid MCI’s capacity utilisation levels and, thereby, improve the profitability of the business as ~25% of the revenue comes from Indian operations. We believe the domestic PV industry should witness~8-10% growth in FY15E owing to the better performance on the back of an economic recovery and several key new product launches. MFL also supplies to the tractor segment where it has market share in excess of 40% and supplies to primarily M&M and Swaraj. Exhibit 30: Domestic PV sales trend over years
10.3 12.3
13.2 15
.8 17.7
18.9 24
.0 29.5
31.4
32.3
32.4
19.0 19.8
27.0
7.3
12.0
6.9
22.9
2.96.5
0
5
10
15
20
25
30
35
FY04 FY05 FY06 FY07 FY08 FY09 FY10 FY11 FY12 FY13
(in la
kh u
nits
)
0
5
10
15
20
25
30
35
(%)
PV Domestic Sales Growth (%)
Source: Siam, Company, ICICIdirect.com Research
Stampings, gears & castings to witness customer/content increases… Major ongoing and forward capex (~| 250 crore) is primarily for non-forging entities in order to attain scale and target new customers. The benefits of the same will start accruing post-FY14E, e.g. Pune facility of gears for Tata Motors and the castings facility for Zahirabad facilities (ramp-up for M&M’s tractors). We believe this would have an impact on both revenues as well as an improvement in the bottomline. Further investments are also required to be made to increase the content by adding new products targeting newer global CIE clientele.
Domestic PV sales have grown slowly in the past couple of
years, with FY14E witnessing negative growth rates for
most of the months. This has been largely due to the
economic slowdown. We believe, going ahead, the PV
segment growth is likely to pick up from H2FY15E as
sentiment improves on possible rate cuts and an improvement in the overall economy

Page 22 ICICI Securities Ltd | Retail Equity Research
Brief on how major metrics may look like geographically!
Exhibit 31: Company-wise financial forecasts
Europe Mahindra Forgings Europe 1,702 -0.2 2,148 8.8 2,239 10.2
India Mahindra Forgings India 395 10.9 508 16.1 580 17.6
Mahindra Forgings Limited 2,216 1.9 -113 -4.4 2,808 10.2 117 12.9 2,980 11.8 177 17.6
Europe CIE Forgings 1,042 13.3 39 12.7 1,281 13.9 67 15.4 1,315 13.9 71 15.9
Europe Metalcastello 402 11.2 440 14.3 465 15.0
India Mahindra Gears India 106 10.3 154 14.8 172 15.8
Mahindra Gears 508 11.0 -21.5 -0.5 594 14.5 19.5 3.4 637 15.8 26.1 4.1
India Mahindra Hinoday 479 5.4 -21.4 0.4 598 9.4 14.4 11.3 659 10.0 22.6 14.4
India MUSCO (Stampings)* 766 9.0 15.2 18.5 966 11.4 62.1 21.1 1,095 13.3 86.2 25.3
India Mahindra Composites 50 3.6 -0.9 0.1 57 4.6 -0.1 0.5 65 7.2 1.8 1.7
Region Companies
FY13P
Revenues (| crore)
EBITDA margin (%)
PAT (| crore) RoCE(%)
FY16E
Revenues (| crore)
EBITDA margin (%)
PAT (| crore) RoCE(%)
FY17E
Revenues (| crore)
EBITDA margin (%)
PAT (| crore) RoCE(%)
Source: Company, ICICIdirect.com Research FY13 numbers are consolidated * Adjusted financials
Europe: Earnings growth led by MFE, Metalcastello amortisation a constraint- We believe Europe will benefit from a modest recovery in both new user registrations and replacement demand owing to emission changes and improvement in economic sentiment. As highlighted earlier, a lot of new product launches are expected to happen across both CV and PV space from major OEMs like Volvo, VW, Daimler, etc. In spite of these possibilities we have built in modest revenue growth estimates for MFE, Metalcastello, CIE Forgings (4-6% CAGR in FY13-17E each in euro terms) to maintain margin of safety on our turnaround assumptions. On the reported profit front, we may see Metalcastello optically dragging profits somewhat due to higher amortisation charge. The reason for the same is that Italian law mandates it to amortise any kind of goodwill on the books even though the company is performing well on the operating front. The current goodwill on the books is ~| 400 crore while the amortisation rate is ~| 12-13 crore per annum. India: To witness recovery led by forgings business even as new gears & stampings capacity ramp up- We believe the Indian automotive market has latent demand possibilities. Post elections, the same may possibly become evident. We estimate the market will witness growth of ~7-9% led by the PV space at ~8-10%. We believe that in MCI’s case in India strong possibilities emerge for both content increase as well as new client additions like Ford, VW and GM due to CIE. On estimates, however, we have factored in only ~7-12% CAGR FY14E-17E across various businesses.

Page 23 ICICI Securities Ltd | Retail Equity Research
Key financials: Turnaround in financials to be key
Revenue growth to be modest as Europe & Indian challenges remain The Mahindra CIE entity post merger completion will have ~60:40 ratio towards geographic mix outside/within India. The revenue growth possibilities on favourable macros in Europe and India remain key upside risks. However, we have factored in moderate revenue growth of ~4-6% CAGR (FY13-17E) in the European business while India is expected to witness a recovery post elections to the tune of ~10% CAGR (FY13-17E). On an overall basis, we expect machining, export mix to improve ~500 bps from ~20%, 5%, respectively. The strongest revenue segmental drivers would continue to remain the forgings entity (~7% CAGR in FY13E-17E) followed by the gears, stampings business (5.8%, 9.3% CAGR in FY13E-17E, respectively). On an overall basis, we expect revenue growth to be 4.6%, 6.6% and 7.1% for FY15E, FY16E and FY17E, respectively.
Exhibit 32: We build modest revenue growth at 7.5% CAGR in FY13E-17E
5,51
6 6,59
0
4,94
3
5,77
1
6,15
2
11.6
4.6
6.67.1
-
1,000
2,000
3,000
4,000
5,000
6,000
7,000
FY13P FY14E FY15E FY16E FY17E
(| c
rore
)
-
2
4
6
8
10
12
14
(%)
Net Sales % increase
Source: Company, ICICIdirect.com Research
With Europe contributing ~65% of revenues post the CIE forgings merger, a recovery in Europe will bode well for MCI’s growth prospects for both the forgings as well as the gears business.
Exhibit 33: Geographic revenue mix to see Indian share increase…
63.7 66.3 64.7 62.9 61.0
36.3 33.7 35.3 37.1 39.0
0
20
40
60
80
100
FY13P FY14E FY15E FY16E FY17E
(%)
Europe India
Source: Company, ICICIdirect.com Research
Exhibit 34: …product mix in revenues to remain steady
64.4 67.3 66.2 64.9 63.6
10.0 9.1 9.3 9.4 9.49.5 8.6 9.1 9.5 9.8
15.1 14.1 14.6 15.3 16.21.00.90.90.91.0
0
20
40
60
80
100
FY13P FY14E FY15E FY16E FY17E
(%)
Forgings Gears Castings/Magnets Stampings Composites
Source: Company, ICICIdirect.com Research
The estimates for revenue growth are based on our
forecasts for the Indian auto industry, especially the
passenger vehicle and commercial vehicle segments. For
the European business, we have built in modest 4-6% CAGR in FY13-17E, as growth in Europe revives
Page 24 ICICI Securities Ltd | Retail Equity Research
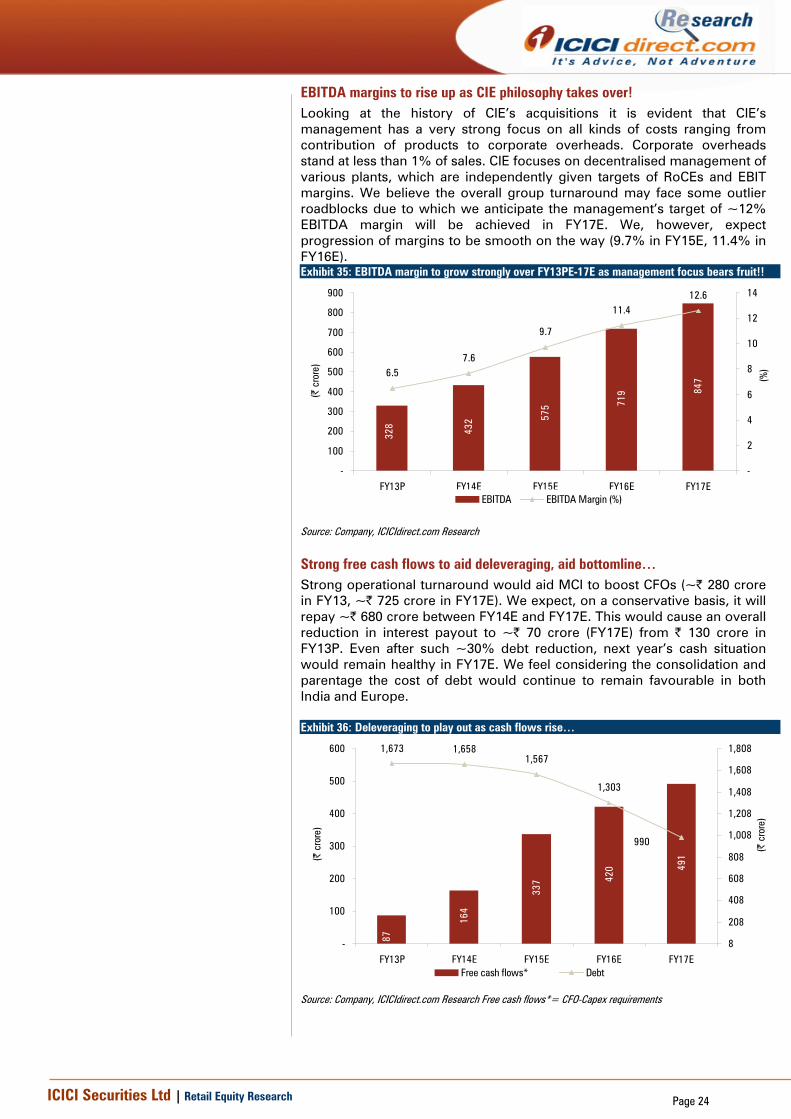
EBITDA margins to rise up as CIE philosophy takes over! Looking at the history of CIE’s acquisitions it is evident that CIE’s management has a very strong focus on all kinds of costs ranging from contribution of products to corporate overheads. Corporate overheads stand at less than 1% of sales. CIE focuses on decentralised management of various plants, which are independently given targets of RoCEs and EBIT margins. We believe the overall group turnaround may face some outlier roadblocks due to which we anticipate the management’s target of ~12% EBITDA margin will be achieved in FY17E. We, however, expect progression of margins to be smooth on the way (9.7% in FY15E, 11.4% in FY16E). Exhibit 35: EBITDA margin to grow strongly over FY13PE-17E as management focus bears fruit!!
432 57
5 719 84
7
328
6.57.6
12.6
9.7
11.4
-
100
200
300
400
500
600
700
800
900
FY13P FY14E FY15E FY16E FY17E
(| c
rore
)
-
2
4
6
8
10
12
14
(%)
EBITDA EBITDA Margin (%)
Source: Company, ICICIdirect.com Research
Strong free cash flows to aid deleveraging, aid bottomline… Strong operational turnaround would aid MCI to boost CFOs (~| 280 crore in FY13, ~| 725 crore in FY17E). We expect, on a conservative basis, it will repay ~| 680 crore between FY14E and FY17E. This would cause an overall reduction in interest payout to ~| 70 crore (FY17E) from | 130 crore in FY13P. Even after such ~30% debt reduction, next year’s cash situation would remain healthy in FY17E. We feel considering the consolidation and parentage the cost of debt would continue to remain favourable in both India and Europe. Exhibit 36: Deleveraging to play out as cash flows rise…
164
337 42
0 491
87
1,673 1,6581,567
1,303
990
-
100
200
300
400
500
600
FY13P FY14E FY15E FY16E FY17E
(| c
rore
)
8
208
408
608
808
1,008
1,208
1,408
1,608
1,808(|
cro
re)
Free cash flows* Debt
Source: Company, ICICIdirect.com Research Free cash flows*= CFO-Capex requirements

Page 25 ICICI Securities Ltd | Retail Equity Research
No major capital expenditure as focus moves to raising efficient utilisation! With majority of the capex already done and capacities having sufficient headroom, there would be no major capex outflow, which would augur well for improving utilisation levels and, thereby, providing another lever for earnings as asset utilisation improves. For the next two or three years, we believe the investment requirement for capex would be ~| 250 crore, of which ~50% would be maintenance capex. This would further free up cash flows, which augurs well for deleveraging as well as improving dividend payouts. Exhibit 37: Capex spends and utilisations trend
272
229 244
234
290
7369
84
7378
-
50
100
150
200
250
300
350
FY13P FY14E FY15E FY16E FY17E
(| c
rore
)
8
18
28
38
48
58
68
78
88
(%)
Capex Utilisation
Source: Company, ICICIdirect.com Research
Strong room for non-linear profit growth! The operating and financial revival of hotspots like MFE can have a significant impact on profitability of the overall business. We expect this to happen, albeit at a pace slower than being targeted by CIE’s management. We expect profits after MI (PE stake in Metalcastello) to gallop to ~| 385 crore in FY17E with PAT margins improving ~540 bps from FY14E-17E to 5.7%. The path to this improvement could see FY15E, FY16E witnessing PAT margins of 2.8%, 4.0%, respectively. We expect PAT to rise at ~92% CAGR in FY14E-17E and ~131% CAGR in FY14E-16E. Exhibit 38: Profit to start pumping in as operational improvement kicks in!!
177 29
0 384
(91.5)
28.7
1.0
5.7
(1.8)
3.0
4.6
-200
-100
-
100
200
300
400
500
FY13P FY14E FY15E FY16E FY17E
(| c
rore
)
-3
-2
-1
-
1
2
3
4
5
6
7(%
)
PAT PAT Margin (%)
Source: Company, ICICIdirect.com Research

Page 26 ICICI Securities Ltd | Retail Equity Research
CIE’s management control to increase dividend payout! CIE’s philosophy of decentralised operations minimises corporate overhead as the onus of profitability shifts to individual plants that act as standalone profit centres. This reflects a high focus on accountability and running a tight control on costs. Also, CIE’s average dividend payout is ~40-50%, despite growing aggressively through acquisitions. We believe MCI’s dividend payout will also improve as no major capex has been planned for the next two or three years. We, however, expect the dividend payout to reach ~40% for both FY16E and FY17E. Exhibit 39: Dividend payouts to increase, going ahead
47
114
152
-
11
20
40
27
40
-
20
40
60
80
100
120
140
160
180
FY13P FY14E FY15E FY16E FY17E
(| c
rore
)
8
13
18
23
28
33
38
43
(%)
Dividend outlay Payout ratio
Source: Company, ICICIdirect.com Research
Strong working capital controls as CFO/EBITDA strong! CIE’s philosophy of decentralised operations not only minimises corporate overhead but also makes the plant manager responsible for all operational/financial decisions. This ensures high accountability and tight control on costs as well as better working capital management. CIE’s CFO/EBITDA stands at ~90%. Currently, MCI’s CFO/EBITDA stands at 85%. We expect a further improvement in the working capital cycle, which is likely to further boost operating cash flows. Exhibit 40: CFO/EBITDA ratio above ~80%
378
536 63
5 725
279
85.0 87.5 85.588.393.2
-
100
200
300
400
500
600
700
800
FY13P FY14E FY15E FY16E FY17E
(| c
rore
)
8
18
28
38
48
58
68
78
88
98(%
)
CFO CFO/EBITDA
Source: Company, ICICIdirect.com Research

Page 27 ICICI Securities Ltd | Retail Equity Research
Finally, how much of CIE’s targets are we forecasting? The growth in profits and subsequent deleveraging in MCI is expected to lead to both RoCEs expansion and debt/EBITDA reduction. We firmly believe the conjoined efforts of strong promoters-(CIE and M&M) will lead to significant synergies. However, we are still cautiously estimating ~75-80% targeted turnaround of financial metrics till FY17E. We expect FY17E to witness ~8% EBIT margins, ~14% RoCE and ~1.2x Debt/EBITDA ratio.
Exhibit 42: EBIT margins and debt/EBITDA
1.1
3.0
5.1
7.0
8.3
5.1
3.8
2.7
1.8
1.20
1
2
3
4
5
6
7
8
9
FY13P FY14E FY15E FY16E FY17E
(%)
-
1
2
3
4
5
6
(x)
EBIT Margin(%) Debt/EBITDA
Source: Company, ICICIdirect.com Research
Exhibit 43: …return ratios also on uptrend
1.6
3.9
7.0
10.8
14.3
(5.6)
2.3
7.1
11.4
14.4
0
2
4
6
8
10
12
14
16
FY13P FY14E FY15E FY16E FY17E
(%)
-10
-5
-
5
10
15
20
(%)
RoCE RoE
Source: Company, ICICIdirect.com Research
Risk & concerns Issues relating to management collaboration & cultural integration
One of the key issues in relation to any merger or acquisition is management bandwidth, roadblocks in integration of management philosophies and work style that could be a key concern. The reason we feel this is a major concern stems from the fact that M&M even after acquiring MFE could not successfully reduce costs in Germany. Cultural roadblocks were one of the reasons for the same, which we believe would not be a major issue with CIE’s European nature. Sharp declines in revenues in Europe and India cause delay in turnaround
The European and Indian automotive market has been weak to say the least in the last couple of years. Though we have seen some good pre-buying effect for CV segment in Europe on account of emission norms change the consistency of the same is a risk. In India, the automotive space for the last two years has seen moderate growth due to high fuel prices and interest rates along with weak economic growth. The macro scenario worsening can cause a delay in turnaround as revenue stability is essential. Retrenchment of top management in India
Though we have highlighted and lauded CIE’s management philosophy of de-centralising power and reducing corporate overheads we feel India as a country is unique. Considering CIE’s nascent knowledge there should not arise any situation of top management removal or discontent as the M&M management’s domestic understanding is second to none.
Change in Italian law mandating aggressive write-off on goodwill
MCI’s Italian subsidiary Metalcastello is strong on the operational performance front. However, Italian accounting laws mandate for amortisation of goodwill in ~20 years. In case any future change of mandates towards increased amortisation happens that could lead to a decline in reported profits even as cash profits would remain strong.
Exhibit 41: CIE targets and our expectations! Key metrics CIE Targets Our expectationsEBIT margin (%) 10.0 8.3 RoCE (%) 20.0 14.3 Debt/EBITDA <1.7 1.2
Source: Company, ICICIdirect.com Research

Page 28 ICICI Securities Ltd | Retail Equity Research
Possible multiplier in financials to reflect in price & multiples! Mahindra CIE Auto is a unique case of valuation considering the massive turnaround possibilities in the company and we are factoring in the same. We expect the turnaround to be significant, as according to our estimates there will be non-linear profit growth at ~92% CAGR in FY14E-17E. MCI would have a path of increasing efficient and profitable utilisation with low capex over the next two or three years. CFOs are expected to balloon to ~| 600-700 crore (FY16E-17E). We expect significant increase in dividend payouts to ~40% in line with CIE’s philosophy of high dividend payouts (~40-50%).
Exhibit 44: Turnaround valuation a challenge!
Particulars Details Comments
PAT after MI FY17E (| crore) 384
Cost of equity (%) 13.0 As MCI consolidated history relevant now is unknown so we have ignored historical beta. We have ascribed it a30% higher beta of ~1.3x to BFL
PV of FY17E PAT after MI (| crore) 266.3The philosophy behind discounting FY17E to present value emerges from the fact that we would want to do justicto complete turnaround possibilities of the company. Thereby we would rather bank upon a clearer earningspicture than on multiples
Bharat Forge Current PE (x) (Trailing 12-month basis) 22
Discount to Bharat Forge (%) 25
Implied PE (x) MCI 16.5
Target Market Capitalisation 4394
Implied Target price post merger 135
EBITDA FY17E (| crore) 847
Debt FY17E (| crore) 990
Cash FY17E (| crore) 110
Cost of debt (%) 7.5MCI has majorly ~90% debt based in Europe which is serviced in local currency thereby no hedging risk
Cost of equity (%) 13.0As MCI consolidated history relevant now is unknown so we have ignored historical beta. We have ascribed it a30% higher beta of ~1.3x to BFL
WACC (%) 10.5The beauty of cheaper cost of capital emerges here as even with a debt inclined capital structure WACC for MCIis lower than WACC for BFL
PV of FY17E EBITDA (| crore) 628.1
PV of Debt FY17E (| crore) 733.4
PV of Cash FY17E (| crore) 81.5
Bharat Forge Current EV/EBITDA (x) (Trailing 12-month basis) 10.0
Discount to Bharat Forge (%) 25.0
Implied PE (x) MCI 7.5
Implied EV (| crore) 4710
Target Market Capitalisation 4059
Implied Target price post merger 125
Final combination Target price 130 We have given an equal weightage to both the methods
PE basis
The philosophy behind discounting FY17E to present value emerges from the fact that we would want to do justicto complete turnaround possibilities of the company. Thereby we would rather bank upon a clearer earningspicture than on multiples
Though we understand turnaround multiples have the tendency going sharply up in expectations of earnings ,have seen that in case of BFL during early 2000's when it was gaining size. But conservatively we have goneahead a discounted the muliples on mature peers
Though we understand turnaround multiples have the tendency going sharply up in expectations of earnings ,have seen that in case of BFL during early 2000's when it was gaining size. But conservatively we have goneahead a discounted the muliples on mature peers
EV/EBITDA
Source: Company, ICICIdirect.com Research
We feel MCI provides a rare, unique Indian auto component play, which has a global footprint with global promoters. We expect strong business prospects to fructify into a turnaround (PAT:-FY13 loss of ~| 92 crore to FY17E profit of ~| 385 crore), which would lead to a debt reduction of ~| 680 crore till FY17E (FY17E-debt/EBITDA: 1.2x, debt/equity: 0.4x FY13- debt/EBITDA: 5.1x, debt/equity: 1.0). We also factor in higher dividend payouts will rise to ~40% by FY17E in line with CIE’s policy of higher payouts. We forecast ~6% and ~92% CAGR in revenues and earnings, respectively, over FY14E-17E and value the stock on a combination of PE

Page 29 ICICI Securities Ltd | Retail Equity Research
and EV/EBITDA multiples to arrive at a target price of | 130. We have a BUY recommendation on the stock with an upside potential of 60%. We have valued MCI as highlighted earlier on a combinational basis of PE and EV/EBITDA, considering it is a turnaround company and we wanted to be more prudent on possibly valuation methodology anomalies. On an implied (post merger) market capitalisation of ~| 2630 crore, it has ~11% free cash flow yield (CFO-investments-interest paid) on PV basis of future FY17E basis. At the CMP of | 81, the stock is trading at ~9x PE FY16E, at a discount to domestic peers with global scale like Bharat Forge and Motherson Sumi possibly on account of uncertainty of the financial turnaround and actual numbers post merger. The parent company’s CIE Automotive SPA, Autometal BZ also trades at much higher valuations considering the strong financial metrics. We believe the same would pan out for MCI on the longer term as the market starts to factor in the pace of the turnaround. The only peer with a similar business profile is Bharat Forge, which is much more stable and mature in terms of financial profile. Though we have seen even ~40x kind of current multiples for the same during early 2000s when it was attaining scale and profitability, we have been conservative on ascribing such turnaround multiples to MCI. However, we completely believe the fact that as performance flows through in the coming quarters we can see a strong re-rating in the stock post completion of merger.
Exhibit 45: Peer valuation
Sales CAGR (%) PAT CAGR (%)
AY14E-16E AY14E-16E AY14E AY15E AY16E AY14E AY15E AY16E AY14E AY15E AY16E EV/EBIDTA (x)` P/E (x)` P/B (x)` PEG (x)Mahindra CIE Automotive 5.6 132 8 10 11 4 7 11 2 7 11 3 9 2 0.1
CIE Automotive SPA 5.8 29 12 13 14 10 10 11 13 16 17 5 10 2 0.4
Autometal SA 1.9 2 13 14 15 11 12 12 14 17 18 4 7 1 4.0
Linamar Corp 0.6 6 15 14 14 9 8 8 16 15 14 5 11 2 1.8
Motherson Sumi 13 37 9 9 10 22 26 30 26 32 32 7 17 6 0.5
RoE (%)RoCE (%)
Domestic Peers
Global Peers*
EBIDTA Margins (%)
Source: Company, ICICIdirect.com Research, *Bloomberg Consensus Estimates *RoA instead of RoCE for Global Peers, AY~ Accounting year ` Valuation is on AY16E basis
Exhibit 46: Two-year forward PE band
-10
10
30
50
70
90
110
130
150
Oct-1
2
Jan-
13
Apr-1
3
Jul-1
3
Oct-1
3
Jan-
14
(|)
Price 16x 13x 9x 5x
Source: Company, ICICIdirect.com Research
Page 30 ICICI Securities Ltd | Retail Equity Research
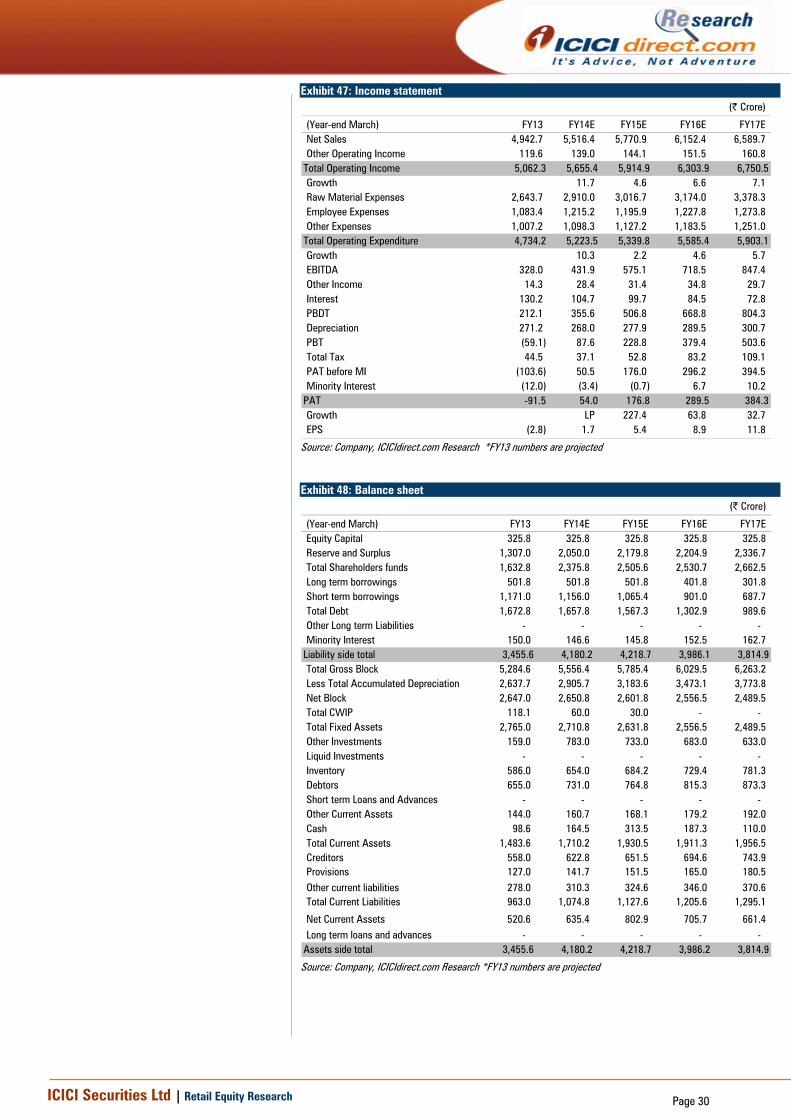
Exhibit 47: Income statement (| Crore)
(Year-end March) FY13 FY14E FY15E FY16E FY17ENet Sales 4,942.7 5,516.4 5,770.9 6,152.4 6,589.7 Other Operating Income 119.6 139.0 144.1 151.5 160.8
Total Operating Income 5,062.3 5,655.4 5,914.9 6,303.9 6,750.5Growth 11.7 4.6 6.6 7.1 Raw Material Expenses 2,643.7 2,910.0 3,016.7 3,174.0 3,378.3 Employee Expenses 1,083.4 1,215.2 1,195.9 1,227.8 1,273.8 Other Expenses 1,007.2 1,098.3 1,127.2 1,183.5 1,251.0
Total Operating Expenditure 4,734.2 5,223.5 5,339.8 5,585.4 5,903.1Growth 10.3 2.2 4.6 5.7 EBITDA 328.0 431.9 575.1 718.5 847.4 Other Income 14.3 28.4 31.4 34.8 29.7 Interest 130.2 104.7 99.7 84.5 72.8 PBDT 212.1 355.6 506.8 668.8 804.3 Depreciation 271.2 268.0 277.9 289.5 300.7 PBT (59.1) 87.6 228.8 379.4 503.6 Total Tax 44.5 37.1 52.8 83.2 109.1 PAT before MI (103.6) 50.5 176.0 296.2 394.5 Minority Interest (12.0) (3.4) (0.7) 6.7 10.2
PAT -91.5 54.0 176.8 289.5 384.3Growth LP 227.4 63.8 32.7 EPS (2.8) 1.7 5.4 8.9 11.8
Source: Company, ICICIdirect.com Research *FY13 numbers are projected
Exhibit 48: Balance sheet
(| Crore)
(Year-end March) FY13 FY14E FY15E FY16E FY17EEquity Capital 325.8 325.8 325.8 325.8 325.8 Reserve and Surplus 1,307.0 2,050.0 2,179.8 2,204.9 2,336.7 Total Shareholders funds 1,632.8 2,375.8 2,505.6 2,530.7 2,662.5 Long term borrowings 501.8 501.8 501.8 401.8 301.8 Short term borrowings 1,171.0 1,156.0 1,065.4 901.0 687.7 Total Debt 1,672.8 1,657.8 1,567.3 1,302.9 989.6 Other Long term Liabilities - - - - - Minority Interest 150.0 146.6 145.8 152.5 162.7
Liability side total 3,455.6 4,180.2 4,218.7 3,986.1 3,814.9Total Gross Block 5,284.6 5,556.4 5,785.4 6,029.5 6,263.2 Less Total Accumulated Depreciation 2,637.7 2,905.7 3,183.6 3,473.1 3,773.8 Net Block 2,647.0 2,650.8 2,601.8 2,556.5 2,489.5 Total CWIP 118.1 60.0 30.0 - - Total Fixed Assets 2,765.0 2,710.8 2,631.8 2,556.5 2,489.5 Other Investments 159.0 783.0 733.0 683.0 633.0 Liquid Investments - - - - - Inventory 586.0 654.0 684.2 729.4 781.3 Debtors 655.0 731.0 764.8 815.3 873.3 Short term Loans and Advances - - - - - Other Current Assets 144.0 160.7 168.1 179.2 192.0 Cash 98.6 164.5 313.5 187.3 110.0 Total Current Assets 1,483.6 1,710.2 1,930.5 1,911.3 1,956.5 Creditors 558.0 622.8 651.5 694.6 743.9 Provisions 127.0 141.7 151.5 165.0 180.5 Other current liabilities 278.0 310.3 324.6 346.0 370.6 Total Current Liabilities 963.0 1,074.8 1,127.6 1,205.6 1,295.1
Net Current Assets 520.6 635.4 802.9 705.7 661.4 Long term loans and advances - - - - -
Assets side total 3,455.6 4,180.2 4,218.7 3,986.2 3,814.9
Source: Company, ICICIdirect.com Research *FY13 numbers are projected
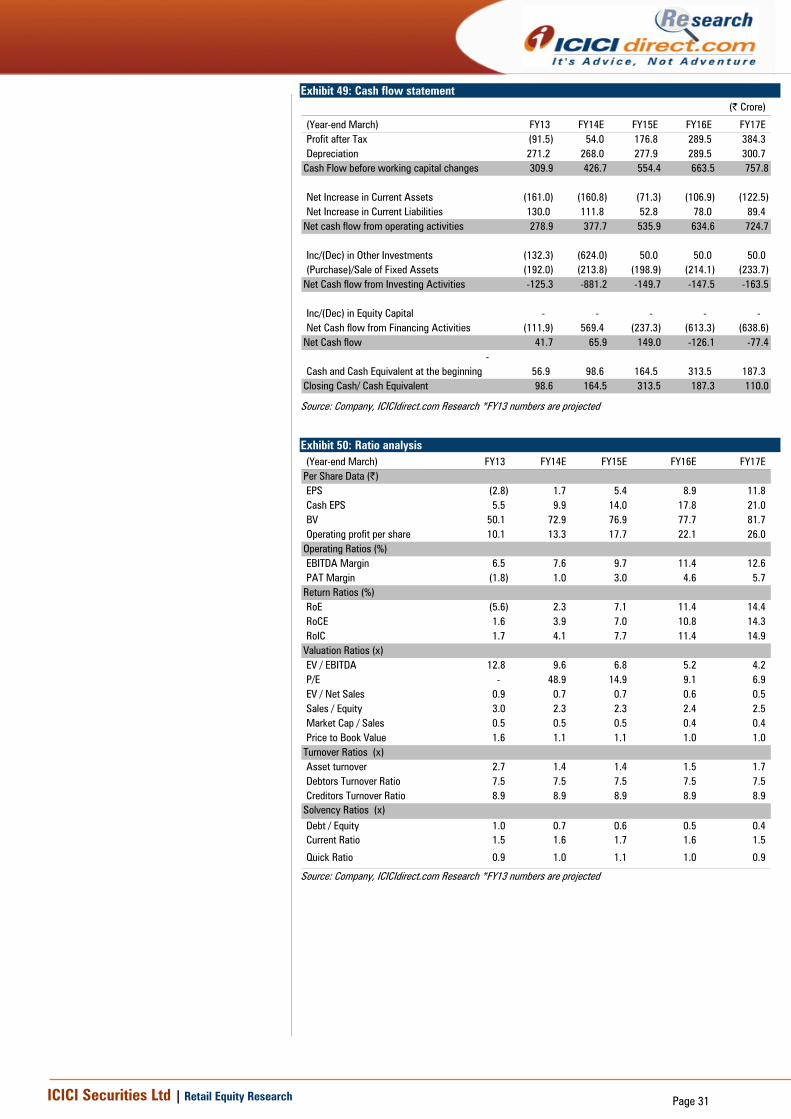
Page 31 ICICI Securities Ltd | Retail Equity Research
Exhibit 49: Cash flow statement (| Crore)
(Year-end March) FY13 FY14E FY15E FY16E FY17EProfit after Tax (91.5) 54.0 176.8 289.5 384.3 Depreciation 271.2 268.0 277.9 289.5 300.7
Cash Flow before working capital changes 309.9 426.7 554.4 663.5 757.8
Net Increase in Current Assets (161.0) (160.8) (71.3) (106.9) (122.5) Net Increase in Current Liabilities 130.0 111.8 52.8 78.0 89.4
Net cash flow from operating activities 278.9 377.7 535.9 634.6 724.7
Inc/(Dec) in Other Investments (132.3) (624.0) 50.0 50.0 50.0 (Purchase)/Sale of Fixed Assets (192.0) (213.8) (198.9) (214.1) (233.7)
Net Cash flow from Investing Activities -125.3 -881.2 -149.7 -147.5 -163.5
Inc/(Dec) in Equity Capital - - - - - Net Cash flow from Financing Activities (111.9) 569.4 (237.3) (613.3) (638.6)
Net Cash flow 41.7 65.9 149.0 -126.1 -77.4-
Cash and Cash Equivalent at the beginning 56.9 98.6 164.5 313.5 187.3 Closing Cash/ Cash Equivalent 98.6 164.5 313.5 187.3 110.0
Source: Company, ICICIdirect.com Research *FY13 numbers are projected
Exhibit 50: Ratio analysis (Year-end March) FY13 FY14E FY15E FY16E FY17E
Per Share Data (|)EPS (2.8) 1.7 5.4 8.9 11.8 Cash EPS 5.5 9.9 14.0 17.8 21.0 BV 50.1 72.9 76.9 77.7 81.7 Operating profit per share 10.1 13.3 17.7 22.1 26.0
Operating Ratios (%)EBITDA Margin 6.5 7.6 9.7 11.4 12.6 PAT Margin (1.8) 1.0 3.0 4.6 5.7
Return Ratios (%)RoE (5.6) 2.3 7.1 11.4 14.4 RoCE 1.6 3.9 7.0 10.8 14.3 RoIC 1.7 4.1 7.7 11.4 14.9
Valuation Ratios (x)EV / EBITDA 12.8 9.6 6.8 5.2 4.2 P/E - 48.9 14.9 9.1 6.9 EV / Net Sales 0.9 0.7 0.7 0.6 0.5 Sales / Equity 3.0 2.3 2.3 2.4 2.5 Market Cap / Sales 0.5 0.5 0.5 0.4 0.4 Price to Book Value 1.6 1.1 1.1 1.0 1.0
Turnover Ratios (x)Asset turnover 2.7 1.4 1.4 1.5 1.7 Debtors Turnover Ratio 7.5 7.5 7.5 7.5 7.5 Creditors Turnover Ratio 8.9 8.9 8.9 8.9 8.9
Solvency Ratios (x)Debt / Equity 1.0 0.7 0.6 0.5 0.4 Current Ratio 1.5 1.6 1.7 1.6 1.5
Quick Ratio 0.9 1.0 1.1 1.0 0.9
Source: Company, ICICIdirect.com Research *FY13 numbers are projected

Page 32 ICICI Securities Ltd | Retail Equity Research
Annexure Mahindra Forgings Mahindra Forgings Ltd (MFL) is engaged into the manufacture of forged and machined products for automotive, agriculture, railway, mining, construction and other industries with plants in Germany, the UK and India. Mahindra Forgings India mainly focuses on design, development & machining of engine, steering and chassis components such as crankshafts, steering knuckles, stabiliser bars, gear blanks, front axle beams, levers, flanges, control arms, camshafts, connecting rods, pitman arms and piston rods and other non-automotive products for passenger cars, multi-utility vehicles (MUVs), light commercial vehicles (LCVs), medium commercial vehicles (MCVs) and tractors, earthmoving equipment and railways. The German operations are a full range provider of forging parts while being one of the top four axle beam manufacturers in the world. The UK operations have expertise in producing flashless parts. MFL has grown into a global forging company through several acquisitions over the last few years. In April 2005, MFL acquired the Chakan unit of Amforge Industries Ltd, Also, MFL established a presence in the European market by acquiring Stokes Group Ltd, Jeco Holdings AG and Schöneweiss & Co. GmbH in November 2007. These companies were originally acquired from their former owners by M&M, in 2005 and 2006. MFL has a diversified and complementary product portfolio across geographies. In India, MFL is focused on design, development and machining of crankshafts and steering knuckles for cars and multi-utility vehicles. Schöneweiss, the German subsidiary, is one of the leading axle beam manufacturers in the world. Jeco-Jellinghaus GmbH (Jeco), Gesenkschmiede Schneider GmbH ("GSA") and Falkenroth Umformtechnik GmbH (Falkenroth), the other German subsidiaries, are providers of a diverse range of forging products, primarily for heavy commercial vehicles. They collectively manufacture more than 250 products. Stokes, the UK subsidiary, has an expertise in flashless forgings.
Mahindra Composites In 1982, M&M set up Siro Plast Ltd, a company slated to provide quality products in the area of engineered plastic composites. Since then, Mahindra Composites (Formerly Siro Plast) has come a long way with a state-of-the-art technology and an in-built capacity for customisation helping position the company as a leader in this niche segment. A tie-up from 1983-1994 with Menzolit GmbH of Germany, the largest manufacturer of composites in Europe, brought in advanced technology addressing manufacturing formulations, manufacturing processes, application engineering and mould design cycles.

Page 33 ICICI Securities Ltd | Retail Equity Research
Mahindra Gears Mahindra Gears & Transmissions Pvt Ltd (MGT) is one of the leading manufacturers of proven quality gears and transmission components with manufacturing facilities in India and Italy. MGT is engaged in the manufacture of reliable, high quality gears and transmission components for global OEMs and other Tier-1 customers. MGT’s product line includes spur and helical gears, sprockets, transmission spline shafts, couplings and power take-off clutches. MGT began operations with M&M acquiring SAR Auto products Ltd., Rajkot in 2006. Post the acquisition, MGT has grown multi-fold in a short span of five years. Later in 2008, through a consortium of M&M and ICICI Venture Funds Management, MGT acquired Metalcastello SpA, a leading Italian gear manufacturing company. MGT produces more than 6,00,000 gears & transmission components a month, from facilities in India and Italy. These conform to German specifications DIN 6 to DIN 9 class of accuracy. Blue Sky Investments, a PE venture has a 47% stake in Metalcastello and reflecting a minority interest | 150 crore in the consolidated balance sheet.
Mahindra Stampings Mahindra Stampings (part of Musco) creates a value chain between steel and automobiles by efficiently and economically converting sheet metal into automotive components and systems. Mahindra Stampings has core competency in providing end-to-end solutions in sheet metal parts, aggregates to the automobile, farm equipment and general engineering industries. The company has a strong design niche and has evolved from being just another sheet metal manufacturer to a complete engineering solutions provider, an art-to-part supplier from conceptualisation to design, manufacturing, testing, and manufacture. Its core strengths lie in tool design and development and in providing value-added services like welded assemblies and finishing operations such as powder coating and electrophoretic deposition (ED) coating. The wide range of robotic automated presses, robotic plasma cutting, welding expertise and state-of-the-art paint shop enable it to produce a wide range of superior stamping products including skin and non-skin panels, chassis reinforcements, cross members, roof panels, floors, doors, bumpers, critical assemblies and engine components. Mahindra Stamping has four plants around India – Kanhe (Pune), Nashik, Rudrapur and Pantnagar. The main plant was founded in 1984 by GKW. It was acquired by Mahindra & Mahindra Ltd in September, 1989.

Page 34 ICICI Securities Ltd | Retail Equity Research
Mahindra Hinoday Mahindra Hinoday Industries Ltd (MHIL) is the largest ductile iron non-captive foundry at a single location with 70,000-tonne capacity spread over three plants. MHIL started as a JV between DGP group of India and Hitachi Metals of Japan in 1997 and became a part of Mahindra Systech in 2007. MHIL exports ~20% of its output to markets like US, England, Romania and China, serving customers like Cummins, Honeywell and JCB. MHIL has established warehouse facilities at places near point of consumption. The manufacturing set-up at MHIL comprises three different plants. Each plant has its own sand plant, core making, moulding, melting and finishing facilities. The basic manufacturing process comprises moulding, core making, melting, shot blasting & finishing and machining followed by packing and dispatch. As a forward integration policy, MHIL created its first in-house machining cell in 2006 for machining of hi-end products like turbine housings. The machine shop comprises a number of hi-end CNC, VMC, leak testing, washing and waste-gate assembly machines. Many turbine housings are supplied with welding assembly of child parts. The current in-house installed capacity is 700,000 units per year. MHIL also has an established base of ISO certified vendors who machine parts like bull cages, manifolds, hubs, turbine housings, brackets, front engine supports and bearing caps.
Mahindra Castings Mahindra Castings is a leader in Indian ductile iron casting and ferrite manufacturing. It runs the largest Indian ductile iron foundry serving the global automotive industry with an installed capacity of 60,000 MT, located near the automotive hub in Pune. It is also one of the largest exporters of fully machined turbine housings. The manufacturing facilities in Pune feature a state-of-the-art machine shop with software-integrated quality control systems. Mahindra Castings makes differential carriers and cases, wheel hubs, turbine housings and crankshafts for customers like Renault, Honeywell, Mahindra, Hyundai, etc. With ~40 years of experience in ferrite manufacturing, Mahindra Castings is a respected supplier to the automotive, consumer and industrial electronics industries in India and Europe with clients like Mitsuba, Fagor Brandt, Valeo, Continental and Indesit. The flexible plant set-up enables the company to handle both small and large orders, from 10,000 to over 1 million pieces per month. Mahindra Castings is likely to enhance capacity with additional moulding lines for ductile iron, the dedicated shell core crankshaft line, grey iron blocks and heads units in the near term.

Page 35 ICICI Securities Ltd | Retail Equity Research
RATING RATIONALE ICICIdirect.com endeavours to provide objective opinions and recommendations. ICICIdirect.com assigns ratings to its stocks according to their notional target price vs. current market price and then categorises them as Strong Buy, Buy, Hold and Sell. The performance horizon is two years unless specified and the notional target price is defined as the analysts' valuation for a stock. Strong Buy: >15%/20% for large caps/midcaps, respectively, with high conviction; Buy: > 10%/ 15% for large caps/midcaps, respectively; Hold: Up to +/-10%; Sell: -10% or more;
Pankaj Pandey Head – Research [email protected]
ICICIdirect.com Research Desk, ICICI Securities Limited, 1st Floor, Akruti Trade Centre, Road No. 7, MIDC, Andheri (East) Mumbai – 400 093
ANALYST CERTIFICATION We /I, Nishant Vass MBA (Finance), Venil Shah MBA research analysts, authors and the names subscribed to this report, hereby certify that all of the views expressed in this research report accurately reflect our personal views about any and all of the subject issuer(s) or securities. We also certify that no part of our compensation was, is, or will be directly or indirectly related to the specific recommendation(s) or view(s) in this report. Analysts aren't registered as research analysts by FINRA and might not be an associated person of the ICICI Securities Inc.
Disclosures: ICICI Securities Limited (ICICI Securities) and its affiliates are a full-service, integrated investment banking, investment management and brokerage and financing group. We along with affiliates are leading underwriter of securities and participate in virtually all securities trading markets in India. We and our affiliates have investment banking and other business relationship with a significant percentage of companies covered by our Investment Research Department. Our research professionals provide important input into our investment banking and other business selection processes. ICICI Securities generally prohibits its analysts, persons reporting to analysts and their dependent family members from maintaining a financial interest in the securities or derivatives of any companies that the analysts cover.
The information and opinions in this report have been prepared by ICICI Securities and are subject to change without any notice. The report and information contained herein is strictly confidential and meant solely for the selected recipient and may not be altered in any way, transmitted to, copied or distributed, in part or in whole, to any other person or to the media or reproduced in any form, without prior written consent of ICICI Securities. While we would endeavour to update the information herein on reasonable basis, ICICI Securities, its subsidiaries and associated companies, their directors and employees (“ICICI Securities and affiliates”) are under no obligation to update or keep the information current. Also, there may be regulatory, compliance or other reasons that may prevent ICICI Securities from doing so. Non-rated securities indicate that rating on a particular security has been suspended temporarily and such suspension is in compliance with applicable regulations and/or ICICI Securities policies, in circumstances where ICICI Securities is acting in an advisory capacity to this company, or in certain other circumstances.
This report is based on information obtained from public sources and sources believed to be reliable, but no independent verification has been made nor is its accuracy or completeness guaranteed. This report and information herein is solely for informational purpose and may not be used or considered as an offer document or solicitation of offer to buy or sell or subscribe for securities or other financial instruments. Though disseminated to all the customers simultaneously, not all customers may receive this report at the same time. ICICI Securities will not treat recipients as customers by virtue of their receiving this report. Nothing in this report constitutes investment, legal, accounting and tax advice or a representation that any investment or strategy is suitable or appropriate to your specific circumstances. The securities discussed and opinions expressed in this report may not be suitable for all investors, who must make their own investment decisions, based on their own investment objectives, financial positions and needs of specific recipient. This may not be taken in substitution for the exercise of independent judgment by any recipient. The recipient should independently evaluate the investment risks. The value and return of investment may vary because of changes in interest rates, foreign exchange rates or any other reason. ICICI Securities and affiliates accept no liabilities for any loss or damage of any kind arising out of the use of this report. Past performance is not necessarily a guide to future performance. Investors are advised to see Risk Disclosure Document to understand the risks associated before investing in the securities markets. Actual results may differ materially from those set forth in projections. Forward-looking statements are not predictions and may be subject to change without notice.
ICICI Securities and its affiliates might have managed or co-managed a public offering for the subject company in the preceding twelve months. ICICI Securities and affiliates might have received compensation from the companies mentioned in the report during the period preceding twelve months from the date of this report for services in respect of public offerings, corporate finance, investment banking or other advisory services in a merger or specific transaction. It is confirmed that, Nishant Vass MBA (Finance), Venil Shah MBA research analysts and the authors of this report have not received any compensation from the companies mentioned in the report in the preceding twelve months. Our research professionals are paid in part based on the profitability of ICICI Securities, which include earnings from Investment Banking and other business.
ICICI Securities or its subsidiaries collectively do not own 1% or more of the equity securities of the Company mentioned in the report as of the last day of the month preceding the publication of the research report.
It is confirmed that, Nishant Vass MBA (Finance), Venil Shah MBA research analysts and the authors of this report or any of their family members does not serve as an officer, director or advisory board member of the companies mentioned in the report.
ICICI Securities may have issued other reports that are inconsistent with and reach different conclusion from the information presented in this report. ICICI Securities and affiliates may act upon or make use of information contained in the report prior to the publication thereof.
This report is not directed or intended for distribution to, or use by, any person or entity who is a citizen or resident of or located in any locality, state, country or other jurisdiction, where such distribution, publication, availability or use would be contrary to law, regulation or which would subject ICICI Securities and affiliates to any registration or licensing requirement within such jurisdiction. The securities described herein may or may not be eligible for sale in all jurisdictions or to certain category of investors. Persons in whose possession this document may come are required to inform themselves of and to observe such restriction.
ICICI Securities Ltd. may have received investment banking mandates from some of the companies referred to in this report. Reference to companies are made in the report purely from peer comparison perspective without recommending or commenting on these companies. This report is prepared based on publicly available information.