maike tube industry holdings limited
TRANSCRIPT

– 1 –
Hong Kong Exchanges and Clearing Limited and The Stock Exchange of Hong Kong Limited take no responsibility for the contents of this announcement, make no representation as to its accuracy or completeness and expressly disclaim any liability whatsoever for any loss howsoever arising from or in reliance upon the whole or any part of the contents of this announcement.
MAIKE TUBE INDUSTRY HOLDINGS LIMITED
(Incorporated in the Cayman Islands with limited liability)
(Stock Code: 1553)
(邁科管業控股有限公司)
ANNOUNCEMENT OF RESULT FOR THE YEAR ENDED 31 DECEMBER 2020
The Board hereby announces results of the Group for the year ended 31 December 2020.
FINANCIAL HIGHLIGHTS
2020 2019 ChangeRMB’000 RMB’000
Revenue 1,255,139 1,125,281 11.5%Gross profit 267,486 261,400 2.3%Gross profit margin 21.3% 23.2%
Profit for the year 99,527 89,673 11.0%
Earnings per share — Basic (RMB) 0.229 0.265 (13.6%)
Dividend per share— Interim Nil Nil— Final HK12 cents Nil
— Full year HK12 cents Nil

– 2 –
In this announcement, unless the context otherwise requires, the following terms shall have the meanings set out below:
“AGM” Annual General Meeting
“ASP” Average selling price
“Board” The board of Directors
“China” or “PRC” The People’s Republic of China
“Company” Maike Tube Industry Holdings Limited, an exempted a company incorporated in the Cayman Islands with limited liability on 1 February 2019 and the Shares of which are listed on the Main Board of the Stock Exchange
“Director(s)” Director(s) of the Company
“ERW” or “electric technology resistance welding”
The acronym for electric resistance welding, a welding used in the manufacture of pipes under which pipes are made from strips of hot rolled steel coil which are passed through forming rolls and welded by using heat generated by high frequency electric current passing over the surface of the strips
“ERW steel pipe(s)” Steel pipes formed by utilising ERW technology
“Group” The Company and its subsidiaries
“HKD” Hong Kong dollars, the lawful currency of Hong Kong
“HVAC” Heating, ventilation and air conditioning
“Listing” the listing of the Shares on the Main Board of the Stock Exchange
“Listing Rules” The Rules Governing the Listing of Securities on the Stock Exchange
“Prospectus” prospectus of the Company dated 29 November 2019
"Reporting period" For the year ended 31 December 2020
“RMB” Renminbi Yuan, the lawful currency of the PRC

– 3 –
“SSAW steel pipe(s)” spiral submerged arc welded steel pipes which formed by utilising submerged arc welding technology with spiral weld seam, i.e., pipes made from strips of hot rolled steel plates formed helically into cylinders and then welded as they are formed
“Stock Exchange” The Stock Exchange of Hong Kong Limited
“THB” Thai Baht, the lawful currency of Thailand
“USD” United States dollar, the lawful currency of United States
“VND” Vietnamese Dong, the lawful currency of Vietnam
In this announcement, “we”, “us” or “our” refers to the Company and where the context otherwise requires, the Group (as defined above).

– 4 –
MANAGEMENT DISCUSSION AND ANALYSIS
BUSINESS REVIEW
The Group is principally engaged in (i) the manufacturing and sales of standard prefabricated pipe nipple products; (ii) manufacturing and sales of steel pipe products; and (iii) the design and supply of assembled piping systems. We also sell steel coils that were procured from our suppliers.
The standard prefabricated pipe nipple products of the Group are used in pipe system to connect different straight pipes or pipe sections, can be adjusted to different sizes or shapes. Standard prefabricated pipe nipple products and steel pipes products have different specifications, such as length, outside diameter and surface finishing which cater for the varying needs of the Group’s customers and comply with international standards. We sold most of our standard prefabricated pipe nipple products and customised steel pipe products directly or indirectly to overseas markets. Our welded steel pipe products are roughly classified into standard ERW steel pipes, and SSAW steel pipes. Our Group has received certifications relating to quality control including, among other things, the ISO 9001 certification, ISO 14001 certification and OHSAS 18001 certification. Our products are used and applied in the municipal pipeline system designed for natural gas, water supply, sewage, HVAC and fire extinguish water steel pipes for firefighting. Leveraging on our industry knowledge and expertise, we are also capable of designing and supplying assembled piping system for our customers. Our customers would seek technical advice or suggestion to their design and/or engineering solutions for their desired assembled piping systems through building information modeling and three-dimension design system to minimise wastage of material and improve efficiency, thus reducing production costs.
GREATER COMMITMENT TO NEW AREAS AND SPECIALIZATION TO ENHANCE SERVICE VALUE
In November 2020, the Group reached a joint venture agreement with two Hong Kong companies for the manufacturing of high-end prefabricated power products. The three parties invested THB110.0 million to establish a production base in Thailand to manufacture power pipeline connector products. Setting up a production base in Thailand can reduce the impact of U.S. tariffs on our business and financial performance and will be conducive to the Group’s internationalization strategy. In September 2020, Shandong Maike Supply Chain Management Co., Ltd (山東邁科供應鏈管理有限公司) was established, which is mainly engaged in the procurement and sales of metal materials (strip steel). It is helpful to improve the Group’s bargaining power in procurement from steel plant and reduce the cost of strip steel procurement; in December 2020, Shandong Maike Smart Technology Limited (山東邁科智能科技有限公司) was established, which is mainly engaged in intelligent system design, architectural engineering design, fire engineering construction, installation and commissioning, etc., and can provide customers with diversified additional value-added services in a more professional manner.
– 5 –
OUR ORDERS
In 2020, the Group received new orders for approximately 22,400 tons of standard prefabricated pipe products, of which approximately 93.3% were from overseas customers; we also received new orders for approximately 196,500 tons of steel pipe products, of which approximately 76.8% were from domestic customers. In 2020, we have delivered approximately 20,479 tons of standard prefabricated pipe nipple products and approximately 169,850 tons of steel pipe products. Among others, the Vietnam Piping received new orders for approximately 1,200 tons of standard prefabricated pipe products, delivered approximately 1,083 tons for the year (2019: approximately 500 tons).
STANDARD PREFABRICATED PIPE NIPPLES PRODUCTS
For the year ended 31 December 2020, our revenue from standard prefabricated pipe products amounted to approximately RMB296.6 million, accounting for approximately 23.6% of the total revenue; and the gross profit amounted to approximately RMB125.4 million, accounting for approximately 46.9% of the total gross profit. For the year ended 31 December 2019, our revenue amounted to approximately RMB286.6 million, accounting for approximately 25.5% of the total revenue; and the gross profit amounted to approximately RMB126.8 million, accounting for approximately 48.5% of the total gross profit. In 2020, the Group increased new production lines in Vietnam and continuously improved the production capacity of its Vietnam base. It achieved mass production of long pipe nipples, European-standard nipples, and copper pipe nipples. In addition to the increase in purchases from original American customers, the Group acquired new customers from North America and EU. Amid the global economic headwinds brought about by the COVID-19 pandemic, the sales of the Group’s standard prefabricated nipples products bucked the trend, delivering a year-on-year increase of approximately 2,113 tons as compared to previous year, representing an increase of approximately 11.5%.
STEEL PIPE PRODUCTS
Our steel pipe products are made through rolling steel plate and welding the seam, and are mainly used for gas, water supply, HVAC and fire extinguish. In order to meet the personal demand of customers, the Group produced standard steel pipes with value-added processes under customised requirements of customers, including but not limited to pipe body processing, non-standardised surface treatment, pipe end processing, thickened galvanisation, and internal smoothing. In 2020, our ERW steel pipes, spiral submerged arc welded steel pipes and customised steel pipes recorded revenues of approximately RMB302.0 million, RMB310.9 million and RMB172.4 million, respectively, representing a year-on-year increase of –17.7%, 44.7% and –14.6% as compared to 2019, respectively. The total revenue of steel pipe products accounted for approximately 62.6% of the total revenue for the year ended 31 December 2020.
– 6 –
DESIGN AND SUPPLY OF ASSEMBLED PIPING SYSTEM
Leveraging on our experience in the industry, we are able to design and supply assembled piping systems to our customers to satisfy various physical and functional characteristics of our customers’ designated sites. In 2020, our design and supply of assembled piping system recorded the revenue of approximately RMB14.6 million, representing a year-on-year increase of approximately 22.6% as compared to 2019, accounting for approximately 1.2% of the total revenue for the year ended 31 December 2020.
FINANCIAL REVIEW
Our revenue is generated from (i) sales of standard prefabricated pipe products; (ii) sales of steel pipe products; (iii) sales of the design and supply of assembled piping systems; and (iv) sales of steel coils that were procured from suppliers.
For the year ended 31 December 2020, our total revenue was approximately RMB1,255.1 million, representing an increase of approximately RMB129.8 million or 11.5% as compared with that of 2019. The increase in revenue was mainly due to (i) a year-on-year increase in sales of steel coils; (ii)the increase in the average selling price of the SSAW steel pipes, steel coils and customised steel pipes, which was caused by an increase in the cost of raw materials; (iii) a year-on-year increase in spiral submerged arc welded steel pipes delivered.
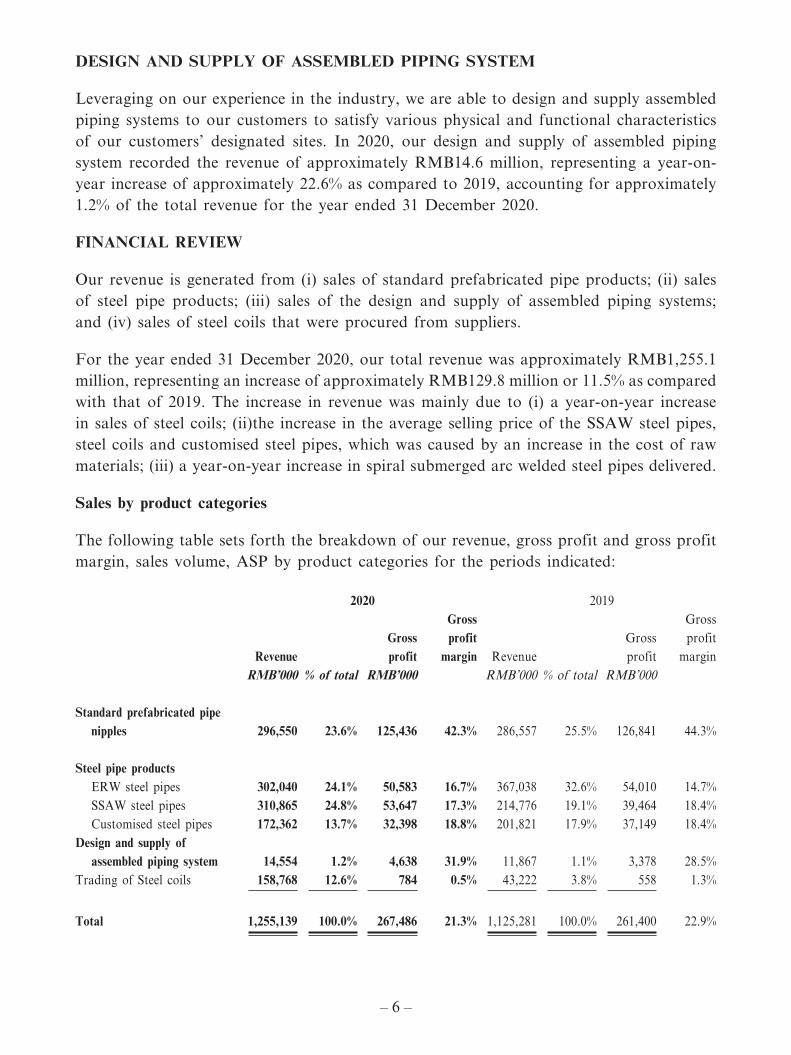
Sales by product categories
The following table sets forth the breakdown of our revenue, gross profit and gross profit margin, sales volume, ASP by product categories for the periods indicated:
2020 2019
RevenueGross profit
Gross profit
margin RevenueGross
profit
Gross profit margin
RMB’000 % of total RMB’000 RMB’000 % of total RMB’000
Standard prefabricated pipe nipples 296,550 23.6% 125,436 42.3% 286,557 25.5% 126,841 44.3%
Steel pipe productsERW steel pipes 302,040 24.1% 50,583 16.7% 367,038 32.6% 54,010 14.7%SSAW steel pipes 310,865 24.8% 53,647 17.3% 214,776 19.1% 39,464 18.4%Customised steel pipes 172,362 13.7% 32,398 18.8% 201,821 17.9% 37,149 18.4%
Design and supply of assembled piping system 14,554 1.2% 4,638 31.9% 11,867 1.1% 3,378 28.5%
Trading of Steel coils 158,768 12.6% 784 0.5% 43,222 3.8% 558 1.3%
Total 1,255,139 100.0% 267,486 21.3% 1,125,281 100.0% 261,400 22.9%

– 7 –
2020 2019
Sales volume ASPSales
volume ASPton’000 % of total RMB/ton ton’000 % of total RMB/ton
Standard prefabricated pipe nipples 20.5 8.6% 14,466 18.4 9.1% 15,603
Steel pipe productsERW steel pipes 65.6 27.6% 4,604 79.2 39.2% 4,634SSAW steel pipes 70.6 29.7% 4,403 51.2 25.4% 4,195Customised steel pipes 33.6 14.1% 5,130 39.7 19.7% 5,086
Design and supply of assembled piping system N/A N/A N/A N/A N/A N/A
Steel coils 47.7 20.0% 3,328 13.3 6.6% 3,246
Total 238 100.0% 5,274 201.7 100.0% 5,576
Sales by geographic regions
The following table sets forth the breakdown of our revenue, sales volume and ASP by geographic regions for the periods indicated:
2020 2019
Revenue% of
revenueSales
volume ASP Revenue% of
revenueSales
volume ASPRMB’000 ton’000 RMB/ton RMB’000 ton’000 RMB/ton
Domestic marketPRC 778,225 62.0% 177.3 4,389 618,975 55.0% 136.0 4,551
Overseas marketsThe United States 200,377 16.0% 13.7 14,626 205,684 18.3% 12.7 16,196Other countries in
America (excluding the United States) 91,046 7.2% 13.1 6,950 120,627 10.7% 20.3 5,942
Other countries in Asia (excluding the PRC) 114,418 9.1% 23.1 4,953 118,849 10.6% 23.3 5,101
Europe 20,181 1.6% 2.1 9,610 17,931 1.6% 1.8 9,962Others 50,892 4.1% 8.7 5,850 43,215 3.8% 7.6 5,686
Total 1,255,139 100.0% 238 5,274 1,125,281 100.0% 201.7 5,576
Note: Other countries in Americas (excluding the United States) comprise the continents of North and South America. Others mainly include Oceania and Africa.

– 8 –
OTHER INCOME
In 2020, other income mainly represents interest income and government grant, which increased from approximately RMB1.8 million in 2019 by approximately 166.7% or RMB3.0 million to approximately RMB4.8 million in 2020. The increase in other income was mainly due to the increase in government grant for subsidised the Company’s expense by approximately RMB2.8 million.
OTHER GAINS AND LOSSES
In 2020, other gains and losses mainly represent gains on sales of scrap materials, gains on structured bank deposits, gains on foreign currency forward contracts and exchange gains or losses. Other gains and losses decreased from approximately RMB11.6 million in 2019 by approximately 94.8% or approximately RMB11.0 million to approximately RMB0.6 million in 2020. Decrease of other gains and losses was mainly due to the exchange losses by approximately RMB9.8 million in 2020 as compared to exchange gains of approximately RMB1.0 million in the same period of 2019.
DISTRIBUTION AND SELLING EXPENSES
Distribution and selling expenses increased from approximately RMB64.0 million in 2019 by approximately 9.5% or RMB6.1 million to approximately RMB70.1 million in 2020, which was primarily due to (i) increase in salaries of sales staff; (ii) the increase in ocean freight and port expenses; (iii) increase in marketing expenses.
ADMINISTRATIVE EXPENSES
Administrative expenses increased from approximately RMB30.3 million in 2019 by approximately 23.1% or RMB7.0 million to approximately RMB37.3 million in 2020, which was primarily due to the increase in compensation of management staff and the increase in sales taxes and surcharges.
RESEARCH AND DEVELOPMENT COSTS
The cost of research and development increased from approximately RMB45.8 million in 2019 by approximately 16.6% or RMB7.6 million to approximately RMB53.4 million in 2020. The increase in research and development costs was mainly due to the increase in the number of new research and development projects in 2020 as compared to that of 2019. Our research and development costs accounted for approximately 4.2% of the total revenue (2019: approximately 4.1%).

– 9 –
IMPAIRMENT LOSSES UNDER EXPECTED CREDIT LOSS MODEL, NET OF REVERSAL
For the year ended 31 December 2020, impairment losses on trade receivables and contract assets were approximately RMB2.8 million (2019: approximately RMB0.3 million). The increase of impairment losses on trade receivables and contract assets was mainly due to the extension of a customer’s repayment date.
FINANCE COSTS
Finance costs were approximately RMB5.1 million in 2020, representing a decrease of RMB7.4 million as compared to approximately RMB12.5 million in 2019. The decrease in finance costs was primarily due to the decrease in bank loans. The effective interest rate for the year ended 31 December 2020 was approximately 4.2% (2019: approximately 4.4%).
TAXATION CHARGE
Taxation charge decreased from RMB14.5 million for the year ended 31 December 2019 to RMB4.7 million for the year ended 31 December 2020, primarily due to the preferential income tax policies by the Group.
PROFIT FOR THE YEAR
For the year ended 31 December 2020, the profit for the year was approximately RMB99.5 million (2019: approximately RMB89.7 million). The net profit margin was approximately 7.9% (2019: approximately 8.0%).
LIQUIDITY AND FINANCIAL RESOURCES
The following table sets forth certain information on our consolidated statements of cash flows for the years ended 31 December 2019 and 2020:
Years ended 31 December2020 2019
RMB’000 RMB’000
Net cash generated from operating activities 184,455 13,050Net cash (used in)/generated from investing activities (130,912) 41,568Net cash (used in)/generated from financing activities (179,332) 114,040
(Decrease)/increase in cash and cash equivalents (125,789) 168,658Cash and cash equivalents at beginning of year 215,108 46,450Effect of foreign exchange rate changes (2,065) —Cash and cash equivalents at end of year 87,254 215,108

– 10 –
NET CASH GENERATED FROM OPERATING ACTIVITIES
Our net cash generated from operating activities increased from a net cash inflow of approximately RMB13.1 million in 2019 to net cash inflow of approximately RMB184.5 million in 2020.
The increase in net cash generated from operating activities was mainly due to (i) decrease in trade receivables backed by bills; (ii) increase in trade and bills payables; and (iii) increase in contract liabilities, other payables and accrued expenses.
NET CASH (USED IN)/GENERATED FROM INVESTING ACTIVITIES
Our net cash from investing activities changed from a net inflow of approximately RMB41.6 million in 2019 to a net outflow of approximately RMB130.9 million in 2020. The change in net cash from investing activities was primarily due to (i) purchase of equipment during the year; and (ii) change in structured bank deposits during the year.
NET CASH (USED IN)/GENERATED FROM FINANCING ACTIVITIES
Our net cash from financing activities changed from net inflow of approximately RMB114.0 million in 2019 to an outflow of approximately RMB179.3 million in 2020. The net cash outflow used in financing activities were primarily due to repayment of bank borrowings and payment of bank loan interests.
NET CURRENT ASSETS AND LIABILITIES
Inventories
Our balance of inventories increased by approximately RMB16.2 million or 8.3% from approximately RMB194.9 million as at 31 December 2019 to approximately RMB211.1 million as at 31 December 2020, which was mainly driven by the increase of raw materials for copper pipes and undelivered orders. Our average turnover days of inventories (net of provision) decreased from 80 days for the year ended 31 December 2019 to 75 days for the year ended 31 December 2020, mainly due to increase in revenue.
TRADE RECEIVABLES AND TRADE RECEIVABLES BACKED BY BILLS
Our trade receivables increased from approximately RMB185.9 million as at 31 December 2019 to approximately RMB203.7 million as at 31 December 2020, mainly due to the extension of a customer’s repayment date.
Our trade receivables backed by bills decreased from approximately RMB76.2 million as at 31 December 2019 to approximately RMB27.9 million as at 31 December 2020, mainly due to decrease in bank bills paid by customers.

– 11 –
CONTRACT ASSETS
Our contract assets increased from approximately RMB16.4 million as of 31 December 2019 to approximately RMB18.6 million as of 31 December 2020, mainly due to increase in revenue.
DEPOSITS, PREPAYMENTS AND OTHER RECEIVABLES
Our deposits, prepayments and other receivables increased from approximately RMB70.9 million as at 31 December 2019 to approximately RMB88.2 million as at 31 December 2020, mainly due to the increase in prepayment for purchase of steel coils.
AMOUNTS DUE FROM/TO RELATED PARTIES
Amounts due from related parties decreased from approximately RMB6.5 million as at 31 December 2019 to approximately RMB5.8 million as at 31 December 2020, mainly due to decrease in revenue generated from selling to related parties at the end of the period.
Amounts due to related parties increased from approximately RMB0.5 million as at 31 December 2019 to approximately RMB0.8 million as at 31 December 2020.
TRADE AND BILLS PAYABLES
Our trade payables increased from approximately RMB42.4 million as of 31 December 2019 to approximately RMB72.1 million as of 31 December 2020, mainly due to the unexpired bank acceptance notes issued to settle with and pay our suppliers.
CONTRACT LIABILITIES
Our contract liabilities increased from approximately RMB25.4 million as at 31 December 2019 to approximately RMB46.6 million as at 31 December 2020, which was related to timing of delivery of products to our customers.
REFUND LIABILITIES
Our refund liabilities increased from approximately RMB7.3 million as of 31 December 2019 to approximately RMB10.1 million as of 31 December 2020, primarily due to increase in revenue of standard prefabricated pipe nipple products.
OTHER PAYABLES AND ACCRUED CHARGES
Our other payables and accrued charges increased from approximately RMB34.8 million as of 31 December 2019 to approximately RMB44.2 million as of 31 December 2020, primarily due to the increase in tax payable and accrual expenses.

– 12 –
PROVISIONS
Our provisions decreased from approximately RMB1.5 million as of 31 December 2019 to approximately RMB1.4 million as of 31 December 2020. Provisions represent warranty provided for our products sold.
CAPITAL COMMITMENTS
As at 31 December 2020, our capital commitments amounted to approximately RMB1.8 million (2019: approximately RMB15.0 million).
BORROWINGS
Our borrowings decreased from approximately RMB237.5 million as of 31 December 2019 to approximately RMB64.1 million as of 31 December 2020, mainly due to repayment of bank loans with part of our own fund.
GEARING RATIO
As at 31 December 2020, the gearing ratio of the Group, calculated based on the total interest-bearing debts divided by the total equity in respective period and multiplied by 100%, was approximately 8.5% (2019: approximately 36.4%).
The decrease in the gearing ratio was mainly due to the repayment of bank loans with part of our own fund.
LEASE LIABILITIES
As of 31 December 2020, the Group rented a property to operate our factory and the lease liabilities were measured at the present value of the lease payments that are not yet paid. We recorded lease liabilities of approximately RMB0.8 million, as we rented a production plant in Vietnam at the end of 2018, of which RMB0.4 million was secured by rental deposit, but unguaranteed.
FOREIGN CURRENCY RISK
A substantial majority of our assets and liabilities are denominated in RMB, except for the following items:
(i) Certain bank balances are denominated in USD and HKD;
(ii) Sales of goods to overseas customers and related trade receivables are denominated in USD.
(iii) The assets and liabilities of Viet Nam Piping Industries Company Limited are denominated in VND.
Our Group mainly manages potential fluctuations in foreign exchange through foreign currency forward contracts.

– 13 –
DIVIDEND
The Board has recommended the payment of a final dividend of HK12 cents per ordinary share of the Company issued (approximately HKD52,056,000 in aggregate) for the year ended 31 December 2020 in cash (2019: Nil).
The proposed dividend payment is subject to approval by the shareholders of the Company at the forthcoming AGM to be held on 31 May 2021 and is payable around the end of June 2021 in HKD.
Upon shareholders’ approval, the proposed final dividend will be paid to ordinary shareholders whose names shall appear on the register of members of the Company on 18 June 2021.
The Company did not declare interim dividend for the six months ended 30 June 2020 (2019: Nil).
PLEDGE OF ASSETS
As at 31 December 2020, our Group pledged certain property, plant and equipment, right-of-use assets, trade receivables backed by bills and pledged bank deposits with the total net book value of approximately RMB135.2 million (2019: approximately RMB32.9 million) to secure banking facilities granted to the Group.
CONTINGENT LIABILITIES
As at 31 December 2020, the Group did not have any material contingent liabilities.
MAJOR INVESTMENTS IN, MAJOR ACQUISITIONS OF AND DISPOSALS OF SUBSIDIARIES, ASSOCIATES AND JOINT VENTURES
Save as disclosed in the above and the announcement of the Company dated 6 November 2020, the Group did not have any other material acquisitions or disposals during the year ended 31 December 2020.
EMPLOYEES AND COMPENSATION POLICIES
For the year ended 31 December 2020, labour costs (including Directors’ remunerations and emoluments in other forms) were approximately RMB75.3 million (2019: approximately RMB74.9 million). Our Group’s employees are generally remunerated by way of fixed salary and commission will be awarded to our sales and marketing staff if they have achieved certain sales targets. Our Group utilises an appraisal system for our employees and considers the appraisal results of individual employees when conducting their salary reviews, making promotion decisions and determining the amount of bonuses. Our Group’s employees are also entitled to a performance-based bonus, paid leave and various subsidies.

– 14 –
As of 31 December 2020, we had 923 employees (2019: 838 employees), 827 of whom were in the PRC and 96 of whom were located in Vietnam.
A breakdown of our employees by functions is set forth below:
As at 31 December 2020Function PRC Vietnam
Managerial, administrative and accounts 39 5Production 494 77Quality control 49 7Procurement and inventory 46 3Research and development 116 4Sales and marketing 83 —
Total 827 96
RISK MANAGEMENT
Our management has designed and implemented a risk management policy to address various potential risks identified in relation to the operation of our businesses, including strategic, operational, financial and legal risks. Our risk management policy sets forth procedures to identify, analyse, categorise, mitigate and monitor various risks. Our Board is responsible for overseeing the overall risk management system and assessing and updating our risk management policy on a quarterly basis. Our risk management policy also sets forth the reporting hierarchy of risks identified in our operations.
For example, due to price fluctuations of raw materials such as iron ore and coke, the Group’s normal inventory and production operations were directly affected during the year. The management closely pays attention to the price fluctuations of raw materials, and through reasonable formulation of product sales prices and procurement scheme, ensures that inventory is controlled within a reasonable range and meets customer needs.
ENVIRONMENT POLICIES AND PERFORMANCE
The major pollutants generated by the Group in the manufacturing process include various kinds of exhaust gas and wastewater which could be harmful to human body. We are subject to the relevant PRC and Vietnam environmental laws and regulations promulgated by both the state and local governments. During the Reporting Period, we complied with the pollutant discharge standards, under which the amount of different kinds of exhaust gas and wastewater discharge cannot exceed the prescribed levels.

– 15 –
To ensure our due compliance with the pollutant discharge standard under the relevant PRC and Vietnam environmental laws, rules and regulations, we are implementing the following systems:
(i) the manufacturing technology, production lines and processes applied/to be applied by our Group as well as samples of the wastewater and gas emission are thoroughly evaluated, tested and analysed by our research and development team;
(ii) we shall closely monitor the level of pollutants in each step of our production process and we shall take appropriate remedial actions if the level of pollutants exceeds the regulated levels;
(iii) we shall collect and analyse the samples from our wastewater and gas emission from our manufacturing process on regular basis to ensure our due compliance with relevant discharge standards; and
(iv) our research and development team makes ongoing efforts to develop new technologies to enhance our manufacturing process to minimise the discharge of pollutants.
During the year, we did not have any material breaches of environmental protection standards causing material adverse impact on our business operations and financial conditions under the supervision of the local environmental protection authorities of China and Vietnam.
COMPLIANCE WITH LAWS AND REGULATIONS
During the year ended 31 December 2020, our Group had complied with applicable laws and regulations that have a material impact on the Group’s business operations.
FUTURE PLANS AND PROSPECTS
The impact of the COVID-19 pandemic on the enterprises constitutes part of operating activities of the enterprises. In 2021, riding on current situations, the Company will build a high-performance organization, improve quality and cost competitiveness, innovate prefabricated solutions, connect with the dual-cycle strategy, and boost the volume of business as it is the Company’s annual operating policy. In the overseas market, we will strengthen the promotion of standard steel pipes and comprehensively build distribution channels in various countries; continue to build and promote high-end prefabricated steel pipes to become a star enterprise in the market segment; in terms of standard prefabricated market, we will continue to enhance the specialized service for major customer to ensure North American market share; the Company will accelerate the development of new customers and achieve strategic expansion in emerging markets. In the domestic market, the Group focuses on key projects and customers of regular chain, increases the added value of products, and provides strong organizational support to help transformation of marketing. In terms of product research and development, we adopt a principle of “go

– 16 –
out and introduce in”, and plan for the development of new products; the Group will expand externally and standardize internally to reflect the value of R&D innovation; and we will strive to make breakthrough in the development of new products for more than 14 categories. In terms of internal management, efforts will be made to benchmark and learn to reduce costs, strengthen processes and improve quality; we will continue to optimise process framework, improve use efficiency of information system and information service levels; we will continue to carry out prevention and control of epidemic on the one hand, and ensure safe production on the other, and operate in compliance with laws and regulations to ensure the Company the smooth and healthy operation of production and business activities. Riding on current situations, the Group will seize the opportunities in the era, and enhance our competitiveness, to further strengthen our position in the standard prefabricated pipe nipple industry and steel pipe industry and create long-term value for our shareholders.
EVENTS SUBSEQUENT TO THE END OF THE REPORTING PERIOD
As of the date of the consolidated financial statements being authorised to issue, the impacts of the COVID-19 pandemic on the business operations and management of the Group in China and Vietnam are not significant. After the statutory holidays, the Group’s businesses in China and Vietnam have carried out production and operation in a normal way. The financial impact of the COVID-19 pandemic on the Group was not significant; as the impact of the COVID-19 pandemic on the enterprises constitutes part of the business activities of the enterprises, and the COVID-19 pandemic will continue to affect the global economy, public health and livelihood of the general public, our Group will closely monitor the effects, and take appropriate precautionary measures and actions to adapt to the changing environment. The Company will provide updates to investors and the Company’s shareholders as and when necessary.

– 17 –
CONSOLIDATED STATEMENT OF PROFIT OR LOSS AND OTHER COMPREHENSIVE INCOMEFOR THE YEAR ENDED 31 DECEMBER 2020
2020 2019NOTES RMB’000 RMB’000
Revenue 3 1,255,139 1,125,281Cost of sales (987,653) (863,881)
Gross profit 267,486 261,400Other income 4 4,780 1,849Other gains and losses 4 637 11,596Distribution and selling expenses (70,125) (64,031)Administrative expenses (37,320) (30,312)Research and development costs (53,356) (45,831)Impairment losses under expected credit loss model,
net of reversal (2,767) (278)Finance costs 6 (5,111) (12,547)Listing expenses — (17,723)
Profit before taxation 5 104,224 104,123Taxation charge 7 (4,697) (14,450)
Profit for the year 99,527 89,673
Other comprehensive income
Item that may be reclassified subsequently to profit or loss:Exchange difference arising on translation of
foreign operation (1,443) 572
Total comprehensive income for the year 98,084 90,245
Profit for the year attributable to:— Owners of the Company 99,527 77,342— Non-controlling interests — 12,331
99,527 89,673
Total comprehensive income for the year attributable to:— Owners of the Company 98,084 77,994— Non-controlling interests — 12,251
98,084 90,245
Earnings per share— Basic (RMB yuan) 8 0.229 0.265

– 18 –
CONSOLIDATED STATEMENT OF FINANCIAL POSITIONAT 31 DECEMBER 2020
2020 2019NOTES RMB’000 RMB’000
Non-current assetsProperty, plant and equipment 237,418 226,253Deferred tax assets 1,536 1,233Deposits for plant and equipment 4,710 7,345
243,664 234,831
Current assetsInventories 211,076 194,856Trade receivables 9 203,724 185,905Trade receivables backed by bills 27,860 76,232Contract assets 18,644 16,367Tax recoverable 4,240 —Deposits, prepayments and other receivables 88,217 70,901Amounts due from related parties 5,825 6,497Financial assets at fair value through
profit or loss (“FVTPL”) 88,415 9,500Pledged bank deposits 19,726 1,000Time deposits — 134,370Bank balances and cash 87,254 80,738
754,981 776,366
Current liabilitiesTrade and bill payables 13 72,091 42,381Contract liabilities 46,640 25,388Derivative financial instruments 306 —Refund liabilities 10,120 7,321Other payables and accrued charges 44,229 34,803Amounts due to related parties 764 500Provisions 1,401 1,489Tax liabilities 85 2,860Borrowings 11 64,078 237,491Lease liabilities 814 843
240,528 353,076
Net current assets 514,453 423,290
Total assets less current liabilities 758,117 658,121

– 19 –
2020 2019NOTES RMB’000 RMB’000
Non-current liabilitiesLease liabilities — 779Deferred tax liabilities 2,691 —
Net assets 755,426 657,342
Capital and reservesShare capital 10 304 304Reserves 755,122 657,038
Attributable to owners of the Company 755,426 657,342
Total equity 755,426 657,342

– 20 –
NOTES
1. GENERAL INFORMATION
The Company was incorporated in the Cayman Islands and registered as an exempted company with limited liability under the Companies Law Chapter 22 of the Cayman Islands on 1 February 2019. Its shares have been listed on the Stock Exchange since 18 December 2019. The immediate holding company is Ying Stone Holdings Limited (“Ying Stone”), which was incorporated in the British Virgin Islands (the “BVI”) and entirely owned by Mr. Kong Linglei (孔令磊) (“Mr. Kong”). The addresses of the registered office and the principal place of business of the Company are Vistra (Cayman) Limited P.O. Box 31119 Grand Pavilion, Hibiscus Way, 802 West Bay Road, Grand Cayman, KY1-1205 Cayman Islands and No. 4 Meide Street, Meigui Zone of Industrial Park, Pingyin County, Jinan, Shandong Province, China.
The Company is an investment holding company. The principal activities of its subsidiaries are mainly engaged in the manufacturing of steel pipe products and the prefabricated pipe nipple products.
2. APPLICATION OF AMENDMENTS TO HONG KONG FINANCIAL REPORTING STANDARDS (“HKFRSs”)
Amendments to HKFRSs that are mandatorily effective for the current year
In the current year, the Group has applied the Amendments to References to the Conceptual Framework in HKFRS Standards and the following amendments to HKFRSs issued by the Hong Kong Institute of Certified Public Accountants (“HKICPA”) for the first time, which are mandatorily effective for the annual period beginning on or after 1 January 2020 for the preparation of the consolidated financial statements:
Amendments to HKAS 1 and HKAS 8 Definition of MaterialAmendments to HKFRS 3 Definition of a BusinessAmendments to HKFRS 9, HKAS 39 and HKFRS 7 Interest Rate Benchmark Reform
The application of the Amendments to References to the Conceptual Framework in HKFRS Standards and the amendments to HKFRSs in the current year had no material impact on the Group’s financial positions and performance for the current and prior years and/or on the disclosures set out in these consolidated financial statements.

– 21 –
New and amendments to HKFRSs in issue but not yet effective
The Group has not early applied the following new and amendments to HKFRSs which are not yet effective:
HKFRS 17 Insurance Contracts and the related Amendments1
Amendment to HKFRS 16 Covid-19-Related Rent Concessions4
Amendments to HKFRS 3 Reference to the Conceptual Framework2
Amendments to HKFRS 9, HKAS 39, HKFRS 7, HKFRS 4 and HKFRS 16
Interest Rate Benchmark Reform — Phase 25
Amendments to HKFRS 10 and HKAS 28 Sale or Contribution of Assets between an Investor and its Associate or Joint Venture3
Amendments to HKAS 1 Classification of Liabilities as Current or Non-current and related amendments to Hong Kong Interpretation 5 (2020)1
Amendments to HKAS 16 Property, Plant and Equipment-Proceeds before Intended Use2
Amendments to HKAS 37 Onerous Contracts — Cost of Fulfilling a Contract2
Amendments to HKFRSs Annual Improvements to HKFRSs 2018–20202
1 Effective for annual periods beginning on or after 1 January 2023.2 Effective for annual periods beginning on or after 1 January 2022.3 Effective for annual periods beginning on or after a date to be determined.4 Effective for annual periods beginning on or after 1 June 2020.5 Effective for annual periods beginning on or after 1 January 2021.
The directors of the Company anticipate that the application of the new and amendments to HKFRSs will have no material impact on the consolidated financial statements in the foreseeable future.
3. REVENUE AND SEGMENTAL INFORMATION
Revenue
Revenue represents the fair value of amounts received and receivable from the sales of goods provided by the Group to related companies/external customers, net of related taxes. The following is an analysis of the Group’s revenue for the current year:
2020 2019RMB’000 RMB’000
Recognised at a point in time:Sales of pipe products:
— ERW steel pipes 302,040 367,038— Standard prefabricated pipe nipples 296,550 286,557— Spiral Submerged Arc Welded steel pipes 310,865 214,776— Customised steel pipes 172,362 201,821— Design and supply assembled piping system 14,554 11,867
Trading of raw materials 158,768 43,222
1,255,139 1,125,281

– 22 –
Segmental information
The Group’s operation is derived from the production and sales of pipe products in the PRC and Vietnam. For the purpose of resources allocation and performance assessment, the chief operating decision maker (“CODM”) (i.e. the chief executive officer) reviews the overall results and financial position of the Group as a whole, which are prepared based on same accounting policies. Accordingly, no operating segment is presented.
Geographical information
Information about the Group’s revenue from external customers is presented based on the destination of goods in the sales orders/contracts. Information about the Group’s non-current assets (excluding deferred tax assets) is presented based on the geographical location of the assets.
Revenue from external customers
Non-current assets (note)
Year ended 31 December As at 31 December2020 2019 2020 2019
RMB’000 RMB’000 RMB’000 RMB’000
PRC 778,225 618,975 234,890 228,194The United States of America (“US”) 200,377 205,684 — —Other countries in America (excluding US) 91,046 120,627 — —Other countries in Asia (excluding PRC) 114,418 118,849 7,238 5,404Europe 20,181 17,931 — —Others 50,892 43,215 — —
1,255,139 1,125,281 242,128 233,598
Note: Non-current assets excluded deferred tax assets.
Information about major customer
Revenue from customer of the corresponding year contributing over 10% of the total sales of the Group are as follows:
2020 2019
RMB’000 RMB’000
Customer A N/A 138,115
Note: During the year ended 31 December 2020, there was no customer contributing over 10% of the total sales.

– 23 –
4. OTHER INCOME/OTHER GAINS AND LOSSES
2020 2019RMB’000 RMB’000
Other incomeGovernment grant (note i) 4,450 1,670Bank interest income 330 179
4,780 1,849
2020 2019RMB’000 RMB’000
Other gains and lossesGain on sales of scrap materials 7,814 7,312Fair value gains on financial assets at FVTPL
— structured bank deposits 1,602 1,176— foreign currency forward contracts (note ii) 978 824
Fair value (losses) gains on derivative financial instruments (note iii) (668) 526
Gains (losses) on disposals of property, plant and equipment 552 (47)Net exchange (losses) gains (9,858) 1,026Others 217 779
637 11,596
Notes:
i. During the year, the relevant government authorities granted one-off and unconditional subsidies to the Group amounting to RMB4,245,000 (2019: RMB1,645,000) and granted conditional subsidies to the Group amounting to RMB205,000 (2019: RMB25,000).
ii. During the year ended 31 December 2020, gains on US$ to RMB foreign currency forward contracts represented realised gains of RMB63,000 (2019: RMB824,000) and unrealised gains of RMB915,000 (2019: nil) on changes in fair value of foreign currency forward contracts.
iii. During the year ended 31 December 2020, amount represented realised losses of RMB362,000 (2019: realised gains of RMB526,000) and unrealised losses of RMB306,000 (2019: unrealised losses of nil) arising on changes in fair value of commodity derivative contracts.

– 24 –
5. PROFIT BEFORE TAXATION
2020 2019
RMB’000 RMB’000
Profit before taxation has been arrived at after charging (crediting):
Auditor’s remuneration 1,980 2,180Directors’ emoluments 2,923 2,661
Other staff costs:
— Salaries and other benefits 67,643 61,592— Contributions to retirement benefit schemes 4,716 10,599
Less: capitalised in inventories (44,857) (45,832)
Total staff costs 27,502 26,359
Depreciation of property, plant and equipment 23,758 19,572Less: capitalised in inventories (19,599) (16,150)
Total depreciation 4,159 3,422Cost of inventories sold 987,653 863,881Write-down of inventories (included in cost of inventories sold) 659 366
6. FINANCE COSTS
2020 2019
RMB’000 RMB’000
Finance costs represent interests on:
— bank borrowings 5,054 6,743— other borrowings from a related party — 5,434— discounted bills — 276— lease liabilities 57 94
5,111 12,547

– 25 –
7. TAXATION CHARGE
2020 2019
RMB’000 RMB’000
PRC Enterprise Income Tax (“EIT”):
— Current year 7,553 13,895— Over provisions in prior years (5,244) (11)
2,309 13,884Deferred tax charge 2,388 566
Taxation charge 4,697 14,450
Under the Law of the PRC on EIT and Implementation Regulation of the EIT Law, the tax rate of the Group’s PRC subsidiaries is 25%.
Jinan Mech Piping Technology Co., Ltd (“Jinan Mech”) was recognised as a High and New Technology Enterprises in the year 2017 and 2020, respectively, and the applicable tax rate is 15% from 1 January 2017 to 31 December 2022.
Jinan Magang Steel Pipes Manufacturing Company (“Jinan Ma Steel”) was recognised as a High and New Technology Enterprises in the year 2015 and 2018, respectively, and the applicable tax rate is 15% from 1 January 2015 to 31 December 2020.
No provision for income tax has been made for Tube Industry Investments Limited in Hong Kong as there was no estimated assessable profit both year.
The Company and the group entity incorporated in the BVI is not subject to income tax in the Cayman Islands or any other jurisdiction.
Under the tax law in Vietnam, the tax rate of Viet Nam Piping Industries Company Limited is 20%. Viet Nam Piping Industries Company Limited has been granted to enjoy 2-years exemption of income tax followed by 4-year 50% reduction of income tax from the first profit making year. Starting from 2019, Viet Nam Piping Industries Company Limited enjoyed the 2-years exemption of income tax.

– 26 –
The taxation charge for the year can be reconciled to the profit before taxation as follows:
2020 2019
RMB’000 RMB’000
Profit before taxation 104,224 104,123
Taxation at PRC EIT rate of 25% 26,056 26,031Tax effect of expenses not deductible for tax purpose 733 926Tax effect of deductible temporary differences not recognised (152) —
Tax deduction on research and development expenses (note) (8,763) (2,346)Over provisions in prior years (5,244) (11)Effect of different tax rates of subsidiaries operating in other
jurisdictions (321) (287)Income tax at concessionary rate (7,612) (9,863)
Taxation charge for the year 4,697 14,450
Note: Pursuant to Caishui [2018] circular No.99, Jinan Mech and Jinan Ma Steel enjoy super deduction of 175% (2019: 175%) on qualified research and development expenditure for the year ended 31 December 2020 and 2019.
8. EARNINGS PER SHARE
The calculation of the basic earnings per share is based on the following data:
2020 2019
RMB’000 RMB’000
Earnings:
Earnings for the purpose of basic earnings per share (profit for the year — attributable to owners of the Company) 99,527 77,342
2020 2019
’000 ’000
Number of shares:
Weighted average number of ordinary shares for the purpose of calculating basic earnings per share 433,800 291,449
The weighted average number of ordinary shares for the purpose of calculating basic earnings per share has been determined on the assumption that the Reorganisation and Capitalisation Issue (as defined in note 10) has been effective on 1 January 2018.
No diluted earnings per share was presented as there were no potential ordinary shares in issue.

– 27 –
9. TRADE RECEIVABLES
2020 2019
RMB’000 RMB’000
Trade receivables 211,667 191,908Less: allowance of impairment loss (7,943) (6,003)
Total trade receivables 203,724 185,905
As at 1 January 2019, trade receivables from contracts with customers amounted to RMB165,181,000.
The Group allows credit period of 15 to 360 days to its trade customers. The following is an ageing analysis of trade receivables, net of allowance for impairment loss, presented based on the invoice date at the end of each reporting period.
2020 2019
RMB’000 RMB’000
0–60 days 97,376 128,97061–180 days 70,279 52,329181 days–1 year 27,694 3,769Over 1 year 8,375 837
203,724 185,905
Before accepting any new customer, the Group will assess the potential customer’s credit quality and defines its credit limits. Credit sales are made to customers with a satisfactory trustworthy credit history. Credit limits attributed to customers are reviewed regularly.
The Group did not hold any collateral over these balances.
The Group has applied the simplified approach in HKFRS 9 to measure the loss allowance at lifetime ECL. Apart of debtors with credit-impaired and customers with outstanding significant trade receivables exceeding RMB10,000,000 and relevant contract assets, the Group determines the ECL on these items using a provision matrix grouped into the following categories with reference to past default experience for recurring customers and current past due exposure for new customers.
– 28 –
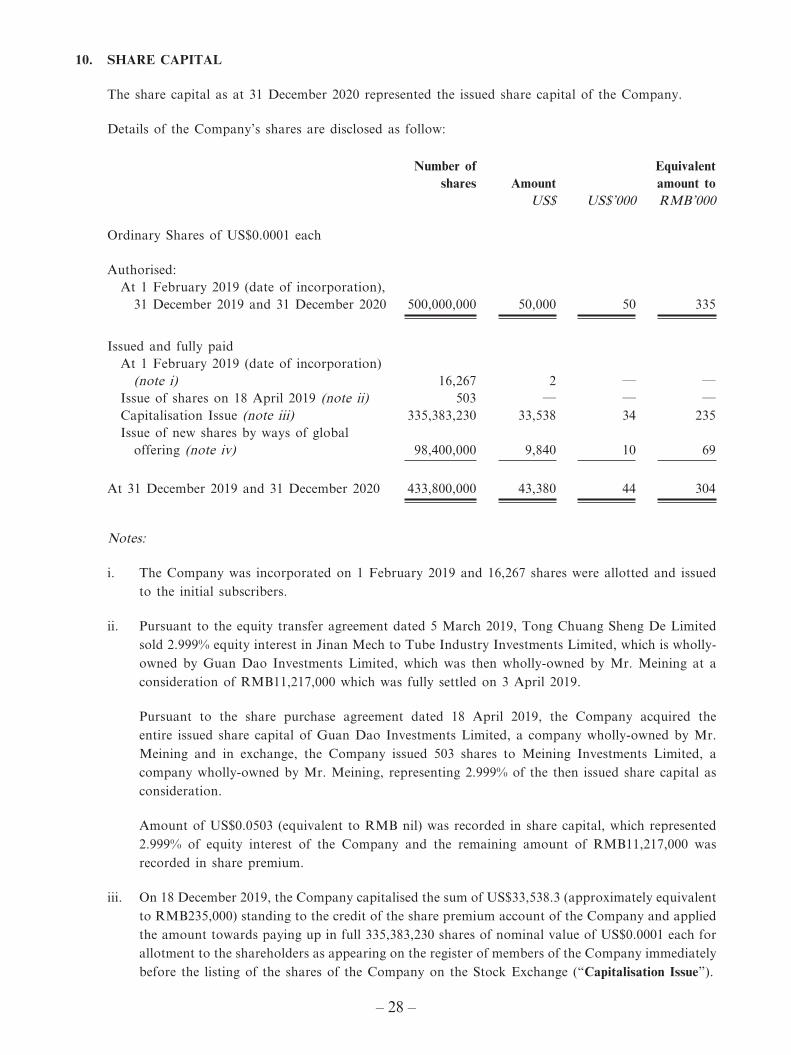
10. SHARE CAPITAL
The share capital as at 31 December 2020 represented the issued share capital of the Company.
Details of the Company’s shares are disclosed as follow:
Number of shares Amount
Equivalent amount to
US$ US$’000 RMB’000
Ordinary Shares of US$0.0001 each
Authorised:At 1 February 2019 (date of incorporation),
31 December 2019 and 31 December 2020 500,000,000 50,000 50 335
Issued and fully paidAt 1 February 2019 (date of incorporation)
(note i) 16,267 2 — —Issue of shares on 18 April 2019 (note ii) 503 — — —Capitalisation Issue (note iii) 335,383,230 33,538 34 235Issue of new shares by ways of global
offering (note iv) 98,400,000 9,840 10 69
At 31 December 2019 and 31 December 2020 433,800,000 43,380 44 304
Notes:
i. The Company was incorporated on 1 February 2019 and 16,267 shares were allotted and issued to the initial subscribers.
ii. Pursuant to the equity transfer agreement dated 5 March 2019, Tong Chuang Sheng De Limited sold 2.999% equity interest in Jinan Mech to Tube Industry Investments Limited, which is wholly-owned by Guan Dao Investments Limited, which was then wholly-owned by Mr. Meining at a consideration of RMB11,217,000 which was fully settled on 3 April 2019.
Pursuant to the share purchase agreement dated 18 April 2019, the Company acquired the entire issued share capital of Guan Dao Investments Limited, a company wholly-owned by Mr. Meining and in exchange, the Company issued 503 shares to Meining Investments Limited, a company wholly-owned by Mr. Meining, representing 2.999% of the then issued share capital as consideration.
Amount of US$0.0503 (equivalent to RMB nil) was recorded in share capital, which represented 2.999% of equity interest of the Company and the remaining amount of RMB11,217,000 was recorded in share premium.
iii. On 18 December 2019, the Company capitalised the sum of US$33,538.3 (approximately equivalent to RMB235,000) standing to the credit of the share premium account of the Company and applied the amount towards paying up in full 335,383,230 shares of nominal value of US$0.0001 each for allotment to the shareholders as appearing on the register of members of the Company immediately before the listing of the shares of the Company on the Stock Exchange (“Capitalisation Issue”).

– 29 –
iv. On 18 December 2019, the Company issued 98,400,000 ordinary shares of nominal value of US$0.0001 each pursuant to the global offering at the price of HK$2.28 per ordinary share and the Company’s shares were listed on the Stock Exchange on the same date.
11. BORROWINGS
2020 2019RMB’000 RMB’000
Secured bank borrowings (note a) 54,064 30,040Unsecured bank borrowings (note b) 10,014 189,251Discounted bills borrowings (note c) — 18,200
64,078 237,491
Carrying amounts of borrowings:— repayable within one year 64,078 237,491
Notes:
a As at 31 December 2020, the secured bank borrowings amounting RMB12,000,000 (2019: RMB30,040,000) carried variable interest rate at benchmark lending rate of the PRC plus 0.3% (2019: plus 0.2%), approximately 4.35% (2019: 4.55%) per annum, and amounting RMB42,064,000 carried fixed interest rate at 4.35% or 3.85% per annum.
b As at 31 December 2020, the unsecured bank borrowings carried fixed interest rate at 4.55% per annum. As at 31 December 2019, the unsecured bank borrowings carried variable interest rate at benchmark lending rate of the PRC plus 0.04%, approximately 4.39% per annum.
c As at 31 December 2019, the discounted bills borrowings carried fixed interest rate at 2.88% per annum.
12. PLEDGE OF ASSETS
At the end of the reporting period, the Group has pledged the following assets to secure the general banking facilities granted to the Group.
2020 2019RMB’000 RMB’000
Property, plant and equipment 56,694 13,040Right-of-use assets 43,474 706Trade receivables backed by bills 15,290 18,200Pledged bank deposits 19,726 1,000
135,184 32,946
– 30 –
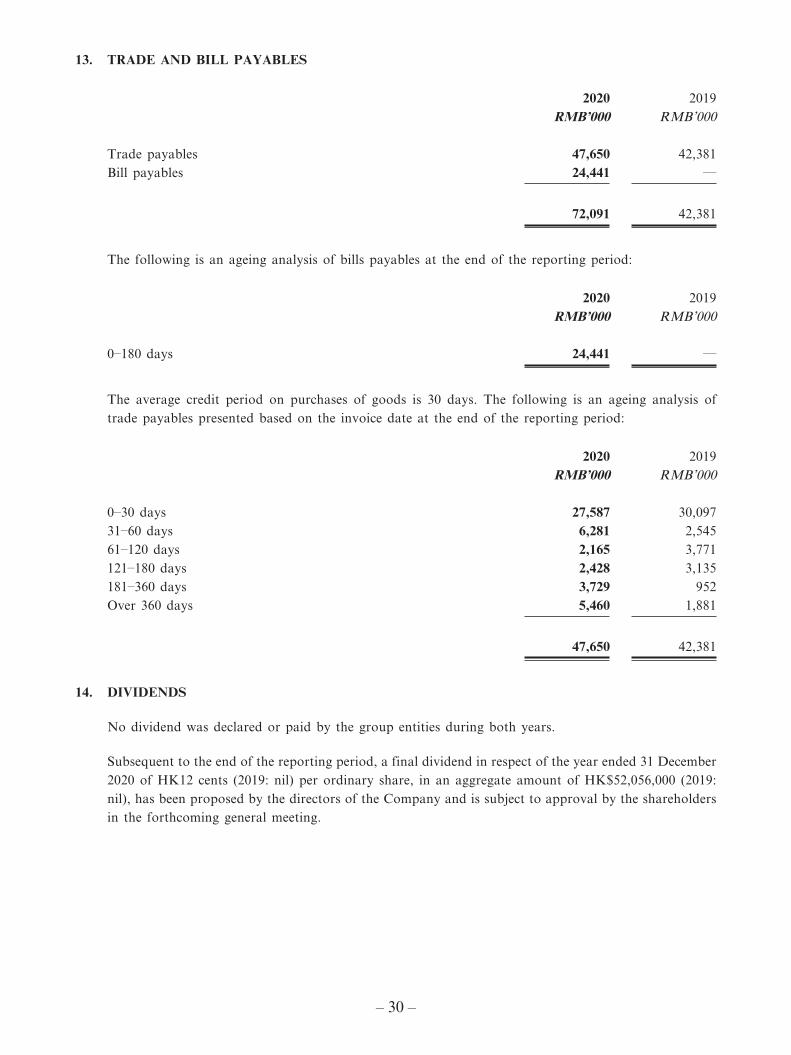
13. TRADE AND BILL PAYABLES
2020 2019RMB’000 RMB’000
Trade payables 47,650 42,381Bill payables 24,441 —
72,091 42,381
The following is an ageing analysis of bills payables at the end of the reporting period:
2020 2019RMB’000 RMB’000
0–180 days 24,441 —
The average credit period on purchases of goods is 30 days. The following is an ageing analysis of trade payables presented based on the invoice date at the end of the reporting period:
2020 2019RMB’000 RMB’000
0–30 days 27,587 30,09731–60 days 6,281 2,54561–120 days 2,165 3,771121–180 days 2,428 3,135181–360 days 3,729 952Over 360 days 5,460 1,881
47,650 42,381
14. DIVIDENDS
No dividend was declared or paid by the group entities during both years.
Subsequent to the end of the reporting period, a final dividend in respect of the year ended 31 December 2020 of HK12 cents (2019: nil) per ordinary share, in an aggregate amount of HK$52,056,000 (2019: nil), has been proposed by the directors of the Company and is subject to approval by the shareholders in the forthcoming general meeting.

– 31 –
USE OF PROCEEDS
The Company has raised gross proceeds of approximately HKD224.4 million (RMB201.8 million) through the global offering upon the Listing. After deducting the listing expenses, the net proceeds amounted to approximately HKD183.6 million (RMB166.4 million). Such net proceeds are intended to be applied in the same manner and the same proportion as disclosed in the section headed “Future Plans and Use of Proceeds” of the Prospectus.
As at 31 December 2020, the net proceeds from the global offering had been applied as follows:
Percentage
of total net
proceeds from
the Global
Offering
Planned use of
net proceeds
from the Global
Offering
Remaining net
proceeds as at
31 December
2019
Actual use
of proceeds for
the year ended
31 December
2020
Remaining net
proceeds as at
31 December
2020
Expected timeline of full
utilisation of the remaining
proceeds from the Global
Offering as at
31 December 2020
RMB$’000 RMB$’000 RMB$’000 RMB$’000 (Note 1)
Increasing our production capacity of our
production of ERW steel pipes
19.0% 31,625 31,625 31,625 — —
Upgrading one of the SSAW steel pipes
production line
22.3% 37,118 37,118 1,284 35,834 By the end of 2021 (Note 2)
Setting up a new production facilities
building
9.4% 15,646 15,646 — 15,646 By the end of 2021 (Note 2)
Expanding to overseas to increase the
production capacity
9.4% 15,646 15,646 4,221 11,425 By the end of 2021 (Note 2)
Expanding our business horizontally
through acquisition/collaboration
10.0% 16,645 16,645 — 16,645 By the end of 2021 (Note 2)
Strengthen research and development
capabilities
10.0% 16,645 16,645 16,645 — —
Repayment of borrowings 10.0% 16,645 — — — —
General working capital 9.9% 16,478 13,416 13,416 — —
100% 166,448 146,741 67,191 79,550
Notes:
1. The expected timeline of full utilisation is based on the Directors’ best estimation barring unforeseen circumstances.
2. The Company originally planned to apply the funds raised in the (i) upgrading the spiral submerged arc welded steel pipes; (ii) setting up a new production facilities building; (iii) expanding to overseas to increase the production capacity by the fourth quarter of 2020; and (iv) expanding our business horizontally through acquisition/collaboration by the first quarter of 2021. However, due to the outbreak of the COVID-19 pandemic and the impact on the PRC and global economy, the development plans slowed down.
As at 31 December 2020, based on the best estimation of Directors barring any unforeseen circumstances beyond the Group’s control, it is expected that the unused net proceeds for (i) upgrading one of the SSAW steel pipes production line; (ii) setting up a new production facilities building; (iii) expanding to overseas to increase the production capacity; and (iv) Expanding our business horizontally through acquisition/collaboration to be fully utilised by end of 2021.

– 32 –
During the year ended 31 December 2020, the actual application of the net proceeds from the Listing were used and expected to be used according to the intentions previously disclosed in the Prospectus and saved for the disclosure above, there was no material change or delay in the use of proceeds. The unutilised amount is expected to be used in accordance with the Company’s plan as disclosed in the Prospectus.
MODEL CODE FOR SECURITIES TRANSACTION BY DIRECTORS
The Company has adopted the Model Code for Securities Transactions by Directors of Listed Issuers set out in Appendix 10 of the Listing Rules (the “Model Code”) as its own code of conduct governing securities transactions by the Directors. Having made specific enquiry of all the Directors, all Directors have confirmed that they have complied with the Model Code during the year ended 31 December 2020 and up to the date of this announcement.
CORPORATE GOVERNANCE
The Board has reviewed the Company’s corporate governance practices and is of the view that during the year ended 31 December 2020, the Company has complied with the applicable code provisions of the Corporate Governance Code as set out in Appendix 14 to the Listing Rules.
PUBLIC FLOAT
As at the date of this announcement, based on the information that is publicly available to the Company and within the knowledge of the Directors, the Company has maintained the prescribed public float under the Listing Rules.
COMPLIANCE ADVISER’S INTERESTS
As informed by the Company’s compliance adviser, Fortune Financial Capital Limited (the “Compliance Adviser”), as at 31 December 2020, except for the compliance adviser agreement entered into between the Company and the Compliance Adviser dated 14 May 2019, the Compliance Adviser nor its directors, employees or close associates had any interests in relation to the Group, which is required to be notified to the Group pursuant to the Listing Rules.
PURCHASE, SALE OR REDEMPTION OF THE LISTED SECURITIES OF THE COMPANY
Neither the Company nor any of the subsidiaries of the Company purchased, redeemed or sold the listed securities of the Company during the year ended 31 December 2020.
– 33 –
SCOPE OF WORK OF MESSRS. DELOITTE TOUCHE TOHMATSU
The figures in respect of the Group’s consolidated statement of financial position, consolidated statement of profit or loss and other comprehensive income and the related notes thereto for the year ended 31 December 2020 as set out in this announcement have been agreed by the Group’s auditor, Messrs. Deloitte Touche Tohmatsu, to the amounts set out in the Group’s audited consolidated financial statements for the year. The work performed by Messrs. Deloitte Touche Tohmatsu in this respect did not constitute an assurance engagement in accordance with Hong Kong Standards on Auditing, Hong Kong Standards on Review Engagements or Hong Kong Standards on Assurance Engagements issued by the Hong Kong Institute of Certified Public Accountants and consequently no assurance has been expressed by Messrs. Deloitte Touche Tohmatsu on the preliminary announcement.
REVIEW BY THE AUDIT COMMITTEE
The annual results of the Company for the year ended 31 December 2020 has been reviewed by the audit committee of the Company.
ANNUAL GENERAL MEETING
The AGM of the Company will be held in Hong Kong on Monday, 31 May 2021. The notice of the AGM will be issued and despatched in due course.
CLOSURE OF REGISTER OF MEMBERS
The register of members of the Company will be closed during the following periods:
i) From Wednesday, 26 May 2021 to Monday, 31 May 2021 (both days inclusive), during which period no transfer of Shares will be registered. In order to determine the identity of the Shareholders who are entitled to attend and vote at the AGM, all completed transfer documents accompanied by the relevant share certificates have to be lodged with the Company’s branch share registrar in Hong Kong, Computershare Hong Kong Investor Services Limited of Shops 1712–1716, 17th Floor, Hopewell Centre, 183 Queen’s Road East, Wanchai, Hong Kong, for registration not later than 4:30 p.m. on Tuesday, 25 May 2021.
ii) From Tuesday, 15 June 2021 to Friday, 18 June 2021, both days inclusive, for the purpose of ascertaining shareholders’ entitlement to the proposed final dividend. In order to establish entitlements to the proposed final dividend, all completed transfer documents accompanied by the relevant share certificates have to be lodged with

– 34 –
the Company’s branch share registrar, Computershare Hong Kong Investor Services Limited of Shops 1712–1716, 17th Floor, Hopewell Centre, 183 Queen’s Road East, Wanchai, Hong Kong, for registration not later than 4:30 p.m. on Friday, 11 June 2021.
By order of the Board Maike Tube Industry Holdings Limited
KONG Linglei Chairman and executive Director
Hong Kong, 22 March 2021
As at the date of this announcement, the executive directors of the Company are Mr. KONG Linglei, Mr. GUO Lei, Mr. XU Jianjun and Mr. YANG Shufeng; the non-executive Director is Ms. ZHAO Xuelian; and the independent non-executive directors of the Company are Mr. LIU Fengyuan, Mr. DING Xiaodong and Mr. MA Changcheng.