mail order houses (atalogers) - npes · mail-order houses (atalogers) ... this industry comprises...
TRANSCRIPT

NAICS 454113
Mail-Order Houses
(Catalogers)
Exclusive Commentary from Dr. Joe Webb and Richard Romano
1

NAICS 454113
Exclusive Commentary
Mail-Order Houses (Catalogers)
[NAICS 454113] These businesses are included in this report because of their use of printed catalogs and e-commerce that require imaging and publishing technologies in support of those media.
The Bureau of the Census definition for this business classification (actually 454110):
This industry comprises establishments primarily engaged in retailing all types of merchandise using nonstore means, such as catalogs, toll free telephone numbers, or electronic media, such as interactive television or the Internet. Included in this industry are establishments primarily engaged in retailing from catalog showrooms of mail-order houses.
Geographic Distribution • Many “catalogers” are retail, wholesale, or other merchants (L.L. Bean, e.g.) which are
classified in a variety of different NAICS.
• California (13.0%), Florida (9.1%), and New York (7.1%) are the three biggest states for
mail-order houses.
• New York-Newark-Jersey City (7.3%), Los Angeles-Long Beach-Anaheim (5.9%), and
Miami-Fort Lauderdale-West Palm Beach (3.2%) are the top three metro areas for mail-
order houses.
• Some of the largest mail-order houses are located in the Midwest, roughly equidistant
shipping-wise to the rest of the country.
• In general, Metropolitan Statistical Areas (MSAs) are urbanized areas that have at least
50,000 people. Combined Statistical Areas (CSAs) are much larger metropolitan population
regions that include MSAs as well as associated bordering areas. For more details, please
refer to the “Key Terms and Definitions” beginning on page 5 of this report.
• The top combined statistical areas (CSAs) are:
Combined Statistical Area New York Los Angeles % of All Establishments 8.8% 7.3%
Establishments 502 413
Employees 11,255 6,886
Payroll $877 Million $399 Million
Sales $11.5 Billion $6.6 Billion
2

NAICS 454113
Commentary (continued)
Demographics
Establishments
• In 2015, there were 5,689 U.S. mail-order houses.
Two-thirds (67%) of mail-order houses have fewer than 10 employees, and 88%
have less than 50 employees.
From 2013 to 2015, the number of mail-order houses declined by -4.1%.
• The past decade has seen a bit of churn in the number of mail-order establishments, but
from 2014 to 2015, establishments are up +1.1%.
This isn’t a very large market category, and tends to be concentrated among under-
50-employee establishments.
• 1- to 4-employee establishments grew +0.8% while 5- to 9-employee establishments grew
+0.6%.
• 20- to 49-employee establishments grew +3.0%, which works out to 16 establishments.
Employees
• In 2015, there were a total of 177,745 employees in mail-order houses.
• Overall mail-order house employment from 2014 to 2015 is down -1.0%.
• In the 50- to 99-employee category, employment was up +5.0%, which is about 900
employees.
In the very large category (500 to 999 employees), employment was up +10.9%,
which translates to 3,500 employees.
• Generally, payroll has been on the upswing—it has increased +11.4% since 2010, and
down modestly (-1.2%) from 2014 to 2015.
Revenues/Value of Shipments
• In 2015, mail-order houses reported revenues of $184.1 billion.
Large firms accounted for 84% of revenues, mid-sized firms accounted for 12% of
revenues, and small mail-order houses accounted for 4% of revenues.
• Regionally, mail-order houses in the Great Lakes region accounted for 26.6% of revenues.
• Mail-order houses in New England accounted for 5.4% of revenues.
3
NAICS 454113
Commentary (continued)
Technology Impacts and Competitive Trends
• It was more than a decade ago that Catalog Age magazine changed its name to Multichannel
Merchant, a sign that the times were changing.
• Mail-order houses are more likely to be exploring email and social media marketing than
the traditional printed catalog.
• According to Multichannel Merchant’s The State of Catalog Marketing in the Digital Era
report, 11% of catalogers reported that they increased the page counts of their catalogs,
while 67% remained the same;
44% increased catalog circulation, while 44% kept it the same;
33% increased the frequency of their catalogs, while 55% kept it the same. 1
• Virtually all respondents to the MCM Outlook 2017 survey (95.5%) said they use
ecommerce sites and email as marketing tools, while social media and catalog were just
behind at 90.9%.
• Mail-order houses and catalogers face competition from Amazon, which has been offering a
lot of the same items and brands at cheaper prices, and with (often) free shipping.
• It is easier than ever to become a “mail-order” business in the e-commerce era, with many
turnkey e-commerce solutions available, even some services offered by Amazon.
This means that many single-individual businesses (nonemployers) can outsource
all their functions to others on a scalable basis rather than creating fixed-cost
infrastructure.
———————————————————————————————————————————--
1 http://multichannelmerchant.com/wp-content/
uploads/2017/03/29678_MCM_MarketingSpecialReport_Catalog_v2.pdf
4

NAICS 454113
Key Terms and Definitions
Annual Survey of Manufactures (Source) - The Annual Survey of Manufactures (ASM) provides key intercensal measures of manufacturing activity, products, and
location for the public and private sectors. The ASM provides the best measure of current U.S. manufacturing industry
outputs, inputs, operating status, and is the primary basis for updates of the Longitudinal Research Database (LRD). Census
Bureau staff and academic researchers use the LRD for micro data analysis.
Statistics are available on a sample universe of manufacturing establishments with one or more paid employees at any time
during the year for manufacturing classified in NAICS sectors 31–33. Employment, payroll, hours, cost of materials, receipts,
value added, capital expenditures, and relative standard errors data are available for the U.S. and states at the 2- through 4-
digit NAICS levels. Product shipments value data are available at the 6-digit North American Industry Classification System
(NAICS) level and 7-digit NAICS product class levels based on NAICS.
The ASM is conducted annually, except for years ending in 2 and 7, at which time ASM data are included in the manufacturing
sector of the Economic Census.
Consolidated (or Combined) Statistical Area (CSA) - Consolidated Statistical Areas are a combination of metropolitan areas that have significant economic interaction and
dependency. PrintStats includes the top five CSAs in each report based on total population, without regard to the number of
industry establishments. These CSAs are very large, and in fact, larger than many countries. These are the details of their
composition:
• New York CSA is the combination of these Metropolitan and Micropolitan Statistical Areas: New York-Newark-
Jersey City, Bridgeport-Stamford-Norwalk, New Haven-Milford, Allentown-Bethlehem-Easton, Trenton,
Torrington, Kingston, East Stroudsburg
• Los Angeles CSA includes: Los Angeles-Long Beach-Anaheim, Riverside-San Bernardino-Ontario, Oxnard-
Thousand Oaks-Ventura
• Chicago CSA includes: Chicago-Naperville-Elgin, Ottawa-Peru, Kankakee, Michigan City-La Porte
• Washington D.C. CSA includes: Washington-Arlington-Alexandria, DC-VA-MD-WV, Baltimore-Columbia-
Towson, Hagerstown-Martinsburg, Chambersburg-Waynesboro, Winchester, California-Lexington Park, Easton,
Cambridge
• San Francisco CSA includes: San Francisco-Oakland-Hayward, San Jose-Sunnyvale-Santa Clara, Stockton-Lodi,
Santa Rosa, Vallejo-Fairfield, Santa Cruz-Watsonville, Napa
(see also Metropolitan Statistical Area)
Content Creation (Source) - The contribution of information to any medium/media, especially to digital media for an end-user/audience in specific
contexts. “Content” can be text, photographic images, illustrations, graphic design, video, or any other intellectual property.
Typical forms of modern content creation include maintaining and updating web sites, blogging, photography, videography,
online commentary, the maintenance of social media accounts, and editing and distribution of digital media.
County Business Patterns [CBP] (Source) - CBP is an annual series that provides subnational economic data by industry. This series includes the number of
establishments, employment during the week of March 12, first quarter payroll, and annual payroll.
5

NAICS 454113
Key Terms and Definitions (continued)
Demographics (Source) - The statistical characteristics of human populations (such as age or income) used especially to identify markets. In business, a
particular market or segment of the population.
Economic Census (Source) - The Economic Census is the U.S. Government's official five-year measure of American business and the economy. It is
conducted by the U.S. Census Bureau, and response is required by law.
Employee (Source) - An individual hired by another individual or business usually for wages or salary and in a position below the executive level.
Establishment (Source) - An establishment is a single physical location at which business is conducted or where services or industrial operations are
performed. It is not necessarily identical with a company or enterprise, which may consist of one or more establishments.
Estimate (Source) - A value that is usable for some purpose even if input data may be incomplete, uncertain, or unstable. The value is nonetheless
usable because it is derived from the best information available. Typically, deriving an estimate involves using the value of a
statistic derived from a sample to estimate the value of a corresponding population parameter. The sample provides
information that can be projected, through various formal or informal processes, to determine a range most likely to describe
the missing information.
Forecast (Source) - Forecasting is the use of historic data to determine the direction of future trends. Businesses use forecasting to determine
how to allocate their budgets or plan for anticipated expenses for an upcoming period of time. This is typically based on the
projected demand for the goods and services they offer.
In terms of PrintStats, the forecasts are limited to statistical trends based on past statistical data. They are not forecasts based
on industry surveys or assessment of economic, social, or technological changes. The PrintStats forecast data should be
viewed only as a starting point for a formal forecast process.
M3 Manufacturing Survey (Source) - The Manufacturers’ Shipments, Inventories, and Orders (M3) survey provides broad-based, monthly statistical data on
economic conditions in the domestic manufacturing sector. The survey measures current industrial activity and provides an
indication of future business trends.
Metropolitan Area (Source) - A metropolitan area, sometimes referred to as a metro area or commuter belt, is a region consisting of a densely populated
urban core and its less-populated surrounding territories, sharing industry, infrastructure, and housing. A metro area usually
comprises multiple jurisdictions and municipalities: neighborhoods, townships, boroughs, cities, towns, exurbs, suburbs,
counties, districts, states, and even nations like the eurodistricts. As social, economic, and political institutions have changed,
metropolitan areas have become key economic and political regions. Metropolitan areas include one or more urban areas, as
well as satellite cities, towns, and intervening rural areas that are socio-economically tied to the urban core, typically
measured by commuting patterns.
6

NAICS 454113
Key Terms and Definitions (continued)
Metropolitan Statistical Area [MSA] (Source) - In the United States, a metropolitan statistical area (MSA) is a geographical region with a relatively high population density at
its core and close economic ties throughout the area. Such regions are neither legally incorporated as a city or town would
be, nor are they legal administrative divisions like counties or separate entities such as states. As such, the precise definition
of any given metropolitan area can vary with the source. A typical metropolitan area is centered on a single large city that
wields substantial influence over the region (e.g., Chicago or Atlanta). However, some metropolitan areas contain more than
one large city with no single municipality holding a substantially dominant position (e.g., Dallas–Fort Worth metroplex,
Norfolk-Virginia Beach [Hampton Roads], Riverside–San Bernardino [Inland Empire], or Minneapolis–Saint Paul).
MSAs are defined by the Office of Management and Budget (OMB) and used by the Census Bureau and other Federal
government agencies for statistical purposes.
(See also Consolidated Statistical Area)
NAICS (Source) - The North American Industry Classification System (NAICS) is the standard used by Federal statistical agencies in classifying
business establishments for the purpose of collecting, analyzing, and publishing statistical data related to the U.S. business
economy.
Nonemployer Statistics (Source) - Nonemployer Statistics is an annual series that provides subnational economic data for businesses that have no paid
employees and are subject to Federal income tax. The data consist of the number of businesses and total receipts by industry.
Most nonemployers are self-employed individuals operating unincorporated businesses (known as sole proprietorships),
which may or may not be the owner's principal source of income.
The majority of all business establishments in the United States are nonemployers, yet these firms average less than 4
percent of all sales and receipts nationally. Due to their small economic impact, these firms are excluded from most other
Census Bureau business statistics (the primary exception being the Survey of Business Owners). The Nonemployers Statistics
series is the primary resource available to study the scope and activities of nonemployers at a detailed geographic level. For
complementary statistics on the firms that do have paid employees, refer to the County Business Patterns. Additional sources
of data on small businesses include the Economic Census, and the Statistics of U.S. Businesses.
Packaging (Source) - Packaging is the technology of enclosing or protecting products for distribution, storage, sale, and use. Packaging also refers
to the process of designing, evaluating, and producing packages. Packaging can be described as a coordinated system of
preparing goods for transport, warehousing, logistics, sale, and end use. In the graphic arts, packaging refers to the design,
manufacturing, and decoration (usually via printing and related technologies) of corrugated paperboard containers, folding
cardboard cartons and containers, paper bags, flexible plastic packaging, and other paper, paperboard, and plastic materials.
Payroll (Source) - Payroll is the sum total of all compensation a business must pay to its employees for a set period of time or on a given date.
Payroll is reported before deductions for social security, income tax, insurance, union dues, etc. This definition of payroll is
the same as that used by the Internal Revenue Service.
7
NAICS 454113
Key Terms and Definitions (continued)
Quarterly Census of Employment and Wages [QCEW] (Source) - The Quarterly Census of Employment and Wages (QCEW) program publishes a quarterly count of employment and wages
reported by employers covering more than 95 percent of U.S. jobs, available at the county, MSA, state, and national levels by
industry.
Quarterly Services Survey (Source) - The Quarterly Services Survey (QSS) is the only source of service industry indicator performance providing timely estimates
of revenue and expenses for selected service industries. The QSS is a principal economic indicator series that produces, for
selected service industries, quarterly estimates of total operating revenue and the percentage of revenue by class of
customer (government, business, consumers, and individuals). The survey also produces estimates of total operating
expenses from tax-exempt firms in industries that have a large not-for-profit component. In addition, for hospital services,
the survey estimates the number of inpatient days and discharges.
Region (Source) - Census Regions are groupings of states and the District of Columbia that subdivide the United States for the presentation of
Census data. There are four Census regions—Northeast, Midwest, South, and West. Each of the four Census regions is
divided into two or more Census divisions. Each Census region is identified by a single-digit Census code. Puerto Rico and
the Island Areas are not part of any Census region or Census division.
PrintStats uses eight regions based on industrial economic activity rather than the Census regions. The 50 U.S. states and
District of Columbia are allocated as follows:
• New England: Connecticut, Maine, Massachusetts, New Hampshire, Rhode Island, Vermont
• Mid-Eastern: Delaware, District of Columbia, Maryland, New Jersey, New York, Pennsylvania, West Virginia
• South Eastern: Alabama, Florida, Georgia, Kentucky, Mississippi, North Carolina, South Carolina, Tennessee,
Virginia
• Great Lakes: Illinois, Indiana, Michigan, Minnesota, Ohio, Wisconsin
• North Central: Idaho, Iowa, Kansas, Missouri, Montana, Nebraska, North Dakota, South Dakota, Wyoming
• South Central: Arkansas, Louisiana, Oklahoma, Texas
• South Western: Arizona, Colorado, Nevada, New Mexico, Utah
• Western: Alaska, California, Hawaii, Oregon, Washington
8

Mail-order Houses (catalogers) (NAICS 454113)
Baseline data from County Business Patterns
This workbook contains the following datasheets (click to open)
Establishments 2015 (Summarized Size Classes)Establishments 2013 (Summarized Size Classes)Establishments 2015 Changes (Summarized Size Classes)Establishments 2015 (Detailed Size Classes)Establishments 2013 (Detailed Size Classes)Establishments 2015 Changes (Detailed Size Classes)Employees 2015 (Summarized Size Classes)Employees 2015 (Detailed Size Classes)Payrolls 2015 (Summarized Size Classes)Payrolls 2015 (Detailed Size Classes)Sales 2015 (Summarized Size Classes)Sales 2015 (Detailed Size Classes)Top 15 States 2015 Top 25 Metros 2015 Top 5 Major Metropolitan Areas (Combined Statistical Areas)Estimates and Statistical Trend 2016-2022
email: [email protected]
Produced exclusively for NPESCopyright 2017, Non-Routine LLC and Strategies for Management, Inc.
9

% of Total Region Rank and State Rank All Sizes Small: 1-9
Empls.Medium: 10-49
Empls.Large: >50+
Empls.
Avg. Employees/
Estab.
U.S. states + DC 100.0% - 5,689 3,839 1,210 640 31.2
New England 6.5% 7 369 246 77 46 26.9 Connecticut 1.5% 24 83 57 17 9 22.4 Maine 0.8% 33 44 31 6 7 34.2 Massachusetts 2.5% 12 143 93 35 15 25.8 New Hampshire 0.8% 33 44 29 7 8 37.1 Rhode Island 0.4% 43 20 13 4 3 19.0 Vermont 0.6% 37 35 23 8 4 24.7
Mid-Eastern 17.0% 3 967 658 202 107 29.4 Delaware 0.4% 43 20 17 1 2 10.5 Washington DC 0.2% 50 9 8 1 4.2 Maryland 1.8% 22 100 67 26 7 13.8 New Jersey 3.1% 8 174 119 33 22 35.6 New York 7.1% 3 405 300 77 28 15.9 Pennsylvania 4.3% 5 244 138 60 46 55.3 West Virginia 0.3% 47 15 9 4 2 44.3
South Eastern 21.5% 1 1,221 820 260 141 33.7 Alabama 0.9% 29 49 31 11 7 23.9 Florida 9.1% 2 520 374 82 64 38.6 Georgia 2.7% 10 152 103 36 13 24.4 Kentucky 1.0% 28 55 29 22 4 20.8 Mississippi 0.5% 40 27 16 9 2 17.3 North Carolina 2.5% 13 141 87 37 17 30.3 South Carolina 0.8% 32 45 27 11 7 27.1 Tennessee 1.8% 21 105 63 27 15 42.7 Virginia 2.2% 16 127 90 25 12 36.0
Great Lakes 17.0% 4 967 597 232 138 47.5 Illinois 3.7% 7 209 143 43 23 27.4 Indiana 1.6% 23 91 53 22 16 66.0 Michigan 2.9% 9 164 100 51 13 16.6 Minnesota 2.6% 11 150 97 36 17 40.7 Ohio 3.9% 6 220 126 49 45 58.6 Wisconsin 2.3% 15 133 78 31 24 93.5
North Central 6.3% 8 357 228 72 57 37.1 Idaho 0.6% 37 35 25 8 2 8.7 Iowa 0.7% 36 42 32 8 2 13.9 Kansas 1.1% 26 60 31 17 12 38.9 Missouri 2.0% 20 113 72 19 22 46.8 Montana 0.4% 41 25 22 3 5.1 Nebraska 0.8% 35 43 25 7 11 60.7 North Dakota 0.2% 48 10 5 2 3 74.1 South Dakota 0.3% 45 19 9 6 4 26.6 Wyoming 0.2% 48 10 7 2 1 75.5
South Central 6.9% 6 394 270 85 39 27.1 Arkansas 0.5% 39 28 21 5 2 17.3 Louisiana 0.8% 30 47 32 9 6 16.5 Oklahoma 0.8% 30 47 36 6 5 15.6 Texas 4.8% 4 272 181 65 26 31.9
South Western 6.9% 5 395 276 77 42 31.0 Arizona 2.2% 17 125 86 23 16 48.1 Colorado 2.1% 19 120 81 28 11 23.1 Nevada 1.0% 27 58 43 12 3 17.8 New Mexico 0.4% 42 23 18 3 2 28.6 Utah 1.2% 25 69 48 11 10 25.5
Western 17.9% 2 1,019 744 205 70 15.8 Alaska 0.1% 51 6 5 1 3.0 California 13.0% 1 738 533 154 51 15.7 Hawaii 0.3% 46 16 13 3 5.2 Oregon 2.1% 18 122 95 20 7 14.5 Washington 2.4% 14 137 98 27 12 19.3
US States + District of Columbia Ranked by Number of
Establishments
Mail-order Houses (catalogers) (NAICS 454113), 2015Number of Establishments
10

% of Total Region Rank and State Rank All Sizes Small: 1-9
Empls.Medium: 10-49
Empls.Large: >50+
Empls.
Avg. Employees/
Estab.
U.S. states + DC 100.0% - 5,934 4,046 1,260 628 31.1
New England 6.4% 7 379 259 73 47 26.5 Connecticut 1.4% 24 86 61 15 10 22.0 Maine 0.8% 30 50 35 8 7 33.3 Massachusetts 2.3% 14 139 94 31 14 25.1 New Hampshire 0.7% 33 44 29 7 8 39.4 Rhode Island 0.3% 43 20 13 4 3 19.4 Vermont 0.7% 35 40 27 8 5 22.1
Mid-Eastern 17.1% 4 1,012 704 206 102 28.4 Delaware 0.3% 45 17 14 1 2 11.5 Washington DC 0.1% 50 5 5 2.6 Maryland 1.6% 23 93 63 23 7 15.2 New Jersey 3.0% 9 176 121 32 23 43.1 New York 7.4% 3 442 331 79 32 16.9 Pennsylvania 4.4% 5 264 161 66 37 44.3 West Virginia 0.3% 46 15 9 5 1 23.5
South Eastern 21.1% 1 1,253 858 262 133 32.4 Alabama 0.8% 31 49 28 15 6 22.1 Florida 9.0% 2 534 395 83 56 33.7 Georgia 2.6% 10 157 105 36 16 21.3 Kentucky 0.9% 27 55 28 21 6 30.6 Mississippi 0.4% 40 26 15 9 2 18.1 North Carolina 2.6% 11 156 106 37 13 23.8 South Carolina 0.9% 28 54 35 14 5 18.0 Tennessee 1.6% 21 96 56 24 16 68.6 Virginia 2.1% 18 126 90 23 13 37.6
Great Lakes 17.1% 3 1,016 640 235 141 46.4 Illinois 3.9% 6 232 162 42 28 27.4 Indiana 1.6% 22 95 56 24 15 57.8 Michigan 3.0% 8 177 112 48 17 17.0 Minnesota 2.6% 12 154 104 35 15 42.2 Ohio 3.8% 7 224 129 53 42 63.1 Wisconsin 2.3% 16 134 77 33 24 86.8
North Central 5.9% 8 353 217 86 50 40.3 Idaho 0.5% 38 32 21 11 9.8 Iowa 0.7% 33 44 33 8 3 18.8 Kansas 0.9% 26 56 29 15 12 46.2 Missouri 1.9% 20 115 67 29 19 50.1 Montana 0.5% 39 27 22 5 5.0 Nebraska 0.7% 36 39 25 5 9 67.7 North Dakota 0.2% 48 11 5 4 2 55.5 South Dakota 0.3% 44 18 8 6 4 29.3 Wyoming 0.2% 48 11 7 3 1 74.0
South Central 7.0% 5 415 278 99 38 28.8 Arkansas 0.4% 42 25 18 4 3 23.0 Louisiana 0.8% 32 48 30 16 2 14.7 Oklahoma 0.7% 36 39 30 5 4 17.4 Texas 5.1% 4 303 200 74 29 33.0
South Western 7.0% 6 415 287 84 44 26.1 Arizona 2.1% 19 124 81 25 18 36.9 Colorado 2.3% 15 135 96 27 12 19.8 Nevada 0.9% 29 53 39 11 3 21.0 New Mexico 0.4% 40 26 17 6 3 32.9 Utah 1.3% 25 77 54 15 8 21.1
Western 18.4% 2 1,091 803 215 73 15.3 Alaska 0.1% 50 5 5 2.8 California 13.4% 1 793 576 166 51 14.8 Hawaii 0.2% 47 13 10 3 6.2 Oregon 2.2% 17 132 104 20 8 16.7 Washington 2.5% 13 148 108 26 14 18.1
US States + District of Columbia Ranked by Number of
Establishments
Mail-order Houses (catalogers) (NAICS 454113), 2013Number of Establishments
11

Region Rank and State Rank All Sizes Small: 1-9
Empls.Medium: 10-49
Empls.Large: >50+
Empls.
Avg. Employees/
Estab.
U.S. states + DC - (245) (207) (50) 12 0.2
New England 2 (10) (13) 4 (1) 0.4 Connecticut 11 (3) (4) 2 (1) 0.4 Maine 14 (6) (4) (2) 0.9 Massachusetts 5 4 (1) 4 1 0.8 New Hampshire 8 (2.3)Rhode Island 9 (0.4)Vermont 13 (5) (4) (1) 2.6
Mid-Eastern 6 (45) (46) (4) 5 1.0 Delaware 6 3 3 (1.0)Washington DC 6 4 3 1 1.6 Maryland 3 7 4 3 (1.4)New Jersey 10 (2) (2) 1 (1) (7.4)New York 25 (37) (31) (2) (4) (0.9)Pennsylvania 22 (20) (23) (6) 9 11.0 West Virginia 9 (1) 1 20.8
South Eastern 5 (32) (38) (2) 8 1.3 Alabama 9 3 (4) 1 1.8 Florida 20 (14) (21) (1) 8 4.9 Georgia 14 (5) (2) (3) 3.1 Kentucky 9 1 1 (2) (9.7)Mississippi 7 1 1 (0.9)North Carolina 21 (15) (19) 4 6.4 South Carolina 16 (9) (8) (3) 2 9.0 Tennessee 1 9 7 3 (1) (25.9)Virginia 8 1 2 (1) (1.6)
Great Lakes 7 (49) (43) (3) (3) 1.1 Illinois 23 (23) (19) 1 (5) (0.0)Indiana 12 (4) (3) (2) 1 8.2 Michigan 19 (13) (12) 3 (4) (0.4)Minnesota 13 (4) (7) 1 2 (1.5)Ohio 13 (4) (3) (4) 3 (4.5)Wisconsin 9 (1) 1 (2) 6.7
North Central 1 4 11 (14) 7 (3.2)Idaho 7 3 4 (3) 2 (1.1)Iowa 11 (2) (1) (1) (4.8)Kansas 6 4 2 2 (7.3)Missouri 11 (2) 5 (10) 3 (3.3)Montana 11 (2) (2) 0.0 Nebraska 6 4 2 2 (7.0)North Dakota 10 (1) (2) 1 18.6 South Dakota 8 1 1 (2.8)Wyoming 10 (1) (1) 1.5
South Central 4 (21) (8) (14) 1 (1.7)Arkansas 7 3 3 1 (1) (5.7)Louisiana 10 (1) 2 (7) 4 1.8 Oklahoma 2 8 6 1 1 (1.7)Texas 24 (31) (19) (9) (3) (1.0)
South Western 3 (20) (11) (7) (2) 4.8 Arizona 8 1 5 (2) (2) 11.3 Colorado 22 (15) (15) 1 (1) 3.2 Nevada 4 5 4 1 (3.3)New Mexico 12 (3) 1 (3) (1) (4.3)Utah 15 (8) (6) (4) 2 4.4
Western 8 (72) (59) (10) (3) 0.5 Alaska 8 1 1 0.2 California 26 (55) (43) (12) 0.9 Hawaii 7 3 3 (1.0)Oregon 17 (10) (9) (1) (2.2)Washington 18 (11) (10) 1 (2) 1.3
US States + District of Columbia Ranked by Change in Number of
Establishments
Mail-order Houses (catalogers) (NAICS 454113), 2015Change in Number of Establishments
12

% of TotalRegion Rank
and State Rank
All Sizes 1-4Empls.
5-9 Empls.
10-19Empls.
20-49Empls.
50-99Empls.
100-249Empls.
250-499Empls.
500+Empls.
Avg. Employees/
Estab.
U.S. states + DC 100.0% - 5,689 2,967 872 655 555 268 219 86 67 31.2
New England 6.5% 7 369 189 57 44 33 17 20 8 1 26.9 Connecticut 1.5% 24 83 41 16 11 6 2 6 1 22.4 Maine 0.8% 33 44 25 6 3 3 4 1 2 34.2 Massachusetts 2.5% 12 143 75 18 20 15 5 7 2 1 25.8 New Hampshire 0.8% 33 44 22 7 4 3 4 1 3 37.1 Rhode Island 0.4% 43 20 9 4 2 2 2 1 19.0 Vermont 0.6% 37 35 17 6 4 4 4 24.7
Mid-Eastern 17.0% 3 967 511 147 112 90 49 33 15 10 29.4 Delaware 0.4% 43 20 14 3 1 2 10.5 Washington DC 0.2% 50 9 7 1 1 4.2 Maryland 1.8% 22 100 51 16 15 11 5 2 13.8 New Jersey 3.1% 8 174 89 30 16 17 10 6 4 2 35.6 New York 7.1% 3 405 241 59 45 32 15 11 1 1 15.9 Pennsylvania 4.3% 5 244 103 35 35 25 17 13 9 7 55.3 West Virginia 0.3% 47 15 6 3 1 3 1 1 44.3
South Eastern 21.5% 1 1,221 658 162 130 130 58 47 21 15 33.7 Alabama 0.9% 29 49 22 9 3 8 3 4 23.9 Florida 9.1% 2 520 312 62 48 34 22 22 12 8 38.6 Georgia 2.7% 10 152 75 28 14 22 4 5 3 1 24.4 Kentucky 1.0% 28 55 22 7 10 12 2 1 1 20.8 Mississippi 0.5% 40 27 14 2 3 6 1 1 17.3 North Carolina 2.5% 13 141 68 19 21 16 8 4 4 1 30.3 South Carolina 0.8% 32 45 21 6 4 7 3 3 1 27.1 Tennessee 1.8% 21 105 48 15 11 16 7 6 2 42.7 Virginia 2.2% 16 127 76 14 16 9 8 1 3 36.0
Great Lakes 17.0% 4 967 447 150 122 110 46 52 14 26 47.5 Illinois 3.7% 7 209 117 26 21 22 9 8 3 3 27.4 Indiana 1.6% 23 91 38 15 10 12 2 8 2 4 66.0 Michigan 2.9% 9 164 75 25 25 26 9 3 1 16.6 Minnesota 2.6% 11 150 72 25 16 20 4 7 2 4 40.7 Ohio 3.9% 6 220 90 36 30 19 15 17 5 8 58.6 Wisconsin 2.3% 15 133 55 23 20 11 7 9 1 7 93.5
North Central 6.3% 8 357 171 57 43 29 25 20 8 4 37.1 Idaho 0.6% 37 35 22 3 7 1 2 8.7 Iowa 0.7% 36 42 25 7 5 3 1 1 13.9 Kansas 1.1% 26 60 23 8 10 7 5 5 1 1 38.9 Missouri 2.0% 20 113 49 23 11 8 8 9 4 1 46.8 Montana 0.4% 41 25 14 8 2 1 5.1 Nebraska 0.8% 35 43 23 2 3 4 4 5 1 1 60.7 North Dakota 0.2% 48 10 3 2 1 1 2 1 74.1 South Dakota 0.3% 45 19 9 4 2 3 1 26.6 Wyoming 0.2% 48 10 3 4 2 1 75.5
South Central 6.9% 6 394 204 66 35 50 21 9 4 5 27.1 Arkansas 0.5% 39 28 16 5 5 1 1 17.3 Louisiana 0.8% 30 47 22 10 3 6 5 1 16.5 Oklahoma 0.8% 30 47 30 6 1 5 4 1 15.6 Texas 4.8% 4 272 136 45 31 34 11 6 4 5 31.9
South Western 6.9% 5 395 216 60 43 34 12 18 8 4 31.0 Arizona 2.2% 17 125 67 19 11 12 5 5 2 4 48.1 Colorado 2.1% 19 120 61 20 17 11 2 7 2 23.1 Nevada 1.0% 27 58 34 9 6 6 1 1 1 17.8 New Mexico 0.4% 42 23 15 3 3 2 28.6 Utah 1.2% 25 69 39 9 9 2 4 5 1 25.5
Western 17.9% 2 1,019 571 173 126 79 40 20 8 2 15.8 Alaska 0.1% 51 6 5 1 3.0 California 13.0% 1 738 405 128 92 62 33 12 4 2 15.7 Hawaii 0.3% 46 16 13 2 1 5.2 Oregon 2.1% 18 122 70 25 16 4 2 4 1 14.5 Washington 2.4% 14 137 78 20 15 12 5 4 3 19.3
US States + District of Columbia Ranked by Number of
Establishments
Mail-order Houses (catalogers) (NAICS 454113), 2015Number of Establishments
13

% of TotalRegion Rank
and State Rank
All Sizes 1-4Empls.
5-9 Empls.
10-19Empls.
20-49Empls.
50-99Empls.
100-249Empls.
250-499Empls.
500+Empls.
Avg. Employees/
Estab.
U.S. states + DC 100.0% - 5,934 3,155 891 707 553 252 222 89 65 31.1
New England 6.4% 7 379 196 63 40 33 17 18 12 26.5 Connecticut 1.4% 24 86 46 15 7 8 3 6 1 22.0 Maine 0.8% 30 50 26 9 5 3 4 3 33.3 Massachusetts 2.3% 14 139 73 21 16 15 4 5 5 25.1 New Hampshire 0.7% 33 44 22 7 5 2 3 2 3 39.4 Rhode Island 0.3% 43 20 10 3 3 1 2 1 19.4 Vermont 0.7% 35 40 19 8 4 4 1 4 22.1
Mid-Eastern 17.1% 4 1,012 552 152 123 83 41 38 12 11 28.4 Delaware 0.3% 45 17 11 3 1 2 11.5 Washington DC 0.1% 50 5 4 1 2.6 Maryland 1.6% 23 93 50 13 15 8 5 1 1 15.2 New Jersey 3.0% 9 176 90 31 19 13 9 8 2 4 43.1 New York 7.4% 3 442 261 70 47 32 13 15 3 1 16.9 Pennsylvania 4.4% 5 264 129 32 40 26 12 13 6 6 44.3 West Virginia 0.3% 46 15 7 2 2 3 1 23.5
South Eastern 21.1% 1 1,253 675 183 128 134 58 42 19 14 32.4 Alabama 0.8% 31 49 18 10 5 10 4 2 22.1 Florida 9.0% 2 534 331 64 41 42 17 20 11 8 33.7 Georgia 2.6% 10 157 71 34 23 13 9 4 3 21.3 Kentucky 0.9% 27 55 21 7 8 13 3 1 2 30.6 Mississippi 0.4% 40 26 13 2 2 7 2 18.1 North Carolina 2.6% 11 156 79 27 21 16 7 2 3 1 23.8 South Carolina 0.9% 28 54 26 9 7 7 2 3 18.0 Tennessee 1.6% 21 96 42 14 9 15 9 5 2 68.6 Virginia 2.1% 18 126 74 16 12 11 5 5 3 37.6
Great Lakes 17.1% 3 1,016 497 143 126 109 46 55 16 24 46.4 Illinois 3.9% 6 232 135 27 19 23 11 11 5 1 27.4 Indiana 1.6% 22 95 38 18 12 12 2 7 3 3 57.8 Michigan 3.0% 8 177 89 23 23 25 11 5 1 17.0 Minnesota 2.6% 12 154 83 21 21 14 3 7 1 4 42.2 Ohio 3.8% 7 224 94 35 30 23 12 17 4 9 63.1 Wisconsin 2.3% 16 134 58 19 21 12 7 8 2 7 86.8
North Central 5.9% 8 353 170 47 47 39 17 20 8 5 40.3 Idaho 0.5% 38 32 19 2 6 5 9.8 Iowa 0.7% 33 44 29 4 4 4 1 1 1 18.8 Kansas 0.9% 26 56 24 5 8 7 4 6 1 1 46.2 Missouri 1.9% 20 115 46 21 19 10 7 6 4 2 50.1 Montana 0.5% 39 27 17 5 4 1 5.0 Nebraska 0.7% 36 39 20 5 1 4 2 5 1 1 67.7 North Dakota 0.2% 48 11 3 2 2 2 1 1 55.5 South Dakota 0.3% 44 18 8 3 3 3 1 29.3 Wyoming 0.2% 48 11 4 3 3 1 74.0
South Central 7.0% 5 415 211 67 52 47 20 7 5 6 28.8 Arkansas 0.4% 42 25 11 7 4 1 2 23.0 Louisiana 0.8% 32 48 20 10 4 12 2 14.7 Oklahoma 0.7% 36 39 25 5 2 3 3 1 17.4 Texas 5.1% 4 303 155 45 46 28 14 5 4 6 33.0
South Western 7.0% 6 415 233 54 54 30 16 16 10 2 26.1 Arizona 2.1% 19 124 68 13 16 9 7 5 5 1 36.9 Colorado 2.3% 15 135 77 19 17 10 4 6 2 19.8 Nevada 0.9% 29 53 29 10 9 2 2 1 21.0 New Mexico 0.4% 40 26 14 3 4 2 1 2 32.9 Utah 1.3% 25 77 45 9 8 7 2 5 1 21.1
Western 18.4% 2 1,091 621 182 137 78 37 26 7 3 15.3 Alaska 0.1% 50 5 4 1 2.8 California 13.4% 1 793 446 130 106 60 30 15 4 2 14.8 Hawaii 0.2% 47 13 9 1 2 1 6.2 Oregon 2.2% 17 132 84 20 15 5 1 5 1 1 16.7 Washington 2.5% 13 148 78 30 14 12 6 6 2 18.1
US States + District of Columbia Ranked by Number of
Establishments
Mail-order Houses (catalogers) (NAICS 454113), 2013Number of Establishments
14

Region Rank and State Rank All Sizes 1-4
Empls.5-9
Empls.10-19
Empls.20-49
Empls.50-99
Empls.100-249Empls.
250-499Empls.
500+Empls.
Avg. Employees/
Estab.
U.S. states + DC - (245) (188) (19) (52) 2 16 (3) (3) 2 0.2
New England 2 (10) (7) (6) 4 2 (4) 1 0.4 Connecticut 11 (3) (5) 1 4 (2) (1) 0.4 Maine 14 (6) (1) (3) (2) 1 (1) 0.9 Massachusetts 5 4 2 (3) 4 1 2 (3) 1 0.8 New Hampshire 8 (1) 1 1 (1) (2.3)Rhode Island 9 (1) 1 (1) 1 (0.4)Vermont 13 (5) (2) (2) (1) 2.6
Mid-Eastern 6 (45) (41) (5) (11) 7 8 (5) 3 (1) 1.0 Delaware 6 3 3 (1.0)Washington DC 6 4 3 1 1.6 Maryland 3 7 1 3 3 1 (1) (1.4)New Jersey 10 (2) (1) (1) (3) 4 1 (2) 2 (2) (7.4)New York 25 (37) (20) (11) (2) 2 (4) (2) (0.9)Pennsylvania 22 (20) (26) 3 (5) (1) 5 3 1 11.0 West Virginia 9 (1) 1 (1) 1 20.8
South Eastern 5 (32) (17) (21) 2 (4) 5 2 1 1.3 Alabama 9 4 (1) (2) (2) (1) 2 1.8 Florida 20 (14) (19) (2) 7 (8) 5 2 1 4.9 Georgia 14 (5) 4 (6) (9) 9 (5) 1 1 3.1 Kentucky 9 1 2 (1) (1) (1) (9.7)Mississippi 7 1 1 1 (1) (1) 1 (0.9)North Carolina 21 (15) (11) (8) 1 2 1 6.4 South Carolina 16 (9) (5) (3) (3) 1 1 9.0 Tennessee 1 9 6 1 2 1 (2) 1 (25.9)Virginia 8 1 2 (2) 4 (2) 3 (4) (1.6)
Great Lakes 7 (49) (50) 7 (4) 1 (3) (2) 2 1.1 Illinois 23 (23) (18) (1) 2 (1) (2) (3) (2) 2 (0.0)Indiana 12 (4) (3) (2) 1 (1) 1 8.2 Michigan 19 (13) (14) 2 2 1 (2) (2) (0.4)Minnesota 13 (4) (11) 4 (5) 6 1 1 (1.5)Ohio 13 (4) (4) 1 (4) 3 1 (1) (4.5)Wisconsin 9 (1) (3) 4 (1) (1) 1 (1) 6.7
North Central 1 4 1 10 (4) (10) 8 (1) (3.2)Idaho 7 3 3 1 1 (4) 2 (1.1)Iowa 11 (2) (4) 3 1 (1) (1) (4.8)Kansas 6 4 (1) 3 2 1 (1) (7.3)Missouri 11 (2) 3 2 (8) (2) 1 3 (1) (3.3)Montana 11 (2) (3) 3 (2) 0.0 Nebraska 6 4 3 (3) 2 2 (7.0)North Dakota 10 (1) (1) (1) 2 (1) 18.6 South Dakota 8 1 1 1 (1) (2.8)Wyoming 10 (1) (1) 1 (1) 1.5
South Central 4 (21) (7) (1) (17) 3 1 2 (1) (1) (1.7)Arkansas 7 3 5 (2) 1 (1) (5.7)Louisiana 10 (1) 2 (1) (6) 3 1 1.8 Oklahoma 2 8 5 1 (1) 2 1 1 (1) (1.7)Texas 24 (31) (19) (15) 6 (3) 1 (1) (1.0)
South Western 3 (20) (17) 6 (11) 4 (4) 2 (2) 2 4.8 Arizona 8 1 (1) 6 (5) 3 (2) (3) 3 11.3 Colorado 22 (15) (16) 1 1 (2) 1 3.2 Nevada 4 5 5 (1) (3) 4 (1) 1 1 (1) (3.3)New Mexico 12 (3) 1 (4) 1 (1) (4.3)Utah 15 (8) (6) 1 (5) 2 4.4
Western 8 (72) (50) (9) (11) 1 3 (6) 1 (1) 0.5 Alaska 8 1 1 (1) 1 0.2 California 26 (55) (41) (2) (14) 2 3 (3) 0.9 Hawaii 7 3 4 (1) (1.0)Oregon 17 (10) (14) 5 1 (1) 1 (1) (1) (2.2)Washington 18 (11) (10) 1 (1) (2) 1 1.3
US States + District of Columbia Ranked by Change in Number of
Establishments
Mail-order Houses (catalogers) (NAICS 454113), 2015Change in Number of Establishments
15

% of TotalRegion Rank
and State Rank
All Sizes Small: 1-9 Empls.
Medium: 10-49 Empls.
Large: >50+ Empls.
U.S. states + DC 100.0% - 177,745 10,896 26,008 140,841
New England 5.6% 8 9,932 745 1,569 7,618 Connecticut 1.0% 24 1,856 197 370 1,289 (4)Maine 0.8% 28 1,506 76 117 1,313 (4)Massachusetts 2.1% 18 3,693 260 685 2,748 (4)New Hampshire 0.9% 27 1,633 93 133 1,407 (4)Rhode Island 0.2% 45 380 48 76 256 (3)Vermont 0.5% 34 864 71 188 605
Mid-Eastern 16.0% 3 28,427 1,871 4,413 22,142 Delaware 0.1% 47 210 46 30 134 (3)Washington DC 0.0% 50 38 17 21 (3)Maryland 0.8% 29 1,376 189 574 613 (4)New Jersey 3.5% 8 6,202 351 816 5,035 (4)New York 3.6% 7 6,453 787 1,623 4,043 (4)Pennsylvania 7.6% 2 13,484 448 1,241 11,795 (4)West Virginia 0.4% 39 664 33 109 522 (3)
South Eastern 23.1% 2 41,104 2,098 5,842 33,164 Alabama 0.7% 31 1,172 113 300 759 Florida 11.3% 1 20,069 891 1,714 17,464 Georgia 2.1% 17 3,712 290 899 2,523 (4)Kentucky 0.6% 32 1,146 74 490 582 (4)Mississippi 0.3% 44 466 33 240 193 (3)North Carolina 2.4% 16 4,269 231 802 3,236 (4)South Carolina 0.7% 30 1,218 77 270 871 (4)Tennessee 2.5% 15 4,483 178 638 3,667 (4)Virginia 2.6% 14 4,569 211 489 3,869 (4)
Great Lakes 25.8% 1 45,899 1,722 5,087 39,090 Illinois 3.2% 12 5,731 366 1,072 4,293 Indiana 3.4% 11 6,008 181 504 5,323 (4)Michigan 1.5% 20 2,722 283 1,086 1,353 (4)Minnesota 3.4% 9 6,112 269 802 5,041 (4)Ohio 7.3% 3 12,891 378 1,011 11,502 (4)Wisconsin 7.0% 4 12,435 245 612 11,578 (4)
North Central 7.4% 5 13,241 691 1,488 11,062 Idaho 0.2% 46 305 65 116 124 (3)Iowa 0.3% 41 584 87 131 366 (4)Kansas 1.3% 23 2,332 92 387 1,853 (4)Missouri 3.0% 13 5,284 248 398 4,638 (4)Montana 0.1% 48 127 85 42 (4)Nebraska 1.5% 22 2,608 48 180 2,380 (3)North Dakota 0.4% 37 741 25 59 657 (3)South Dakota 0.3% 42 505 14 112 379 (3)Wyoming 0.4% 36 755 27 63 665 (3)
South Central 6.0% 7 10,680 806 2,015 7,859 Arkansas 0.3% 43 483 59 167 257 (4)Louisiana 0.4% 35 775 105 198 472 (4)Oklahoma 0.4% 38 734 87 186 461 (3)Texas 4.9% 6 8,688 555 1,464 6,669 (4)
South Western 6.9% 6 12,232 783 1,555 9,894 Arizona 3.4% 10 6,018 250 517 5,251 (4)Colorado 1.6% 19 2,766 241 551 1,974 (4)Nevada 0.6% 33 1,030 123 207 700 (4)New Mexico 0.4% 40 657 47 92 518 (4)Utah 1.0% 26 1,761 122 188 1,451 (3)
Western 9.1% 4 16,143 2,171 4,067 9,905 Alaska 0.0% 51 18 9 9 (4)California 6.5% 5 11,620 1,586 3,115 6,919 (4)Hawaii 0.0% 49 83 17 66 (4)Oregon 1.0% 25 1,772 278 326 1,168 (4)Washington 1.5% 21 2,650 281 551 1,818
US States + District of Columbia Ranked by Number of Employees
Mail-order Houses (catalogers) (NAICS 454113), 2015Number of Employees
3: One or more entries were estimated using national averages. Stated US totals may not match exactly. ESTIMATED entries shown in italics and underlined.
4: One datum was not provided by Census Dept. but was inferred from other data
16

% of TotalRegion Rank
and State Rank
All Sizes 1-4Empls.
5-9 Empls.
10-19Empls.
20-49Empls.
50-99Empls.
100-249Empls.
250-499Empls.
500+Empls.
U.S. states + DC 100.0% - 177,745 5,092 5,804 8,750 17,258 18,723 34,954 30,269 56,895
New England 5.6% 8 9,932 339 406 588 981 1,081 3,294 2,704 538 Connecticut 1.0% 24 1,856 85 112 156 214 108 910 271 (3)Maine 0.8% 28 1,506 33 43 38 79 237 199 877 (3)Massachusetts 2.1% 18 3,693 135 125 269 416 349 1,287 574 538 (3)New Hampshire 0.9% 27 1,633 44 49 53 80 268 157 982 (4)Rhode Island 0.2% 45 380 21 27 23 53 119 136 (3)Vermont 0.5% 34 864 21 50 49 139 605
Mid-Eastern 16.0% 3 28,427 896 975 1,477 2,937 3,545 5,195 5,338 8,064 Delaware 0.1% 47 210 26 20 30 134 (3)Washington DC 0.0% 50 38 13 4 21 (3)Maryland 0.8% 29 1,376 86 103 193 381 319 294 (4)New Jersey 3.5% 8 6,202 159 192 204 612 698 906 1,398 2,033 (4)New York 3.6% 7 6,453 390 397 585 1,038 1,112 1,927 349 655 (3)Pennsylvania 7.6% 2 13,484 212 236 481 760 1,282 1,905 3,232 5,376 (4)West Virginia 0.4% 39 664 10 23 14 95 163 359 (3)
South Eastern 23.1% 2 41,104 1,044 1,054 1,747 4,095 3,874 7,335 7,262 14,694 Alabama 0.7% 31 1,172 48 65 39 261 213 546 Florida 11.3% 1 20,069 487 404 636 1,078 1,408 3,510 4,289 8,257 Georgia 2.1% 17 3,712 107 183 193 706 325 650 1,010 538 (4)Kentucky 0.6% 32 1,146 29 45 143 347 125 143 315 (3)Mississippi 0.3% 44 466 22 11 36 204 59 134 (3)North Carolina 2.4% 16 4,269 114 117 286 516 533 723 1,348 632 (4)South Carolina 0.7% 30 1,218 38 39 62 208 184 387 300 (4)Tennessee 2.5% 15 4,483 75 103 146 492 452 1,073 2,142 (4)Virginia 2.6% 14 4,569 124 87 206 283 575 169 3,125 (3)
Great Lakes 25.8% 1 45,899 735 987 1,631 3,456 3,231 8,563 4,615 22,681 Illinois 3.2% 12 5,731 188 178 281 791 624 1,194 1,029 1,446 Indiana 3.4% 11 6,008 82 99 131 373 144 1,510 727 2,942 (3)Michigan 1.5% 20 2,722 111 172 334 752 641 410 302 (4)Minnesota 3.4% 9 6,112 101 168 215 587 285 1,353 607 2,796 (4)Ohio 7.3% 3 12,891 160 218 419 592 1,064 2,615 1,612 6,211 (4)Wisconsin 7.0% 4 12,435 93 152 251 361 473 1,481 338 9,286 (4)
North Central 7.4% 5 13,241 317 374 541 946 1,869 3,059 3,041 3,093 Idaho 0.2% 46 305 47 18 88 28 124 (3)Iowa 0.3% 41 584 41 46 56 75 61 305 (3)Kansas 1.3% 23 2,332 41 51 137 250 368 678 280 527 (3)Missouri 3.0% 13 5,284 97 151 139 259 627 1,523 1,737 751 (4)Montana 0.1% 48 127 26 59 19 23 (3)Nebraska 1.5% 22 2,608 39 9 33 147 279 702 248 1,151 (3)North Dakota 0.4% 37 741 7 18 18 42 187 470 (3)South Dakota 0.3% 42 505 14 51 61 223 156 (3)Wyoming 0.4% 36 755 5 22 63 665 (3)
South Central 6.0% 7 10,680 347 459 502 1,513 1,537 1,404 1,266 3,652 Arkansas 0.3% 43 483 28 31 167 78 179 (3)Louisiana 0.4% 35 775 31 74 38 160 343 129 (4)Oklahoma 0.4% 38 734 49 38 18 168 247 214 (3)Texas 4.9% 6 8,688 239 316 446 1,018 869 882 1,266 3,652 (4)
South Western 6.9% 6 12,232 384 399 564 991 881 2,826 3,031 3,156 Arizona 3.4% 10 6,018 126 124 146 371 367 910 818 3,156 (4)Colorado 1.6% 19 2,766 102 139 241 310 171 944 859 (3)Nevada 0.6% 33 1,030 58 65 62 145 84 192 424 (3)New Mexico 0.4% 40 657 30 17 92 518 (4)Utah 1.0% 26 1,761 68 54 115 73 259 780 412 (3)
Western 9.1% 4 16,143 1,029 1,142 1,720 2,347 2,755 3,103 2,847 1,200 Alaska 0.0% 51 18 9 9 (4)California 6.5% 5 11,620 729 857 1,270 1,845 2,311 1,830 1,578 1,200 (4)Hawaii 0.0% 49 83 17 31 35 (3)Oregon 1.0% 25 1,772 123 155 206 120 133 700 335 (3)Washington 1.5% 21 2,650 151 130 204 347 311 573 934
US States + District of Columbia Ranked by Number of Employees
Mail-order Houses (catalogers) (NAICS 454113), 2015Number of Employees
3: One or more entries were estimated using national averages. Stated US totals may not match exactly. ESTIMATED entries shown in italics and underlined.
4: One datum was not provided by Census Dept. but was inferred from other data
17

% of TotalRegion Rank
and State Rank
All Sizes Small: 1-9 Empls.
Medium: 10-49 Empls.
Large: >50+ Empls.
U.S. states + DC 100.0% - $9,211 $493 $1,373 $7,345
New England 5.7% 7 $525 $41 $82 $402Connecticut 1.3% 20 $121 $14 $21 $86 (4)Maine 0.6% 32 $52 $3 $3 $45 (4)Massachusetts 2.2% 14 $199 $12 $43 $144 (4)New Hampshire 0.9% 26 $87 $5 $5 $77 (4)Rhode Island 0.2% 44 $19 $3 $4 $13 (3)Vermont 0.5% 35 $48 $3 $7 $38
Mid-Eastern 21.2% 2 $1,954 $88 $258 $1,608Delaware 0.1% 47 $9 $2 $1 $5 (3)Washington DC 0.0% 49 $4 $1 $3 (3)Maryland 0.8% 27 $72 $12 $27 $34 (4)New Jersey 6.1% 6 $565 $16 $59 $490 (4)New York 4.6% 8 $423 $35 $97 $291 (4)Pennsylvania 9.3% 2 $854 $21 $67 $767 (4)West Virginia 0.3% 42 $26 $1 $4 $21 (3)
South Eastern 19.5% 3 $1,792 $87 $286 $1,419Alabama 0.6% 30 $57 $5 $17 $36Florida 9.8% 1 $904 $34 $76 $795Georgia 1.7% 17 $160 $11 $40 $109 (4)Kentucky 0.6% 31 $52 $4 $20 $28 (4)Mississippi 0.3% 41 $27 $2 $12 $14 (3)North Carolina 2.1% 16 $192 $8 $46 $137 (4)South Carolina 0.7% 29 $62 $5 $11 $46 (4)Tennessee 2.1% 15 $194 $11 $31 $153 (4)Virginia 1.6% 18 $144 $9 $33 $102 (4)
Great Lakes 25.2% 1 $2,325 $76 $277 $1,972Illinois 3.1% 12 $289 $17 $60 $212Indiana 2.9% 13 $267 $7 $23 $238 (4)Michigan 1.3% 21 $118 $14 $54 $51 (4)Minnesota 4.8% 7 $444 $11 $59 $374 (4)Ohio 6.8% 4 $622 $18 $52 $553 (4)Wisconsin 6.3% 5 $584 $10 $30 $544 (4)
North Central 6.7% 5 $617 $29 $67 $522Idaho 0.1% 46 $11 $2 $4 $5 (3)Iowa 0.3% 39 $32 $4 $8 $20 (4)Kansas 1.1% 23 $97 $4 $18 $74 (4)Missouri 3.2% 11 $295 $13 $16 $266 (4)Montana 0.0% 48 $4 $3 $2 (4)Nebraska 1.0% 24 $94 $2 $9 $83 (3)North Dakota 0.3% 38 $32 $1 $3 $28 (3)South Dakota 0.2% 45 $16 $1 $4 $12 (3)Wyoming 0.4% 36 $36 $1 $3 $32 (3)
South Central 5.5% 8 $509 $35 $114 $360Arkansas 0.2% 43 $21 $2 $11 $8 (4)Louisiana 0.5% 33 $50 $5 $11 $35 (4)Oklahoma 0.4% 37 $34 $5 $8 $22 (3)Texas 4.4% 9 $404 $24 $84 $295 (4)
South Western 6.2% 6 $575 $40 $76 $459Arizona 3.4% 10 $317 $13 $24 $280 (4)Colorado 1.2% 22 $107 $10 $27 $69 (4)Nevada 0.5% 34 $50 $9 $13 $27 (4)New Mexico 0.3% 40 $30 $2 $4 $24 (4)Utah 0.8% 28 $72 $6 $9 $58 (3)
Western 9.9% 4 $913 $95 $217 $601Alaska 0.0% 51 $1 $0 $1 (4)California 7.4% 3 $683 $70 $173 $441 (4)Hawaii 0.0% 50 $3 $1 $2 (4)Oregon 1.0% 25 $91 $10 $15 $66 (4)Washington 1.5% 19 $135 $14 $26 $95
US States + District of Columbia Ranked by Payrolls
Mail-order Houses (catalogers) (NAICS 454113), 2015Total Payrolls ($Millions)
3: One or more entries were estimated using national averages. Stated US totals may not match exactly. ESTIMATED entries shown in italics and underlined.
4: One datum was not provided by Census Dept. but was inferred from other data
18

% of TotalRegion Rank
and State Rank
All Sizes 1-4Empls.
5-9 Empls.
10-19Empls.
20-49Empls.
50-99Empls.
100-249Empls.
250-499Empls.
500+Empls.
U.S. states + DC 100.0% - $9,211 $223 $270 $430 $943 $1,023 $1,877 $1,581 $2,863
New England 5.7% 7 $525 $18 $23 $36 $46 $68 $174 $133 $27Connecticut 1.3% 20 $121 $4 $10 $14 $7 $9 $55 $22 (3)Maine 0.6% 32 $52 $2 $2 $1 $2 $10 $7 $29 (3)Massachusetts 2.2% 14 $199 $6 $6 $16 $26 $26 $59 $31 $27 (3)New Hampshire 0.9% 26 $87 $3 $2 $2 $3 $17 $9 $51 (4)Rhode Island 0.2% 44 $19 $2 $1 $1 $3 $6 $7 (3)Vermont 0.5% 35 $48 $1 $2 $2 $5 $38
Mid-Eastern 21.2% 2 $1,954 $39 $49 $68 $190 $225 $304 $366 $713Delaware 0.1% 47 $9 $2 $1 $1 $5 (3)Washington DC 0.0% 49 $4 $1 $0 $3 (3)Maryland 0.8% 27 $72 $4 $8 $9 $17 $17 $18 (4)New Jersey 6.1% 6 $565 $6 $9 $12 $47 $47 $55 $135 $253 (4)New York 4.6% 8 $423 $17 $18 $27 $71 $78 $133 $29 $51 (3)Pennsylvania 9.3% 2 $854 $9 $12 $19 $48 $78 $92 $188 $409 (4)West Virginia 0.3% 42 $26 $0 $1 $1 $4 $7 $14 (3)
South Eastern 19.5% 3 $1,792 $43 $44 $73 $213 $170 $403 $375 $471Alabama 0.6% 30 $57 $2 $2 $2 $14 $12 $23Florida 9.8% 1 $904 $18 $16 $23 $53 $57 $224 $227 $287Georgia 1.7% 17 $160 $4 $7 $6 $34 $13 $33 $51 $12 (4)Kentucky 0.6% 31 $52 $1 $3 $5 $15 $6 $7 $15 (3)Mississippi 0.3% 41 $27 $1 $1 $3 $9 $4 $10 (3)North Carolina 2.1% 16 $192 $4 $4 $16 $29 $22 $33 $59 $24 (4)South Carolina 0.7% 29 $62 $2 $3 $3 $8 $10 $13 $23 (4)Tennessee 2.1% 15 $194 $6 $5 $5 $26 $22 $57 $74 (4)Virginia 1.6% 18 $144 $5 $3 $9 $24 $24 $4 $75 (3)
Great Lakes 25.2% 1 $2,325 $30 $46 $78 $199 $156 $452 $198 $1,165Illinois 3.1% 12 $289 $8 $8 $12 $48 $24 $63 $47 $77Indiana 2.9% 13 $267 $2 $5 $6 $16 $8 $59 $37 $135 (3)Michigan 1.3% 21 $118 $6 $8 $19 $34 $24 $25 $3 (4)Minnesota 4.8% 7 $444 $3 $8 $13 $45 $20 $56 $21 $278 (4)Ohio 6.8% 4 $622 $7 $11 $16 $36 $57 $184 $78 $234 (4)Wisconsin 6.3% 5 $584 $4 $6 $12 $19 $25 $66 $13 $441 (4)
North Central 6.7% 5 $617 $11 $18 $25 $42 $75 $147 $171 $129Idaho 0.1% 46 $11 $1 $0 $3 $1 $5 (3)Iowa 0.3% 39 $32 $1 $2 $4 $4 $4 $17 (3)Kansas 1.1% 23 $97 $2 $3 $7 $11 $17 $29 $10 $18 (3)Missouri 3.2% 11 $295 $4 $9 $6 $10 $25 $88 $116 $38 (4)Montana 0.0% 48 $4 $1 $2 $1 $1 (3)Nebraska 1.0% 24 $94 $2 $0 $1 $8 $8 $26 $9 $41 (3)North Dakota 0.3% 38 $32 $0 $1 $1 $2 $8 $20 (3)South Dakota 0.2% 45 $16 $1 $2 $2 $8 $4 (3)Wyoming 0.4% 36 $36 $0 $0 $3 $32 (3)
South Central 5.5% 8 $509 $14 $21 $26 $88 $116 $66 $45 $132Arkansas 0.2% 43 $21 $2 $1 $11 $2 $5 (3)Louisiana 0.5% 33 $50 $1 $3 $2 $9 $24 $11 (4)Oklahoma 0.4% 37 $34 $3 $2 $1 $7 $13 $9 (3)Texas 4.4% 9 $404 $9 $15 $23 $61 $77 $41 $45 $132 (4)
South Western 6.2% 6 $575 $20 $20 $28 $49 $44 $142 $115 $158Arizona 3.4% 10 $317 $7 $5 $6 $18 $20 $61 $41 $158 (4)Colorado 1.2% 22 $107 $4 $6 $13 $15 $4 $44 $21 (3)Nevada 0.5% 34 $50 $5 $5 $3 $10 $3 $8 $16 (3)New Mexico 0.3% 40 $30 $1 $1 $4 $24 (4)Utah 0.8% 28 $72 $3 $2 $6 $2 $17 $30 $12 (3)
Western 9.9% 4 $913 $47 $48 $95 $123 $173 $179 $179 $70Alaska 0.0% 51 $1 $0 $1 (4)California 7.4% 3 $683 $34 $36 $74 $98 $151 $108 $112 $70 (4)Hawaii 0.0% 50 $3 $1 $1 $1 (3)Oregon 1.0% 25 $91 $4 $6 $9 $6 $6 $44 $15 (3)Washington 1.5% 19 $135 $8 $6 $9 $17 $16 $28 $51
US States + District of Columbia Ranked by Payrolls
Mail-order Houses (catalogers) (NAICS 454113), 2015Total Payrolls ($Millions)
3: One or more entries were estimated using national averages. Stated US totals may not match exactly. ESTIMATED entries shown in italics and underlined.
4: One datum was not provided by Census Dept. but was inferred from other data
19

% of Total Region Rank and State Rank All Sizes Small: 1-9
Empls.Medium: 10-49
Empls.Large: >50+
Empls.
U.S. states + DC 100.0% - $184,066 $7,749 $22,392 $153,924
New England 5.4% 8 $10,007 $531 $1,344 $8,133Connecticut 1.0% 24 $1,829 $141 $315 $1,374Maine 0.8% 28 $1,558 $54 $101 $1,403Massachusetts 2.0% 18 $3,714 $184 $585 $2,945New Hampshire 0.9% 27 $1,683 $66 $114 $1,503Rhode Island 0.2% 45 $362 $34 $66 $262Vermont 0.5% 34 $861 $52 $164 $646
Mid-Eastern 15.9% 3 $29,252 $1,329 $3,801 $24,122Delaware 0.1% 47 $190 $32 $27 $130Washington DC 0.0% 50 $31 $12 $19Maryland 0.7% 29 $1,253 $135 $494 $624New Jersey 3.5% 7 $6,519 $250 $711 $5,558New York 3.4% 11 $6,205 $558 $1,393 $4,255Pennsylvania 7.8% 2 $14,367 $318 $1,061 $12,988West Virginia 0.4% 39 $688 $24 $97 $567
South Eastern 23.5% 2 $43,171 $1,487 $5,056 $36,627Alabama 0.6% 31 $1,137 $81 $266 $790Florida 11.7% 1 $21,544 $628 $1,468 $19,448Georgia 2.0% 17 $3,715 $209 $787 $2,719Kentucky 0.6% 32 $1,096 $53 $425 $618Mississippi 0.2% 44 $435 $23 $212 $200North Carolina 2.4% 16 $4,326 $164 $689 $3,474South Carolina 0.7% 30 $1,211 $55 $236 $921Tennessee 2.6% 15 $4,779 $127 $558 $4,094Virginia 2.7% 14 $4,928 $148 $416 $4,364
Great Lakes 26.6% 1 $48,908 $1,230 $4,389 $43,288Illinois 3.2% 12 $5,820 $259 $933 $4,628Indiana 3.5% 8 $6,411 $129 $439 $5,844Michigan 1.4% 22 $2,533 $203 $939 $1,392Minnesota 3.5% 9 $6,409 $193 $697 $5,518Ohio 7.5% 4 $13,766 $270 $861 $12,635Wisconsin 7.6% 3 $13,968 $176 $521 $13,271
North Central 7.5% 5 $13,729 $492 $1,276 $11,961Idaho 0.1% 46 $259 $45 $94 $121Iowa 0.3% 41 $566 $62 $111 $393Kansas 1.3% 23 $2,377 $66 $332 $1,979Missouri 3.0% 13 $5,499 $178 $342 $4,979Montana 0.1% 48 $97 $62 $36Nebraska 1.6% 19 $2,855 $33 $158 $2,664North Dakota 0.4% 36 $766 $18 $51 $696South Dakota 0.3% 42 $488 $9 $95 $384Wyoming 0.4% 35 $821 $20 $56 $745
South Central 5.9% 7 $10,883 $576 $1,756 $8,551Arkansas 0.2% 43 $460 $42 $151 $267Louisiana 0.4% 37 $721 $76 $174 $471Oklahoma 0.4% 38 $695 $61 $166 $469Texas 4.9% 6 $9,007 $396 $1,266 $7,344
South Western 6.9% 6 $12,617 $555 $1,334 $10,728Arizona 3.5% 10 $6,385 $177 $449 $5,759Colorado 1.5% 20 $2,755 $172 $468 $2,115Nevada 0.6% 33 $1,018 $87 $179 $751New Mexico 0.4% 40 $683 $33 $83 $567Utah 1.0% 25 $1,777 $86 $155 $1,536
Western 8.4% 4 $15,455 $1,543 $3,459 $10,453Alaska 0.0% 51 $13 $6 $7California 6.0% 5 $11,056 $1,129 $2,655 $7,273Hawaii 0.0% 49 $67 $11 $56Oregon 0.9% 26 $1,711 $198 $269 $1,244Washington 1.4% 21 $2,607 $198 $472 $1,937
US States + District of Columbia Ranked by Sales
Mail-order Houses (catalogers) (NAICS 454113), 2015Value of Sales/Shipments ($Millions)
20

% of Total Region Rank and State Rank All Sizes 1-4
Empls.5-9
Empls.10-19
Empls.20-49
Empls.50-99
Empls.100-249Empls.
250-499Empls.
500+Empls.
U.S. states + DC 100.0% - $184,066 $3,396 $4,353 $6,825 $15,567 $18,199 $37,331 $33,145 $65,250
New England 5.4% 8 $10,007 $226 $305 $459 $885 $1,051 $3,518 $2,961 $603Connecticut 1.0% 24 $1,829 $57 $84 $122 $193 $105 $972 $297Maine 0.8% 28 $1,558 $22 $32 $30 $71 $230 $212 $960Massachusetts 2.0% 18 $3,714 $90 $94 $210 $375 $339 $1,375 $628 $603New Hampshire 0.9% 27 $1,683 $29 $37 $41 $72 $260 $168 $1,075Rhode Island 0.2% 45 $362 $14 $20 $18 $48 $116 $146Vermont 0.5% 34 $861 $14 $38 $38 $125 $646
Mid-Eastern 15.9% 3 $29,252 $598 $732 $1,152 $2,649 $3,446 $5,548 $5,845 $9,283Delaware 0.1% 47 $190 $17 $15 $27 $130Washington DC 0.0% 50 $31 $9 $3 $19Maryland 0.7% 29 $1,253 $57 $77 $151 $344 $310 $314New Jersey 3.5% 7 $6,519 $106 $144 $159 $552 $678 $968 $1,531 $2,381New York 3.4% 11 $6,205 $260 $298 $456 $936 $1,081 $2,058 $382 $734Pennsylvania 7.8% 2 $14,367 $141 $177 $375 $686 $1,246 $2,035 $3,539 $6,168West Virginia 0.4% 39 $688 $7 $17 $11 $86 $174 $393
South Eastern 23.5% 2 $43,171 $696 $791 $1,363 $3,694 $3,765 $7,833 $7,951 $17,078Alabama 0.6% 31 $1,137 $32 $49 $30 $235 $207 $583Florida 11.7% 1 $21,544 $325 $303 $496 $972 $1,369 $3,749 $4,696 $9,634Georgia 2.0% 17 $3,715 $71 $137 $151 $637 $316 $694 $1,106 $603Kentucky 0.6% 32 $1,096 $19 $34 $112 $313 $121 $152 $344Mississippi 0.2% 44 $435 $15 $8 $28 $184 $57 $143North Carolina 2.4% 16 $4,326 $76 $88 $223 $465 $518 $772 $1,476 $708South Carolina 0.7% 30 $1,211 $25 $29 $48 $188 $179 $413 $329Tennessee 2.6% 15 $4,779 $50 $77 $114 $444 $439 $1,146 $2,509Virginia 2.7% 14 $4,928 $83 $65 $161 $255 $559 $180 $3,624
Great Lakes 26.6% 1 $48,908 $490 $740 $1,272 $3,117 $3,141 $9,145 $5,053 $25,949Illinois 3.2% 12 $5,820 $125 $134 $219 $713 $607 $1,275 $1,127 $1,620Indiana 3.5% 8 $6,411 $55 $74 $102 $336 $140 $1,613 $796 $3,295Michigan 1.4% 22 $2,533 $74 $129 $261 $678 $623 $438 $331Minnesota 3.5% 9 $6,409 $67 $126 $168 $529 $277 $1,445 $665 $3,132Ohio 7.5% 4 $13,766 $107 $164 $327 $534 $1,034 $2,793 $1,765 $7,043Wisconsin 7.6% 3 $13,968 $62 $114 $196 $326 $460 $1,582 $370 $10,859
North Central 7.5% 5 $13,729 $211 $281 $422 $854 $1,816 $3,267 $3,330 $3,547Idaho 0.1% 46 $259 $31 $14 $69 $25 $121Iowa 0.3% 41 $566 $27 $35 $44 $68 $59 $334Kansas 1.3% 23 $2,377 $27 $38 $107 $226 $358 $724 $307 $590Missouri 3.0% 13 $5,499 $65 $113 $108 $234 $609 $1,627 $1,902 $841Montana 0.1% 48 $97 $17 $44 $15 $20Nebraska 1.6% 19 $2,855 $26 $7 $26 $133 $271 $750 $272 $1,371North Dakota 0.4% 36 $766 $5 $13 $14 $37 $181 $515South Dakota 0.3% 42 $488 $9 $40 $55 $217 $167Wyoming 0.4% 35 $821 $3 $17 $56 $745
South Central 5.9% 7 $10,883 $231 $344 $391 $1,365 $1,494 $1,499 $1,386 $4,171Arkansas 0.2% 43 $460 $19 $23 $151 $76 $191Louisiana 0.4% 37 $721 $21 $56 $30 $144 $333 $138Oklahoma 0.4% 38 $695 $33 $29 $14 $152 $240 $229Texas 4.9% 6 $9,007 $159 $237 $348 $918 $845 $942 $1,386 $4,171
South Western 6.9% 6 $12,617 $256 $299 $440 $894 $856 $3,018 $3,319 $3,535Arizona 3.5% 10 $6,385 $84 $93 $114 $335 $357 $972 $896 $3,535Colorado 1.5% 20 $2,755 $68 $104 $188 $280 $166 $1,008 $941Nevada 0.6% 33 $1,018 $39 $49 $48 $131 $82 $205 $464New Mexico 0.4% 40 $683 $20 $13 $83 $567Utah 1.0% 25 $1,777 $45 $41 $90 $66 $252 $833 $451
Western 8.4% 4 $15,455 $686 $857 $1,341 $2,117 $2,678 $3,314 $3,117 $1,344Alaska 0.0% 51 $13 $6 $7California 6.0% 5 $11,056 $486 $643 $991 $1,664 $2,246 $1,954 $1,728 $1,344Hawaii 0.0% 49 $67 $11 $24 $32Oregon 0.9% 26 $1,711 $82 $116 $161 $108 $129 $748 $367Washington 1.4% 21 $2,607 $101 $98 $159 $313 $302 $612 $1,023
US States + District of Columbia Ranked by Sales
Mail-order Houses (catalogers) (NAICS 454113), 2015Value of Sales/Shipments ($Millions)
21
% of Total Rank All Sizes Small: 1-9 Empls.
Medium: 10-49 Empls.
Large: >50+ Empls.
Employees/Estab. Employees Payrolls ($MM) Sales ($MM)
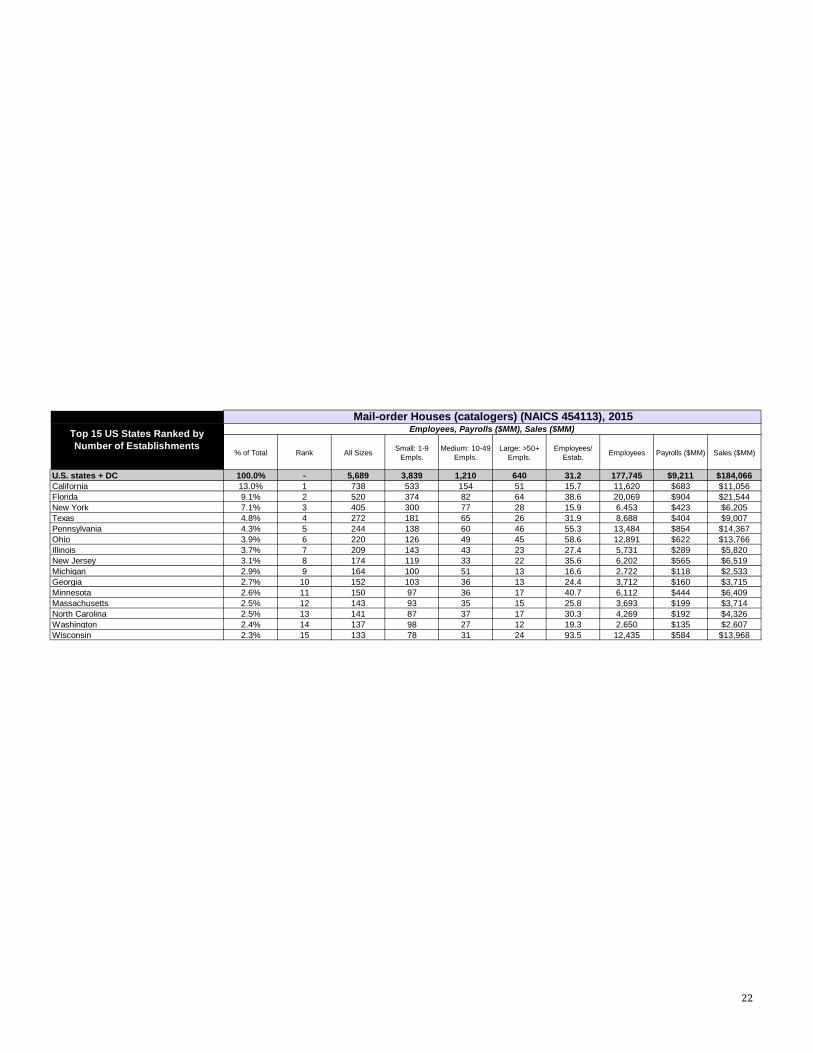
U.S. states + DC 100.0% - 5,689 3,839 1,210 640 31.2 177,745 $9,211 $184,066California 13.0% 1 738 533 154 51 15.7 11,620 $683 $11,056Florida 9.1% 2 520 374 82 64 38.6 20,069 $904 $21,544New York 7.1% 3 405 300 77 28 15.9 6,453 $423 $6,205Texas 4.8% 4 272 181 65 26 31.9 8,688 $404 $9,007Pennsylvania 4.3% 5 244 138 60 46 55.3 13,484 $854 $14,367Ohio 3.9% 6 220 126 49 45 58.6 12,891 $622 $13,766Illinois 3.7% 7 209 143 43 23 27.4 5,731 $289 $5,820New Jersey 3.1% 8 174 119 33 22 35.6 6,202 $565 $6,519Michigan 2.9% 9 164 100 51 13 16.6 2,722 $118 $2,533Georgia 2.7% 10 152 103 36 13 24.4 3,712 $160 $3,715Minnesota 2.6% 11 150 97 36 17 40.7 6,112 $444 $6,409Massachusetts 2.5% 12 143 93 35 15 25.8 3,693 $199 $3,714North Carolina 2.5% 13 141 87 37 17 30.3 4,269 $192 $4,326Washington 2.4% 14 137 98 27 12 19.3 2,650 $135 $2,607Wisconsin 2.3% 15 133 78 31 24 93.5 12,435 $584 $13,968
Top 15 US States Ranked by Number of Establishments
Employees, Payrolls ($MM), Sales ($MM)Mail-order Houses (catalogers) (NAICS 454113), 2015
22
% of Total Rank All Sizes Small: 1-9 Empls.
Medium: 10-49 Empls.
Large: >50+ Empls.
Employees/Estab. Employees Payrolls ($MM) Sales ($MM)
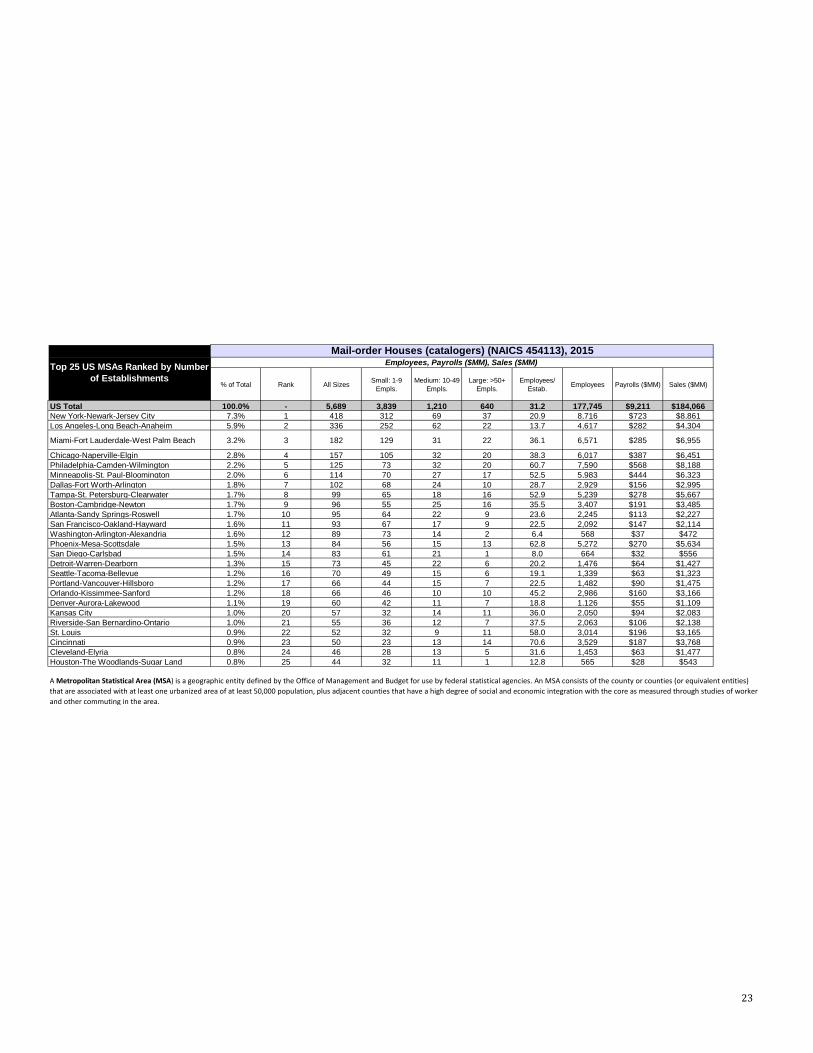
US Total 100.0% - 5,689 3,839 1,210 640 31.2 177,745 $9,211 $184,066New York-Newark-Jersey City 7.3% 1 418 312 69 37 20.9 8,716 $723 $8,861Los Angeles-Long Beach-Anaheim 5.9% 2 336 252 62 22 13.7 4,617 $282 $4,304
Miami-Fort Lauderdale-West Palm Beach 3.2% 3 182 129 31 22 36.1 6,571 $285 $6,955
Chicago-Naperville-Elgin 2.8% 4 157 105 32 20 38.3 6,017 $387 $6,451Philadelphia-Camden-Wilmington 2.2% 5 125 73 32 20 60.7 7,590 $568 $8,188Minneapolis-St. Paul-Bloomington 2.0% 6 114 70 27 17 52.5 5,983 $444 $6,323Dallas-Fort Worth-Arlington 1.8% 7 102 68 24 10 28.7 2,929 $156 $2,995Tampa-St. Petersburg-Clearwater 1.7% 8 99 65 18 16 52.9 5,239 $278 $5,667Boston-Cambridge-Newton 1.7% 9 96 55 25 16 35.5 3,407 $191 $3,485Atlanta-Sandy Springs-Roswell 1.7% 10 95 64 22 9 23.6 2,245 $113 $2,227San Francisco-Oakland-Hayward 1.6% 11 93 67 17 9 22.5 2,092 $147 $2,114Washington-Arlington-Alexandria 1.6% 12 89 73 14 2 6.4 568 $37 $472Phoenix-Mesa-Scottsdale 1.5% 13 84 56 15 13 62.8 5,272 $270 $5,634San Diego-Carlsbad 1.5% 14 83 61 21 1 8.0 664 $32 $556Detroit-Warren-Dearborn 1.3% 15 73 45 22 6 20.2 1,476 $64 $1,427Seattle-Tacoma-Bellevue 1.2% 16 70 49 15 6 19.1 1,339 $63 $1,323Portland-Vancouver-Hillsboro 1.2% 17 66 44 15 7 22.5 1,482 $90 $1,475Orlando-Kissimmee-Sanford 1.2% 18 66 46 10 10 45.2 2,986 $160 $3,166Denver-Aurora-Lakewood 1.1% 19 60 42 11 7 18.8 1,126 $55 $1,109Kansas City 1.0% 20 57 32 14 11 36.0 2,050 $94 $2,083Riverside-San Bernardino-Ontario 1.0% 21 55 36 12 7 37.5 2,063 $106 $2,138St. Louis 0.9% 22 52 32 9 11 58.0 3,014 $196 $3,165Cincinnati 0.9% 23 50 23 13 14 70.6 3,529 $187 $3,768Cleveland-Elyria 0.8% 24 46 28 13 5 31.6 1,453 $63 $1,477Houston-The Woodlands-Sugar Land 0.8% 25 44 32 11 1 12.8 565 $28 $543
Top 25 US MSAs Ranked by Number of Establishments
Employees, Payrolls ($MM), Sales ($MM)Mail-order Houses (catalogers) (NAICS 454113), 2015
A Metropolitan Statistical Area (MSA) is a geographic entity defined by the Office of Management and Budget for use by federal statistical agencies. An MSA consists of the county or counties (or equivalent entities) that are associated with at least one urbanized area of at least 50,000 population, plus adjacent counties that have a high degree of social and economic integration with the core as measured through studies of worker and other commuting in the area.
23

% of Total Estabs Rank (Popn.) All Sizes Small: 1-9
Empls.Medium: 10-49
Empls.Large: >50+
Empls.Employees/
Estab. Employees Payrolls ($MM) Sales ($MM)
US Total 100.0% - 5,689 3,839 1,210 640 31.2 177,745 $9,211 $184,066New York 8.8% 1 502 370 82 50 22.4 11,255 $877 $11,468Los Angeles 7.3% 2 413 304 79 30 16.7 6,886 $399 $6,617Chicago 2.8% 3 160 108 32 20 37.6 6,023 $387 $6,455Washington D.C. 2.4% 4 139 104 28 7 10.5 1,456 $81 $1,309San Francisco 2.6% 5 147 100 32 15 20.8 3,051 $199 $2,995
Los Angeles CSA includes: Los Angeles-Long Beach-Anaheim, Riverside-San Bernardino-Ontario, Oxnard-Thousand Oaks-VenturaChicago CSA includes: Chicago-Naperville-Elgin, Ottawa-Peru, Kankakee, Michigan City-La PorteWashington D.C. CSA includes: Washington-Arlington-Alexandria, DC-VA-MD-WV, Baltimore-Columbia-Towson, Hagerstown-Martinsburg, Chambersburg-Waynesboro, Winchester, California-Lexington Park, Easton, CambridgeSan Francisco CSA includes: San Francisco-Oakland-Hayward, San Jose-Sunnyvale-Santa Clara, Stockton-Lodi, Santa Rosa, Vallejo-Fairfield, Santa Cruz-Watsonville, Napa
Top 5 Combined Statistical Areas (CSA) ranked by Population
Employees, Payrolls ($MM), Sales ($MM)Mail-order Houses (catalogers) (NAICS 454113), 2015
New York CSA is the combination of these Metropolitan and Micropolitan Statistical Areas: New York-Newark-Jersey City, Bridgeport-Stamford-Norwalk, New Haven-Milford, Allentown-Bethlehem-Easton, Trenton, Torrington, Kingston, East Stroudsburg
24

Total Small Medium Large Total Small Medium Large Total Small Medium Large Total Small Medium LargeNew England 369 246 77 46 350 233 73 44 334 223 69 42 270 181 54 35Mid-Eastern 967 658 202 107 916 624 190 102 881 600 182 99 738 507 148 83South Eastern 1,221 820 260 141 1,182 794 251 138 1,182 795 249 138 1,182 801 243 138Great Lakes 967 597 232 138 919 567 220 132 927 573 221 133 927 580 215 132North Central 357 228 72 57 343 219 69 55 338 216 67 55 298 192 57 49South Central 394 270 85 39 373 255 80 37 366 251 79 37 324 223 69 32South Western 395 276 77 42 382 267 74 41 377 264 73 40 333 235 62 36Western 1,019 744 205 70 949 693 190 66 896 655 178 63 623 460 119 45
Total 5,689 3,839 1,210 640 5,415 3,652 1,147 616 5,302 3,578 1,117 607 4,695 3,179 966 551
Total Small Medium Large Total Small Medium Large Total Small Medium Large Total Small Medium LargeNew England 9,932 745 1,569 7,618 9,804 722 1,541 7,540 9,475 696 1,487 7,292 8,157 593 1,266 6,299Mid-Eastern 28,427 1,871 4,413 22,142 26,939 1,758 4,202 20,979 26,564 1,743 4,177 20,643 23,973 1,626 3,910 18,437South Eastern 41,104 2,098 5,842 33,164 38,698 1,963 5,547 31,187 41,759 2,138 6,057 33,564 41,759 2,243 6,401 33,115Great Lakes 45,899 1,722 5,087 39,090 43,307 1,619 4,861 36,827 43,828 1,661 5,004 37,163 43,828 1,787 5,425 36,616North Central 13,241 691 1,488 11,062 13,500 696 1,518 11,286 13,500 699 1,526 11,276 13,500 714 1,560 11,227South Central 10,680 806 2,015 7,859 10,347 774 1,972 7,600 9,809 739 1,893 7,177 7,606 597 1,555 5,454South Western 12,232 783 1,555 9,894 11,166 708 1,423 9,035 11,166 712 1,433 9,022 11,166 733 1,474 8,959Western 16,143 2,171 4,067 9,905 17,804 2,361 4,469 10,974 18,060 2,391 4,526 11,143 21,072 2,785 5,228 13,059
Total 177,658 10,888 26,036 140,735 171,565 10,602 25,534 135,429 174,163 10,779 26,103 137,281 171,063 11,079 26,819 133,166
Total Small Medium Large Total Small Medium Large Total Small Medium Large Total Small Medium LargeNew England $525.3 $40.9 $82.5 $401.9 $518.4 $39.7 $80.8 $397.9 $500.9 $38.2 $77.8 $384.9 $431.0 $32.5 $65.7 $332.8Mid-Eastern $1,954.2 $88.2 $257.6 $1,608.3 $1,847.9 $82.8 $246.0 $1,519.1 $1,816.9 $82.1 $245.0 $1,489.8 $1,616.4 $76.4 $231.5 $1,308.5South Eastern $1,792.1 $87.4 $285.8 $1,418.9 $1,693.6 $81.8 $271.9 $1,340.0 $1,835.0 $89.1 $297.3 $1,448.7 $1,871.4 $93.4 $316.0 $1,462.0Great Lakes $2,324.9 $76.0 $277.3 $1,971.6 $2,193.4 $71.4 $265.4 $1,856.7 $2,219.4 $73.2 $273.5 $1,872.7 $2,217.3 $78.6 $298.0 $1,840.7North Central $617.5 $28.8 $66.8 $521.9 $630.1 $28.9 $68.1 $533.1 $630.7 $29.0 $68.4 $533.2 $633.4 $29.5 $69.8 $534.0South Central $509.2 $35.5 $114.0 $359.8 $495.1 $34.1 $111.6 $349.4 $471.3 $32.5 $107.2 $331.5 $372.4 $26.2 $88.4 $257.8South Western $575.1 $39.9 $76.2 $459.0 $524.6 $36.1 $69.8 $418.8 $524.3 $36.3 $70.2 $417.8 $522.5 $37.4 $72.3 $412.9Western $913.3 $94.6 $217.2 $601.4 $1,008.1 $103.0 $238.6 $666.5 $1,022.8 $104.4 $241.6 $676.9 $1,194.2 $121.7 $278.5 $794.0
Total $9,211.7 $491.4 $1,377.4 $7,342.8 $8,911.2 $477.7 $1,352.2 $7,081.4 $9,021.2 $484.7 $1,381.0 $7,155.5 $8,858.6 $495.8 $1,420.1 $6,942.7
Total Small Medium Large Total Small Medium Large Total Small Medium Large Total Small Medium LargeNew England $10,007.4 $530.6 $1,343.5 $8,133.2 $9,558.5 $497.0 $1,277.9 $7,783.6 $9,139.4 $473.4 $1,220.5 $7,445.4 $7,388.6 $378.1 $979.9 $6,030.6Mid-Eastern $29,252.0 $1,329.2 $3,800.6 $24,122.2 $27,676.2 $1,245.8 $3,619.6 $22,810.9 $26,362.7 $1,194.5 $3,482.6 $21,685.6 $21,123.4 $993.1 $2,921.6 $17,208.7South Eastern $43,170.7 $1,487.0 $5,056.4 $36,627.4 $41,580.1 $1,423.3 $4,921.4 $35,235.4 $41,051.6 $1,419.3 $4,927.8 $34,704.5 $38,585.8 $1,407.1 $4,946.5 $32,232.2Great Lakes $48,908.0 $1,230.5 $4,389.5 $43,288.0 $46,099.3 $1,155.7 $4,198.7 $40,744.9 $45,706.8 $1,162.8 $4,243.6 $40,300.3 $41,995.6 $1,155.6 $4,273.5 $36,566.4North Central $13,728.7 $492.1 $1,275.7 $11,960.9 $13,207.6 $467.4 $1,230.7 $11,509.4 $12,944.6 $459.8 $1,214.4 $11,270.4 $11,049.8 $401.9 $1,068.0 $9,579.9South Central $10,882.9 $575.7 $1,756.2 $8,551.0 $10,249.3 $537.5 $1,674.1 $8,037.7 $9,947.8 $526.1 $1,648.8 $7,772.9 $8,288.9 $459.1 $1,470.6 $6,359.1South Western $12,617.4 $555.4 $1,333.6 $10,728.4 $12,209.5 $531.9 $1,296.0 $10,381.6 $11,934.7 $522.8 $1,277.0 $10,134.9 $10,158.5 $459.1 $1,127.0 $8,572.4Western $15,454.8 $1,542.8 $3,458.7 $10,453.3 $14,477.0 $1,422.4 $3,229.7 $9,824.9 $13,651.6 $1,338.7 $3,043.4 $9,269.5 $9,460.3 $924.5 $2,097.4 $6,438.5
Total $184,022.0 $7,743.3 $22,414.3 $153,864.4 $175,057.4 $7,280.9 $21,448.1 $146,328.3 $170,739.2 $7,097.5 $21,058.1 $142,583.6 $148,050.9 $6,178.6 $18,884.5 $122,987.8
Mail-order Houses (catalogers) (NAICS 454113), 20152015 Summary Data, 2016 and 2017 Estimated Data, 2022 Statistical Trend Forecast
Establishments 2015 Actual 2016 Estimate 2017 Estimate 2022 Forecast
Payrolls 2015 $MM Actual 2016 $MM Estimate 2017 $MM Estimate 2022 $MM Forecast
Employment 2015 Actual 2016 Estimate 2017 Estimate 2022 Forecast
Shipments 2015 $MM Estimate 2016 $MM Estimate 2017 $MM Estimate 2022 $MM Forecast
25

Mail-order Houses (catalogers) (NAICS 454113)Establishments by State: All
26

Mail-order Houses (catalogers) (NAICS 454113)Establishments by MSA: All
27

Mail-order Houses (catalogers) (NAICS 454113)Total Establishments by Region
28

25. Mail-order Houses (Catalogers) (NAICS 454113)
Available Reports
29

Available Reports (continued)
30