mail.jmap.orgmail.jmap.org/lessonplans/f.le.a.1-3.docx · web viewfunction , where v represents...
TRANSCRIPT

M – Functions, Lesson 5, Families of Functions (r. 2018)
FUNCTIONSFamilies of Functions
Common Core Standards
F-LE.A.1 Distinguish between situations that can be modeled with linear functions and with exponential functions.
F-LE.A.1a Prove that linear functions grow by equal differences over equal intervals, and that exponential functions grow by equal factors over equal intervals.
F-LE.A.1b Recognize situations in which one quantity changes at a constant rate per unit interval relative to another.
F-LE.A.1c Recognize situations in which a quantity grows or decays by a constant percent rate per unit interval relative to another.
F-LE.A.2 Construct linear and exponential functions, including arithmetic and geometric sequences, given a graph, a description of a relationship, or two input-output pairs (include reading these from a table). PARCC: Tasks are limited to constructing linear and exponential functions in simple context (not multi-step).
F-LE.A.3 Observe using graphs and tables that a quantity increasing exponentially eventually exceeds a quantity increasing linearly, quadratically, or (more generally) as a polynomial function.
Next Generation Standards
AI-F.LE.1 Distinguish between situations that can be modeled with linear functions and with exponential functions.
AI-F.LE.1a Justify that a function is linear because it grows by equal differences over equal intervals, and that a function is exponential because it grows by equal factors over equal intervals.
AI-.F.LE.1b Recognize situations in which one quantity changes at a constant rate per unit interval relative to another, and therefore can be modeled linearly. e.g., A flower grows two inches per day.
AI-F.LE.1c Recognize situations in which a quantity grows or decays by a constant percent rate per unit interval relative to another, and therefore can be modeled exponentially. e.g., A flower doubles in size after each day.
AI-F.LE.2 Construct a linear or exponential function symbolically given: i) a graph; ii) a description of the relationship; iii) two input-output pairs (include reading these from a table). (Shared standard with Algebra II) Note: Tasks are limited to constructing linear and exponential functions in simple context (not multi-step).
AI-F.LE.3 Observe using graphs and tables that a quantity increasing exponentially eventually exceeds a quantity increasing linearly, quadratically, or (more generally) as a polynomial function.
LEARNING OBJECTIVES
Students will be able to:
1) Describe characteristics of linear, exponential and quadratic functions.2) Associate linear functions with constant rates of change.3) Associate exponential and quadratic functions with variable rates of change.

Overview of LessonTeacher Centered Introduction
Overview of Lesson
- activate students’ prior knowledge
- vocabulary
- learning objective(s)
- big ideas: direct instruction
- modeling
Student Centered Activitiesguided practice Teacher: anticipates, monitors, selects, sequences, and connects student work
- developing essential skills
- Regents exam questions
- formative assessment assignment (exit slip, explain the math, or journal entry)
VOCABULARYexponentialfamilies of functions
linear parabloa
quadraticrate of change
BIG IDEAS
Families of FunctionsThe Linear Family
If the graph is a straight line, the function is in the family of linear functions.
All first degree functions are linear functions, except those lines that are vertical.
All linear functions can be expressed as , where m is a constant defined slope and b is the y-intercept.
A constant rate of change indicates a linear function.
The Quadratic Family
If the graph is a parabola, the function is in the family of quadratic functions.
All quadratic functions have an exponent of 2 or can be factored into a single factor with an exponent of 2.
Examples:
The Exponential Family
If the graph is a curve that approaches a horizontal limit on one end and gets steeper on the other end, the function is in the family of exponential functions.
An exponential function is a function that contains a variable for an exponent.
Example: 2xy
Exponential growth and decay can be modeled using the general formula
NOTE: All functions in the form of ny ax NOTE: All functions in the form of

, where 0a and n is an even number >1, take the form of parabolas. The larger the value of n, the wider the flat part at the bottom/top.
ny ax , where 0a and n is an odd number >1, take the form of hyperbolas. These are not quadratic functions.
Rates of Change Can be Used to Identify a Function’s FamilyLinear functions have constant rates of change.Quadratic functions have both negative and positive varying rates of change.Exponential functions have either negative or positive varying rates of change. (NOTE: A quantity increasing exponentially will eventually exceeds a quantity increasing linearly or quadratically.)
When the rate of change is not constant, it is called a variable rate of change.,
Finding Rates of Change from Tables
The slope formula is used to find the rate of change in table views of a function. When applying the slope formula to tables, it may be helpful to think of the formual as
.Simply add two extra columns titleD and to the table, then find the differences between any two y values in the table and their corresponding x values. Example:
The above table is the table view of the function . The ratio of always reduces to , regardless of which coordinate pairs are selected. This means that the above table represents a linear function.

DEVELOPING ESSENTIAL SKILLS
1. Which type of graph is shown in the diagram below?
a. absolute value c. linearb. exponential d. quadratic
2. Which graph represents a linear function?a. c.
b. d.
3. Antwaan leaves a cup of hot chocolate on the counter in his kitchen. Which graph is the best representation of the change in temperature of his hot chocolate over time?a. c.

b. d.
4. Which graph represents an exponential equation?a. c.
b. d.
5. Which type of function is represented by the graph shown below?
a. absolute value c. linearb. exponential d. quadratic
6. Which equation represents a quadratic function?a. c.b. d.
7. Which type of function is graphed below?

a. linear c. exponentialb. quadratic d. absolute value
8. Which graph represents an absolute value equation?a. c.
b. d.
ANSWERS
1. ANS: D2. ANS: A3. ANS: A4. ANS: D5. ANS: D6. ANS: C7. ANS: C8. ANS: B

REGENTS EXAM QUESTIONS (through June 2018)
F.LE.A.1, F.LE.A.2, F.LE.A.3: Model Families of Functions
435) Which situation could be modeled by using a linear function?1) a bank account balance that grows at a rate
of 5% per year, compounded annually3) the cost of cell phone service that charges
a base amount plus 20 cents per minute2) a population of bacteria that doubles every
4.5 hours4) the concentration of medicine in a
person’s body that decays by a factor of one-third every hour
436) Sara was asked to solve this word problem: "The product of two consecutive integers is 156. What are the integers?" What type of equation should she create to solve this problem?1) linear 3) exponential2) quadratic 4) absolute value
437) A population that initially has 20 birds approximately doubles every 10 years. Which graph represents this population growth?1) 3)
2) 4)
438) Which table of values represents a linear relationship?1) 3)

2) 4)
439) The table below shows the average yearly balance in a savings account where interest is compounded annually. No money is deposited or withdrawn after the initial amount is deposited.
Which type of function best models the given data?1) linear function with a negative rate of
change3) exponential decay function
2) linear function with a positive rate of change
4) exponential growth function
440) Rachel and Marc were given the information shown below about the bacteria growing in a Petri dish in their biology class.
Rachel wants to model this information with a linear function. Marc wants to use an exponential function. Which model is the better choice? Explain why you chose this model.
441) The function, , is shown in the table below.

Determine whether is linear or exponential. Explain your answer.
442) The tables below show the values of four different functions for given values of x.
Which table represents a linear function?·1) 3)2) 4)
443) Grisham is considering the three situations below.I. For the first 28 days, a sunflower grows at a rate of 3.5 cm per day.II. The value of a car depreciates at a rate of 15% per year after it is purchased.III. The amount of bacteria in a culture triples every two days during an experiment.Which of the statements describes a situation with an equal difference over an equal interval?1) I, only 3) I and III2) II, only 4) II and III
444) Consider the pattern of squares shown below:
Which type of model, linear or exponential, should be used to determine how many squares are in the nth pattern? Explain your answer.
445) Which scenario represents exponential growth?1) A water tank is filled at a rate of 2
gallons/minute.3) A species of fly doubles its population
every month during the summer.2) A vine grows 6 inches every week. 4) A car increases its distance from a garage
as it travels at a constant speed of 25 miles per hour.
446) One characteristic of all linear functions is that they change by1) equal factors over equal intervals 3) equal differences over equal intervals2) unequal factors over equal intervals 4) unequal differences over equal intervals
447) The highest possible grade for a book report is 100. The teacher deducts 10 points for each day the report is late. Which kind of function describes this situation?1) linear 3) exponential growth2) quadratic 4) exponential decay
448) Ian is saving up to buy a new baseball glove. Every month he puts $10 into a jar. Which type of function best models the total amount of money in the jar after a given number of months?1) linear 3) quadratic2) exponential 4) square root
449) If a population of 100 cells triples every hour, which function represents , the population after t hours?1) 3)

2) 4)
450) The table below represents the function F.
The equation that represents this function is1) 3)2) 4)
451) A laboratory technician studied the population growth of a colony of bacteria. He recorded the number of bacteria every other day, as shown in the partial table below.
Which function would accurately model the technician's data?1) 3)2) 4)
452) Which function is shown in the table below?
1) 3)2) 4)
453) Vinny collects population data, , about a specific strain of bacteria over time in hours, h, as shown in the graph below.

Which equation represents the graph of ?1) 3)2) 4)
454) If and , at which value of x is ?1) 3)2) 2 4) 4
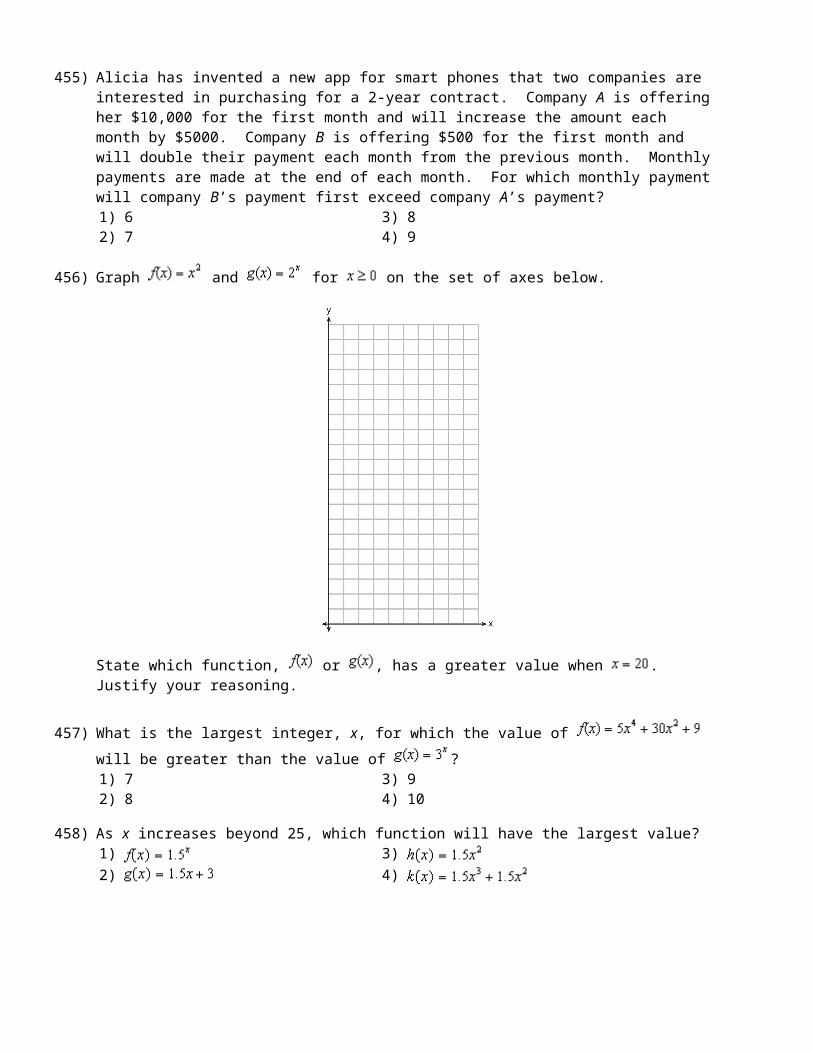
455) Alicia has invented a new app for smart phones that two companies are interested in purchasing for a 2-year contract. Company A is offering her $10,000 for the first month and will increase the amount each month by $5000. Company B is offering $500 for the first month and will double their payment each month from the previous month. Monthly payments are made at the end of each month. For which monthly payment will company B’s payment first exceed company A’s payment?1) 6 3) 82) 7 4) 9
456) Graph and for on the set of axes below.

State which function, or , has a greater value when . Justify your reasoning.
457) What is the largest integer, x, for which the value of will be greater than the value of
?1) 7 3) 92) 8 4) 10
458) As x increases beyond 25, which function will have the largest value?1) 3)2) 4)
459) Michael has $10 in his savings account. Option 1 will add $100 to his account each week. Option 2 will double the amount in his account at the end of each week. Write a function in terms of x to model each option of saving. Michael wants to have at least $700 in his account at the end of 7 weeks to buy a mountain bike. Determine which option(s) will enable him to reach his goal. Justify your answer.
460) Caleb claims that the ordered pairs shown in the table below are from a nonlinear function.
x f(x)0 21 42 83 16
State if Caleb is correct. Explain your reasoning.
461) Which situation is not a linear function?1) A gym charges a membership fee of
$10.00 down and $10.00 per month.3) A restaurant employee earns $12.50 per
hour.2) A cab company charges $2.50 initially and
$3.00 per mile.4) A $12,000 car depreciates 15% per year.
SOLUTIONS
435) ANS: 3Strategy: Eliminate wrong answers.
a) Eliminate answer choice a because it describes exponential growth of money in a bank account.b) Eliminate answer choice b because is describes exponential growth of bacteria.c) Choose answer choice c because it can be modeled using the slope intercept formula as follows:
d) Eliminate answer choice d because it describes exponential decay of medicine in the body.
PTS: 2 NAT: F.LE.A.1 TOP: Families of Functions436) ANS: 2
1. Understand the question as asking what type of equation is needed to solve a product of consecutive integers problem.

2. Step 2. Strategy. Write the equation, then decide it it is linear, quadratic, exponential, or absolute value.3. Step 3. Execution of Strategy.Let x represent the first consecutive integer.Let (x+1) represent the second consecutive integer.Write the equation This is a quadratic equation because it will have an exponent of 2.
Step 4. Does it make sense? Yes. All of the other answer choices can be eliminated as wrong.
PTS: 2 NAT: A.CED.A.1 TOP: Families of Functions437) ANS: 3
Strategy: Build a second model of the problem using a table of values.
If a population starts with 20 birds and doubles every ten years, the following table of values can be created:
Number of Years
Population of Birds
0 2010 4020 8030 16040 320
Choice a can be eliminated because it shows 20 birds after 20 years.Choice b can be eliminated because it shows 0 birds after 20 years.Choice c looks good because it shows 80 birds after 20 years.Choice d can be eliminated because it shows 40 birds after 20 years.
PTS: 2 NAT: F.LE.A.2 TOP: Families of FunctionsKEY: bimodalgraph
438) ANS: 3
Strategy: Use (the slope formula) to determine which table represents a constant rate of change. A linear function will have a constant rate of change.
Answer Choice First set of coordinates Second set of coordinatesa
eliminate because slope is not constant(1,1) and (2,6) (2,6) and (3, 13)
beliminate because slope is not constant
(1,2) and (2,4) (2,4) and (3, 8)
cchoose because slope is constant
(1,1) and (2,3) (2,3) and (3, 5)
deliminate because slope is not constant
(1,1) and (2,8) (2,8) and (3, 27)
PTS: 2 NAT: F.LE.A.1 TOP: Families of Functions439) ANS: 4
Strategy: Input the table into the stats editor of a graphing calculator, then plot the points and examine the shape of the scatterplot.
The data in this table creates a scatterplot that appears to model an exponential growth function.
DIMS? Does It Make Sense? Yes. Savings accounts are excellent exemplars of exponential growth.
PTS: 2 NAT: F.LE.A.1 TOP: Modeling Exponential Equations440) ANS:
Exponential, because the function does not grow at a constant rate.
Strategy 1.Compare the rates of change for different pairs of data using the slope formula.
Rate of change between (1, 220) and (5, 550):
Rate of change between (6, 690) and (10, 1680):
Strategy 2: Use stat plots in a graphing calculator to create a scatterplot view of the multivariate data.
The graph view of the data clearly shows that the data is not linear.
PTS: 2 NAT: S.ID.B.6a TOP: Comparing Linear and Exponential Functions441) ANS:
Strategy #1. Calculate the change in x and the change in y for each ordered pair in the table. If the ratio
of is constant, the function is linear.x t(x)
+2<+2<+2<+2<
-3 10>-2.5>-2.5>-2.5>-2.5
-1 7.51 53 2.55 0
This table shows a linear function, because the ratio of can always be expressed as .

Strategy #2. Input values from the table into the stats editor of a graphing calculator, turn stats plot on, then use zoom stat to inspect the scatterplot.
The scatterplot shows a linear relationship.
PTS: 2 NAT: F.LE.A.1 TOP: Families of Functions442) ANS: 1
Step 1. Notice that in each of the tables, the values of the indepedendent variable (x) are 1, 2, 3, and 4, while the dependent variables are different. The question asks which table represents a linear function and, bu definition, a linear function must have a constant rate of change.Step 2. Use the slope formula and data from each table to determine which table represents a constant rate of change.Step 3. Execute the strategy.
f(x) . Every time x increases by 1, f(x) increases by 7. This is a constant rate of change, so f(x) is a linear function.
g(x) . Every time x increases by 1, g(x) increases by a different amount. This is not a constant rate of change, so g(x) is not a linear function.
h(x) . Every time x increases by 1, h(x) increases by a different amount. This is not a constant rate of change, so h(x) is not a linear function.
k(x) . Every time x increases by 1, k(x) increases by a different amount. This is not a constant rate of change, so k(x) is not a linear function.
Step 4. Does it make sense? Yes. Only one table shows a constant rate of change.
PTS: 2 NAT: F.LE.A.1 TOP: Families of Functions443) ANS: 1
Interpreting the Question: Equal differences over equal intervals suggests a constant rate of change, which would be a linear relationship. Strategy: Model each situation with a function rule, then select the linear functions.I. For the first 28 days, a sunflower grows at a rate of 3.5 cm per day.This can be modeled with the linear function , where h represents the height of the sunflower and d represents the number of days. Since this function is linear, it represents a situation with an equal difference over an equal interval.II. The value of a car depreciates at a rate of 15% per year after it is purchased.

This can be modeled with the exponential decay function , where V represents the value of the car, P represents its price when purchased, -.15 represents the annual depreciation rate, and t represents the number of years after purchase. This is an exponential decay function, so it does not represent a situation with an equal difference over an equal interval.III. The amount of bacteria in a culture triples every two days during an experiment.
This can be modeled with the exponential growth function , where A represents the amount
of bacteria, B represents starting amount of bacteria, 3 represents the growth rate, and represents the number of growth cyles. This is an exponential growth function, so it does not represent a situation with an equal difference over an equal interval.The only choice that represents a situation with an equal difference over an equal interval is the first situation.
PTS: 2 NAT: F.LE.A.1 TOP: Families of Functions444) ANS:
Exponential. The rate of change is not constant, so a linear model must be eliminated.
Strategy: Build a table of values, as follows:n 1 2 3 4 5 6 7 n
f(n) 2 4 8 16 32 64 128
The pattern can be modeled using the exponential function .
PTS: 2 NAT: F.LE.A.1445) ANS: 3
Strategy: Eliminate wrong ansers.a) A water tank is filled at a rate of 2 gallons/minute. A rate of 2 gallons a minute is a constant rate of change, so this cannot be an exponential function.b) A vine grows 6 inches every week. A rate of 6 inches every week is a constant rate of change, so this cannot be an exponential function.c) A species of fly doubles its population every month during the summer. A rate of change that doubles every month is not constant. The population of flies could be modeled with the following exponential equation.
d) A car increases its distance from a garage as it travels at a constant speed of 25 miles per hour.
PTS: 2 NAT: F.LE.A.1 TOP: Families of Functions446) ANS: 3
All linear functions must have constant rates of change, which means equal differences over equal intervals.
PTS: 2 NAT: F.LE.A.1 TOP: Families of Functions447) ANS: 1
The rate of change is constant (-10 points per day), so it must be a linear function.
PTS: 2 NAT: F.LE.A.1 TOP: Families of Functions448) ANS: 1
The sentence “Every month he puts $10 into a jar” indicates a constant rate of change. Linear functions represent constant rates of change.
PTS: 2 NAT: F.LE.A.1 TOP: Families of Functions449) ANS: 2

Build a table that models the growth, then test the answer choices to see which one produces the table.t 0 1 2 3
p(t) 100 300 900 2700
is the correct answer because it reproduces the table view of the function.
PTS: 2 NAT: F.LE.A.2 TOP: Families of FunctionsKEY: AI
450) ANS: 3Strategy: Test each function to see if it fits the table:
Choice Equation (3,9) (6,65) (8,257)a
(eliminate)b
(correct) (eliminate)c
(correct) (correct) (correct)d
(correct) (eliminate)
PTS: 2 NAT: F.LE.A.2 TOP: Modeling Exponential Equations451) ANS: 2
Strategy: Input all four functions into a graphing calculator and compare the table of values.
Answer choice b produces a table of values that agrees with the table of values in the problem.
PTS: 2 NAT: F.LE.A.2 TOP: Modeling Linear and Exponential Equations452) ANS: 4
Strategy: Put the functions in a graphing calculator and inspect the table view. The correct answer is
.

PTS: 2 NAT: F.LE.A.2 TOP: Families of Functions453) ANS: 1
Note that the graph represents an exponential function.Choice Family of Functions Standard Form
a Exponential
b Linear
c Quadratic
d Cubic
PTS: 2 NAT: F.LE.A.2 TOP: Families of Functions454) ANS: 1
Strategy: Input both functions in a graphing calculator and compares the values of y for various values of x.
The table of values shows:When , When ,
When , When ,
PTS: 2 NAT: F.LE.A.3 TOP: Families of Functions455) ANS: 3
Strategy: Build a table of values for the integer values of the domain to compare both offers. x
6 40,000 16,000

7 45,000 32,0008 50,000 64,0009 55,000 128,000
Offer B is greater than offer A when .
PTS: 2 NAT: F.LE.A.3 TOP: Comparing Linear and Exponential Functions456) ANS:
has a greater value:
Strategy: Input both functions in a graphing calculator, use the table of values to create the paper graph, and to compare the values of y for various values of x.
The table of values shows that when , .DIMS? Does It Make Sense? Yes.
PTS: 4 NAT: F.LE.A.3 TOP: Comparing Quadratic and Exponential Functions457) ANS: 3
Step 1. Understand that the problem asks you to select the largest value of x where the value of f(x) will be greater than the value of g(x).Step 2. Strategy. Input both functions in a graphing calculator and explore the table of values.Step 3. Execution of Strategy.

The table shows that f(x) is greater than g(x) when , , and , but not when . The largest integer for which f(x) is greater than g(x) is 9.
Step 4. Does it make sense? Yes. is a quadratic function and is an exponential function. Exponential growth evetually outpaces quadratic growth.
PTS: 2 NAT: F.LE.A.3 TOP: Families of Functions458) ANS: 1
Strategy: Input all functions in a graphing calculator and inspect the table of values.
x f(x) g(x) h(x) k(x)25 25,251 40.5 937.5 24,375
PTS: 2 NAT: F.LE.A.3459) ANS:
Option 1 can be modeled by the function Option 2 can be modeled by the function
Either option will allow Michael to have at least $700 in his account at the end of 7 weeks.
and
, ; both, since and
PTS: 4 NAT: F.LE.A.3 TOP: Families of Functions460) ANS:
Yes. Caleb is correct because the function does not have a constant rate of change. A linear function must have a constant rate of change.
Strategy: Compare the rate of change between each row of the table of values.

PTS: 2 NAT: F.LE.A.1 TOP: Families of Functions461) ANS: 4
Strategy: A linear function will have a constant rate of change, so find the function that does not have a constant rate of change.Choice 1: $10.00 per month is a constant rate, so eliminate this choice.Choice 2: $3.00 per mile is a constant rate, so eliminate this choiceChoice 3: $12.50 per hour is a constant rate, so eliminate this choiceChoice 4: depreciates 15% per year is an exponential rate of change. The amount of change gets smaller each year as the car depreciates in value. This is the correct answer because it is not a constant rate of change and all linear functions must have constant rates of change.
PTS: 2 NAT: F.LE.A.1 TOP: Families of Functions