main research areas - uni-due.de · investigation of near-surface air exchange between city, ......
TRANSCRIPT
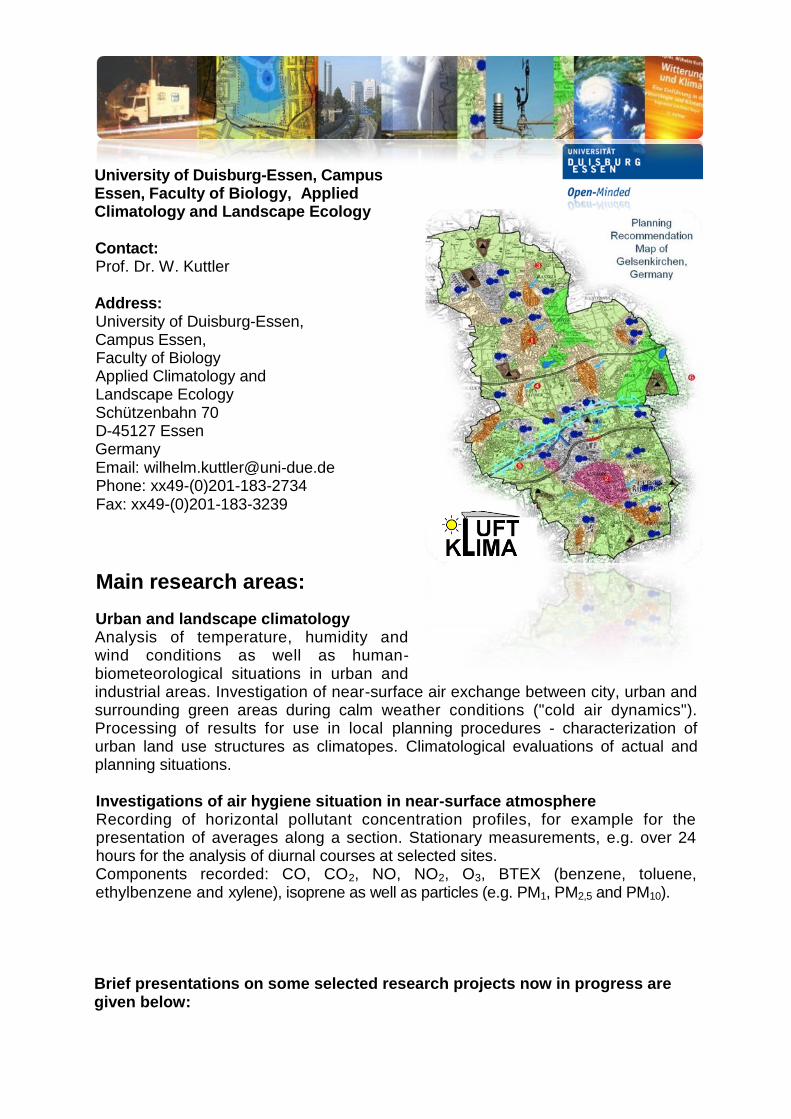
University of Duisburg-Essen, Campus Essen, Faculty of Biology, Applied Climatology and Landscape Ecology
Contact: Prof. Dr. W. Kuttler
Address: University of Duisburg-Essen, Campus Essen, Faculty of Biology
Applied Climatology and
Landscape Ecology
Schützenbahn 70
D-45127 Essen
Germany
Email: [email protected]
Phone: xx49-(0)201-183-2734
Fax: xx49-(0)201-183-3239
Main research areas:
Urban and landscape climatology
Analysis of temperature, humidity and wind conditions as well as human-biometeorological situations in urban and industrial areas. Investigation of near-surface air exchange between city, urban and surrounding green areas during calm weather conditions ("cold air dynamics"). Processing of results for use in local planning procedures - characterization of urban land use structures as climatopes. Climatological evaluations of actual and planning situations.
Investigations of air hygiene situation in near-surface atmosphere
Recording of horizontal pollutant concentration profiles, for example for the presentation of averages along a section. Stationary measurements, e.g. over 24 hours for the analysis of diurnal courses at selected sites. Components recorded: CO, CO2, NO, NO2, O3, BTEX (benzene, toluene, ethylbenzene and xylene), isoprene as well as particles (e.g. PM1, PM2,5 and PM10).
Brief presentations on some selected research projects now in progress are given below:
Path-integrated measurements of carbon dioxide in the urban boundary layer Dipl. Landscape Ecologist Christian Büns
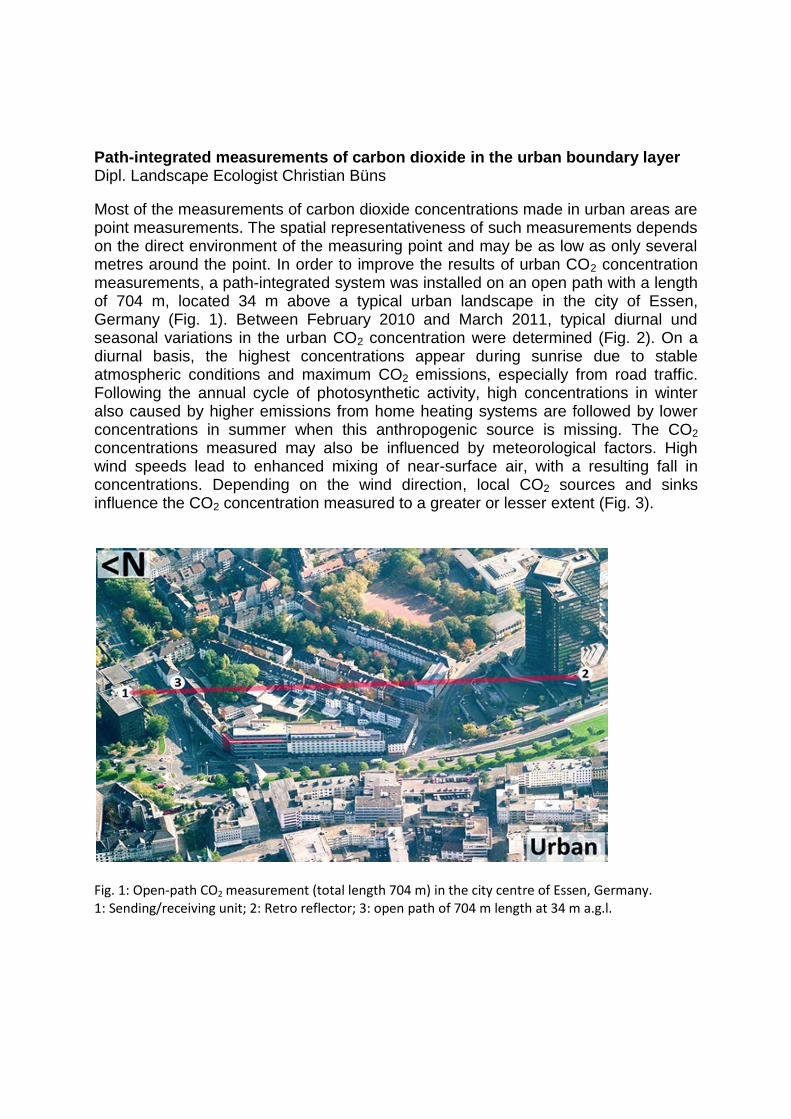
Most of the measurements of carbon dioxide concentrations made in urban areas are point measurements. The spatial representativeness of such measurements depends on the direct environment of the measuring point and may be as low as only several metres around the point. In order to improve the results of urban CO2 concentration measurements, a path-integrated system was installed on an open path with a length of 704 m, located 34 m above a typical urban landscape in the city of Essen, Germany (Fig. 1). Between February 2010 and March 2011, typical diurnal und seasonal variations in the urban CO2 concentration were determined (Fig. 2). On a diurnal basis, the highest concentrations appear during sunrise due to stable atmospheric conditions and maximum CO2 emissions, especially from road traffic. Following the annual cycle of photosynthetic activity, high concentrations in winter also caused by higher emissions from home heating systems are followed by lower concentrations in summer when this anthropogenic source is missing. The CO2 concentrations measured may also be influenced by meteorological factors. High wind speeds lead to enhanced mixing of near-surface air, with a resulting fall in concentrations. Depending on the wind direction, local CO2 sources and sinks influence the CO2 concentration measured to a greater or lesser extent (Fig. 3).
Fig. 1: Open-path CO2 measurement (total length 704 m) in the city centre of Essen, Germany. 1: Sending/receiving unit; 2: Retro reflector; 3: open path of 704 m length at 34 m a.g.l.
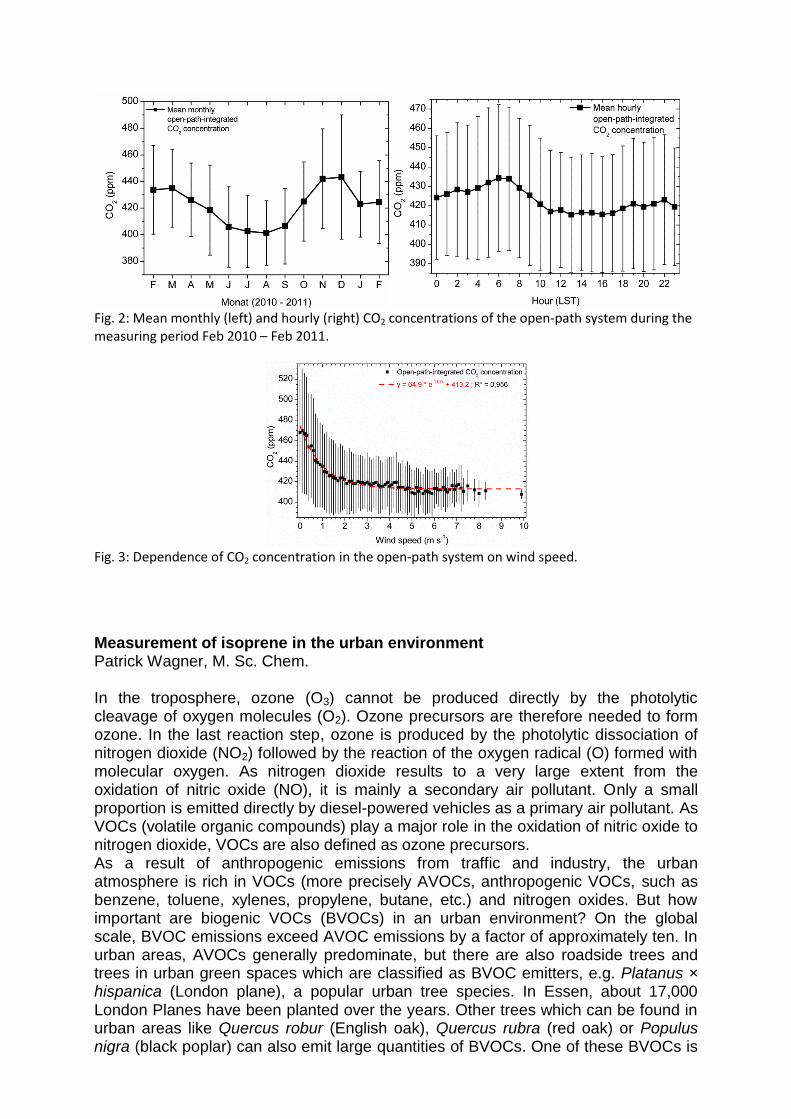
Fig. 2: Mean monthly (left) and hourly (right) CO2 concentrations of the open-path system during the measuring period Feb 2010 – Feb 2011.
Fig. 3: Dependence of CO2 concentration in the open-path system on wind speed.
Measurement of isoprene in the urban environment Patrick Wagner, M. Sc. Chem. In the troposphere, ozone (O3) cannot be produced directly by the photolytic cleavage of oxygen molecules (O2). Ozone precursors are therefore needed to form ozone. In the last reaction step, ozone is produced by the photolytic dissociation of nitrogen dioxide (NO2) followed by the reaction of the oxygen radical (O) formed with molecular oxygen. As nitrogen dioxide results to a very large extent from the oxidation of nitric oxide (NO), it is mainly a secondary air pollutant. Only a small proportion is emitted directly by diesel-powered vehicles as a primary air pollutant. As VOCs (volatile organic compounds) play a major role in the oxidation of nitric oxide to nitrogen dioxide, VOCs are also defined as ozone precursors. As a result of anthropogenic emissions from traffic and industry, the urban atmosphere is rich in VOCs (more precisely AVOCs, anthropogenic VOCs, such as benzene, toluene, xylenes, propylene, butane, etc.) and nitrogen oxides. But how important are biogenic VOCs (BVOCs) in an urban environment? On the global scale, BVOC emissions exceed AVOC emissions by a factor of approximately ten. In urban areas, AVOCs generally predominate, but there are also roadside trees and trees in urban green spaces which are classified as BVOC emitters, e.g. Platanus × hispanica (London plane), a popular urban tree species. In Essen, about 17,000 London Planes have been planted over the years. Other trees which can be found in urban areas like Quercus robur (English oak), Quercus rubra (red oak) or Populus nigra (black poplar) can also emit large quantities of BVOCs. One of these BVOCs is

isoprene, which can be seen as a lead compound among biogenic emissions. It is not only the major compound emitted in terms of quantities, but is also one of the most reactive BVOCs. This means that isoprene can react quite fast in the atmosphere to form ozone. Isoprene research has focused mainly on its influence in rural areas, where it is a major ozone precursor. Knowledge of the relevance of isoprene in urban areas is still very limited. This is why one of our research projects deals with the measurement of isoprene concentrations in the urban canopy layer. We use a GC-PID (gas chromatograph coupled with a photoionization detector) to determine the ambient isoprene concentration. To assess its importance, BTEX concentrations (benzene, toluene, ethylbenzene, o-xylene, m,p-xylene) can also be measured using this method. We found very high isoprene concentrations on a hot summer day in June (maximum ambient temperature 35 °C). The concentration exceeded 2 ppb for several hours in the afternoon. The isoprene/benzene ratio increased to values above 10 at the same time. Some other measurements also indicated that isoprene exceeds the concentrations of the BTEX compounds in the afternoon hours of summer days. The reason is the dependence of isoprene emissions on light and temperature. Temperature dependence is almost exponential up to 40 °C. Because of these dependences, the isoprene concentration reaches its maximum during the best conditions for ozone formation unlike AVOCs which reach their peak concentration in the morning hours due to the combination of morning rush hour and low mixed layer height.
Figure 1: measurement of isoprene and BTEX concentrations in an urban canyon with many Platanus × hispanica trees during a summer day

Influence of urban evaporation on thermal comfort – using EC technique Dipl.-Geogr. Anja Goldbach In urban climatology, evaporation areas (green spaces, water bodies) play a key role in mitigating summer thermal loads. The positive effects of non-sealed surfaces, urban parks and gardens, especially in reducing temperatures through shading, cold air production and evapotranspiration are as well-known as the cooling effect of urban water bodies. However, it is difficult to quantify precisely the effects of such areas. In particular, no one-year or long-term intra-urban in-situ measurements are available to allow comparative analyses under identical weather conditions. Evaporation measurements with a lysimeter or residual methods are not suitable for measuring atmospheric water vapour fluxes in the urban boundary layer. They disregard the evaporation characteristics of the heterogeneous urban land use pattern. A technique for directly measuring atmospheric water vapour transport in the boundary layer is the well-established eddy covariance (EC) method, which has been used for about two decades. With the aim of quantifying evaporation in areas with various types of urban land use, comparative energy balance measurements using the EC technique were carried out in the model city of Oberhausen (Germany) between 1 August 2010 and 31 July 2011 within the dynaklim project financed by the German Federal Ministry of Education and Research (activity 4.3.1; www.dynaklim.de). Two turbulence measurement stations were equipped with sonic anemometers to sample horizontal and vertical wind vectors. The molar densities of H2O und CO2 were measured with a non-dispersive infrared open-path analyser and the components of the radiation balance were measured by a net radiometer. All instruments were installed 30 m above ground level at both stations. Sensible heat flux (QH) is 20 % higher and latent heat flux (QE) 95 % lower at the urban station (URB) than at the suburban station (SUB; Fig.1). It was found that green spaces with a good water supply can counteract increasing thermal stress for city-dwellers. In order to assess the human biometeorological effect of suburban green spaces, the thermal comfort parameter PET (physiological equivalent temperature) was calculated using the RayMan-Pro program (Matzarakis et al. 2010). A comparison between air temperature and PET clearly shows that the creation of green spaces with a good water supply and/or urban bodies of water can counteract growing thermal stress on the urban population (Fig. 2). This conclusion is crucially important, especially for urban planners considering practical adaptation and mitigation strategies for predicted climate change. However, this positive effect may be reduced or lost entirely during long periods of drought. The increase in the QH/QE quotient from 0.65 to 2.8 with falling soil humidity at SUB and the reduction in the monthly average QE value from 94 W/m2
(August 2010, heavy precipitation) to only 47 W/m2 (March 2011, dry period) provide impressive evidence of this relationship. From the point of view of urban climates, it must therefore be pointed out that the creation of urban green spaces can only be effective if they have an optimum water supply. A long series of evapotranspiration values is available in the form of the one-year measurements indicating the diurnal and seasonal variability of atmospheric water vapour fluxes over land with various types of use. Especially in the context of research in the field of water resource management, these results are important for gaining a better understanding of the water balance within the climate system.
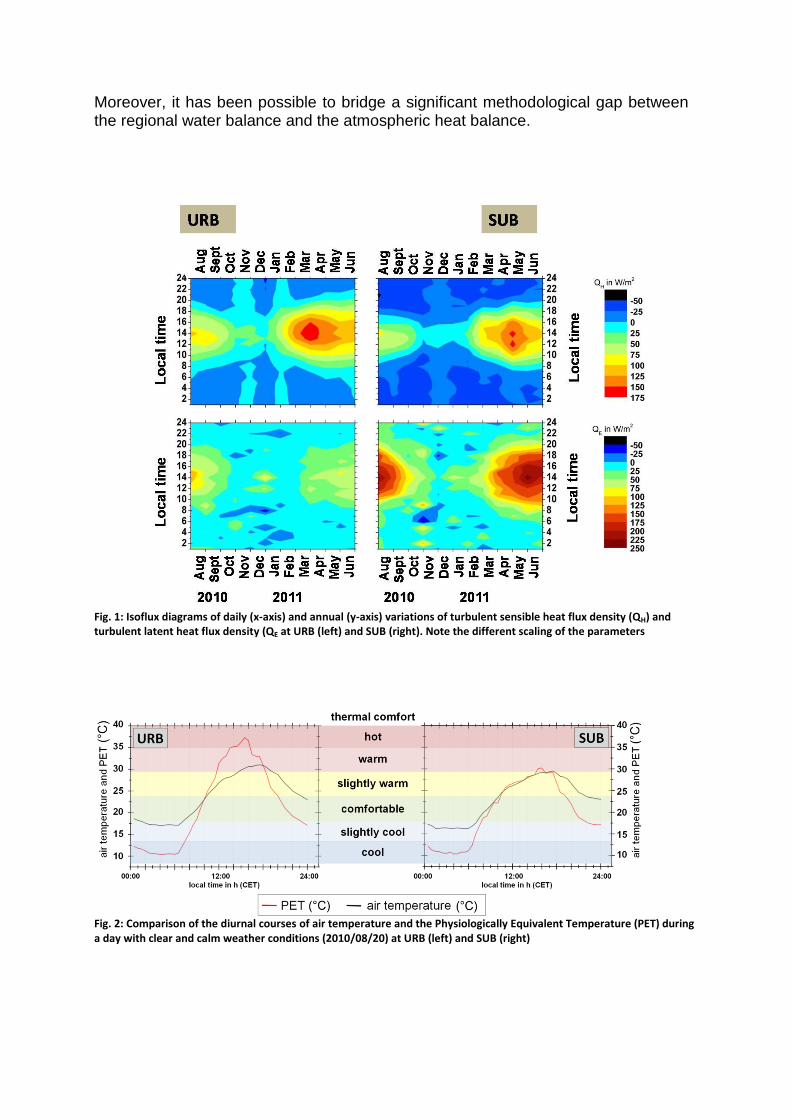
Moreover, it has been possible to bridge a significant methodological gap between the regional water balance and the atmospheric heat balance.
Fig. 1: Isoflux diagrams of daily (x-axis) and annual (y-axis) variations of turbulent sensible heat flux density (QH) and turbulent latent heat flux density (QE at URB (left) and SUB (right). Note the different scaling of the parameters
Fig. 2: Comparison of the diurnal courses of air temperature and the Physiologically Equivalent Temperature (PET) during a day with clear and calm weather conditions (2010/08/20) at URB (left) and SUB (right)
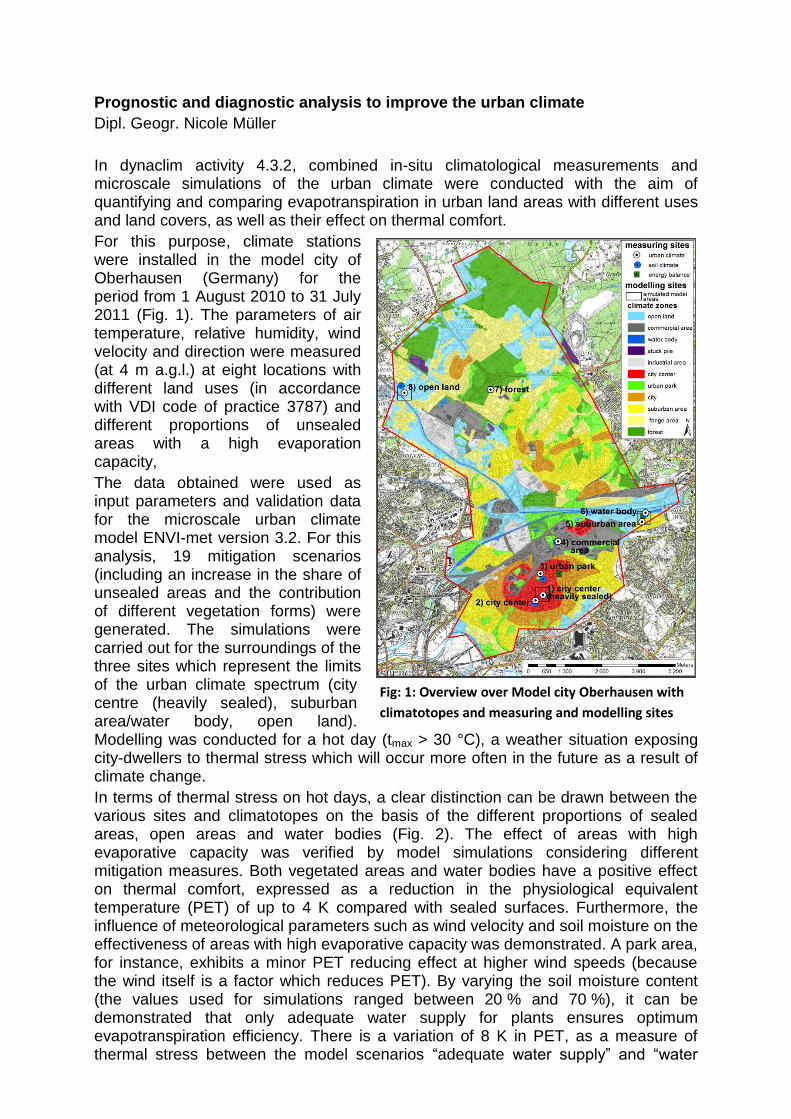
Fig: 1: Overview over Model city Oberhausen with
climatotopes and measuring and modelling sites
Prognostic and diagnostic analysis to improve the urban climate
Dipl. Geogr. Nicole Müller
In dynaclim activity 4.3.2, combined in-situ climatological measurements and microscale simulations of the urban climate were conducted with the aim of quantifying and comparing evapotranspiration in urban land areas with different uses and land covers, as well as their effect on thermal comfort.
For this purpose, climate stations were installed in the model city of Oberhausen (Germany) for the period from 1 August 2010 to 31 July 2011 (Fig. 1). The parameters of air temperature, relative humidity, wind velocity and direction were measured (at 4 m a.g.l.) at eight locations with different land uses (in accordance with VDI code of practice 3787) and different proportions of unsealed areas with a high evaporation capacity,
The data obtained were used as input parameters and validation data for the microscale urban climate model ENVI-met version 3.2. For this analysis, 19 mitigation scenarios (including an increase in the share of unsealed areas and the contribution of different vegetation forms) were generated. The simulations were carried out for the surroundings of the three sites which represent the limits of the urban climate spectrum (city centre (heavily sealed), suburban area/water body, open land). Modelling was conducted for a hot day (tmax > 30 °C), a weather situation exposing city-dwellers to thermal stress which will occur more often in the future as a result of climate change.
In terms of thermal stress on hot days, a clear distinction can be drawn between the various sites and climatotopes on the basis of the different proportions of sealed areas, open areas and water bodies (Fig. 2). The effect of areas with high evaporative capacity was verified by model simulations considering different mitigation measures. Both vegetated areas and water bodies have a positive effect on thermal comfort, expressed as a reduction in the physiological equivalent temperature (PET) of up to 4 K compared with sealed surfaces. Furthermore, the influence of meteorological parameters such as wind velocity and soil moisture on the effectiveness of areas with high evaporative capacity was demonstrated. A park area, for instance, exhibits a minor PET reducing effect at higher wind speeds (because the wind itself is a factor which reduces PET). By varying the soil moisture content (the values used for simulations ranged between 20 % and 70 %), it can be demonstrated that only adequate water supply for plants ensures optimum evapotranspiration efficiency. There is a variation of 8 K in PET, as a measure of thermal stress between the model scenarios “adequate water supply” and “water
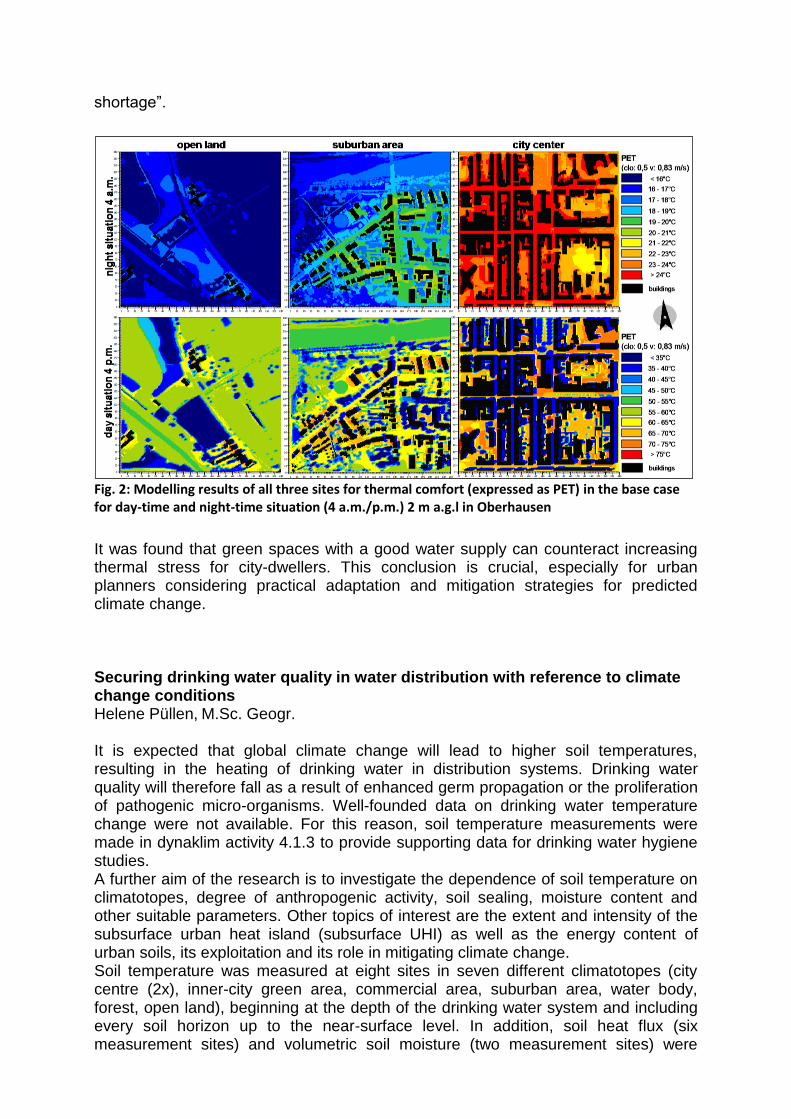
shortage”.
Fig. 2: Modelling results of all three sites for thermal comfort (expressed as PET) in the base case for day-time and night-time situation (4 a.m./p.m.) 2 m a.g.l in Oberhausen
It was found that green spaces with a good water supply can counteract increasing thermal stress for city-dwellers. This conclusion is crucial, especially for urban planners considering practical adaptation and mitigation strategies for predicted climate change. Securing drinking water quality in water distribution with reference to climate change conditions Helene Püllen, M.Sc. Geogr. It is expected that global climate change will lead to higher soil temperatures, resulting in the heating of drinking water in distribution systems. Drinking water quality will therefore fall as a result of enhanced germ propagation or the proliferation of pathogenic micro-organisms. Well-founded data on drinking water temperature change were not available. For this reason, soil temperature measurements were made in dynaklim activity 4.1.3 to provide supporting data for drinking water hygiene studies. A further aim of the research is to investigate the dependence of soil temperature on climatotopes, degree of anthropogenic activity, soil sealing, moisture content and other suitable parameters. Other topics of interest are the extent and intensity of the subsurface urban heat island (subsurface UHI) as well as the energy content of urban soils, its exploitation and its role in mitigating climate change. Soil temperature was measured at eight sites in seven different climatotopes (city centre (2x), inner-city green area, commercial area, suburban area, water body, forest, open land), beginning at the depth of the drinking water system and including every soil horizon up to the near-surface level. In addition, soil heat flux (six measurement sites) and volumetric soil moisture (two measurement sites) were

determined. The temperature curves of the soils show a typical behaviour which is modified by site-specific parameters. In general, depending on the time of year, a rise in temperature in the winter and a decline in temperature in the summer, attenuation of amplitude and a phase lag of maximum temperature with increasing depth were observed. The eight observation sites can be classed in two groups: anthropogenic and relatively natural. This is especially evident in the summer, when mean soil profile temperature shows a wide difference of up to 10 K between profiles and a noticeable offset between anthropogenic and natural sites (Fig. 1). These results are in accordance with yearly mean temperatures. The highest values occurred at heavily modified (anthropogenic) sites, while the lowest values were observed at the relatively natural sites.
Fig. 1 Daily mean soil temperature of profiles (weighted mean of temperature sensors) at all observation sites (Oberhausen, Germany; 01.08.2010 – 31.07.2011)
Oberhausen features a strong subsurface UHI, as can be seen in Fig. 2. It exhibits maximum intensities of almost 7 K (daily mean) in the summer of 2010 and falls to zero at the beginning of April 2011. As a result of the inertia of the soil, it shows a phase lag compared with maximum surface UHI intensities.

Fig. 2: Comparison of surface UHI and subsurface UHI (city centre – open land) based on mean daily temperatures (Oberhausen, Germany; 01.08.2010 – 31.07.2011)
Impact of global climate change on a developing economy – Armenia Dr. Ani Melkonyan The main aim of this project is to identify precise links between economic parameters such as the gross domestic product (GDP) generated by various sectors of the economy – manufacturing industry, the energy sector, agriculture, transport, water resources, tourism, etc. and climatic factors – temperature, precipitation, wind field, etc. On the basis of these links, the impact of climate on each sector (and vice versa) and future trends in such impact as a result of global clime change will be assessed. The objective is to develop mathematical models which will allow economic efficiency to be improved with reference to climate change. In order to determine these socio-economic impacts, the direct consequences of projected climate change on Armenia will need to be assessed. Large-scale results of global climate scenarios for the Caucasus region are available. Using a dynamic statistical downscaling technique, these results are downscaled to a high resolution of approximately 5 km. Using this technique, a number of periods are selected to represent specific weather situations for each season. For each period, dynamic downscaling is performed using the mesoscale meteorology model METRAS. This type of investigation is important for developing countries like Armenia, where different sectors of the economy need to be radically improved, concentrating not only on economic factors, such as initial capital, savings, and consumption, but also taking into consideration climatic factors, modelling of climate change in the future, an assessment of the vulnerability of the various sectors to climate factors and risk management. Being a mountainous country, Armenia (see topographic map in Fig.1) is prone to various types of natural disasters, such as floods, droughts and storms, which have a direct impact on the economy. It is therefore necessary to estimate the vulnerability of the various sectors of the economy.
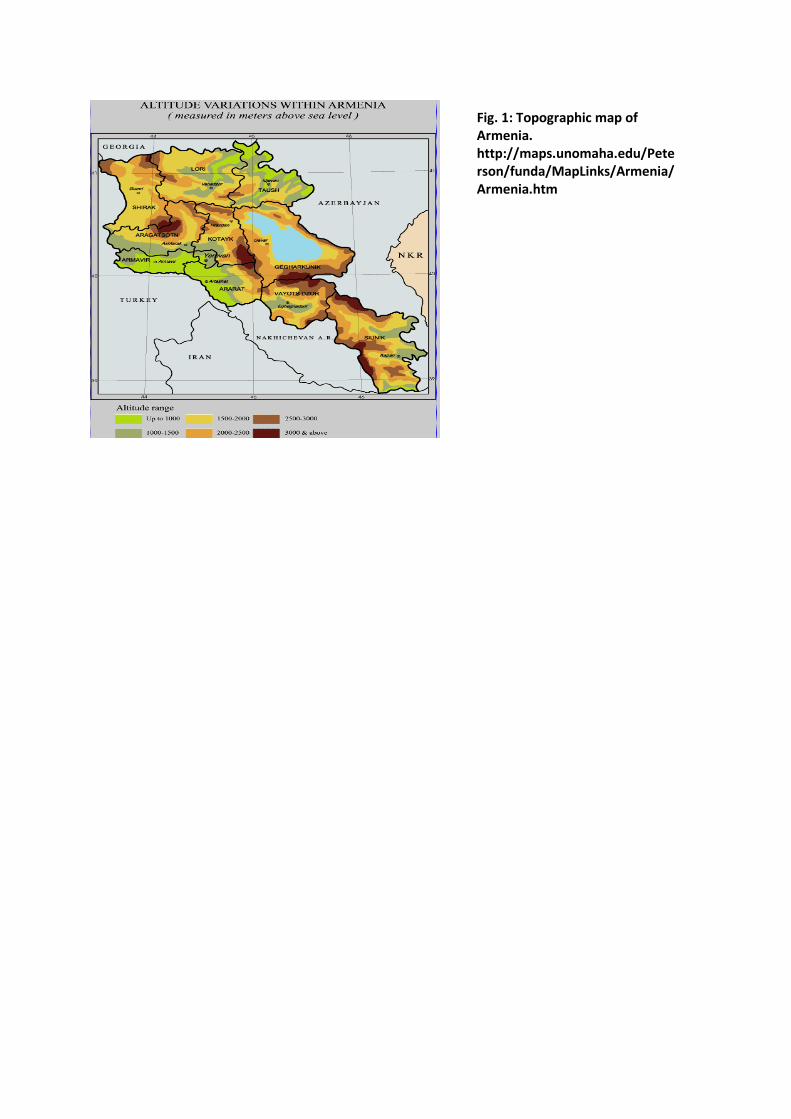
Fig. 1: Topographic map of
Armenia. http://maps.unomaha.edu/Peterson/funda/MapLinks/Armenia/Armenia.htm
Publications of the department (selected): Wagner, P. a. Kuttler, W. (2014): Biogenic and anthropogenic isoprene in the near-surface urban atmosphere – A case-study in Essen, Germany. In: Science of The Total Environment, Volume 475, March 2014, p. 104-115. Dütemeyer, D., Barlag, A.-B., Kuttler, W. a. Axt-Kittner, U. (2013): Measures against heat stress in the city of Gelsenkirchen, Germany. In: DIE ERDE, Volume 144, Nr. 3-4, p. 181-201, DOI: 10.12854/erde-144-14. Müller, N., Kuttler, W. a. Barlag, A.-B. (2013): Analysis of the subsurface urban heat island (SUHI) in Oberhausen, Germany. In: Climate Research, DOI: 10.3354/cr01195. Müller, N., Kuttler, W. a. Barlag, A.-B. (2013): Counteracting urban climate change: adaptation measures and their effect on thermal comfort. In: Theoretical Applied Climatology, DOI: 10.1007/s00704-013-0890-4. Weber, S., Kordowski, K. a. Kuttler, W. (2013): Variability of particle number concentration and particle size dynamics in an urban street canyon under different meteorological conditions. In: Science of the Total Environment, 449, p. 102-114, http://dx.doi.org/10.1016/j.scitotenv.2013.01.044. Melkonyan, A. a. Kuttler W. (2012): Long-term analysis of NO, NO2 and O3 concentrations in North-Rhine-Westphalia, Germany. In: Atmospheric Environment, Vol. 46, p. 316-326. Goldbach, A. a. Kuttler, W. (2012): Quantification of turbulent heat fluxes for adaptation strategies within urban planning. In: International Journal of Climatology, DOI: 10.1002/joc.3437. Büns, C. a. W. Kuttler (2012): Path-integrated measurements of carbon dioxide in the urban canopy layer. – In: Atmospheric Environment, (46), p. 237-247, DOI: 10.1016/j.atmosenv.2011.09.077. Kuttler, W. (2011): Klimawandel im urbanen Bereich, Teil 2, Maßnahmen; Climate change in urban areas, Part 2, Measures. - In: Environmental Sciences Europe (ESEU), Springer open, Doi: 10.1186/2190-4715-23-21, S. 1-15. Kuttler, W. (2011): Klimawandel im urbanen Bereich, Teil 1, Wirkungen; Climate change in urban areas, Part 1, Effects. - In: Environmental Sciences Europe (ESEU), Springer open, DOI: 10.1186/2190-4715-23-11, p. 1-12. Kordowski, K. a. W. Kuttler (2010): Carbon dioxide fluxes over an urban park area. – In: Atmospheric Environment, 44 (23), p. 2722-2730, DOI: 10.1016/j.atmosenv.2010.04.039. Henninger, S. a. W. Kuttler (2010): Near surface carbon dioxide within the urban area of Essen, Germany. – In: Physics and Chemistry of the Earth, Parts A/B/C, Vol. 35, Issues 1-2, p. 76-84.

Curriculum Vitae of
Univ.-Prof. Dr. rer. nat. Wilhelm Kuttler Born: 1949
Studies (1970-75): Physical Geography - Climatology/Meteorology, Biology;
Univ. Bochum
PhD (1978): " Influencing variables of harmful weather types and their human-bioclimatic impacts" (101 p.)
Habilitation (1984): "Spatio-temporal analysis of atmospheric trace element inputs in Central Europe” (288 p.)
1975-1985: Scientific Assistant Univ. Bochum
1985-1986: Lecturer Meteorology/Climatology, Univ. Hanover
1986: Chair (C 4), University of Erlangen (declined)
1986: Chair (C 4), University of Essen
1986: Professor, University of Essen; establishing the Department of Applied Climatology and Landscape Ecology
1991: Chair (C 4), "Climatology" University of Trier (declined)
Since 2003: Visiting Lecturer in Urban Climatology at Bauhaus University, Weimar
Selected professional duties and awards
1987-1988: Vice President, Society of Ecology (GfÖ) 1993-1996: President, Society of Ecology (GfÖ)
1994-2003: Chairman, VDI Group "Local Cold Air", VDI 3787 Bl. 5
1998-2004: Chairman, VDI Group "Climate and air pollution in local planning",
VDI 3787 Part 9
1995-1999: Chairman Committee 2 "Environmental questions" of the Wind Technology Society (WTG), Aachen
1996: Responsible Organiser "International Conference on Urban Climatology" (ICUC'96) Univ.-GH Essen
Since 1998: Board member of editorial committee of "Zeitschrift für Angewandte Umweltforschung (ZAU)
since 1999: Scientific advisory board, "Geographica Helvetica" Responsible Organiser, "3rd Japanese-German Symposium on Urban Climatology" Univ. Essen
since 2001: Board member, "Climate" committee Department II "Environmental Meteorology"
Kommission Reinhaltung der Luft (KRdL) VDI / DIN 2002-2005: Chairman, Environmental Meteorology Committee (FA UMET) of
the German Meteorological Society (DMG)
since 2005: Assessor, Committee Department "Rhineland" of the German Meteorological Society (DMG)
since 2005: Chairman of the "Climate" committee Department II "Environmental Meteorology" Kommission Reinhaltung der Luft (KRdL) VDI / DIN
Sept. 2009: Elected Chairman of the German Meteorological Community (DMG) for the period 01.01.2010 to 31.12.2011
Sept. 2009: Member of the jury for the Essen environmental prize Sept. 2009: VDI badge of honour for special merit in the standardization of
climatology matters
PHD Supervisor Prof. Dr. W. Kuttler
23) Turbulent Energy exchanges over different surface cover types within the city area of Oberhausen (GOLDBACH, A., 2012)
22) Spatial, temporal and source dependent variation of respirable dust elicit hydroxyl
radical generation (HELLACK, B., 2012) 21) Path-integrated measurements of carbon dioxide in the urban canopy layer (BÜNS, C., 2012) 20) Statistical Analysis of Long Term – Air Pollution Data in North Rhine – Westphalia,
Germany (MELKONYAN, A., 2011) 19) Turbulent urban boundary layer transport of carbon dioxide over a park area
(KORDOWSKI, K., 2009) 18) Near–ground CO2 concentrations in two cities with different topographic characteristic (PTAK, D., 2009) 17) Transport of atmospheric pollutants into an urban park - an analysis by optical
remote sensing (ROPERTZ, A., 2008) 16) The economic assessment of the urban climate - the example of Essen (BRANDT, K., 2007) 15) The significance of small urban parks for urban climate - the example of Westpark
in Dortmund (BONGARDT, B., 2006)
14) Analysis of the atmospheric CO2 concentrations in the city of Essen (HENNINGER, S., 2005) 13) Energy balance and cold-air dynamics of an urban ventilation path (WEBER, S., 2004) 12) Condensation and evaporation in the water budget of volcanic mulching layers of Lanzarote (Canary Islands) (GRAF, A., 2004) 11) Analysis of atmospheric trace gases for determination of the air hygiene benefits of an urban park (STRAßBURGER, A., 2004) 10) Evaluation of the pollution climate of a near-urban artificial lake using optical
remote sensing (LAMP, T., 2002) 9) Analysis of longitudinal and climate zone dependency of the urban heat island (WIENERT, U., 2002) 8) Urban-orographic near surface wind systems in the urban vicinity of Cologne (DÜTEMEYER, D., 1999) 7) Analysis of air quality within courtyards (SCHWEGLER, M., 1998) 6) Anthropogenic modification of precipitation in the complex urban area of the Ruhrgebiet (SCHÜTZ, M., 1996) 5) Urban-Ecological investigations in Reykjavík, Iceland (STEINECKE, K., 1995) 4) Bioindicative assessment of potential impacts of selected substances on the basis of cellular modifications in micro organisms (KRÜCKEMEIER, G., 1993) 3) Climate analysis of an industrial town in a valley - the example of Stolberg (Rhld.) (BARLAG, A.-B., 1992) 2) Health impacts of ozone smog situations. A human-ecological and environmental-
epidemiological field study in Düsseldorf 1999 (MÜCKE, H.-G., 1992)
1) Usage and landscape ecological assessment of wind power stations in North-West Germany (GRAUTHOFF, M., 1999)