main steps for a qc survey in diagnostic...
TRANSCRIPT
EVALUATING X-RAY TUBE AND GENERATOR PERFORMANCE :
DEMO for PRACTICAL QUALITY CONTROL (QC)
Dr Slavik Tabakov
Dept. Medical Eng. & Physics, King's College [email protected]
QC in Diagnostic Radiology
PURPOSE : To ensure continuing production of diagnostic images with optimum quality, using minimum necessary dose to the patient.FREQUENCY: QC should include checks and test measurements on all parts of the imaging system at intervals not exceeding one year.UK practice for most common DR equipment:- Radiographic (X-ray tubes) - once per year
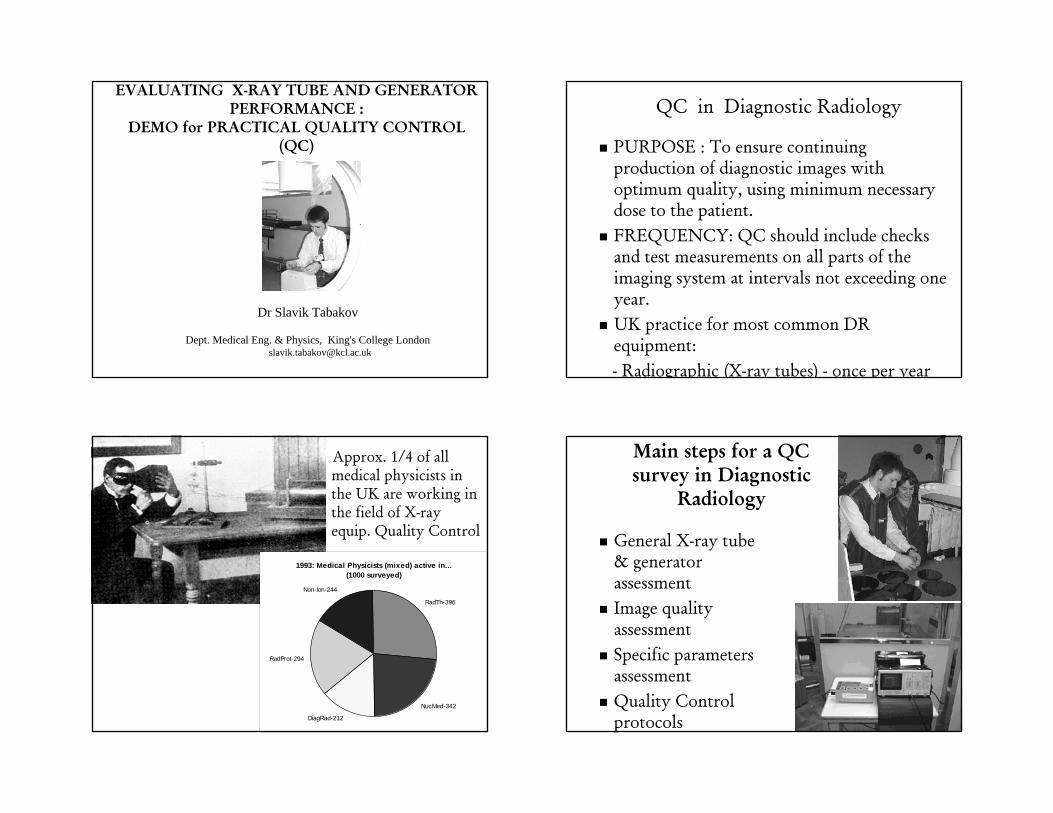
Approx. 1/4 of all medical physicists in the UK are working in the field of X-ray equip. Quality Control
1993: Medical Physicists (mixed) active in...(1000 surveyed)
RadTh-396
NucMed-342
DiagRad-212
RadProt-294
Non-Ion-244
Main steps for a QC survey in Diagnostic
Radiology
General X-ray tube & generator assessmentImage quality assessmentSpecific parameters assessmentQuality Control protocols

QC equipment for Radiography
Dosimeter (ion.ch.)kVp detector (non-invasive)Oscilloscope (with memory)(Timer, mA meters)Aluminium plates (4x1mm+2x0.5mm)Collimator/beam alignment tool (cassette)Focal spot test tool (film in envelope)(Densitometer, Sensitometer)
CALIBRATED !
QC of the X-ray tube/generatorThe X-ray field must be collimated to the smallest reasonable size. All measurements must be performed at the middle of the X-ray field.X-ray tube labelling
X-ray tube and generator main tests
X-ray beam filtration Dose output consistency, kV/mA influencekVp consistency, accuracy, rippleTimer consistency, accuracyX-ray beam/light beam alignmentRadiation leakage of tube housingFocal spot size assessmentAutomatic Exposure System performance
X-ray beam filtration (HVL)
Total X-ray filtration (incl. housing & LBD) is assessed by HVL measurement (Alum.) at known kV (80kVp) Special tables/graphs Filtration=F(HVL)
F + Al attn. Set kV Set mA Set Time Set mAs Meas kV Meas T Meas exp Air kerma % transB+0mm Al 80 200 100 20 110 0.96 100.0B+1mm Al 80 200 100 20 83.5 0.73 74.6B+2mm Al 80 200 100 20 67.1 0.58 59.9B+3mm Al 80 200 100 20 50.9 0.44 45.4

Total X-ray filtration must not be less than:
0.5 mm of Al (or 0.03 mm Mo) for mammography1.5 mm of Al for equipment using voltage up to 70 kVp (most often Dental Radiology)2.0 mm of Al for equipment producing above 70kVp and up to 100 kVp2.5 mm of Al for equipment producing voltages above 100 kVp (most of the Diagnostic Radiology X-ray equipment)LBD filtration Al plates MUST be fixed!
Dose Output/kVp/Time Consistency
Min 4 exposures with identical parameters 100*(st.dev)/(average) for all measurements
Separate calculations for Dose, kVp, TimeIn the case below : Dose consist.=3.2%; kVp consist.=0.6%; Time consist.=0%
Focus Set kV Set mA Set Time Set mAs Meas kV Meas T Meas exp Air kerma(kV) (mA) (ms) (mAs) (kV) (ms) (mR) (mGy)
B 80 200 100 20 82 105 104 0.90B 80 200 100 20 83 105 106 0.92B 80 200 100 20 83 105 106 0.92B 80 200 100 20 83 105 105 0.91
70 kVp, 50 mAs 70 kVp, 80 mAs70 kVp, 25 mAs
mAsinfluence
70 kVp, 50 mAs 81 kVp, 50 mAs60 kVp, 50 mAs
kVpinfluence
Approx. Linear function
Approx. Square function
* Loss of Contrast
kVp accuracy and Spec.Dose = F(kV) Linearity
Min 4 measurements with varia kVp 100*(mean error)/(real value)In the case below kVp accur.=3.4%Specific Dose : Dose/mAs (mGy/mAs) @ ...kVLinearity - graph: X-kV2 Y-(mGy/mAs)
FDD(cm)= 100Focus Set kV Set mA Set Time Set mAs Meas kV Meas T Meas exp Air kerma
(kV) (mA) (ms) (mAs) (kV) (ms) (mR) (mGy)B 60 200 100 20 62 101 59 0.51B 80 200 100 20 83 105 98.5 0.86B 100 200 100 20 104 103 151 1.31B 120 200 100 20 123 103 224 1.95

Linearity Graph
Linear approximationPerform for each focal spot size!In the case (20mAs):
mGy(20mAs) Meas. kV kV2 mGy/mAs0.51 62 3844 0.0260.86 83 6889 0.0431.31 104 10816 0.0661.95 123 15129 0.097
FF
00.050.1
0.15
0 5000 10000 15000Above - exhausted fine focus
Output & kV variation with mA; Timer accuracy
Dose output and kVp vary with the mA 100*st.dev/average for mGy/mAs or kVpIn the case below : O’put var. with
mA=9.5% and kVp var with mA = 4.2%Timer accuracy = -1.6%
Set kV Set mA Set Time Set mAs Meas kV Meas T Meas exp Air kerma Spec.Output(kV) (mA) (ms) (mAs) (kV) (ms) (mR) (mGy) mGy/mAs80 25 100 2.5 83 107 18.4 0.16 0.06480 300 100 30 84.7 105 198 1.72 0.05780 500 100 50 90 103 305 2.65 0.05380 200 20 4 83 19 20.5 0.18 0.04580 200 400 80 83 390 440 3.82 0.04880 200 800 160 83 780 814 7.07 0.044
<< kVp accuracy influence on contrast
kVp ripple influence on resolution
low ripple high ripple
Dose output & kVp waveforms kVp rippleWaveforms -powerful method for analysis of X-ray tube and generator performanceAbnormal (high) ripple blurs the image (often indicates exhausted tube; arcing)kVp ripple of medium frequency generators
Arcing- Often with new tubes, or after long time in store
- Very dangerous for the generator
LBD Alignment
Light beam diaphragm/X-rays alignment (less than 1 cm displacement), perpendicularity
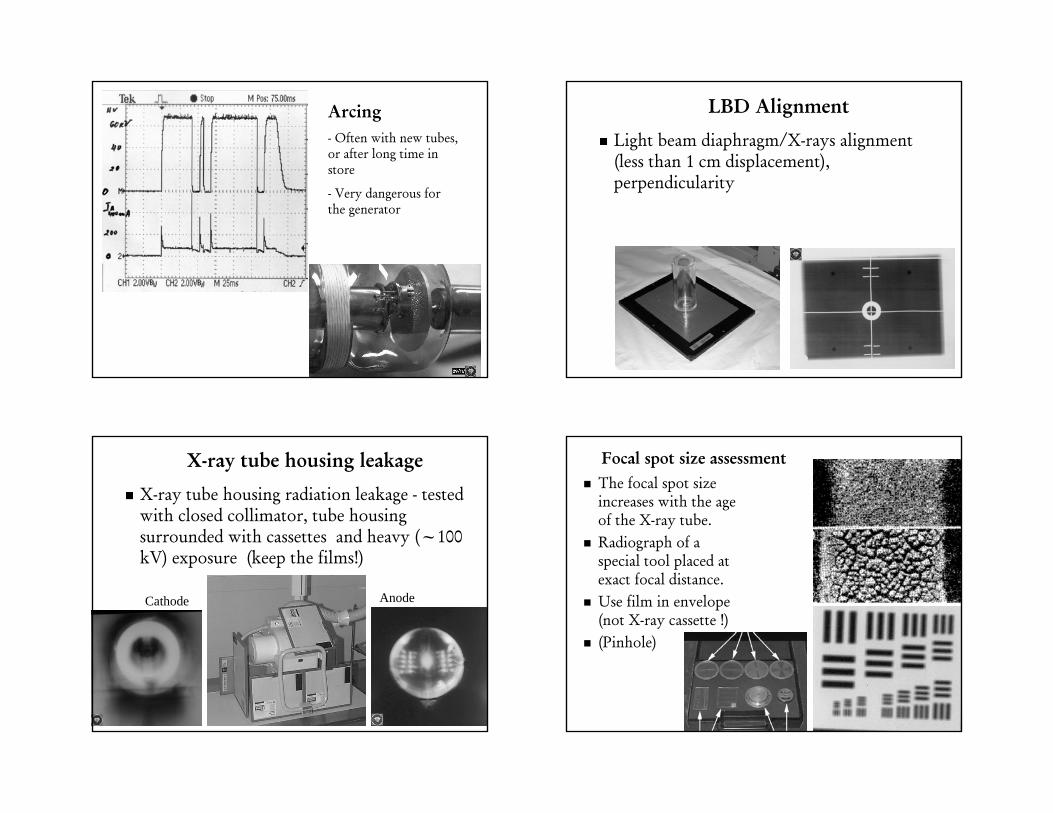
X-ray tube housing leakage
X-ray tube housing radiation leakage - tested with closed collimator, tube housing surrounded with cassettes and heavy (~100 kV) exposure (keep the films!)
Cathode Anode
Focal spot size assessmentThe focal spot size increases with the age of the X-ray tube.Radiograph of a special tool placed at exact focal distance.Use film in envelope (not X-ray cassette !)(Pinhole)

Focus size influence:
Broad focus Fine focus
13602
0
0
−=
MDf πθ
• Star test phantom
D
starimage ddM =
dimage
Automatic Exposure ControlTested with various attenuators for all AEC fieldsMeasured: cassette entrance dose and film optical density (for best results these are very similar)AEC guard timer : Cut-off time (max. dose)
*AEC - field Attenuator Set kV Read ms mAs Optic.Dens Meas exp&dose set (mm Cu) (kV) (ms) (mAs) (D) (mR)
L 1.6 80 7 7 1.55 0.96R 1.6 80 6 7 1.45 0.88C 1.6 80 5 6 1.3 0.76All 1.6 80 6 6 1.5 0.88L 3.2 80 52 52 1.8 1.12R 3.2 80 47 47 1.75 1.02C 3.2 80 40 40 1.7 0.88All 3.2 80 45 45 1.75 0.98
AEC test cassette
•X-tube attenuated with Cu : 1 to3 mm * Dose measure in front of dominants * Min 8 exposures (all dominants, with 2 absorbers) * Densitometricfilm assessment
* density/dose ratioGood AEC performance Poor AEC performance
QC of special X-ray equipment
Dental X-ray equip. scatter rad.chart =>Orthopantomography Mammography X-ray equipmentClassical tomography Capacitor discharge X-ray equipment
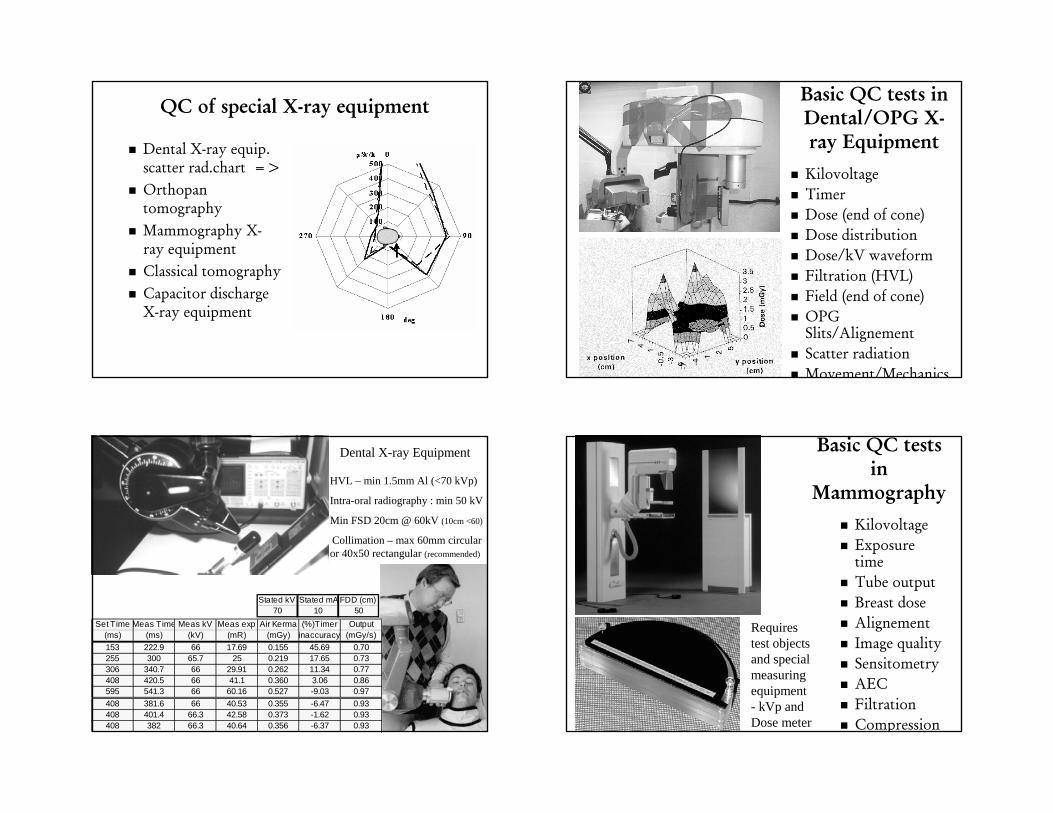
Basic QC tests in Dental/OPG X-ray EquipmentKilovoltageTimer Dose (end of cone)Dose distributionDose/kV waveformFiltration (HVL)Field (end of cone)OPG Slits/AlignementScatter radiationMovement/Mechanics
Dental X-ray Equipment
HVL – min 1.5mm Al (<70 kVp)
Intra-oral radiography : min 50 kV
Min FSD 20cm @ 60kV (10cm <60)
Collimation – max 60mm circular or 40x50 rectangular (recommended)
Set Time Meas Time Meas kV Meas exp Air Kerma (%)Timer Output(ms) (ms) (kV) (mR) (mGy) inaccuracy (mGy/s)153 222.9 66 17.69 0.155 45.69 0.70255 300 65.7 25 0.219 17.65 0.73306 340.7 66 29.91 0.262 11.34 0.77408 420.5 66 41.1 0.360 3.06 0.86595 541.3 66 60.16 0.527 -9.03 0.97408 381.6 66 40.53 0.355 -6.47 0.93408 401.4 66.3 42.58 0.373 -1.62 0.93408 382 66.3 40.64 0.356 -6.37 0.93
Stated kV Stated mA FDD (cm)70 10 50
Basic QC tests in
MammographyKilovoltageExposure timeTube outputBreast doseAlignementImage qualitySensitometryAECFiltrationCompression
Requires test objects and special measuring equipment - kVp and Dose meter

43 CalculatedTarget / Set kV Set mA Set Time Set mAs Meas kV Meas T Air kerma Output @1m
Filter (kV) (mA) (ms) (mAs) (kV) (ms) (mGy) (µGy/mAs)Variation of output with kilovoltage
Mo/Mo 26 100 500 50 26.2 503 9.75 36.06Mo/Mo 28 100 500 50 28.2 503 12.31 45.52Mo/Mo 30 100 500 50 29.9 502 15.15 56.02Mo/Mo 32 100 500 50 31.9 501 18.17 67.19Mo/Rh 28 100 500 50 27.7 503 7.39 27.33Mo/Rh 30 100 500 50 28.9 502 9.28 34.32Mo/Rh 32 100 500 50 30.8 503 11.31 41.82
Focus to chamber distance in cm QC of X-ray film processing
The digital image of CR allows archiving and share of images through PACS.
The hard-copy image of all these devices is still made on film (exposed with Laser Imager).
As in many places the diagnosis is still made from film, the final image quality will still depend on the film and imager….
Computed Radiography – CRMore and more used, but still no unified QC
Other QC testsAcceptance testing of new equipmentService engineer (radiographer)DocumentationCheck all operating modes and accessoriesRadiation safetyElectrical safety Mechanical safety
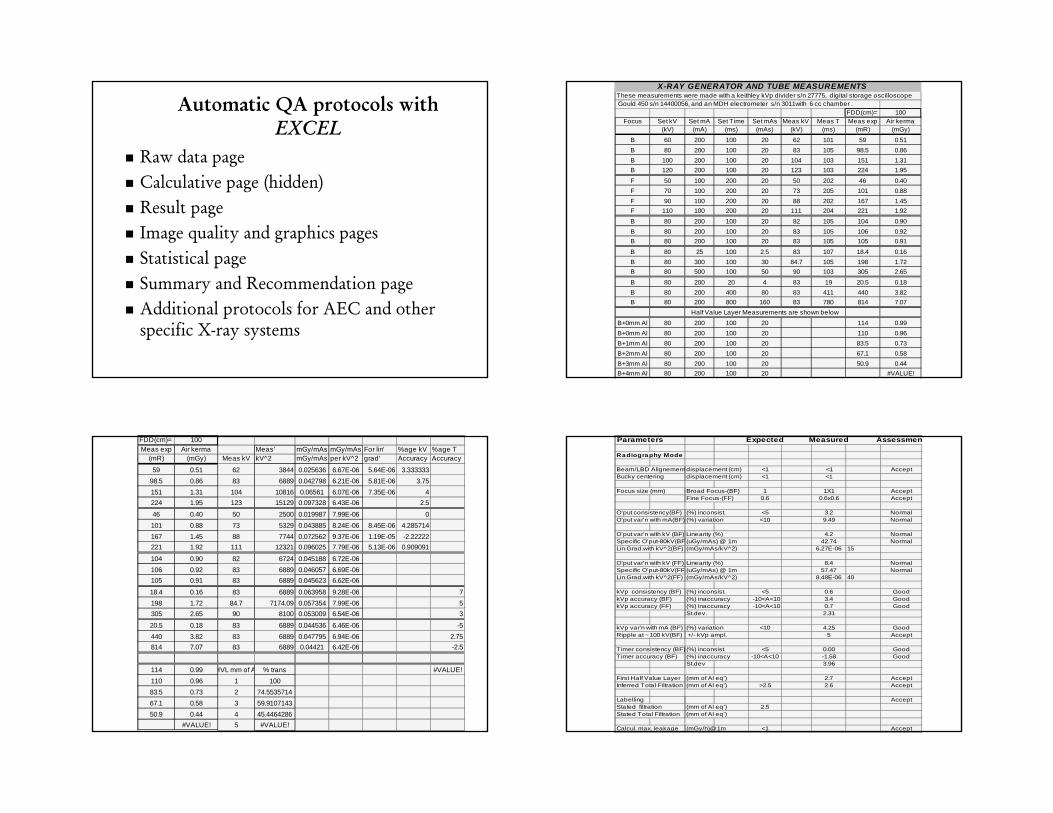
Automatic QA protocols with EXCEL
Raw data pageCalculative page (hidden)Result pageImage quality and graphics pagesStatistical pageSummary and Recommendation pageAdditional protocols for AEC and other specific X-ray systems
X-RAY GENERATOR AND TUBE MEASUREMENTSThese measurements were made with a keithley kVp divider s/n 27775, digital storage oscilloscope Gould 450 s/n 14400056, and an MDH electrometer s/n 3011with 6 cc chamber .
FDD(cm)= 100Focus Set kV Set mA Set Time Set mAs Meas kV Meas T Meas exp Air kerma
(kV) (mA) (ms) (mAs) (kV) (ms) (mR) (mGy)
B 60 200 100 20 62 101 59 0.51B 80 200 100 20 83 105 98.5 0.86B 100 200 100 20 104 103 151 1.31B 120 200 100 20 123 103 224 1.95
F 50 100 200 20 50 202 46 0.40F 70 100 200 20 73 205 101 0.88F 90 100 200 20 88 202 167 1.45F 110 100 200 20 111 204 221 1.92
B 80 200 100 20 82 105 104 0.90B 80 200 100 20 83 105 106 0.92B 80 200 100 20 83 105 105 0.91
B 80 25 100 2.5 83 107 18.4 0.16B 80 300 100 30 84.7 105 198 1.72B 80 500 100 50 90 103 305 2.65
B 80 200 20 4 83 19 20.5 0.18B 80 200 400 80 83 411 440 3.82B 80 200 800 160 83 780 814 7.07
Half Value Layer Measurements are shown below
B+0mm Al 80 200 100 20 114 0.99B+0mm Al 80 200 100 20 110 0.96B+1mm Al 80 200 100 20 83.5 0.73B+2mm Al 80 200 100 20 67.1 0.58B+3mm Al 80 200 100 20 50.9 0.44B+4mm Al 80 200 100 20 #VALUE!
FDD(cm)= 100Meas exp Air kerma Meas' mGy/mAs mGy/mAs For lin' %age kV %age T
(mR) (mGy) Meas kV kV^2 mGy/mAs per kV^2 grad' Accuracy Accuracy
59 0.51 62 3844 0.025636 6.67E-06 5.64E-06 3.33333398.5 0.86 83 6889 0.042798 6.21E-06 5.81E-06 3.75 151 1.31 104 10816 0.06561 6.07E-06 7.35E-06 4224 1.95 123 15129 0.097328 6.43E-06 2.5
46 0.40 50 2500 0.019987 7.99E-06 0101 0.88 73 5329 0.043885 8.24E-06 8.45E-06 4.285714167 1.45 88 7744 0.072562 9.37E-06 1.19E-05 -2.22222221 1.92 111 12321 0.096025 7.79E-06 5.13E-06 0.909091
104 0.90 82 6724 0.045188 6.72E-06106 0.92 83 6889 0.046057 6.69E-06105 0.91 83 6889 0.045623 6.62E-06
18.4 0.16 83 6889 0.063958 9.28E-06 7198 1.72 84.7 7174.09 0.057354 7.99E-06 5305 2.65 90 8100 0.053009 6.54E-06 3
20.5 0.18 83 6889 0.044536 6.46E-06 -5440 3.82 83 6889 0.047795 6.94E-06 2.75814 7.07 83 6889 0.04421 6.42E-06 -2.5
114 0.99 HVL mm of A % trans #VALUE!110 0.96 1 10083.5 0.73 2 74.553571467.1 0.58 3 59.910714350.9 0.44 4 45.4464286
#VALUE! 5 #VALUE!
Parameters Expected Measured Assessmen
Radiography Mode
Beam/LBD Alignement displacement (cm) <1 <1 AcceptBucky centering displacement (cm) <1 <1
Focus size (mm) Broad Focus-(BF) 1 1X1 AcceptFine Focus-(FF) 0.6 0.6x0.6 Accept
O'put consistency(BF) (%) inconsist. <5 3.2 NormalO'put var'n with mA(BF) (%) variation <10 9.49 Normal
O'put var'n with kV (BF) Linearity (%) 4.2 NormalSpecific O'put-80kV(BF (uGy/mAs) @ 1m 42.74 NormalLin.Grad.with kV^2(BF) (mGy/mAs/kV^2) 6.27E-06 15
O'put var'n with kV (FF) Linearity (%) 8.4 NormalSpecific O'put-80kV(FF (uGy/mAs) @ 1m 57.47 NormalLin.Grad.with kV^2(FF) (mGy/mAs/kV^2) 8.48E-06 40
kVp consistency (BF) (%) inconsist. <5 0.6 GoodkVp accuracy (BF) (%) inaccuracy -10<A<10 3.4 GoodkVp accuracy (FF) (%) inaccuracy -10<A<10 0.7 Good
St.dev. 2.31
kVp var'n with mA (BF) (%) variation <10 4.25 GoodRipple at ~100 kV(BF) +/- kVp ampl. 5 Accept
Timer consistency (BF) (%) inconsist. <5 0.00 GoodTimer accuracy (BF) (%) inaccuracy -10<A<10 -1.58 Good
St.dev 3.96
First Half Value Layer (mm of Al eq') 2.7 AcceptInferred Total Filtration (mm of Al eq') >2.5 2.6 Accept
Labelling AcceptStated filtration (mm of Al eq') 2.5Stated Total Filtration (mm of Al eq')
Calcul. max. leakage (mGy/h)@1m <1 Accept

Department of Medical Engineering and Physics
Radiological Protection and Quality Assurance Report
Hospita l/Clinic: Brook Hospital Unit type : Overcouch
Department : X-ray Genera tor/Manuf.: Philips T ype : DR3T/500
Room/Unit: 3b X-T ube / T ype : SRO 25 50 Ser.No. 675449
Date of QA survey: 22/3/93 Reference no.: BXOB3B.033
SUMMARY AND RECOMMENDATIONS
Report compiled by:Dr. S.D.Tabakov
The X-ray generator and tube perform well .However, the X-ray beam is about 1cm displaced from the light beam of LBD in longitudinal direction. We would advise you the bring this to the attention of the service engineer on his next routine visit.
Output -mGy -consistency (BF & FF) Output varia tion- mGy/mAs- with mA X - (%) of inconsiste ncy; Y-fre que ncy X-(%) of va ria tion; Y-frequency kV consistency (BF & FF) kV accuracy (BF & FF)X- (%) of inconsiste ncy; Y-fre que ncy X-(%) of ina ccura cy; Y-fre que ncy T imer -msec- consistency T imer -mse c- accura cyX-(%) of inconsiste ncy; Y-fre que ncy X-(%) of ina ccura cy; Y-fre quency
02468
1012141618
05
10152025303540
0 0 1 1 2 2 3 3 4 4 5 5
05
101520253035404550
0 0 1 1 2 2 3 3 4 4 5 50
5
10
15
20
25
30
0
5
10
15
20
25
30
0 0 1 1 2 2 3 3 4 4 5 50
5
10
15
20
25
30
35
0 2 4 6 8 10 12 14 16
Statistics of QC parameters from 100 different X-ray sets “Normal values”
The QC protocols and all images in the lecture are from the EMERALD vol.1 Training materials - Workbook and
Image Database, based on the experience in King’s College Hospital, London
www.emerald2.net
Effectiveness of Quality Control in RadiographyS Tabakov, M Stoeva
Often Hospital management accepts Quality Control (QC) of X-ray equipment as just a necessity linked to specific Regulations.
This might reflect in a superficial attitude to the QC tests linked mainly to “bureaucratic” collection of QC records.
Our study shows the effect of regular QC tests on the X-ray equipment performance and image quality, based on long term statistics, and compared with a period when no QC tests had been made

QC statistics made on the basis of :
- 63 X-ray generators&tubes (surveyed over 3 years) - from 1992-1995 (no QC have been carried out to these equipment for some 2 years before 1992)
-During the following 5 years 12 of those equipment have continued to be surveyed and analysed
- All equipment had been in use for less than 15 years
- 27 new X-ray generators&tubes have been surveyed and analysed over 3 years (1997-2000)
- All equipment has been surveyed with identical tests (IPEM and Emerald) and all data presented to the X-ray service
- The analysed parameters (statistics with SPSS package) are presented on the slides to follow
Timer accuracy:
almost no reaction, often deteriorates
Timer Accuracy (abs. values) -100*(mean error)/(real value):Year 1 >> Year 2 : P >0.05 (not significant)
Year 1 >> Year 3 : P >0.05 (not significant)
Years 1 >2>3 : P >0.05 (not significant)
The parameter often deteriorates (equipment defects) and perhaps due to this reason the overall reaction (as a group) is not significant. Only some of the observed equipment show slow positive reaction.
kVp Accuracy:
Slow reaction, often deteriorates

kVp Accuracy (abs. values) -100*(mean error)/(real value):Year 1 >> Year 2 : P >0.05 (not significant)
Year 1 >> Year 3 : P >0.05 (not significant)
Years 1 >2>3 : P >0.05 (not significant)
The parameter often deteriorates (equipment defects) and perhaps due to this reason the overall reaction (as a group) is not significant. However observing equipment without defects shows slow positive reaction.
Timer consistency:
reacts slowly, but stabilises with time
Timer Consistency - 100*(st.dev)/(average) :Year 1 >> Year 2 : P >0.05 (not significant)
Year 1 >> Year 3 : P<0.01 (very significant)
Years 1 >2>3 : P <0.05 (significant)
The parameter stabilises after the second QC test -both in terms of mean value (small inconsistency) and in terms of concentration of results (small SD).
kVp Consistency:
reacts quickly and stabilises with time

kVp Consistency - 100*(st.dev)/(average) :Year 1 >> Year 2 : P<0.01 (very significant)
Year 1 >> Year 3 : P<0.01 (very significant)
Years 1 >2>3 : P<0.01 (very significant)
The parameter stabilises after the first QC test - very fast reaction. The consistent results does not exclude absolute error (to be seen with the accuracy tests).
kVp consistency:
in new X-ray equipment (with regular QC) the parameter maintains stable low values.
Output Consistency:
reacts quickly and stabilises with time
Dose Output Consistency - 100*(st.dev)/(average) :Year 1 >> Year 2 : P~0.05 (close to significant)
Year 1 >> Year 3 : P<0.05 (significant)
Years 1 >2>3 : P~0.05 (close to significant)
The parameter improves with time (statistically observed after the second QC test).

Output consistency (as overall parameter):
in new X-ray equipment (with regular QC) maintains stable parameters
Output var with mA:
No visible reaction, often deteriorates
Output variation with mA - 100*(st.dev)/(average) :Year 1 >> Year 2 : P>0.05 (not significant)
Year 1 >> Year 3 : P>0.05 (not significant)
Years 1 >2>3 : P>0.05 (not significant)
The parameter is linked not only to equipment performance but also to stability of the electrical supply. Significant faults observed at mobile equipment (perhaps tested in different rooms). No trend for improvement observed.
Output variation with mA:
in new X-ray equipment does not show reaction of stabilising the parameter

kVp Accuracy:
reacts slowly, but improves with time, often deteriorates
Timer accuracy:
almost no reaction, often deteriorates
Output var with mA:
reacts slowly, but stabilises with time, often deteriorates
kVp Consistency:
reacts quickly and stabilises with time

Timer consistency:
reacts slowly, but stabilises with time
Output Consistency:
reacts very quickly and stabilises with time
Conclusions
Without regular QC all parameters of X-ray systems deteriorate (pre 1991 data)
Regular QC maintains the consistency of X-ray systems parameters within specification
More frequent QC would have a quick positive effect on the improvement of the less stable parameters and therefore - on the overall X-ray equipment performance.
TASK:
High Voltage (HV) Transformer ratio ~ 1:500
Input from main - 200 V
Main cables resistance - 0.2 ohms
*Calculate with how many kV will drop the HV, if
the Exposure is 100 kV and 100 mA (for 0.1 s)
** Calculate the % kV variation with mA and Output variation with mA (using data from sl.13)
***What will be the overall effect on the X-ray image (and patient dose)
*** *How this voltage drop can be compensated?