mainstay international equity fund
TRANSCRIPT

MainStay International Equity Fund
Subadvised by:
TICKERS: A: MSEAX B: MINEX INV: MINNX C: MIECX I: MSIIX Class R1: MIERX Class R2: MIRRX Class R3: MIFRX
NYLIM-29832NYLIM-29832 MSIE31b-07/14MSIE31b-07/141

MainStay International Equity Fund
Subadvised by:
TICKERS: A: MSEAX B: MINEX INV: MINNX C: MIECX I: MSIIX Class R1: MIERX Class R2: MIRRX Class R3: MIFRX
NYLIM-29832NYLIM-29832 MSIE31b-07/14MSIE31b-07/142

Philosophy for Investment Success
There can be no assurance that investment objectives will be met.There can be no assurance that investment objectives will be met.
Cornerstone Capital Management Holdings LLC – International Equity Team
We believe:
We can generate excess returns by investing in companies that have sustainable business models
We focus on:
Long-term holdings in companies with diversified revenue streams that we believe can sustain growth, year after year, regardless of the economic cycle
Companies that we believe can benefit from secular trends that can support long-term revenue and earnings growth
We construct:
Diversified, high-conviction portfolios investing in companies that are attractively valued while seeking long-term growth of capital for investors in volatile market environments
3

Disciplined, High-Conviction Process
Application of a valuation-conscious discipline in identifying sustainable growth opportunities
Long-term secular themes help to buttress growth several years into the future
Flexibility of market cap, geography and industry
Decisions based on conviction, not consensus, of the portfolio management team
Culture
Diversity in thought, background and experience
Environment of healthy debate and discussion
Learning from historical buy and sell decisions to improve decision making process
Commitment
Providing a high-conviction portfolio that we believe has the potential to provide the greatest wealth opportunities to investors
Commitment to shareholder interest as portfolio management team members are also invested in the strategy
There can be no assurance that investment objectives will be met. Sustainable growth companies are those companies that we believe can continue to generate earnings growth regardless of the economic cycle.
There can be no assurance that investment objectives will be met. Sustainable growth companies are those companies that we believe can continue to generate earnings growth regardless of the economic cycle.
We believe we can generate excess returns in relations to the benchmark, by investing in sustainable growth companies that are attractively valued, while seeking an opportunity to provide long-term growth investors with a well-managed, relatively low volatility portfolio.
4
Philosophy for Investment Success

Investment SelectionProcess
Research-Driven Investment ProcessWe only invest in stocks that meet our strict criteria and pass our disciplined review process
Universe of Stocks
Three Decision-Makers
Securities added to the portfolio must be approved by three members of the investment team:•Lead Portfolio Manager•Regional/Country Portfolio Manager•Sector Analyst
Valuation
Reasonably priced relative to long term earnings potential
Portfolio Inclusion
All three decision-makers
agree on the idea
Watch List
All three agreeon all factors
except valuation
Rejected
At least one decision-maker rejects the idea
10% earnings growth potential in each of the next three to five years
Sustainable competitive advantages
Secular growth trends or forces that can benefit
the company
Lack of reliance on one product, customer or
supplier
5
DecisionProcess
Action
Candidates Must Meet All Four Criteria
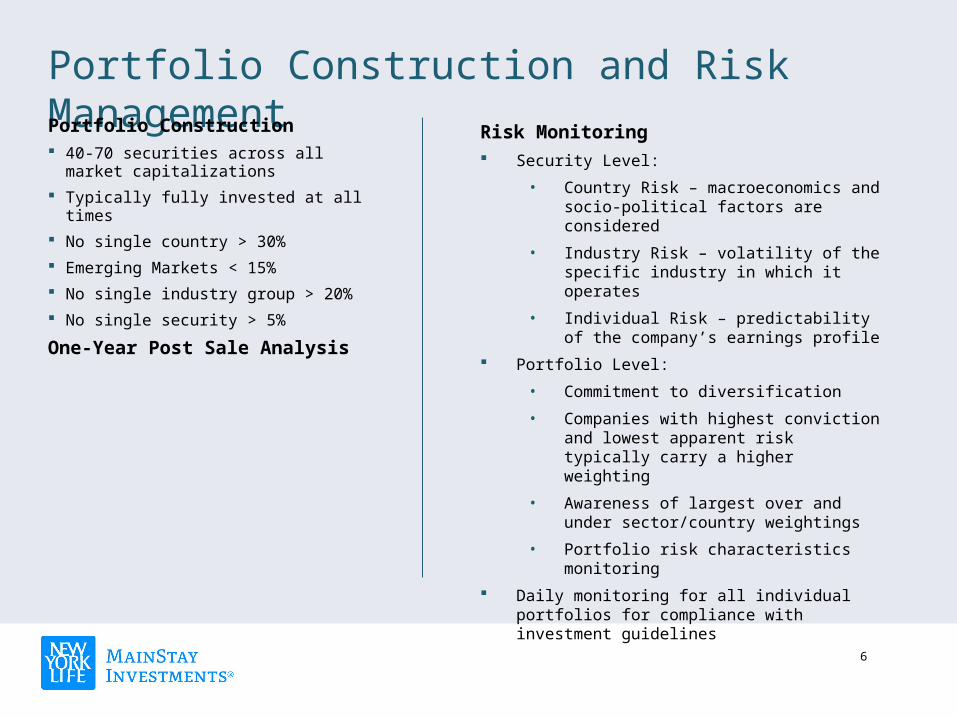
Portfolio Construction and Risk ManagementPortfolio Construction 40-70 securities across all market
capitalizations
Typically fully invested at all times
No single country > 30%
Emerging Markets < 15%
No single industry group > 20%
No single security > 5%
One-Year Post Sale Analysis
Risk Monitoring Security Level:
• Country Risk – macroeconomics and socio-political factors are considered
• Industry Risk – volatility of the specific industry in which it operates
• Individual Risk – predictability of the company’s earnings profile
Portfolio Level:
• Commitment to diversification
• Companies with highest conviction and lowest apparent risk typically carry a higher weighting
• Awareness of largest over and under sector/country weightings
• Portfolio risk characteristics monitoring
Daily monitoring for all individual portfolios for compliance with investment guidelines
6

Sell Discipline
Investments Are Trimmed or Sold When:
Investment thesis has been reassessed or has been changed
Valuation becomes too expensive Portfolio manager/analyst loses confidence in the
investment
Evaluating Sell Decisions Track performance of all investments sold Reassess sell decisions to further understand the
company and our decision Validates our investment philosophy and process
We realize that buying a stock at the right price is only part of the equation. Equally as important is a sell discipline that adds value.
We hope to learn from our buy and sell decisions to ensure better investing going forward.
7

International Equity Investment Team
Name
Current Region/Sector
Responsibilities
Years of Investment Experience
Eddie Ramos, CFA Lead Portfolio Manager
22
Eve Glatt Portfolio Manager
Asia North America Middle East/Africa Consumer Discretionary Utilities
17
Carlos Garcia-Tunon, CFA Portfolio Manager
Europe Latin America Consumer Staples Materials
15
Maurice Onyuka Senior Analyst
Health Care Energy
22
Ian Murdoch, CFA Senior Analyst
North America IT Software & Services Industrials
14
Lawrence Rosenberg, CFA Senior Analyst
Financials Commercial &
Professional Services
16
Anthony B. Sneag Senior Analyst
Information Technology Telecommunications
9
8

MainStay International Equity Fund (as of 6/30/14)
Source: FactSet 6/30/14The holdings are as of June 30, 2014 and are not indicative of future holdings. This information has been provided for informational purposes only and may change daily.
Top Ten Holdings
Security Percent of Fund
1. Shire PLC 4.6% 2. Grifols SA 4.4 3. Svenska Handelsbanken AB 4.0 4. SABMiller PLC 3.5 5. Linde AG 3.4 6. Syngenta AG 3.4 7. Fresenius Medical Care AG & Co KGaA 3.3 8. Standard Chartered PLC 3.2 9. Technip SA 3.2 10. Aggreko PLC 3.2
Top Ten Countries
Security Percent of Fund
1. United Kingdom 24.7% 2. Germany 16.0 3. France 7.6 4. Ireland 7.5 5. Spain 5.5 6. Switzerland 4.6 7. Sweden 4.1 8. Denmark 3.9 9. United States of America 3.0 10. Japan 3.0
26%
13%
17%
9% 9%6%
0%
4%
13%
8% 7%
11%8%
11%
4%
10%
5%
10%
26%
0%
10%
20%
30%MainStay International Equity Fund MSCI ACWI Ex US
Sector Breakdown – Fund vs. MSCI ACWI Ex US
9

Annualized as of June 30, 2014Class A Shares at NAV
Performance Period
MainStay International Equity Fund
MSCI ACWI ex-US
QTD 4.67% 5.03%
YTD 5.91% 5.56%
1 Year 19.45% 21.75%
3 Years 6.83% 5.73%
5 Years 7.93% 11.11%
10 Years 6.27% 7.75%
10
MainStay International Equity Fund Performance
Performance data quoted represents past performance. Past performance is no guarantee of future results. Due to market volatility, current performance may be less or higher than the figures shown. Investment return and principal value will fluctuate so that upon redemption, shares may be worth more or less than their original cost. Performance figures for Class B, C, and Investor Class shares reflect a voluntary fee waiver and/or expense limitation, which may be discontinued at any time without notice, and without which total returns may have been lower. For performance information current to the most recent month-end, please visit our web site at mainstayinvestments.com. Total annual operating expenses are: Class A: 1.39%.

MainStay International Equity Fund SEC Average Annual Total Returns
Annualized as of June 30, 2014Class A Shares w/ Sales Charges
These results include the maximum initial sales charge for Class A shares of 5.5% and show the percentage change for each of the required periods with capital gain and dividend distributions reinvested. Total return since inception is quoted for Funds with less than ten years of operating history. Performance for Class A shares first offered 1/3/95 includes the historical performance for Class B shares from inception 9/13/94 through 12/31/94, adjusted to reflect the applicable sales charge or (CDSC) and fees and expenses for such share class.
Performance data quoted represents past performance. Past performance is no guarantee of future results. Due to market volatility, current performance may be less or higher than the figures shown. Investment return and principal value will fluctuate so that upon redemption, shares may be worth more or less than their original cost. Performance figures for Class B, C, and Investor Class shares reflect a voluntary fee waiver and/or expense limitation, which may be discontinued at any time without notice, and without which total returns may have been lower. For performance information current to the most recent month-end, please visit our web site at mainstayinvestments.com. Total annual operating expenses are: Class A: 1.39%.
Performance Period
MainStay International Equity Fund
1 Year 12.88%
3 Years 4.83%
5 Years 6.71%
10 Years 5.68%
Since Inception (1/ 3/ 95) 5.16%
11

MainStay International Equity Fund SEC Average Annual Total Returns
Annualized as of June 30, 2014Class I Shares
Class I shares are generally available only to corporate and institutional investors.
Performance data quoted represents past performance. Past performance is no guarantee of future results. Due to market volatility, current performance may be less or higher than the figures shown. Investment return and principal value will fluctuate so that upon redemption, shares may be worth more or less than their original cost. Performance figures for Class B, C, and Investor Class shares reflect a voluntary fee waiver and/or expense limitation, which may be discontinued at any time without notice, and without which total returns may have been lower. For performance information current to the most recent month-end, please visit our web site at mainstayinvestments.com. Total annual operating expenses are: Class I: 1.13%.
Performance Period
MainStay International Equity Fund
1 Year 19.73%
3 Years 7.11%
5 Years 8.20%
10 Years 6.67%
Since Inception (1/ 2/ 04) 5.75%
12
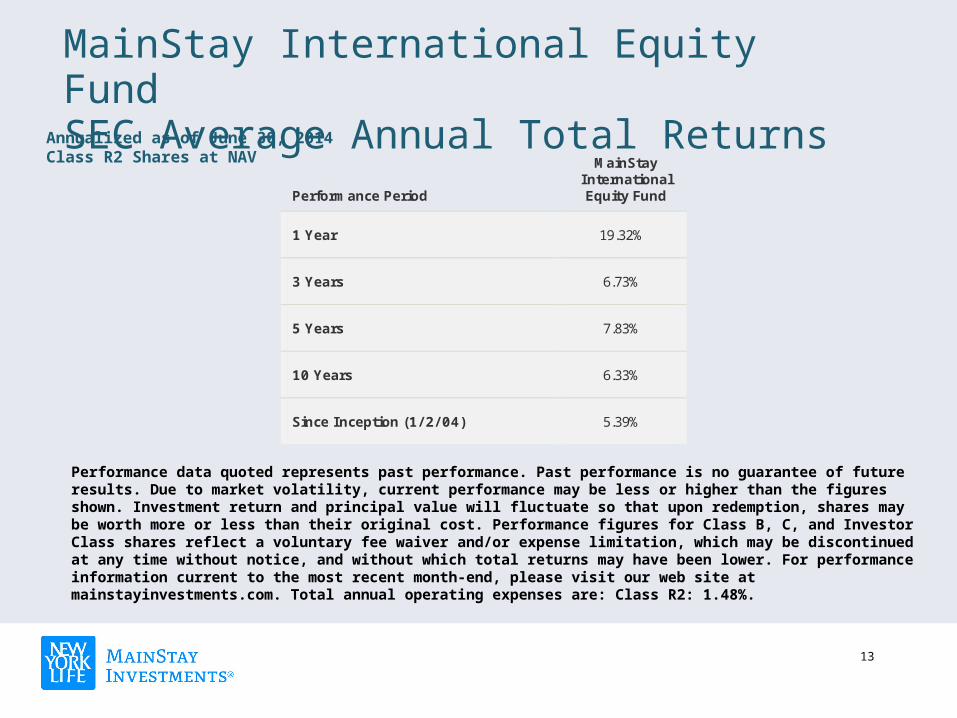
MainStay International Equity Fund SEC Average Annual Total Returns
Annualized as of June 30, 2014Class R2 Shares at NAV
Performance data quoted represents past performance. Past performance is no guarantee of future results. Due to market volatility, current performance may be less or higher than the figures shown. Investment return and principal value will fluctuate so that upon redemption, shares may be worth more or less than their original cost. Performance figures for Class B, C, and Investor Class shares reflect a voluntary fee waiver and/or expense limitation, which may be discontinued at any time without notice, and without which total returns may have been lower. For performance information current to the most recent month-end, please visit our web site at mainstayinvestments.com. Total annual operating expenses are: Class R2: 1.48%.
Performance Period
MainStay International Equity Fund
1 Year 19.32%
3 Years 6.73%
5 Years 7.83%
10 Years 6.33%
Since Inception (1/ 2/ 04) 5.39%
13

Disclosures
About Risk
Foreign securities can be subject to greater risks than U.S. investments, including currency fluctuations, less liquid trading markets, greater price volatility, political and economic instability, less publicly available information, and changes in tax or currency laws or currency laws or monetary policy. These risks are likely to be greater for emerging markets than in developed markets.
Growth stocks may be more volatile than other stocks because they are generally more sensitive to investor perceptions and market moves. During periods of growth stock underperformance, the Fund’s performance may suffer.
14

The MSCI ACWI® (All Country World Index) Ex U.S. is a free float-adjusted market capitalization weighted index that is designed to measure the equity market performance of developed and emerging markets excluding the USA.
Results assume the reinvestment of all capital gain and dividend distributions. An investment cannot be made directly into an index.
Lipper International Multi-Cap Core are funds that, by portfolio practice, invest in a variety of market capitalizationranges without concentrating 75% of their assets in any one market capitalization range over an extended period oftime. Multi-cap funds typically have 25% to 75% of their assets invested in companies strictly outside of the U.S. with market capitalizations (on a three-year weighted basis) greater than the 250th largest company in the S&P/Citigroup World ex-U.S. Broad Market Index. Multi-cap growth funds typically have an above-average price-to-cash flow ratio, price-to-book ratio, and three-year sales-per-share growth value, compared to the S&P/Citigroup World ex-U.S. BMI.11
Morningstar Foreign Large Growth portfolios seek capital appreciation by investing in large international stocks that are growth-oriented. Large-cap foreign stocks have market capitalizations greater than 5 billion. Growth is defined based on high price/book and price/cash-flow ratios, relative to the MSCI EAFE Index. These funds typically will have less than 20% of assets invested in U.S. stocks.
Index Definitions
15

16
To learn more about MainStay Funds®, call 800-MAINSTAY (624-6782) for a prospectus or summary prospectus. Investors are asked to consider the investment objectives, risks, and charges and expenses of the investment carefully before investing. The prospectus or summary prospectus contains this and other information about the investment company. Please read the prospectus or summary prospectus carefully before investing.
mainstayinvestments.com
Cornerstone Capital Management LLC is an affiliate of Cornerstone Capital Management Holdings LLC, a wholly owned subsidiary of New York Life Investment Management Holdings LLC.
MainStay Investments® is a registered service mark and name under which New York Life Investment Management LLC does business. MainStay Investments, an indirect subsidiary of New York Life Insurance Company, New York, NY 10010, provides investment advisory products and services. New York Life Investments engages the services of Cornerstone Capital Management Holdings LLC, a wholly owned subsidiary of New York Life Investment Management Holdings LLC. The MainStay Funds® are managed by New York Life Investment Management LLC and distributed through NYLIFE Distributors LLC, 169 Lackawanna Avenue, Parsippany, NJ 07054, a wholly owned subsidiary of New York Life Insurance Company. NYLIFE Distributors LLC is a Member FINRA/SIPC.
For More Information
16