major trends in urbanization and urban environment · global urbanization since early 1900 has been...
TRANSCRIPT

Major trends in urbanization and urban environment
Shobhakar Dhakal

Global urbanization since early 1900 has been unprecedented and Asia is the front runner
• World urban population: 3.2 billion (49% of world population of 6.5 billion in 2005, will be 50% by 2008?)
• Asia hosts largest world urban population (Asia 1.6 billion, Europe 0.5, Africa 0.3, North America 0.3, Latin America, Caribbean and Oceania 0.4 ‐ in 2005)
• China, India, USA have largest urban population in 2005 as countries
• Cities and Asia (2005): – 11 out of 20 mega‐cities (over 10 million)– 17 out of 30 cities of 5‐10 million– 184 out of 364 cities of 1‐5 million– 225 out of 455 cities of 0.5‐1 million
Source: United Nations, Department of Economic and Social Affairs, Population Division (2006). World Urbanization Prospects:The 2005 Revision. Working Paper No. ESA/P/WP/200.
Asian cities are facing severe challenges already
• High density settlements demand better planning and management which have proved challenging
• Congestion: Bangkok looses 6% of its GDP due to congestion
• Air pollution: Most of the Asian cities have PM10 levels higher than WHO/USEPA guideline value
• Solid waste: Generation rates are increasing with rising income; management and disposal are becoming serious concerns
• Waste water: Volume is getting bigger and bigger
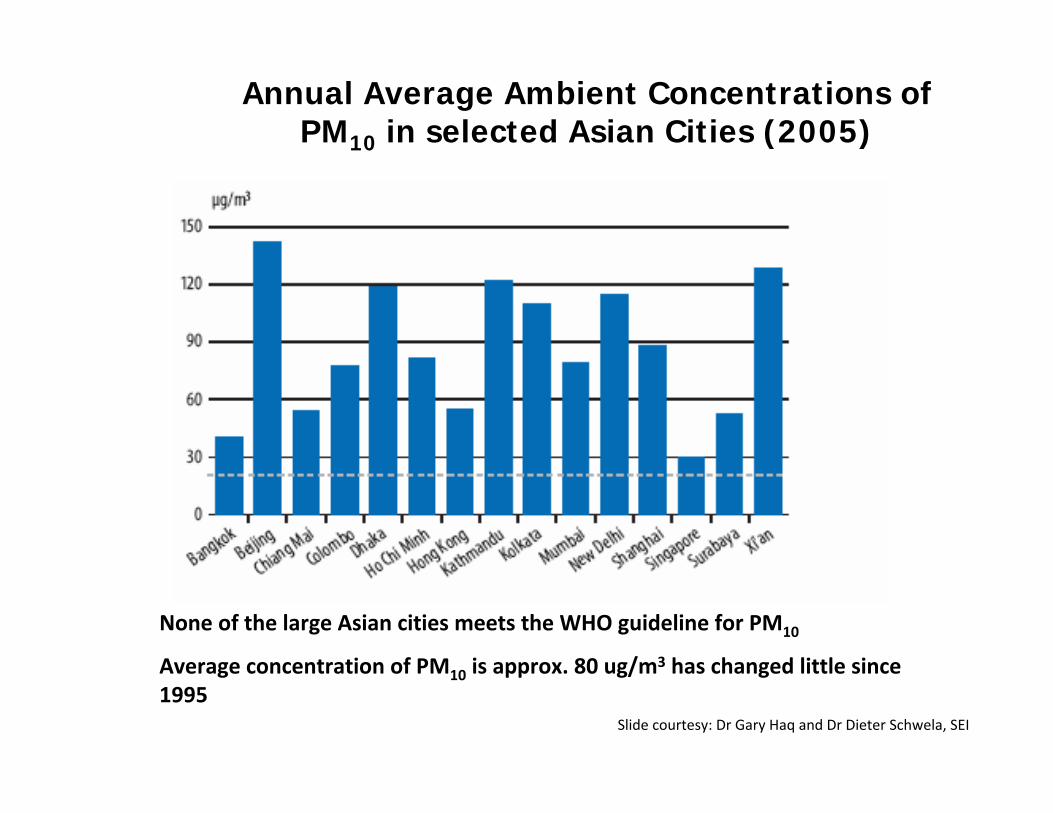
Annual Average Ambient Concentrations of PM10 in selected Asian Cities (2005)
None of the large Asian cities meets the WHO guideline for PM10
Average concentration of PM10 is approx. 80 ug/m3 has changed little since 1995
Slide courtesy: Dr Gary Haq and Dr Dieter Schwela, SEI
What went wrong‐ in general?
• Gross failure of urban planning
• Urban growth without enough time, resources, institutions, and capacity to put infrastructure and system at place – Too much pressure from motorization at early stage of economic development
• Lack of serious political will/commitment and poor institutional arrangements
• More than policy/plan‐ implementation failure

Further urbanization forces us to think innovatively
• Urban population will grow twice as faster as compared to total population growth (1.78% vs. 0.95%‐ annual rate for 2005‐2030 projected) resulting 4.9 billion (about 60% of total population) by 2030 (out of 8.2 billion)
• Almost all global population increase come from urban population in developing world
• 1.8 billion urban population will be added in 2005‐2030 out of which 1.1 billion will be added in Asia alone
UN, 2005 update

A new issue- climate change has emerged which cities can no longer ignore
Perce
ntage
of G
lobal
Annu
al Em
ission
s
KyotoReference Year
FCCC
KyotoProtocolAdopted
KyotoProtocolEnter intoForce
Current
J. Gregg and G. Marland, 2008, personal communication
62%57%
49.7%
47%38%
43%50.3%
53%
•Annex B countries growing slowly•Non-Annex countries growing rapidly
Largely China and India•China largest emitter: passed USA in 2006•India to soon overtake Russia to become third
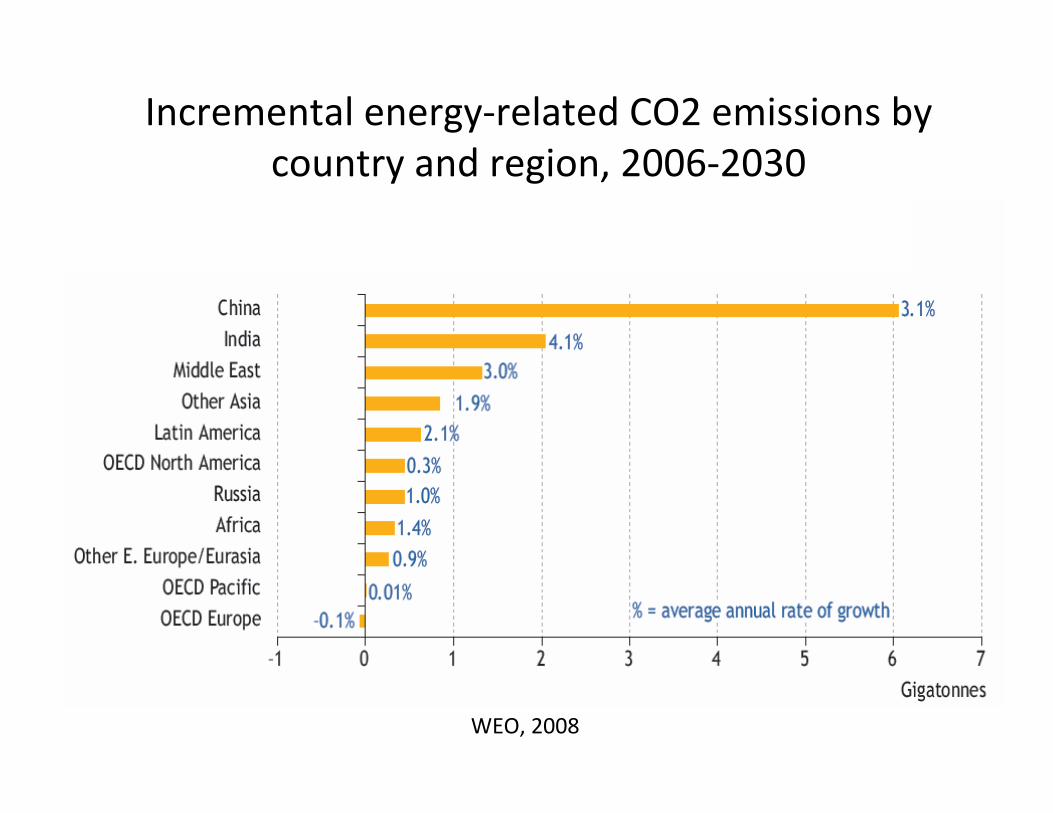
Incremental energy‐related CO2 emissions by country and region, 2006‐2030
WEO, 2008
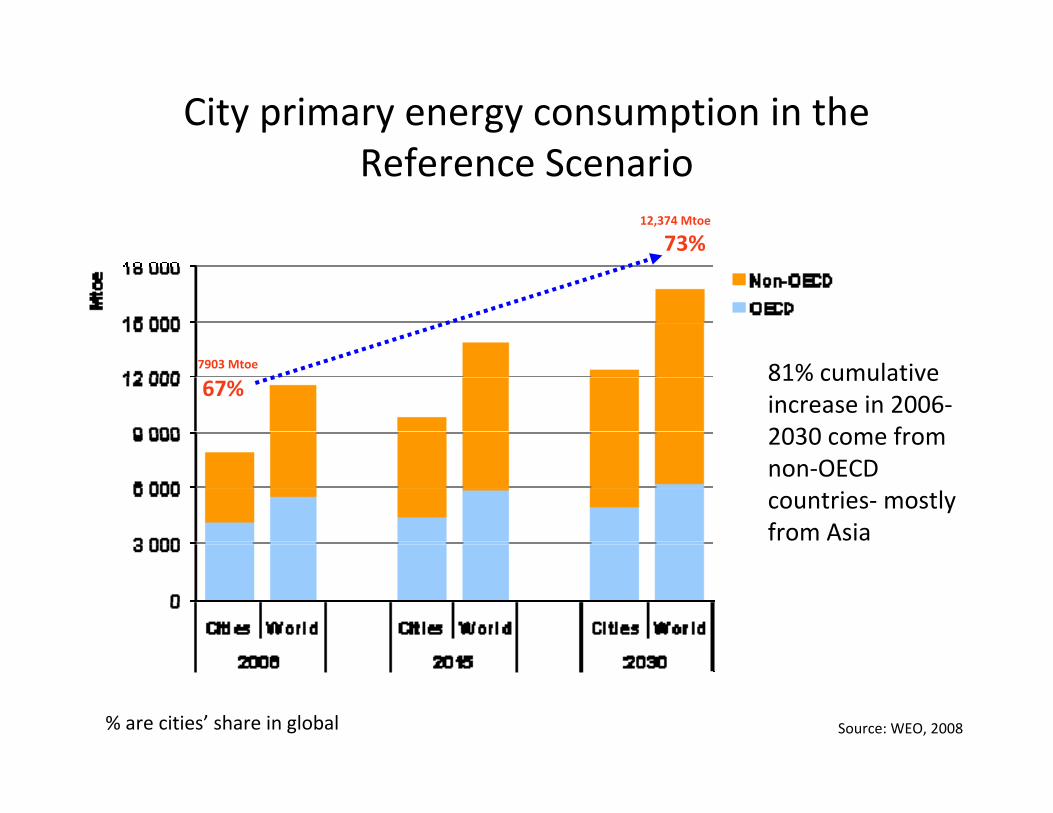
City primary energy consumption in the Reference Scenario
Source: WEO, 2008
67%
73%
7903 Mtoe
12,374 Mtoe
% are cities’ share in global
81% cumulative increase in 2006‐2030 come from non‐OECD countries‐mostly from Asia
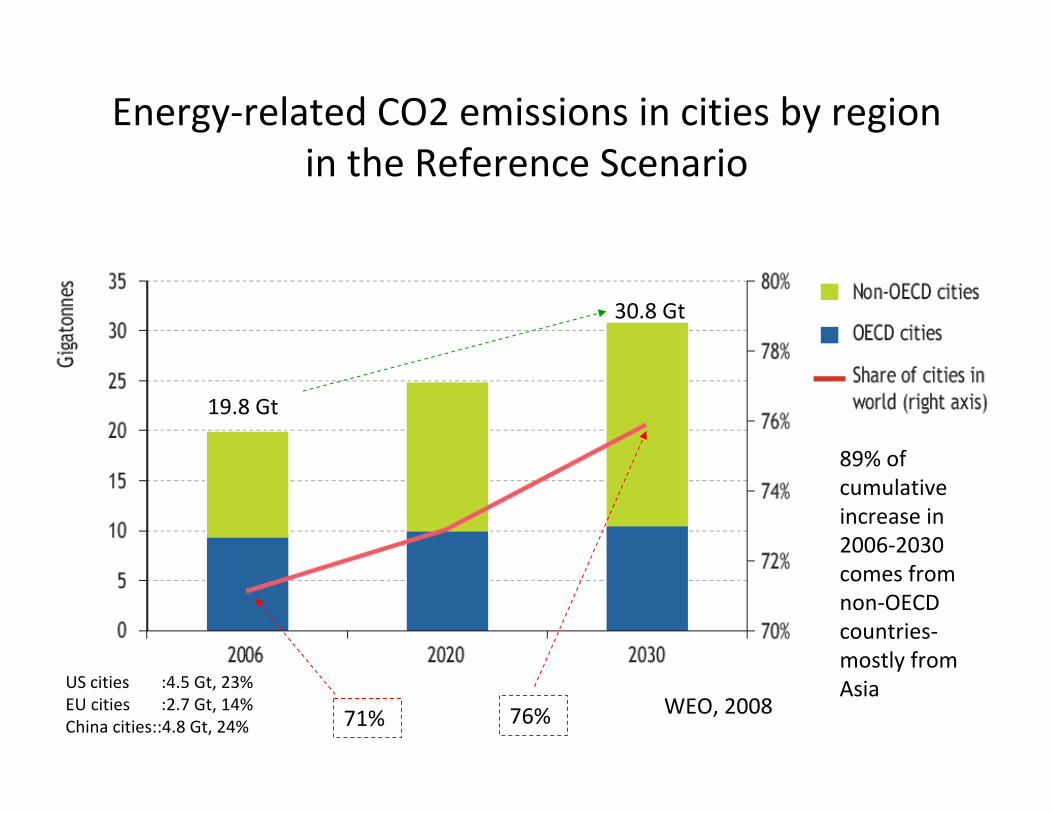
Energy‐related CO2 emissions in cities by region in the Reference Scenario
71% 76%
US cities :4.5 Gt, 23%EU cities :2.7 Gt, 14%China cities::4.8 Gt, 24%
19.8 Gt
30.8 Gt
WEO, 2008
89% of cumulative increase in 2006‐2030 comes from non‐OECD countries‐mostly from Asia
Urban’s contribution to energy related CO2 emissions of China
• Large volume: 4.8 Gt in 2006– More than whole of Europe (4.06 Gt)
• Global importance: 24% of global urban CO2 emission from energy use
• Local importance: 85% of total energy related CO2 emissions of China
• Dominated by key largest cities: 35 key cities account for 18% of China population but consume 40% energy and emit 41% of China’s energy related CO2 emissions
Source: Dhakal, 2008; WEO 2008

Xiamen
Urumqi
Nanjing
Guiyang
Chongquin
Fuzhou
Taiyuan
Xining
Ningbo
Shanghai
Hohhot
Xian
Guangzhou
Beijing
Yinchuan
China
0
40,000
80,000
120,000
160,000
200,000
240,000
280,000
0 3,000 6,000 9,000 12,000
Per Capita Gross Regional Product in US$
Per C
apita
Ene
rgy
Cons
umpt
ion
in M
J Pe
r Per
son
Varying energy‐economy pathways within China’s cities
Source: Dhakal (2008)
High energy pathway: Largely on middle and western China with energy intensive industries and climatically cooler
Low energy pathway: Cities in eastern part of the country with strong presence of service industries, close to coast and warmer climate
List of 35 most important cities that are mentioned in national plan: Beijing, Tianjin, Shijiazhuang, Taiyuan, Hohhot, Shenyang, Dalian, Changchun, Harbin, Shanghai, Nanjing, Hangzhou, Ningbo, Hefei, Fuzhou, Xiamen, Nanchang, Jinan, Qingdao, Zhengzhou, Wuhan, Changsha, Guangzhou, Shenzhen, Nanning, Haikou, Chongqing, Chengdu, Guiyang, Kunming, Xi'an, Lanzhou, Xining, Yinchuan, and Urumqi.
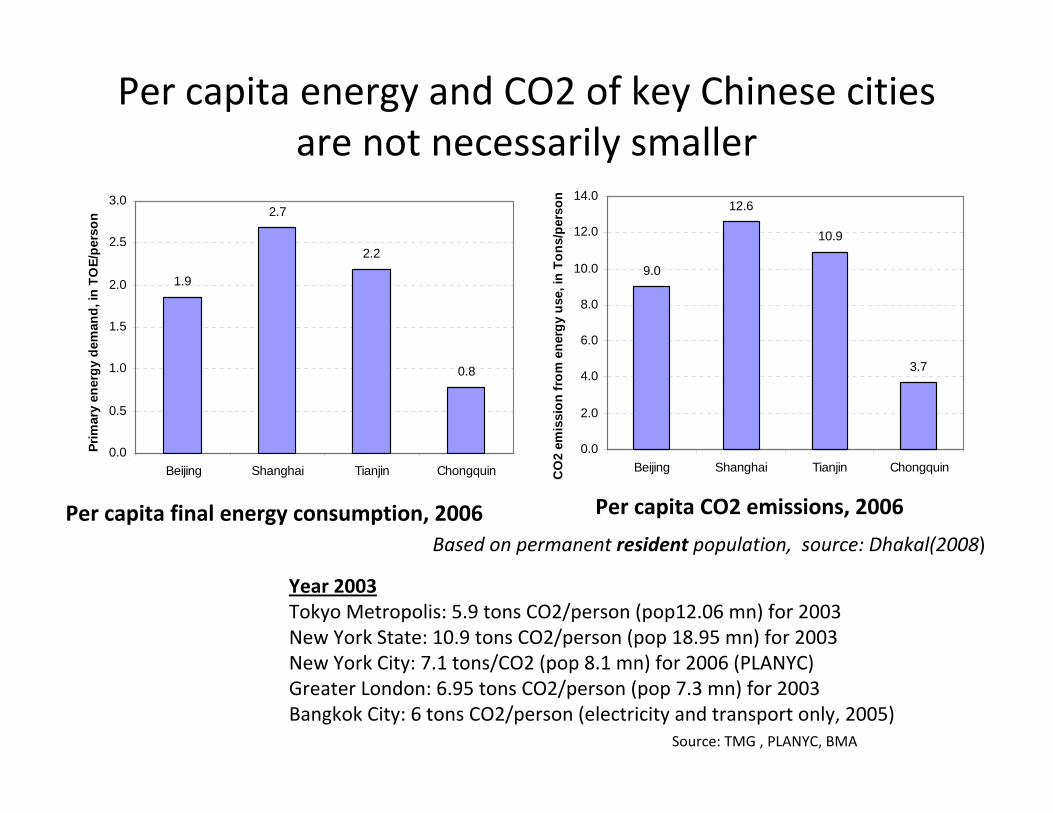
Per capita energy and CO2 of key Chinese cities are not necessarily smaller
Per capita final energy consumption, 2006 Per capita CO2 emissions, 2006
Based on permanent resident population, source: Dhakal(2008)
1.9
2.7
2.2
0.8
0.0
0.5
1.0
1.5
2.0
2.5
3.0
Beijing Shanghai Tianjin Chongquin
Prim
ary
ener
gy d
eman
d, in
TO
E/pe
rson
9.0
12.6
10.9
3.7
0.0
2.0
4.0
6.0
8.0
10.0
12.0
14.0
Beijing Shanghai Tianjin ChongquinCO
2 em
issi
on fr
om e
nerg
y us
e, in
Ton
s/pe
rson
Year 2003Tokyo Metropolis: 5.9 tons CO2/person (pop12.06 mn) for 2003New York State: 10.9 tons CO2/person (pop 18.95 mn) for 2003New York City: 7.1 tons/CO2 (pop 8.1 mn) for 2006 (PLANYC)Greater London: 6.95 tons CO2/person (pop 7.3 mn) for 2003Bangkok City: 6 tons CO2/person (electricity and transport only, 2005)
Source: TMG , PLANYC, BMA
Therefore…….
• Asia is/will be leader in unprecedented global urbanization• Local impacts are/will be serious: urban environmental
impacts‐ air, water, waste• Global impacts are/will be tremendous: Asia’s (urban)
energy use and carbon trajectories are of serious concern globally
• It forces us to think new way to address the problem:– How to address telescopic compression of a range of urban
environmental problem in Asia which the West experienced in some kind of stages?
– Cities have started to act for global concerns– How to streamline energy and carbon mitigation concerns into
the urban development activities?

Strategic needs• Tackling “urban” in integrated and holistically in opposed to
fragmented pieces here are there
• Demand dampening‐ energy, material
• Better infrastructure supply‐ without rebound effects
• Providing incentives for actions that entail co‐benefits (to global and local concerns)
• Better institutional arrangements (within and across) with focuson “implementation” of policies
• Creating committed and accountable political champions

• Thank you
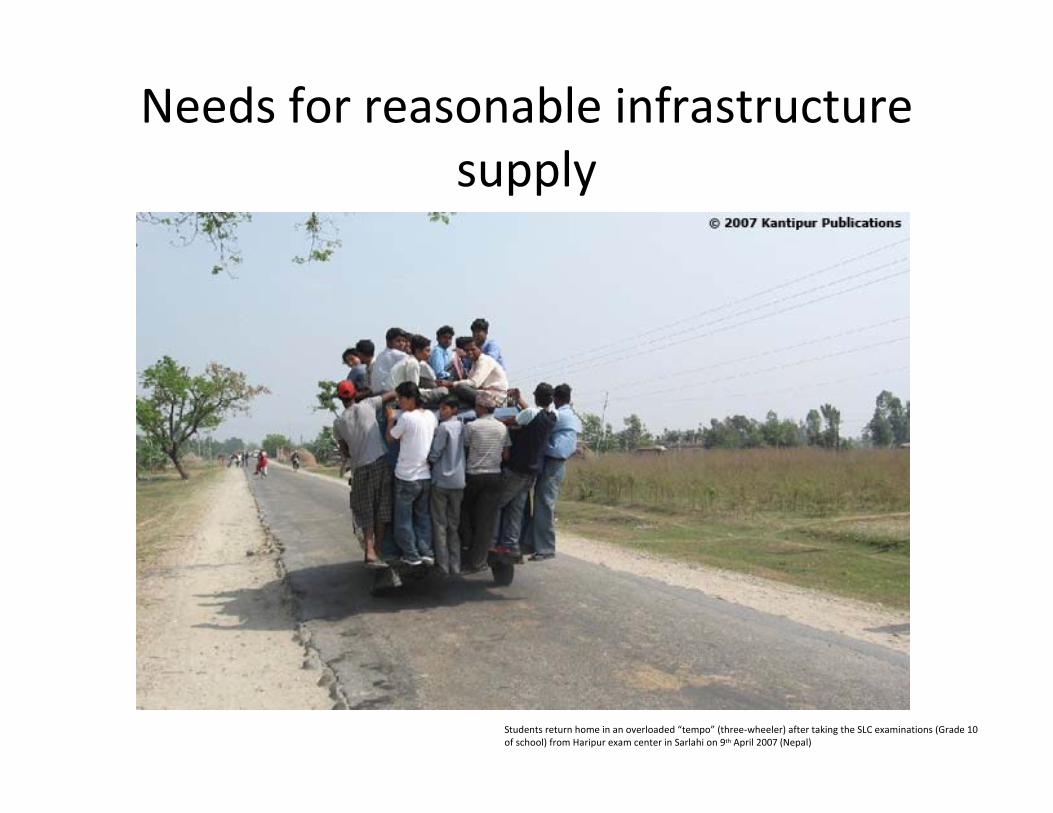
Needs for reasonable infrastructure supply
Students return home in an overloaded “tempo” (three‐wheeler) after taking the SLC examinations (Grade 10 of school) from Haripur exam center in Sarlahi on 9th April 2007 (Nepal)

Needs for demand management
Beijing © Shobhakar Dhakal
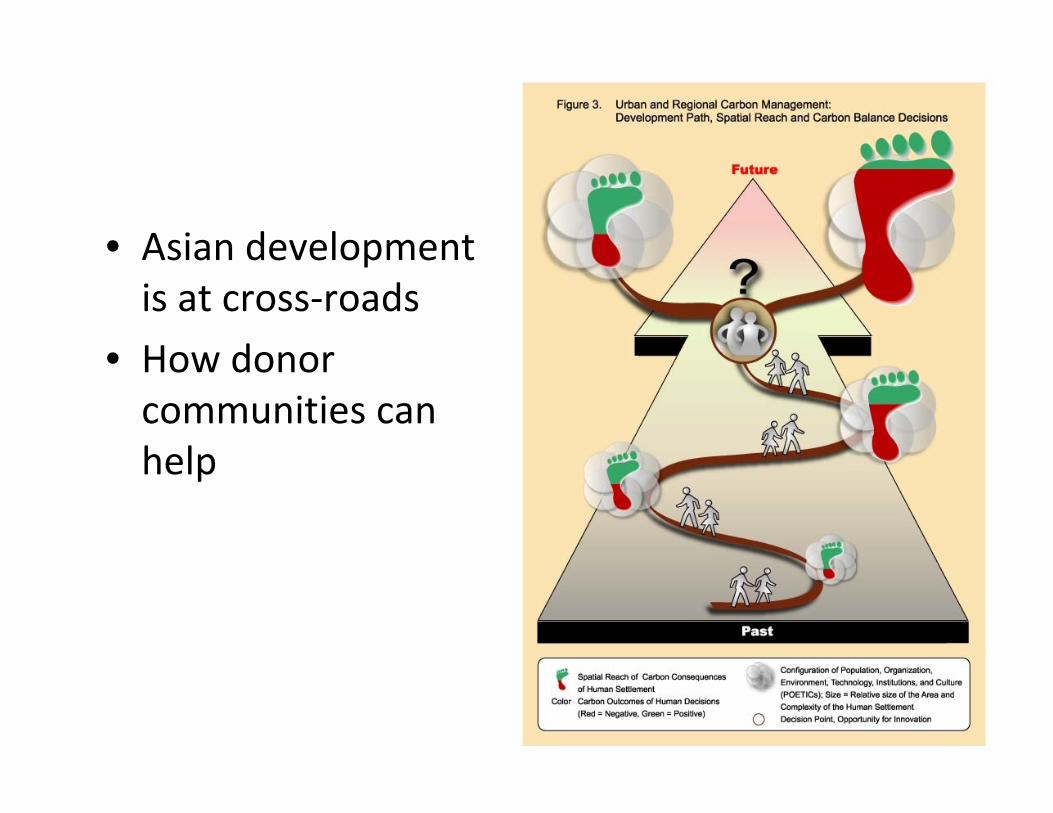
• Asian development is at cross‐roads
• How donor communities can help
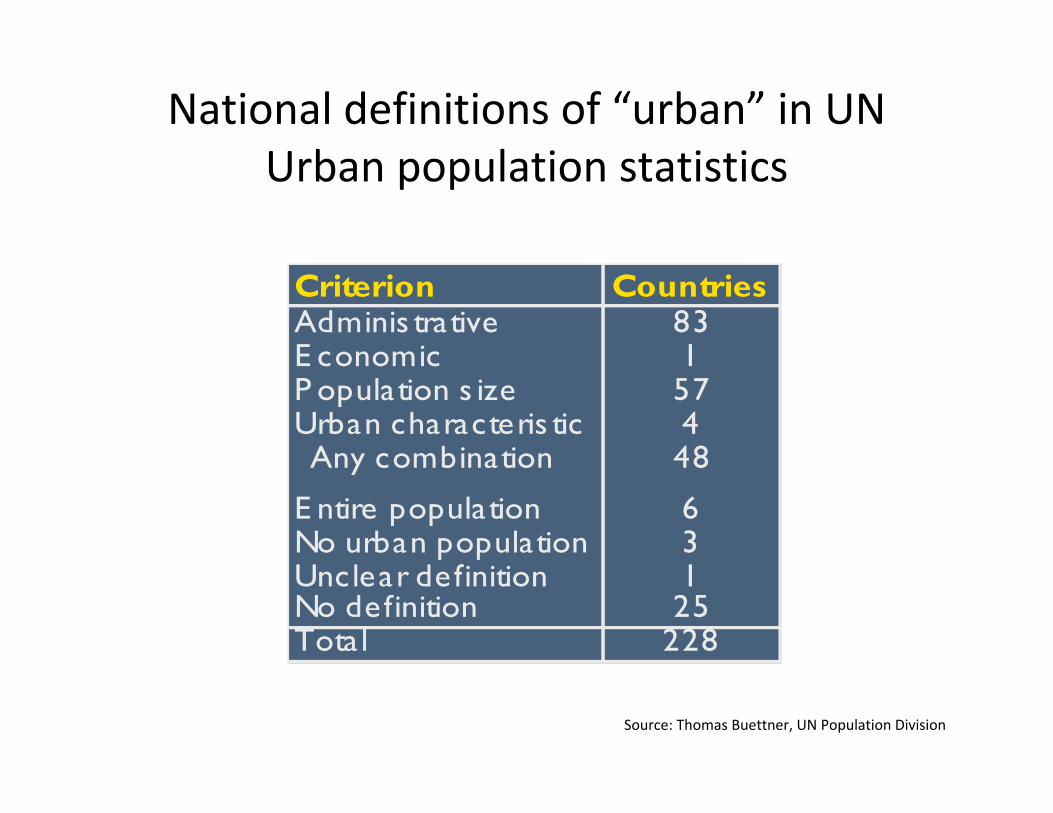
National definitions of “urban” in UN Urban population statistics
Criterion CountriesAdminis trative 83E conomic 1P opulation s ize 57Urban characteris tic 4Any combination 48
E ntire population 6No urban population 3Unclear definition 1No definition 25Tota l 228
Source: Thomas Buettner, UN Population Division

Regional Emission Pathways (1980-2005)
C emissions
Population
C Intensity
Developed Countries (-)
Developing Countries Least Developed Countries
Wealth per capita
Raupach et al 2007, PNAS

World primary energy use
2006 (Mtoe)Total: 11,547
OECD : 5,536Non‐OECD : 6,011
China :1,898 India : 566
WEO, 2008
• OECD is not expected to increase dramatically
• Non‐OECD account for majority of increases
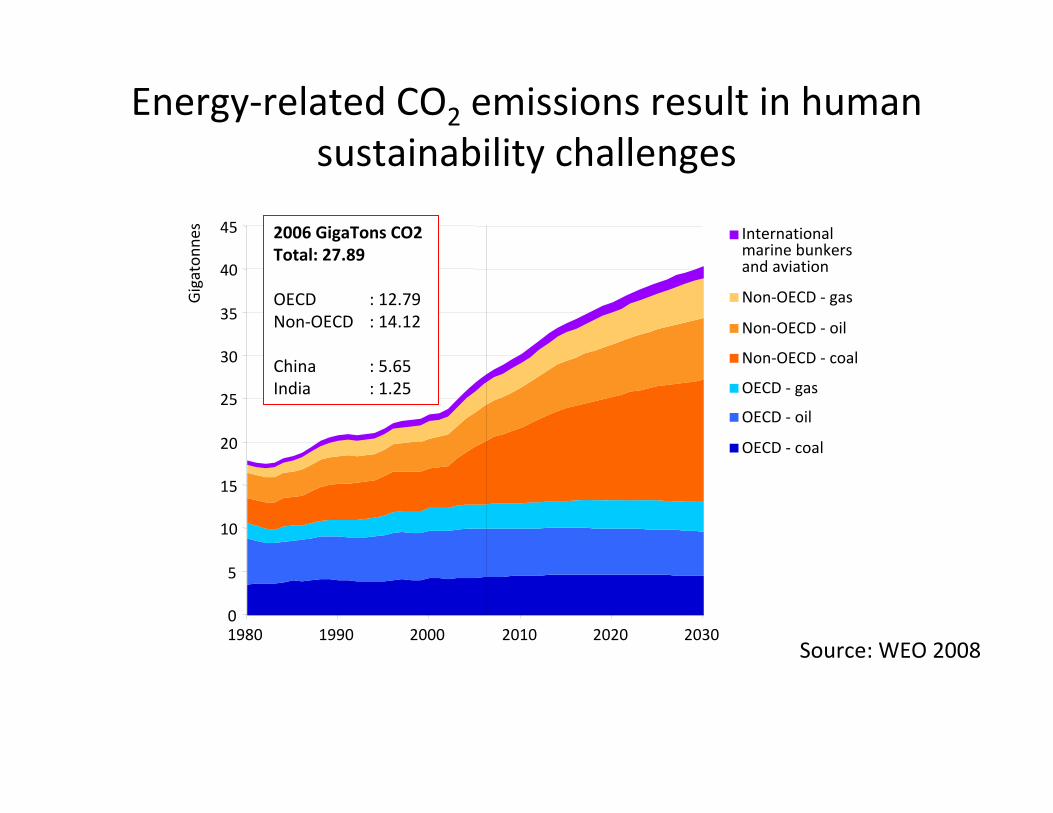
Energy‐related CO2 emissions result in human sustainability challenges
0
5
10
15
20
25
30
35
40
45
1980 1990 2000 2010 2020 2030
Gigaton
nes International
marine bunkersand aviation
Non‐OECD ‐ gas
Non‐OECD ‐ oil
Non‐OECD ‐ coal
OECD ‐ gas
OECD ‐ oil
OECD ‐ coal
Source: WEO 2008
2006 GigaTons CO2Total: 27.89
OECD : 12.79Non‐OECD : 14.12
China : 5.65 India : 1.25
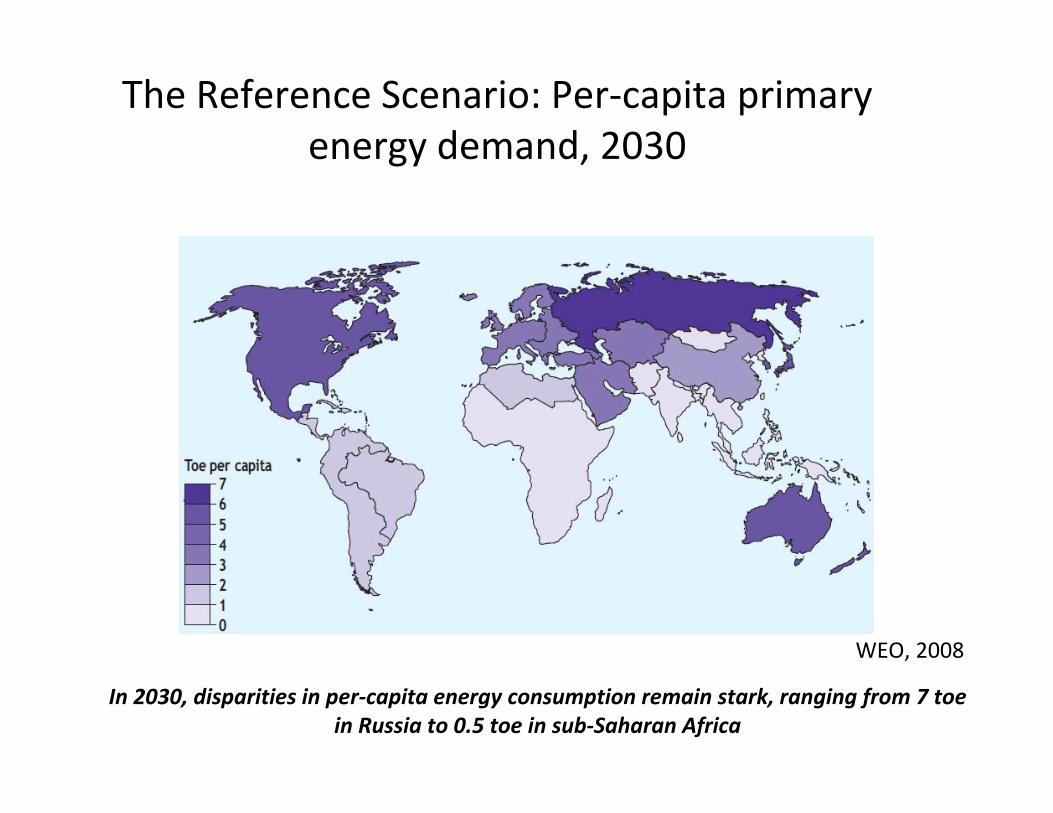
The Reference Scenario: Per‐capita primary energy demand, 2030
In 2030, disparities in per‐capita energy consumption remain stark, ranging from 7 toe in Russia to 0.5 toe in sub‐Saharan Africa
WEO, 2008
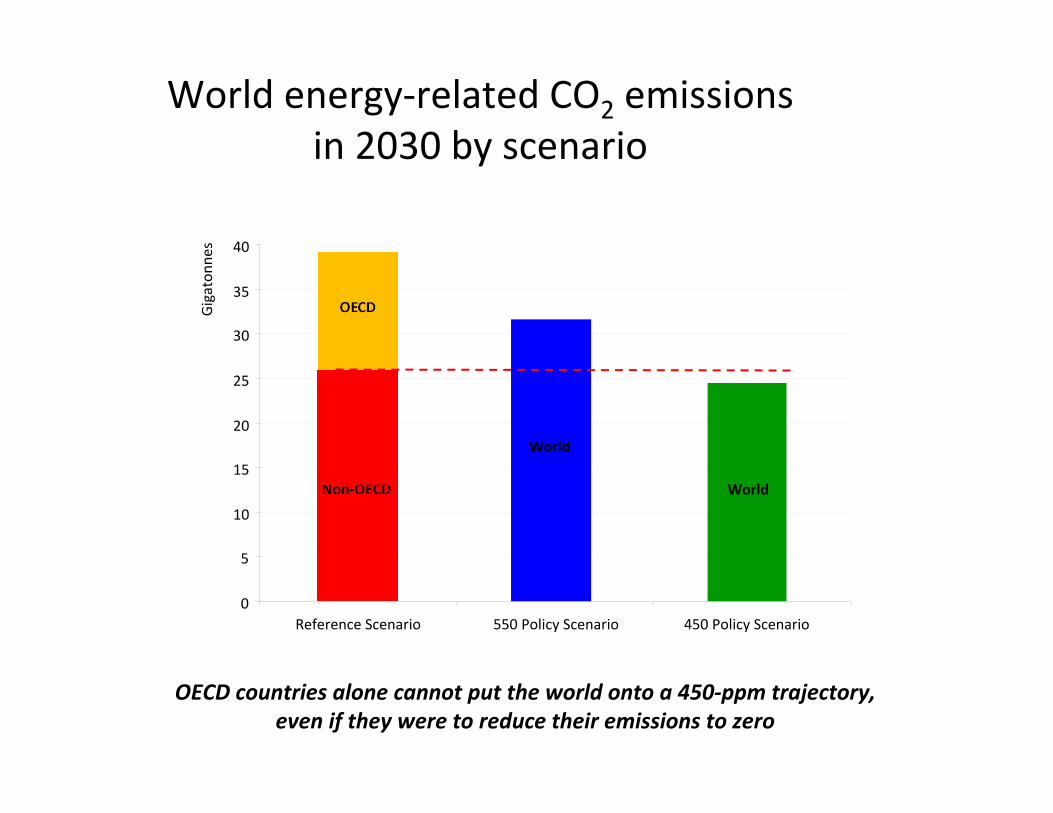
World energy‐related CO2 emissionsin 2030 by scenario
OECD countries alone cannot put the world onto a 450‐ppm trajectory, even if they were to reduce their emissions to zero
World
World
0
5
10
15
20
25
30
35
40
Reference Scenario 550 Policy Scenario 450 Policy Scenario
Gigaton
nes
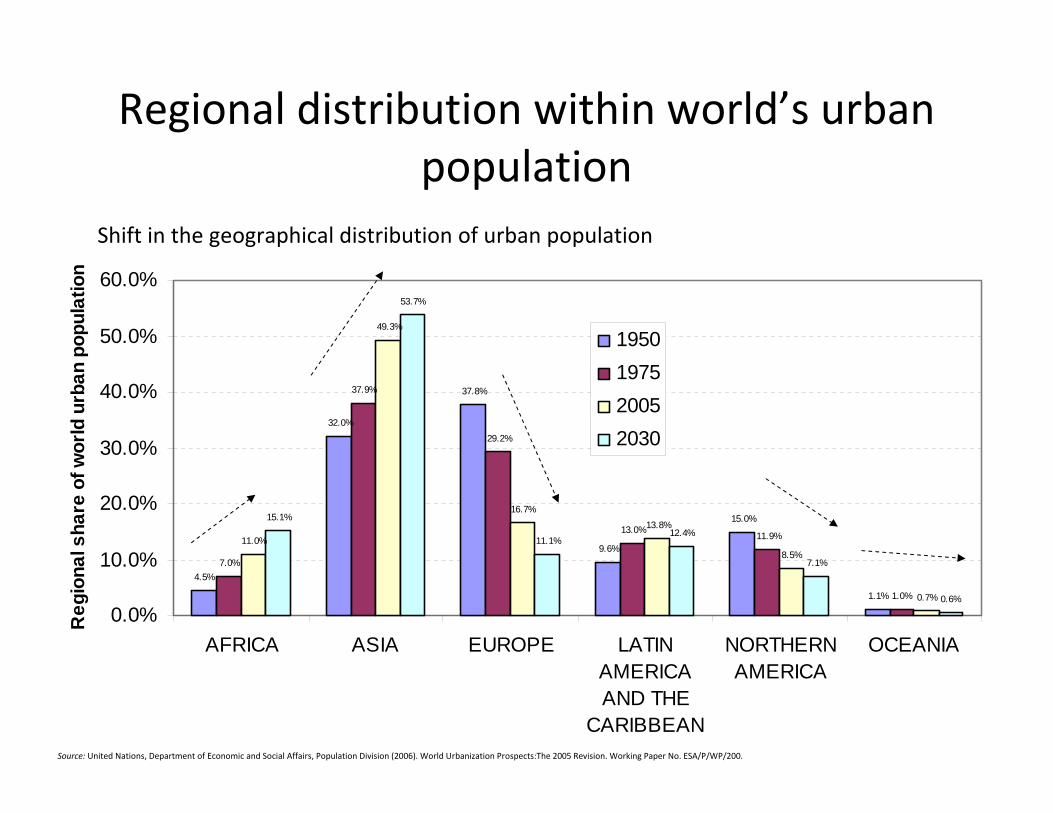
Regional distribution within world’s urban population
4.5%
32.0%
37.8%
9.6%
15.0%
1.1%
7.0%
37.9%
29.2%
13.0% 11.9%
1.0%
11.0%
49.3%
16.7%
13.8%
8.5%
0.7%
15.1%
53.7%
11.1%12.4%
7.1%
0.6%
0.0%
10.0%
20.0%
30.0%
40.0%
50.0%
60.0%
AFRICA ASIA EUROPE LATINAMERICAAND THE
CARIBBEAN
NORTHERNAMERICA
OCEANIA
Reg
iona
l sha
re o
f wor
ld u
rban
pop
ulat
ion
1950197520052030
Source: United Nations, Department of Economic and Social Affairs, Population Division (2006). World Urbanization Prospects:The 2005 Revision. Working Paper No. ESA/P/WP/200.
Shift in the geographical distribution of urban population
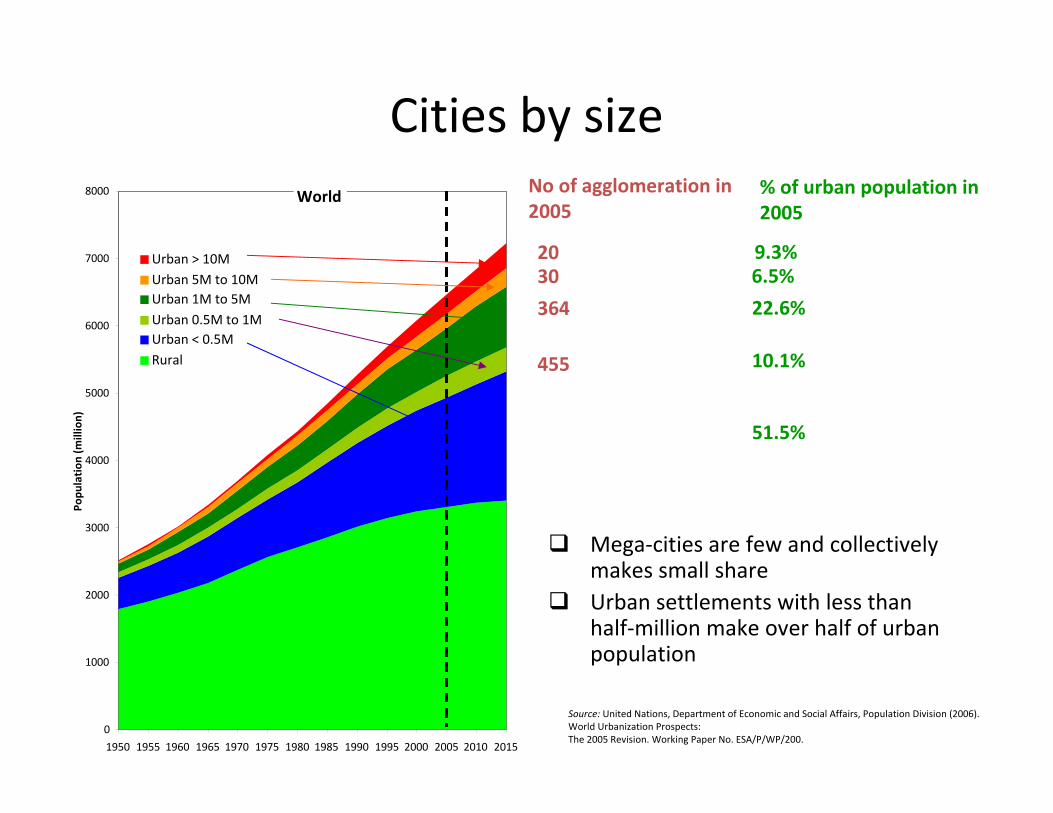
Cities by size
Mega‐cities are few and collectively makes small shareUrban settlements with less than half‐million make over half of urban population
World
0
1000
2000
3000
4000
5000
6000
7000
8000
1950 1955 1960 1965 1970 1975 1980 1985 1990 1995 2000 2005 2010 2015
Popu
lation
(million)
Urban > 10MUrban 5M to 10MUrban 1M to 5MUrban 0.5M to 1MUrban < 0.5MRural
2030
364
455
No of agglomeration in 2005
% of urban population in 2005
9.3%6.5%
22.6%
10.1%
51.5%
Source: United Nations, Department of Economic and Social Affairs, Population Division (2006). World Urbanization Prospects:The 2005 Revision. Working Paper No. ESA/P/WP/200.

The China case
• China contributes significantly– 16.8 % of global urban population (UN 2007)– 16% of global primary energy demand, and– 20% of global energy‐related CO2 (WEO 2008)
• China’s primary energy demand will increase further– By 2.2 times in 2005‐2030 to 3,819 Mtoe (WEO, 2007)
• Urbanization in China will increase further– 60% (880 million) by 2030 from 41 % (545 million) in 2005. MGI (2008)
projects is to one billion for 2030• 90% of GDP by 2025 from urban economy (MGI, 2008)• Urban energy use will increase further
– Per capita energy in cities are 1.8 times higher than national averages in 2006 (WEO, 2008)
– Such gap will narrow in the future but rapid urbanization will ultimately lead to increasing urban energy use

Urban primary energy use in China
2006 2030
Mtoe
City as a % of nation
al Mtoe
City as a % of nation
al
Coal 1 059 87% 2 206 90% Oil 271 77% 648 80% Natural gas 40 81% 158 84% Nuclear 12 84% 67 87% Hydro 31 84% 76 87% Biomass & waste 10 4% 37 16% Other renewables 2 45% 27 67% Total 1 424 75% 3 220 83% Electricity 161 80% 495 83%
Hydro2.2%
Nuclear0.8%
Natural gas2.8%
Oil19.0%
Coal74.3%
Biomass & w aste0.7%
Other renew ables
0.1%
Primary fuel share in urban energy use in 2006
Reference Scenario
WEO, 2008
For commercial energy, urban’s share is much higher i.e. 84%(Source: Dhakal (2008)
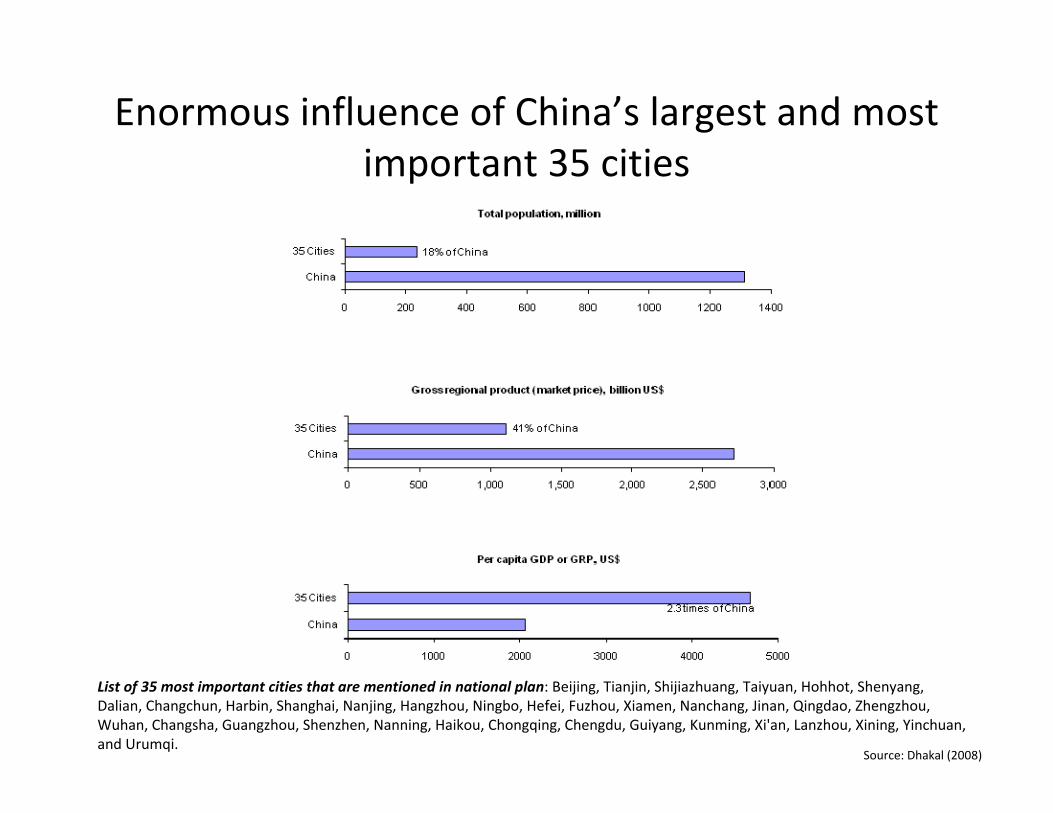
Enormous influence of China’s largest and most important 35 cities
List of 35 most important cities that are mentioned in national plan: Beijing, Tianjin, Shijiazhuang, Taiyuan, Hohhot, Shenyang, Dalian, Changchun, Harbin, Shanghai, Nanjing, Hangzhou, Ningbo, Hefei, Fuzhou, Xiamen, Nanchang, Jinan, Qingdao, Zhengzhou, Wuhan, Changsha, Guangzhou, Shenzhen, Nanning, Haikou, Chongqing, Chengdu, Guiyang, Kunming, Xi'an, Lanzhou, Xining, Yinchuan, and Urumqi.
Source: Dhakal (2008)

Enormous influence of China’s largest and most important 35 cities
Source: Dhakal (2008)

Four cities
Basic indicators of Beijing, Shanghai, Tianjin and Chongqing, 2006 City Beijing Shanghai Tianjin Chongqing Area, Sq Km 16,410 6,340 11,920 82,400 Resident population, million 15.81 18.15 10.75 2,808 Registered population, million 11.98 13.68 9.49 3,199 Urban share in resident population (%) 84% 89% 76% 47% Gross regional product, billion US$ 98.7 130.0 54.7 43.8 Total energy use, thousand TJ a 1,332 2,480 1,271 1,160 Total energy related CO2 emissions, million tons a
142.10 228.74 117.61 103.97
a Total energy means sum of TFC, distribution/transmission losses and conversion losses
Source: Dhakal (2008)
Note the difference between resident and registered population

Per capita CO2 emissions
0
4
8
12
16
20
1985
1986
1987
1988
1989
1990
1991
1992
1993
1994
1995
1996
1997
1998
1999
2000
2001
2002
2003
2004
2005
2006
Per c
apita
CO
2 em
issi
ons,
tons
/regi
ster
ed p
opul
atio
n Beijing
Chongqing
Shanghai
Tianjin
5 times of 1985
2.6 times of 1985
Based on permanent registered population Dhakal(2008)
• Rapidly rising energy use and CO2 emissions
•Diverging trends within cities
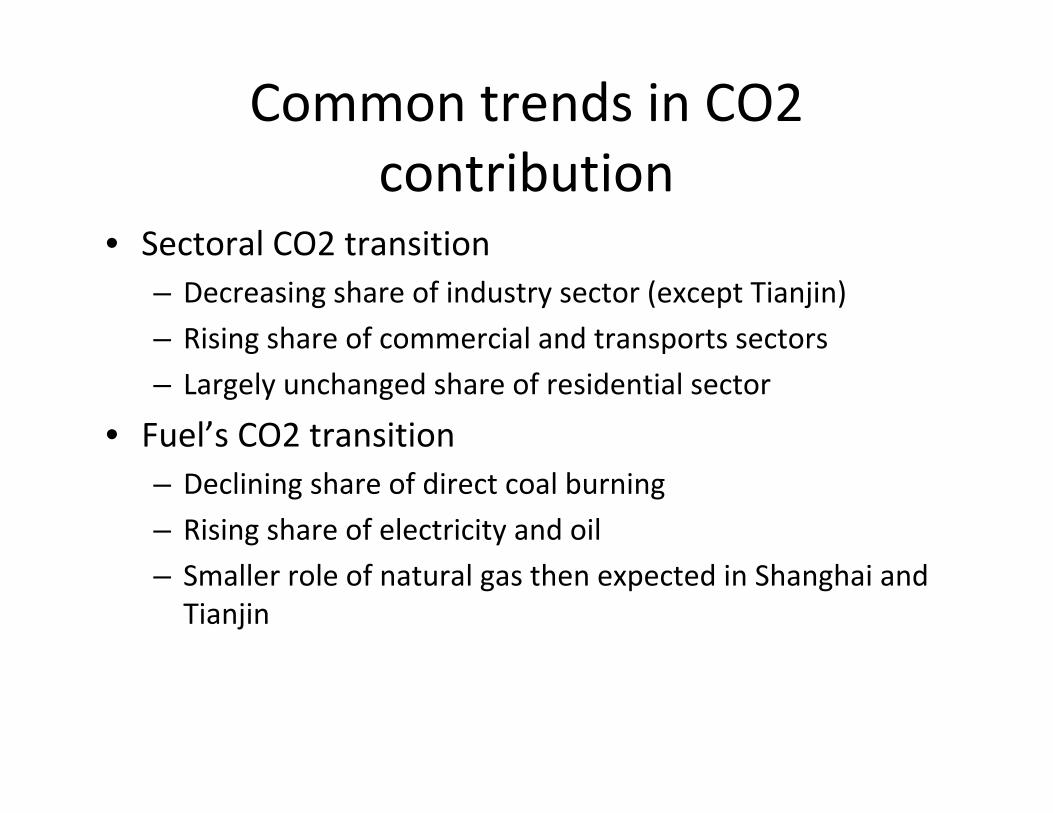
Common trends in CO2 contribution
• Sectoral CO2 transition – Decreasing share of industry sector (except Tianjin)
– Rising share of commercial and transports sectors
– Largely unchanged share of residential sector
• Fuel’s CO2 transition– Declining share of direct coal burning
– Rising share of electricity and oil
– Smaller role of natural gas then expected in Shanghai and Tianjin

Carbon intensity of economy and per capita trends
Beijing(1985-2006)
Shanghai(1985-2006)
Tianjin(1985-2006)
Chonqing(1997-2006)
-
0.50
1.00
1.50
2.00
2.50
3.00
3.50
4.00
0.00 5.00 10.00 15.00 20.00
CO2/capita, tons/person
CO2/
GRP
Kg/
Yuan
(197
8 co
nsta
nt
pric
e)
• Failed to perform well, in general (ideally should move towards origin over time)• Large gain in carbon intensity of economy but this has slowed or even worsened in recent years
• No way to reduce control per capita emission for now – but clearly great need to be dampened the growth and in carbon intensity terms

Final observations
• The speed and size of urbanization keeps urban CO2 and Asia in the center‐stage
• 67% of global energy is used in urban areas and urban areas are responsible for 71% of the energy related CO2 – this will increases to 73% and 76% respectively by 2030
• Asia, and in particular China and India is and will play bigger role in determining global urban energy and emissions in the future
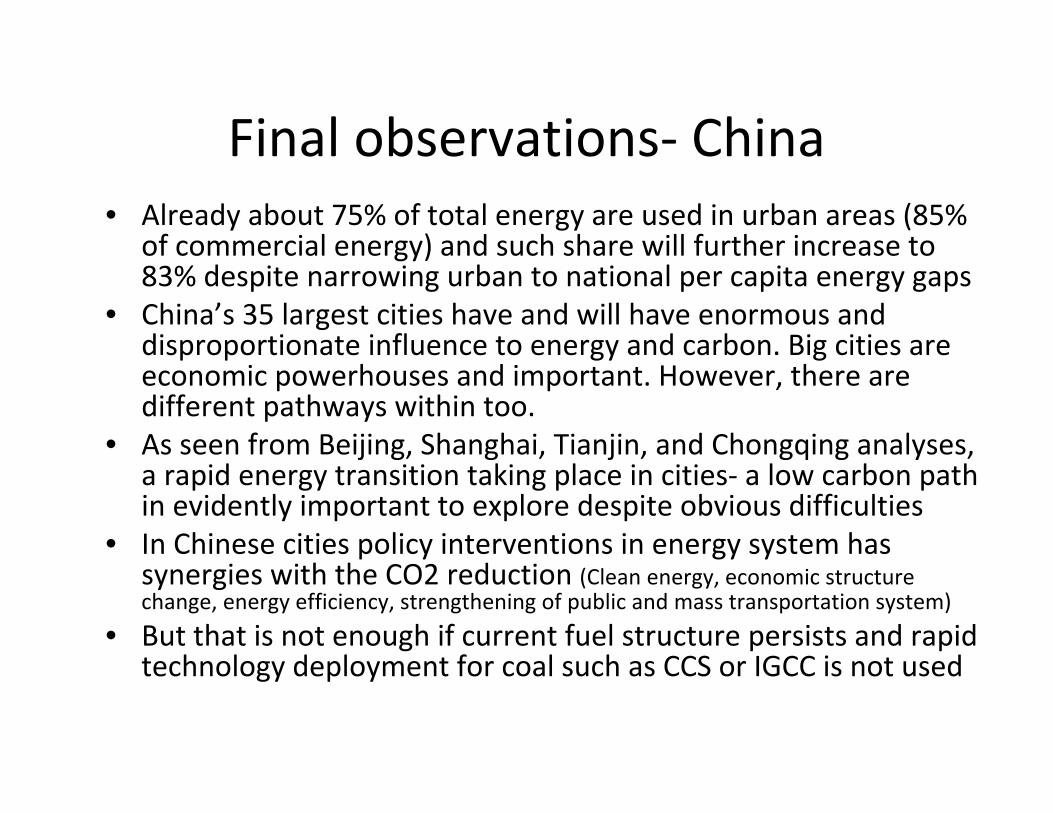
Final observations‐ China• Already about 75% of total energy are used in urban areas (85%
of commercial energy) and such share will further increase to 83% despite narrowing urban to national per capita energy gaps
• China’s 35 largest cities have and will have enormous and disproportionate influence to energy and carbon. Big cities are economic powerhouses and important. However, there are different pathways within too.
• As seen from Beijing, Shanghai, Tianjin, and Chongqing analyses,a rapid energy transition taking place in cities‐ a low carbon path in evidently important to explore despite obvious difficulties
• In Chinese cities policy interventions in energy system has synergies with the CO2 reduction (Clean energy, economic structure change, energy efficiency, strengthening of public and mass transportation system)
• But that is not enough if current fuel structure persists and rapid technology deployment for coal such as CCS or IGCC is not used