make your data understandable: communicating for action and impact
TRANSCRIPT


Make Your Data Understandable
Communicating for Action and Impact


About Forum One
Seattle, WA
Alexandria, VA - HQ
Washington, DC
Cologne, Germany


ActionAudience
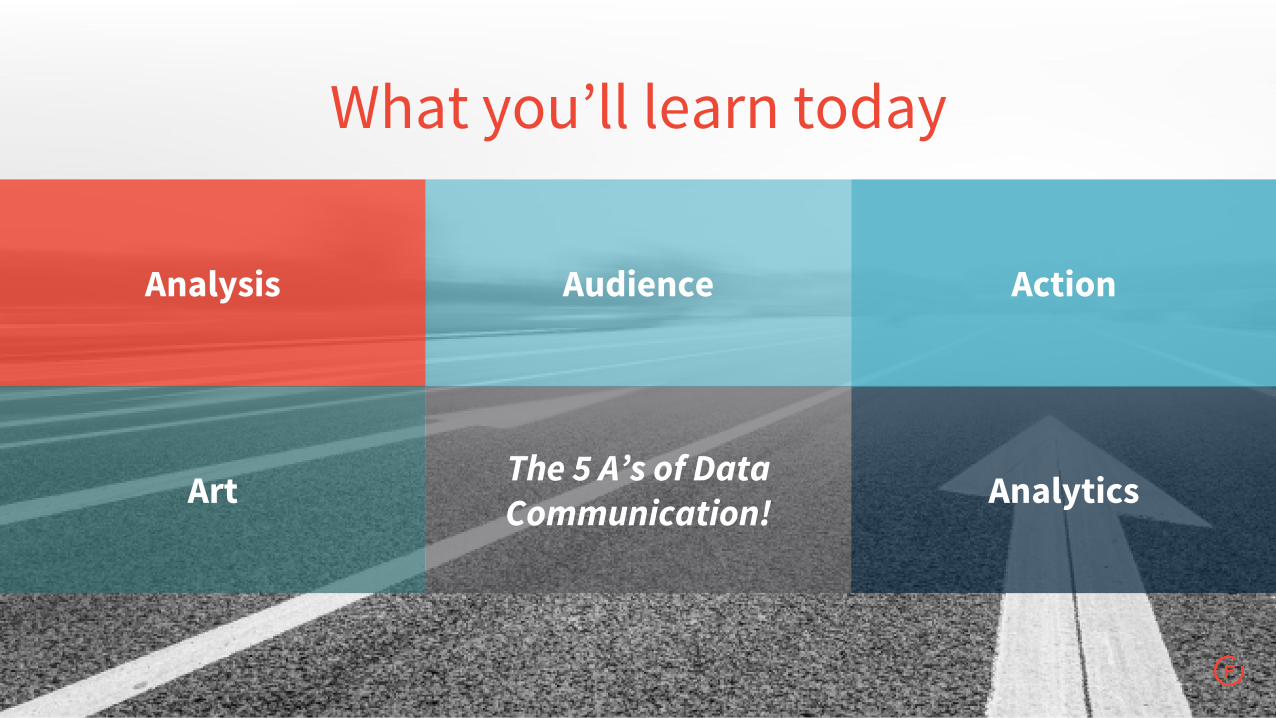
What you’ll learn today
Analysis
Art AnalyticsThe 5 A’s of Data Communication!

1. Analysis: What stories do the data tell?
2. Audience: Who are we trying to reach?
3. Action: What do we want our audiences to do?
4. Art: What design will maximize desired actions?
5. Analytics: How can we measure our success?
The Five A’s of Data Communication

First, a history lesson(you’re going to love it!)


The Crimean War
1853-1856

Poor Hospital Conditions
and bad data collection
“ To understand God’s thoughts, we must study statistics, for these are the measures of His purpose.

“
Florence Nightingale
To understand God’s thoughts, we must study statistics, for these are the measures of His purpose.

More soldiers are dying from preventable diseases, largely due to unsanitary conditions, than from battle wounds.
Nightingale’s Analysis

First Published Bar Chart
by WIlliam Playfair (1786)

Cholera Outbreak Map
John Snow (1854)

“
William Farr
You complain that your report would be dry. The dryer the better. Statistics should be the dryest of all reading.

Nightingale’s Audiences
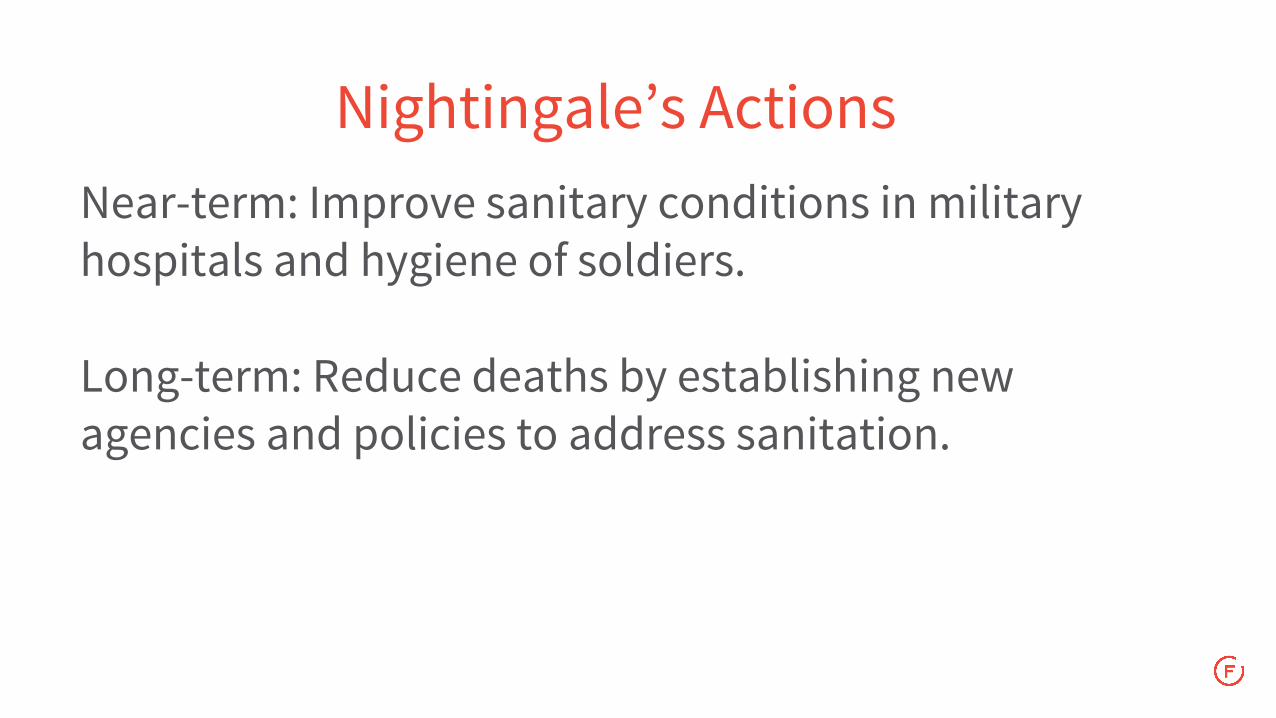
Near-term: Improve sanitary conditions in military hospitals and hygiene of soldiers.
Long-term: Reduce deaths by establishing new agencies and policies to address sanitation.
Nightingale’s Actions

Nightingale’s Art

● Death rate reduced from 42% to 2% following immediate improvements in sanitary conditions
● Establishment of the Royal Commission on the Health of Army
● Establishment of first Army Medical College in Great Britain
● Establishment of Sanitary Department within the Indian government
● Millions of lives saved in 160 years since?
Nightingale’s Analytics

Have we learned?(you decide)


$1,000 to save a life from malaria
$10,000 to save a life from HIV/AIDS
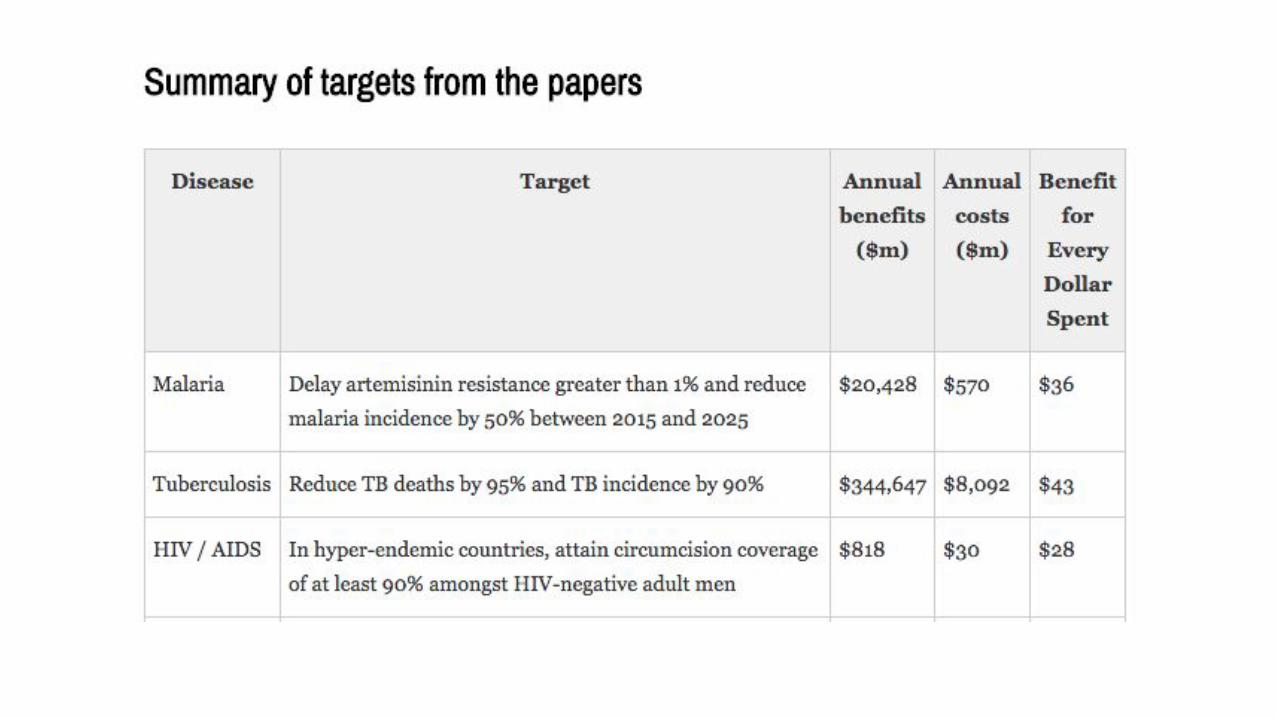
Cost benefit of disease treatment


A modern example(going back in time)


Employer-sponsored health insurance was steadily declining nation-wide for a decade before the Affordable Care Act.
More young people are staying on their parents’ insurance.
Analysis

Primary: Journalists
Secondary: Advocates, General Public, Policy Makers
Tertiary: Policy Analysts, Researchers
Audiences

Journalists: Publish an article including key findings from the report
Everyone else: Read and share the findings
Actions

Art: What’s the lead story?

Art: What’s the secondary story?

Art: What’s the local angle?

Analytics

Analytics: Articles in 300+ outlets

Art: Interactive data explorer

Analytics: Re-use of the data

A Framework(to make your lives easier)

Many options depending on:● Your goals● Audience needs● Nature, size, complexity of data● Design and/or technical capacity● Available software/tools● Delivery mechanism
Data communication approach

Communicating Data: Cheat Sheet

● Interviews● Focus groups● Surveys● Field studies● Web analytics● Usability testing
How to understand your audiences?

Audience research > better products

Your turn(don’t be shy)

ActionAudience
Use what you’ve learned (hopefully)
Analysis
Art AnalyticsThe 5 A’s of Data Communication!

Measuring impact(a sneak peek into new research)

What are your biggest measurement challenges?

Are communications aligned with mission?

Common measurement tools
