making a match - aapor€¦ · © alian kasabian, 2012 © name, 2012 making a match: exploring the...
TRANSCRIPT

© Name, 2012 © Alian Kasabian, 2012
Making a Match: Exploring the Impact of Mode Preference on
Measurement
Alian Kasabian, Jolene Smyth, and Kristen Olson University of Nebraska-Lincoln
AAPOR
May 19th, 2012
1
© Name, 2012 © Alian Kasabian, 2012
The Rise of Mixed Mode Surveys
• Increased use & research on mixed modes,
particularly the combination of Mail and Web – Self-administered lower cost
– Error sources some challenges • Coverage
• Sampling
• Nonresponse
• Measurement
– Ability to tailor the surveys for some respondents • Can provide their preferred mode
2

© Name, 2012 © Alian Kasabian, 2012
So What is Mode Preference?
• Different definitions of mode preference – The selected mode when given a choice (Dillman et al.
2009; Shih & Fan 2002)
– Pre-existing attitude (Olson et al. forthcoming)
• Asking in advance giving said mode = higher participation
• Have not looked at the impact on measurement
• Our research question: Is data quality higher for
respondents who receive their preferred mode,
compared to those who do not receive their
preferred mode?
3

© Name, 2012 © Alian Kasabian, 2012
Connecting Mode Preference
and Data Quality
• Respondents are impacted by motivation, ability,
and burden (Krosnick 1991)
– Optimizing: fully engaged with the survey
• ↑ Motivation + ↑ ability + ↓ burden
– Shortcuts: reduce psychological costs (e.g. satisficing)
• Preferred mode = ↑ ability + ↓ burden
• We hypothesize that giving respondents a mode
they prefer will increase motivation and reduce
some of the burden of answering questions.
4

© Name, 2012 © Alian Kasabian, 2012 5
2008 NASIS
Feb - Aug. 2008
n=1811
RR3=38.0%
1370 Respondents
were willing to
participate in
additional research
Step 1: Measure
Mode
Preference
Step 2: Survey Again
Web
RR2=50.0%
RR2=53.9%
RR2=53.2%
Web
RR2=25.4%
Web
2009 Quality of Life in a Changing Nebraska
Survey: July-Oct. 2009
Form A n=79
Form B n=81
Form A n=79
Form B n=78
Form A n=83
Form B n=91
Form A n=37
Form B n=37
n=465 RR1=45.7%
© Name, 2012 © Alian Kasabian, 2012
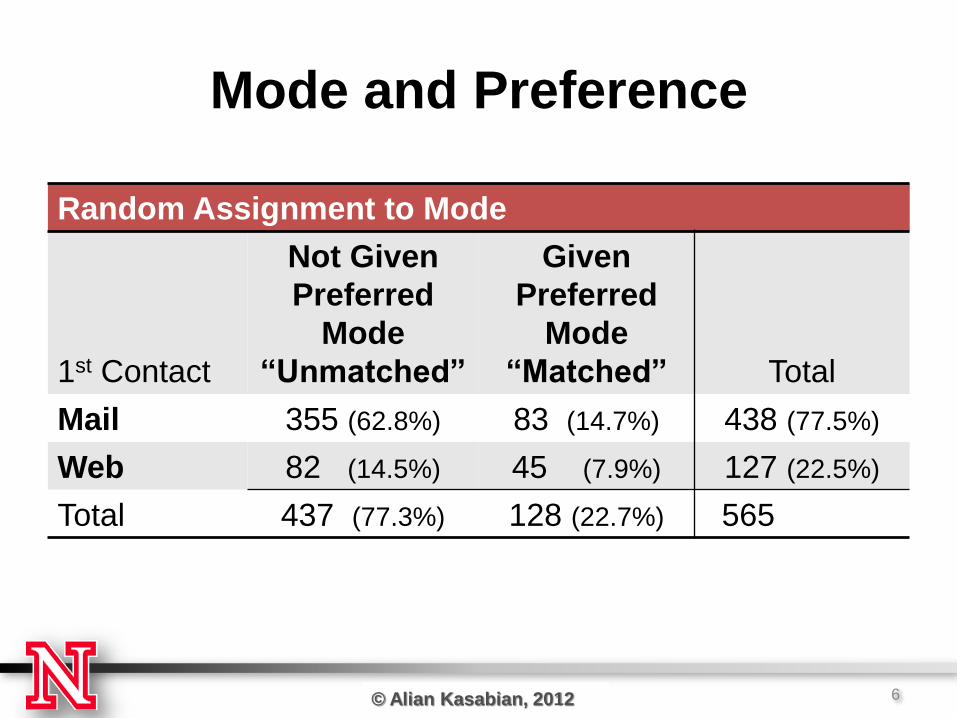
Mode and Preference
6
Random Assignment to Mode
1st Contact
Not Given
Preferred
Mode
“Unmatched”
Given
Preferred
Mode
“Matched” Total
Mail 355 (62.8%) 83 (14.7%) 438 (77.5%)
Web 82 (14.5%) 45 (7.9%) 127 (22.5%)
Total 437 (77.3%) 128 (22.7%) 565

© Name, 2012 © Alian Kasabian, 2012
How Did We Investigate the
Impact of Mode Preference?
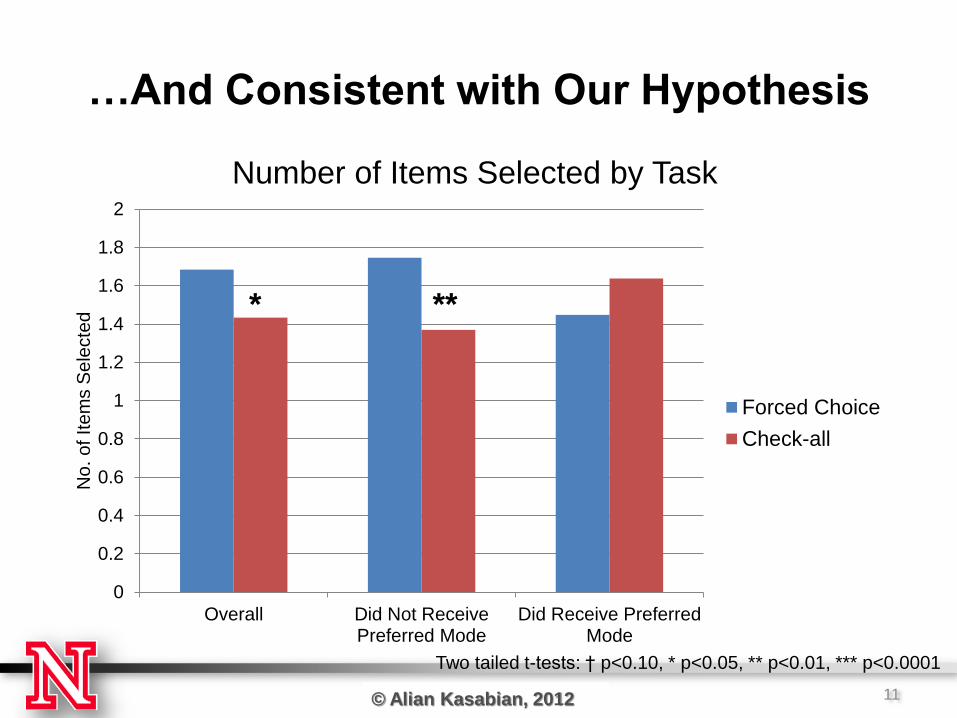
• Three high burden question types – Multiple answer (aka forced choice/check-all that
apply) • Individuals items are selected less often in the check-all
vs. the forced choice task (Krosnick 1992; Rasinksi et al. 2004; Smyth et al.
2006)
– Open ended • Fewer cues for respondent to assist in recall, compared
to a closed-ended question, and larger boxes produce more detailed response (Christian et al. 2007; Dillman et al. 2009 ; Smyth et al.
2009)
– Grids (aka matrices) • Grouping of similar items helpful for researcher and
respondent, but difficult to navigate (Couper 2008; Kaczmirek 2011)
7

© Name, 2012 © Alian Kasabian, 2012
Multiple Answer
8
Check-All
Low motivation
Low burden
Forced Choice
Higher motivation
Higher burden
(Dillman et al. 2009; Krosnick 1992; Rasinksi et al. 2004; Smyth et al. 2006)
H: expect smaller
differences between these
two formats for
respondents given their
preferred mode

© Name, 2012 © Alian Kasabian, 2012
Findings: Actual Values
9
0
0.2
0.4
0.6
0.8
1
1.2
1.4
1.6
1.8
2
Overall Did Not ReceivePreferred Mode
Did Receive PreferredMode
No
. o
f It
em
s S
ele
cte
d
Number of Items Selected by Task
Forced Choice
Check-all
* **
Two tailed t-tests: † p<0.10, * p<0.05, ** p<0.01, *** p<0.001
2 Tailed t-tests

© Name, 2012 © Alian Kasabian, 2012
Consistent with Previous Literature….
10
0
0.2
0.4
0.6
0.8
1
1.2
1.4
1.6
1.8
2
Overall Did Not ReceivePreferred Mode
Did Receive PreferredMode
No
. o
f It
em
s S
ele
cte
d
Number of Items Selected by Task
Forced Choice
Check-all
* **
Two tailed t-tests: † p<0.10, * p<0.05, ** p<0.01, *** p<0.001
© Name, 2012 © Alian Kasabian, 2012
…And Consistent with Our Hypothesis
11
0
0.2
0.4
0.6
0.8
1
1.2
1.4
1.6
1.8
2
Overall Did Not ReceivePreferred Mode
Did Receive PreferredMode
No
. o
f It
em
s S
ele
cte
d
Number of Items Selected by Task
Forced Choice
Check-all
* **
Two tailed t-tests: † p<0.10, * p<0.05, ** p<0.01, *** p<0.0001

© Name, 2012 © Alian Kasabian, 2012
Open Ended
12
Smaller Text Box
Motivation variable
High burden
Larger Text Box
Motivation variable
High burden
(Christian et al. 2007; Dillman et al. 2009; Smyth et al. 2009)
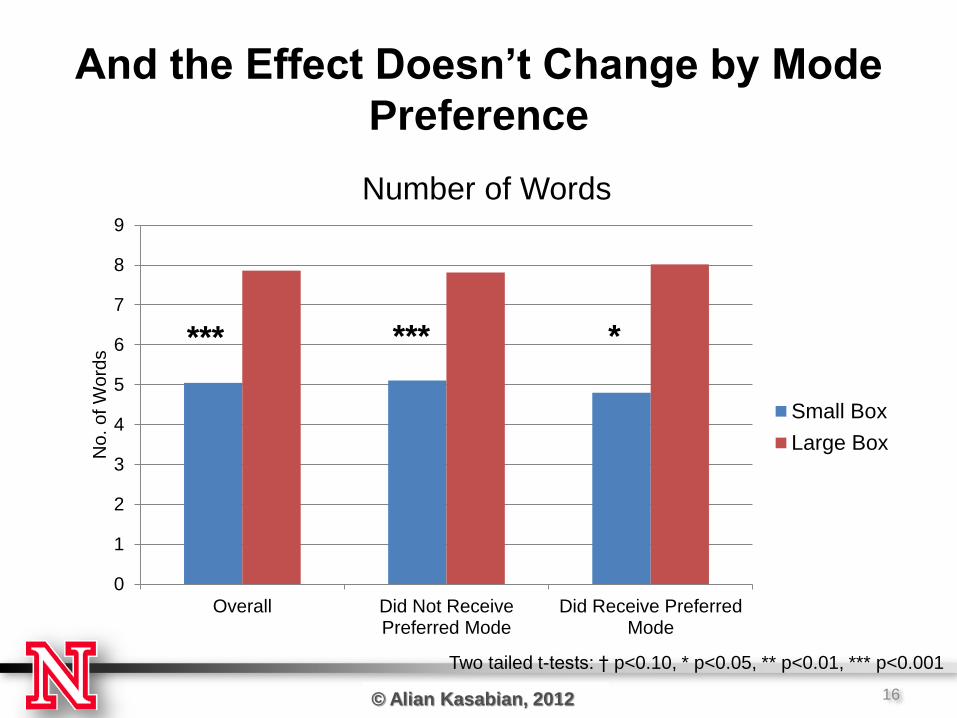
H: expect lower item
nonresponse, and longer
answers with more
themes and elaborations
from respondents that
were given a preferred
mode

© Name, 2012 © Alian Kasabian, 2012
Is The Larger Box is Too Much Effort?
13
0
0.02
0.04
0.06
0.08
0.1
0.12
0.14
0.16
0.18
Overall Did Not ReceivePreferred Mode
Did Receive PreferredMode
Ite
m N
on
resp
on
se
Ra
te
Item Nonresponse in Open Ended Questions
Small Box
Large Box
* **
Two tailed t-tests: † p<0.10, * p<0.05, ** p<0.01, *** p<0.0001

© Name, 2012 © Alian Kasabian, 2012
Not for Respondents Who Received Their
Preferred Mode
14
0
0.02
0.04
0.06
0.08
0.1
0.12
0.14
0.16
0.18
Overall Did Not ReceivePreferred Mode
Did Receive PreferredMode
Ite
m N
on
resp
on
se
Ra
te
Item Nonresponse in Open Ended Questions
Small Box
Large Box
* **
Two tailed t-tests: † p<0.10, * p<0.05, ** p<0.01, *** p<0.001

© Name, 2012 © Alian Kasabian, 2012
Do Respondents Provide Longer
Answers when Given More Space?
15
0
1
2
3
4
5
6
7
8
9
Overall Did Not ReceivePreferred Mode
Did Receive PreferredMode
No
. o
f W
ord
s
Number of Words
Small Box
Large Box
*** *** *
Two tailed t-tests: † p<0.10, * p<0.05, ** p<0.01, *** p<0.001
© Name, 2012 © Alian Kasabian, 2012
And the Effect Doesn’t Change by Mode
Preference
16
0
1
2
3
4
5
6
7
8
9
Overall Did Not ReceivePreferred Mode
Did Receive PreferredMode
No
. o
f W
ord
s
Number of Words
Small Box
Large Box
*** *** *
Two tailed t-tests: † p<0.10, * p<0.05, ** p<0.01, *** p<0.001

© Name, 2012 © Alian Kasabian, 2012
Do Respondents Discuss More Themes
When Given More Space?
17
0
0.2
0.4
0.6
0.8
1
1.2
1.4
Overall Did Not ReceivePreferred Mode
Did Receive PreferredMode
No
. o
f T
he
me
s
Number of Themes
Small Box
Large Box
*
Two tailed t-tests: † p<0.10, * p<0.05, ** p<0.01, *** p<0.001

© Name, 2012 © Alian Kasabian, 2012
Yes, When Given Their Preferred Mode
18
0
0.2
0.4
0.6
0.8
1
1.2
1.4
Overall Did Not ReceivePreferred Mode
Did Receive PreferredMode
No
. o
f T
he
me
s
Number of Themes
Small Box
Large Box
*
Two tailed t-tests: † p<0.10, * p<0.05, ** p<0.01, *** p<0.001

© Name, 2012 © Alian Kasabian, 2012
Elaboration Increases with Text Box Size
19
0%
5%
10%
15%
20%
25%
30%
35%
40%
45%
Overall Did Not ReceivePreferred Mode
Did Receive PreferredMode
Pe
rce
nt E
lab
ora
tin
g
Percent of Respondents Elaborating
Small Box
Large Box
*** **
Two tailed t-tests: † p<0.10, * p<0.05, ** p<0.01, *** p<0.001

© Name, 2012 © Alian Kasabian, 2012
But Not For Respondents in Their
Preferred Mode
20
0%
5%
10%
15%
20%
25%
30%
35%
40%
45%
Overall Did Not ReceivePreferred Mode
Did Receive PreferredMode
Pe
rce
nt E
lab
ora
tin
g
Percent of Respondents Elaborating
Small Box
Large Box
*** **
Two tailed t-tests: † p<0.10, * p<0.05, ** p<0.01, *** p<0.001

© Name, 2012 © Alian Kasabian, 2012
Overall, No Difference by Text Box Size
21
0
0.2
0.4
0.6
0.8
1
1.2
1.4
1.6
1.8
2
Overall Did Not ReceivePreferred Mode
Did Receive PreferredMode
No
. o
f E
lab
ora
tio
ns
Number of Elaborations
Small Box
Large Box
*
Two tailed t-tests: † p<0.10, * p<0.05, ** p<0.01, *** p<0.001

© Name, 2012 © Alian Kasabian, 2012
But Receipt of Preferred Mode May
Increase the Impact of Text Box Size
22
0
0.2
0.4
0.6
0.8
1
1.2
1.4
1.6
1.8
2
Overall Did Not ReceivePreferred Mode
Did Receive PreferredMode
No
. o
f E
lab
ora
tio
ns
Number of Elaborations
Small Box
Large Box
*
Two tailed t-tests: † p<0.10, * p<0.05, ** p<0.01, *** p<0.001

© Name, 2012 © Alian Kasabian, 2012
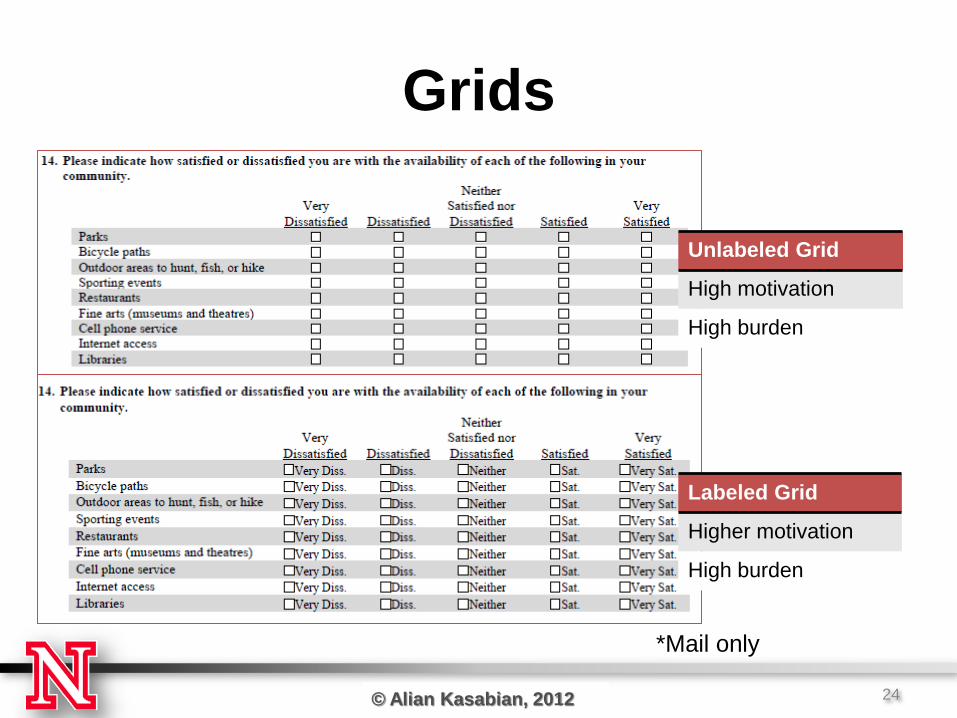
Grids
23
Unlabeled Grid
High motivation
High burden
© Name, 2012 © Alian Kasabian, 2012
Grids
24
Labeled Grid
Higher motivation
High burden
Unlabeled Grid
High motivation
High burden
*Mail only

© Name, 2012 © Alian Kasabian, 2012
What is Straightlining?
25
H: expect lower item nonresponse rate and less straightlining on the
labeled condition, and less from respondents that were given a
preferred mode

© Name, 2012 © Alian Kasabian, 2012
In General, Our Respondents Did Not
Take This Shortcut
26
0
0.01
0.02
0.03
0.04
0.05
0.06
0.07
0.08
0.09
0.1
Overall Did Not ReceivePreferred Mode
Did Receive PreferredMode
Pro
po
rtio
n S
tra
igh
tlin
ing
Proportion of Respondents Straightlining
Unlabeled
Labeled
Two tailed t-tests: † p<0.10, * p<0.05, ** p<0.01, *** p<0.001

© Name, 2012 © Alian Kasabian, 2012
And Still Not Significant
27
0
0.01
0.02
0.03
0.04
0.05
0.06
0.07
0.08
0.09
0.1
Overall Did Not ReceivePreferred Mode
Did Receive PreferredMode
Pro
po
rtio
n S
tra
igh
tlin
ing
Proportion of Respondents Straightlining
Unlabeled
Labeled
Two tailed t-tests: † p<0.10, * p<0.05, ** p<0.01, *** p<0.001

© Name, 2012 © Alian Kasabian, 2012
What About Missing Items?
28
0
0.01
0.02
0.03
0.04
0.05
0.06
0.07
0.08
Overall Did Not ReceivePreferred Mode
Did Receive PreferredMode
Ite
m N
on
res
po
ns
e R
ate
s
Average Item Nonresponse Rate
Unlabeled
Labeled
** * †
Two tailed t-tests: † p<0.10, * p<0.05, ** p<0.01, *** p<0.001

© Name, 2012 © Alian Kasabian, 2012
The Ugly Grid is a Winner!
29
0
0.01
0.02
0.03
0.04
0.05
0.06
0.07
0.08
Overall Did Not ReceivePreferred Mode
Did Receive PreferredMode
Ite
m N
on
res
po
ns
e R
ate
s
Average Item Nonresponse Rate
Unlabeled
Labeled
** * †
Two tailed t-tests: † p<0.10, * p<0.05, ** p<0.01, *** p<0.001

© Name, 2012 © Alian Kasabian, 2012
So What Have We Learned?
• We hypothesized that giving respondents their
preferred mode would increase motivation and
reduce some of the burden of answering
questions. – Respondents who received their preferred mode
appear to be more fully engaged with the survey than
their unmatched counterparts. • Lower item nonresponse rates
• More information provided
30
© Name, 2012 © Alian Kasabian, 2012
Limitations
• Our frame has weaknesses – In Nebraska
• Overwhelmingly white
• High cell-phone only population, even in 2008
• This was a relatively short survey
• Some small cell sizes, reducing our statistical
power
• We do not know if our mode preference results
have support in replication, or will apply to other
types of questions
31

© Name, 2012 © Alian Kasabian, 2012
Conclusion
• The answer to our research question, “Is data
quality higher for respondents who receive their
preferred mode, compared to those who do not
receive their preferred mode?” has not been fully
answered here.
• Our findings point to a method that could
improve data quality for high burden questions in
general population surveys
• We need more research
32

© Name, 2012 © Alian Kasabian, 2012
Thank You!
If you have questions, please contact:
Alian Kasabian
33
This research was funded by the UNL Office of Research Layman Award,
and with support from the Bureau of Sociological Research, and Dan Hoyt
and the Department of Sociology

© Name, 2012 © Alian Kasabian, 2012 34

© Name, 2012 © Alian Kasabian, 2012 35

© Name, 2012 © Alian Kasabian, 2012
What is Going on Here?
36
0
0.01
0.02
0.03
0.04
0.05
0.06
0.07
0.08
Overall Did Not ReceivePreferred Mode
Did Receive PreferredMode
Ite
m N
on
res
po
ns
e R
ate
s
Average Item Nonresponse Rate
Unlabeled
Labeled
** * †

© Name, 2012 © Alian Kasabian, 2012
Grids: A Special Case?
• Why would respondents who were given their
preferred mode be the same as the others in the
unlabeled grid, but so different in the labeled
grid? – Possibility: the difficulty of the unlabeled grid
overpowers any benefit received from getting their
preferred mode
37