making bank: managing and monitoring your revenue cycle
TRANSCRIPT

4/16/2018
1
Making Bank: Managing and Monitoring Your Revenue CycleAndrew Davis, Senior Manager
ECG Management Consultants
Seattle, WA
Malita Scott, Associate Principal
ECG Management Consultants
Washington, D.C.
Sharon Sagarra, MBA, FACMPE
Practice administrator, Benrus Surgical Associates, Inc.
St. Peters MO
Andrew Davis and Malita Scott and Sharon Sagarra do not have any financial conflicts to report at this time.

4/16/2018
2
©2017 MGMA. All rights reserved. - 2 -
Learning Objectives
• Analyze key fundamentals for best
practice revenue cycle management
operations
• Implement a revenue-cycle process that
maintains profitability
• Examine technology that will aid you in
making process more efficient
3
About Your PresentersAndrew DavisSenior Manager
Drew brings an extensive background in strategic revenue cycle management, complemented with his deep knowledge of clinical operations and IT systems support. Clients find particular value in his ability to bridge complex concepts and facilitate change management across these often disparate areas.
In Drew’s time at ECG, he has partnered with healthcare providers across the country to optimize structural, operational, and financial performance. Drew has knowledge of and a continued interest in consolidated business office models, integration of revenue cycle
activities across health systems, use of IT as a strategic driver for organizational change, technology-directed process optimizations, and quantitative-guided labor management.
Prior to his work at ECG, Drew was an administrative fellow and department manager at Duke University Health System. He led the health system’s preregistration team and spent much of his time optimizing system design and operations following a major system conversion.
Malita Scott Associate Principal
Malita’s expertise working with ambulatory networks is of tremendous value to her clients at a time when the traditional boundaries between inpatient and outpatient care are being redrawn.
Malita has devoted her 15-year career to helping ambulatory providers improve performance, enhance patient care, optimize work flows, and lower costs. She has led health systems through major transitional change, including organizational turnarounds and alignment transactions, and clients value her ability to build strong relationships with leadership, physicians, and staff. Malita
has helped her clients position for success under healthcare reform, including identifying opportunities to establish clinical integration and value-based ambulatory networks.
She has worked with her clients to create highly efficient, patient-centered ambulatory care settings and has helped a number of organizations achieve multimillion-dollar savings. Malita’s experience spans multispecialty adult and pediatric hospitals in both community and academic settings.

4/16/2018
3
©2017 MGMA. All rights reserved.
Operations Technology
Strategy Finance
Tackling today’s complex and interconnected healthcare problems
requires knowledge and expertise across multiple disciplines, and that’s
what ECG delivers to our clients every day. With four core competencies
of strategy, finance, operations, and technology, we provide smart
counsel and sustainable solutions that are transforming healthcare
delivery.
More than 225 professionals operate out of ECG’s offices in Atlanta,
Boston, Chicago, Dallas, Minneapolis, San Diego, San Francisco, Seattle,
St. Louis, and Washington, D.C.
We’re leading healthcare forward,
one organization at a time.
4
About ECG Overview
©2017 MGMA. All rights reserved. 5
About ECGService Offerings
STRATEGY
OPERATIONS
FINANCE
TECHNOLOGY
• Enterprise strategy
• Service line strategy
• Physician strategy and alignment
• Health reform and ACO strategy
• Transactions and affiliations
• Organizational design and development
• Business and financial advisory services
• Payor contracting and reimbursement
• Provider compensation planning
• Valuation services
• Industry benchmarking
• Performance improvement
• Care model transformation
• Patient access
• Revenue cycle optimization
• IT system strategy
• IT system implementation and optimization
• System integration
• Patient engagement
• System reporting enhancement

4/16/2018
4
©2017 MGMA. All rights reserved. 6
Today’s Agenda
I.
II.
III.
IV.
Market Trends
Revenue Cycle Overview
Positioning for the Future
Conclusion
Multiple market factors are changing the landscape in which revenue cyclemanagement (RCM) services are deployed among medical group organizations.
7
Market TrendsDriving Forces
Rising Costs: US healthcare administrative costs have continued to rise, requiring administrators to effectively manage the revenue cycle in order to optimize efficiency and maximize reimbursement.
Changing Reimbursement Models: With changes in how services have been traditionally reimbursed (from fee for service to value-based care), providers must learn to effectively manage clinical and financial risk in varying degrees.
Patient Consumerism: From higher deductibles to increased premiums, patients are shouldering a greater burden of out-of-pocket costs and becoming more educated in decisions around what services they want and how much they are willing to pay for them.
Third-Party Outsourcing: Multiple third-party vendors are now entering the marketplace to provide end-to-end RCM services; however, varying degrees of success among vendors often lead practices to contemplate outsourcing versus insourcing.

4/16/2018
5
©2017 MGMA. All rights reserved. 8
Market TrendsPractice Impact
Financial conditions require reductions in cost in order to maintain even status quo operations.
More time and resources must be allocated to identify patient liability and educate patients on their benefit plans.
Lower reimbursement requires providers to adapt advanced payment models and recruit revenue cycle talent to manage these systems.
Limited access to talent requires use of third-party vendors or costly temporary labor.
Market forces are driving medical group operators to react dramatically and adapt to these dynamic conditions. Incremental practice-level changes
are not sufficient to support needs of today’s healthcare organizations.
©2017 MGMA. All rights reserved. 9
Market TrendsFirst Key Question
QWhich market trend or force has the greatest impact on your practice’s finances and operations?

4/16/2018
6
10
Market TrendsImportance of Revenue Cycle
Effective RCM requires an investment in people, processes, and technologies to ensure proper revenue,
resource allocation, and compliance.
• Front-end revenue cycle data capture has critical downstream effects on net collections.
• Scheduling, registration, and insurance eligibility verification have a direct impact on bottom-line performance.
• Appropriate classification of government and commercial insurance is key.
Poor Data Capture
• Patients are selecting higher-deductible plans.
• Collecting on self-pay accounts continues to create challenges for healthcare organizations and medical practices.
• Healthcare consumers are becoming more selective in determining where they get their services.
Consumers Taking Greater
Risk
» Text
Rising Costs of Revenue Cycle
Activities
• Payment delays/rejections contribute to higher revenue cycle operation costs.
• Insurance denials and underpayments are costly to identify and address.
• Re-work associated with inefficient work flows results in a higher cost to collect.
Medical groups are losing 3% to 5% of their net revenuefrom inadequate RCM processes and procedures.
©2017 MGMA. All rights reserved. 11
Market TrendsSecond Key Question
QWhat can medical groups do to contain costs and increase revenue in today’s financially challenging healthcare environment?

4/16/2018
7
12
Revenue Cycle Overview Introduction
As shown on the next
slide, functional areas
of the revenue cycle
are not isolated in just
“the billing shop.”
Effective management
requires shared focus
and accountability
across the entire
organization.
Functional Areas:
• Front End: Pre-visit and point-of-service (POS) functions
• Mid-Cycle: Coding and charge capture
• Back End: Billing and collections
Essential Management Elements:
• Accountability
• Management/governance
• Transparency/reporting
• Revenue integrity
• Vendor management
Nuances of Hospital Versus Professional Fee:
• Patient types
• Coding process
• Claim forms
• Reimbursement mechanism
• Payment/adjustment posting level
Affected Organizational Layers:
• Providers/Management/Staff: Productivity, performance, engagement
• Operations: Process efficiency, centralization
• Infrastructure: Systems, reports, tools, automation
KEY CONSIDERATIONS
The revenue cycle is defined as all administrative and clinical functions that contribute to the capture, management, and collection of patient service revenue. Several key considerations are listed below.
13
Revenue Cycle Overview Process Flow and Functional Area Summary
Mid-Cycle Functions(Coding and Charging)
Front-End Functions(Pre-Visit and POS Activities)
Appointment Scheduling
Registration and Eligibility
Coding and Documentation
Charge Capture and/or Charge
Entry
Referral Management
Patient Care Event and Checkout
Arrival/Check-In
• Schedule appointments.
• Make reminder phone calls.
• Verify all demographic and insurance data.
• Collect any patient liability.
• Obtain prior authorization or referral if needed.
• Contact payor for notification of treatment.
• Clinician sees patient.
• Any return visits are scheduled and referrals are initiated.
• Clinical encounter documented by provider.
• Text-based notes summarized into alphanumeric codes.
• Post codes to billing system.
• Create claim or invoice to bill to insurance company using coded encounter.
• Gather demographic info.
• Obtain and verify insurance/ payor info.
Back-End Functions(Post-Charging, Resolution to $0 Balance)
Claim Edit and Submission
• Identify any errors and/or missing info.
• Submit claims to insurance for processing.
Payment Posting andCash Management
• Receive payor adjudication information and enter into billing system.
• Ensure cash is deposited into appropriate bank accounts and reconciled.
Insurance Denials and Follow-Up
• Follow up on denials or unprocessed/no-response claims.
• Initiate resolution or correction, re-bill, and/or write off if necessary.
Patient Inquiry and Self-Pay Follow-Up
• Bill post-insurance self-pay balances to patients.
• Process all patient-initiated correspondence.

4/16/2018
8
Appointment Scheduling
• Inefficiently using scheduling templates
• Allowing large scheduling backlogs
• Not collecting or verifying registration data at time of scheduling
• Using consistent appointment types, scheduling templates, and protocols
• Reducing appointment backlogs and utilizing locum tenens
• Verifying registration data at time of scheduling
• Making pre-visit reminder calls
• Patient on-time and no-show rates
• Provider utilization rate
Registration and Eligibility
• Imprecise preregistration process
• Incomplete eligibility verification in advance of the patient care event
• Inconsistent capture of demographics
• High turnover in front-end positions
• Lack of insurance card understanding
• Timely and accurate front-end data collection
• Enhanced preregistration at time of scheduling
• Required fields in practice management system
• Robust and user-friendly eligibility verification tool
• Ongoing training for registration staff
• Number of preregistrations completed prior to visits
• User-specific registration accuracy reports
• Claim rejections and denials related to insurance eligibility or patient demographics
Common Pitfalls Keys to Success Performance Measures
14
Revenue Cycle OverviewFront End
Referral Management
• Unsophisticated system logic for payor requirements
• Unmonitored payor bulletins and incomplete referral requirement grids
• Limited front-end operations accountability
• Training, education, and enhanced front-end staff accountability
• Payor referral requirements review and public summaries
• Frequently updated system logic
• Centralized team
• Review of related denials for process improvement
• Organizational scheduling policies
• Number of authorization denials, segmented by responsible staff
• Number of nonemergent appointments scheduled within payor authorization periods
Arrival/Check-In
• Inconsistent verification and data collection
• Not collecting previous balances
• Placing patient service over fiscal responsibility
• Require training, education, and enhanced front-end staff accountability
• Configure billing system to notify staff of pre-visit balances
• Provide staff scripting for patient collections
• Post POS payments at the site of service
• Total POS collections by user
• Percentage of co-pays collected at POS
• Percentage of self-pay A/R attributable to co-pays not collected at POS
Common Pitfalls Keys to Success Performance Measures
15
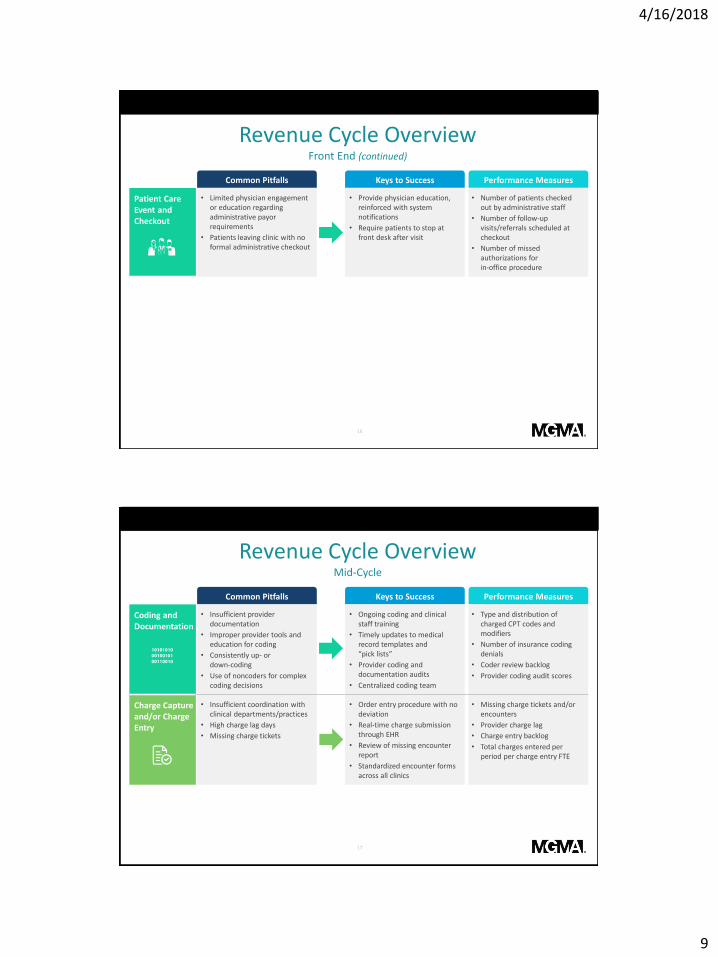
Revenue Cycle OverviewFront End (continued)
4/16/2018
9
16
Revenue Cycle OverviewFront End (continued)
Patient Care Event and Checkout
• Limited physician engagement or education regarding administrative payor requirements
• Patients leaving clinic with no formal administrative checkout
• Provide physician education, reinforced with system notifications
• Require patients to stop at front desk after visit
• Number of patients checked out by administrative staff
• Number of follow-up visits/referrals scheduled at checkout
• Number of missed authorizations for in-office procedure
Common Pitfalls Keys to Success Performance Measures
17
Revenue Cycle OverviewMid-Cycle
Coding and Documentation
• Insufficient provider documentation
• Improper provider tools and education for coding
• Consistently up- or down-coding
• Use of noncoders for complex coding decisions
• Ongoing coding and clinical staff training
• Timely updates to medical record templates and “pick lists”
• Provider coding and documentation audits
• Centralized coding team
• Type and distribution of charged CPT codes and modifiers
• Number of insurance coding denials
• Coder review backlog
• Provider coding audit scores
Charge Capture and/or Charge Entry
• Insufficient coordination with clinical departments/practices
• High charge lag days
• Missing charge tickets
• Order entry procedure with no deviation
• Real-time charge submission through EHR
• Review of missing encounter report
• Standardized encounter forms across all clinics
• Missing charge tickets and/or encounters
• Provider charge lag
• Charge entry backlog
• Total charges entered per period per charge entry FTE
Common Pitfalls Keys to Success Performance Measures
4/16/2018
10
18
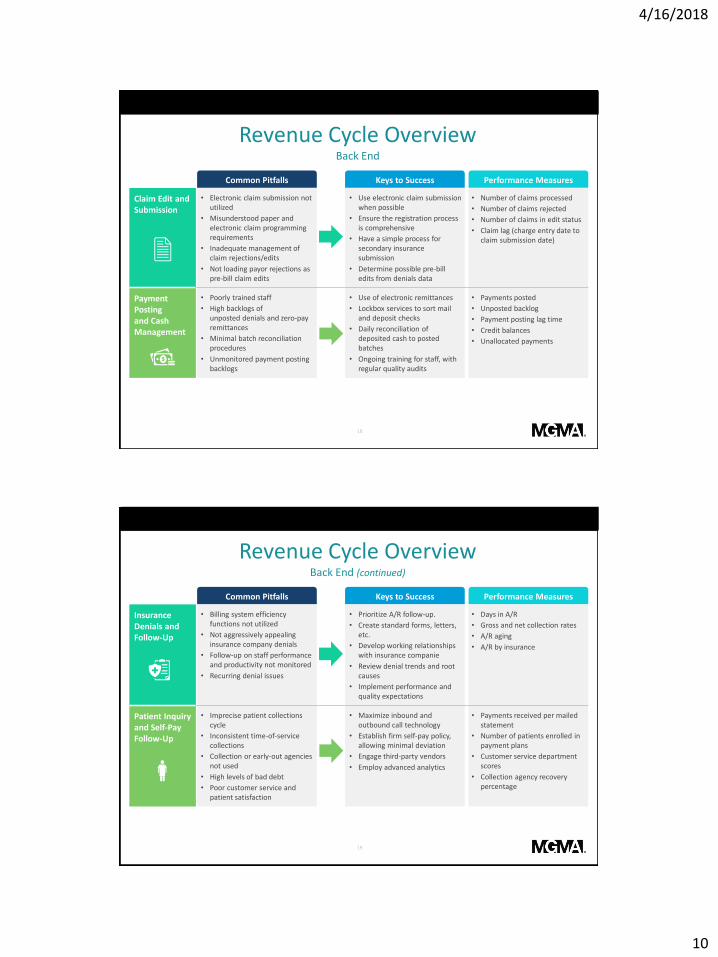
Revenue Cycle OverviewBack End
Claim Edit and Submission
• Electronic claim submission not utilized
• Misunderstood paper and electronic claim programming requirements
• Inadequate management of claim rejections/edits
• Not loading payor rejections as pre-bill claim edits
• Use electronic claim submission when possible
• Ensure the registration process is comprehensive
• Have a simple process for secondary insurance submission
• Determine possible pre-bill edits from denials data
• Number of claims processed
• Number of claims rejected
• Number of claims in edit status
• Claim lag (charge entry date to claim submission date)
Payment Posting and Cash Management
• Poorly trained staff
• High backlogs of unposted denials and zero-pay remittances
• Minimal batch reconciliation procedures
• Unmonitored payment posting backlogs
• Use of electronic remittances
• Lockbox services to sort mail and deposit checks
• Daily reconciliation of deposited cash to posted batches
• Ongoing training for staff, with regular quality audits
• Payments posted
• Unposted backlog
• Payment posting lag time
• Credit balances
• Unallocated payments
Common Pitfalls Keys to Success Performance Measures
19
Revenue Cycle OverviewBack End (continued)
Insurance Denials and Follow-Up
• Billing system efficiency functions not utilized
• Not aggressively appealing insurance company denials
• Follow-up on staff performance and productivity not monitored
• Recurring denial issues
• Prioritize A/R follow-up.
• Create standard forms, letters, etc.
• Develop working relationships with insurance companie
• Review denial trends and root causes
• Implement performance and quality expectations
• Days in A/R
• Gross and net collection rates
• A/R aging
• A/R by insurance
Patient Inquiry and Self-Pay Follow-Up
• Imprecise patient collections cycle
• Inconsistent time-of-service collections
• Collection or early-out agencies not used
• High levels of bad debt
• Poor customer service and patient satisfaction
• Maximize inbound and outbound call technology
• Establish firm self-pay policy, allowing minimal deviation
• Engage third-party vendors
• Employ advanced analytics
• Payments received per mailed statement
• Number of patients enrolled in payment plans
• Customer service department scores
• Collection agency recovery percentage
Common Pitfalls Keys to Success Performance Measures

4/16/2018
11
©2017 MGMA. All rights reserved. 20
Revenue Cycle Overview Key Influencers
• Provider enrollment and credentialing
• Managed care contracting analysis
• Underpayment variance detection
• Business intelligence
• Information systems support
• Legal and compliance
• Staff training and quality oversight
• Scanning, document storage, and retrieval
• Clerical support
• Miscellaneous other functions necessary to support billing operations
SAMPLE INFLUENCERS
Several outside and supporting functions influence the revenue cycle process and require collaboration with a variety of business units across
the medical practice.
Depending on the practice, these functions can be housed within the revenue cycle unit(s), viewed as partnerships across the medical group, or in some cases, supplemented by external vendor support.
• Inconsistent demographic and eligibility verification
• Provider documentation and encounter forms incomplete
• Understanding of revenue cycle varies across management
• Limited management information provided
• Communication between front and back end limited and/or strained
• Process inconsistencies
• Patient balances not collected on front end
• Control points not established to reduce leakage/backlogs
• Staff without access to appropriate tools
• IT modules for increased efficiencies not installed
• Interfaces not established
• Work standards lacking
• Policies and procedures not documented/updated
• Providers, management, and staff not engaged in revenue cycle
• Right work not assigned to right staff
• Staff without adequate system/ process training
21
Revenue Cycle Overview Common Performance Issues
DATA QUALITY ACCOUNTABILITY
PROCESS AND TOOLSMANAGEMENT AND COMMUNICATION
STAFF AND SUPPORT
4/16/2018
12
22
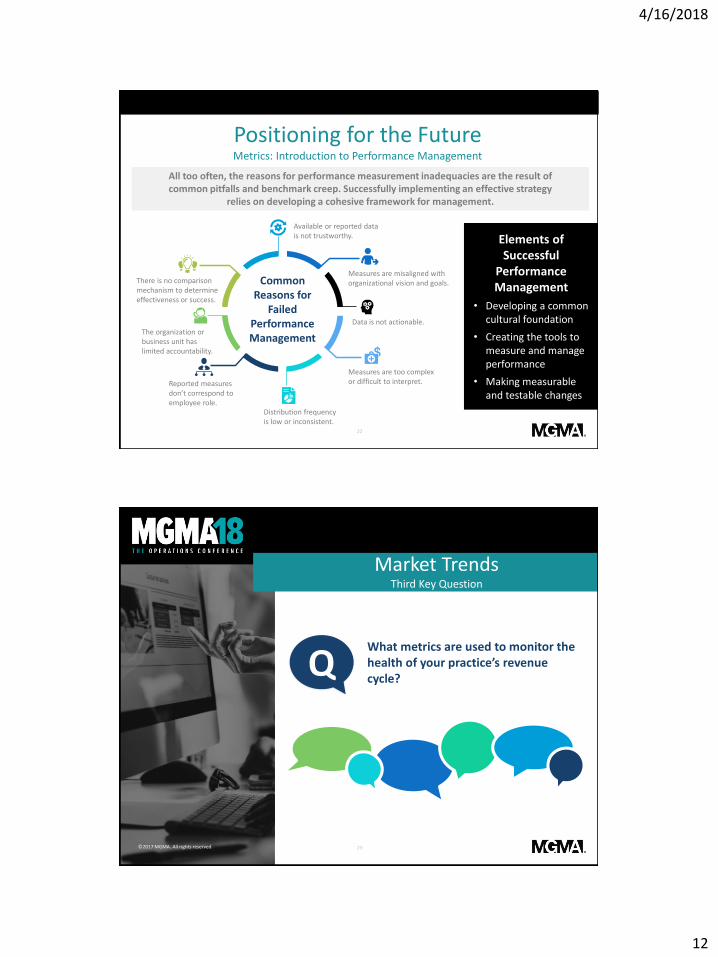
Positioning for the Future Metrics: Introduction to Performance Management
Common Reasons for
Failed Performance Management
Available or reported data is not trustworthy.
Measures are misaligned with organizational vision and goals.
Data is not actionable.
Measures are too complex or difficult to interpret.
Distribution frequency is low or inconsistent.
Reported measures don’t correspond to employee role.
The organization or business unit has limited accountability.
There is no comparison mechanism to determine effectiveness or success.
Elements of Successful
Performance Management
• Developing a common cultural foundation
• Creating the tools to measure and manage performance
• Making measurable and testable changes
All too often, the reasons for performance measurement inadequacies are the result of common pitfalls and benchmark creep. Successfully implementing an effective strategy
relies on developing a cohesive framework for management.
©2017 MGMA. All rights reserved. 23
Market TrendsThird Key Question
QWhat metrics are used to monitor the health of your practice’s revenue cycle?

4/16/2018
13
Positioning for the Future Metrics: Summary
• Gross collection rate
• Net collection rate
COLLECTIONS
• Bad debt as a percentage of charges
• Patient collection efficiency
SELF-PAY
• First-pass denial rate
• Terminal denial rate
DENIALS MANAGEMENT
• Payor mix
• Charge lag
MISCELLANEOUS
• Days in A/R
• A/R aging
A/R
• Patient opening balance
• Revenue
• Write-offs
• Miscellaneous
PRODUCTIVITY
High-performing organizations ensure a culture of accountability through constant communication,
education, and reporting on revenue cycle performance.
A provider’s financial well-being is nearly always tied to the revenue cycle of the clinical practice. A clearly defined and understood suite of KPIs is necessary to
ensure appropriate engagement and support.
©2017 MGMA. All rights reserved. 25
Positioning for the Future Metrics: Productivity
PATIENT OPENING BALANCE
Charges: Set by provider organization and defined as the dollar value for services performed
REVENUE
• Gross Collections: Total debit payments collected by an organization
• Refunds: Returned credit balances that result from erroneous payment to the provider when there is no open balance or the issuing party is not responsible
WRITE-OFFS
• Controllable Write-Offs: Typically uncollectible payor-initiated denials or self-pay balances
• Non-controllable Write-Offs: Adjustments that are typically not expected to be recovered (e.g., write offs)
MISCELLANEOUS
• Work RVUs (WRVUs): Provider component of a total relative value unit (RVU) measure, set by CMS at the CPT level
• Patient Visits: Count of patient visits within a certain period
• CPT Volumes: Count of all CPT code units generated within certain a period
There are several transaction-based figures a medical group should use to monitor provider productivity and revenue cycle volumes.
4/16/2018
14
26
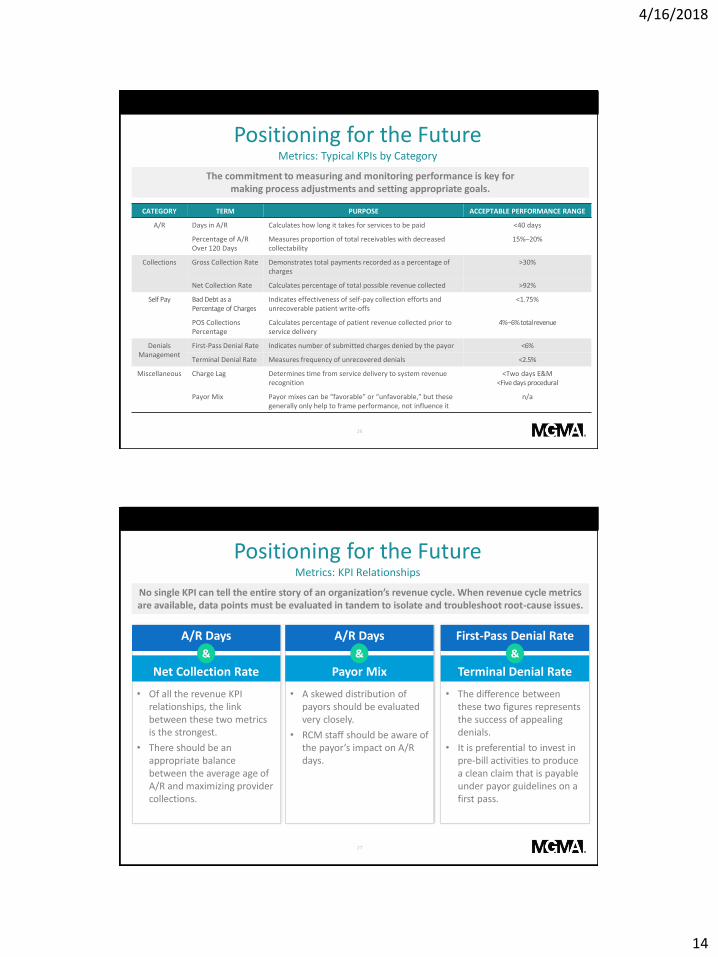
Positioning for the Future Metrics: Typical KPIs by Category
CATEGORY TERM PURPOSE ACCEPTABLE PERFORMANCE RANGE
A/R Days in A/R Calculates how long it takes for services to be paid <40 days
Percentage of A/R Over 120 Days
Measures proportion of total receivables with decreased collectability
15%–20%
Collections Gross Collection Rate Demonstrates total payments recorded as a percentage of charges
>30%
Net Collection Rate Calculates percentage of total possible revenue collected >92%
Self Pay Bad Debt as a Percentage of Charges
Indicates effectiveness of self-pay collection efforts and unrecoverable patient write-offs
<1.75%
POS Collections Percentage
Calculates percentage of patient revenue collected prior to service delivery
4%–6% total revenue
Denials Management
First-Pass Denial Rate Indicates number of submitted charges denied by the payor <6%
Terminal Denial Rate Measures frequency of unrecovered denials <2.5%
Miscellaneous Charge Lag Determines time from service delivery to system revenue recognition
<Two days E&M<Five days procedural
Payor Mix Payor mixes can be “favorable” or “unfavorable,” but these generally only help to frame performance, not influence it
n/a
The commitment to measuring and monitoring performance is key formaking process adjustments and setting appropriate goals.
27
Positioning for the Future Metrics: KPI Relationships
• Of all the revenue KPI relationships, the link between these two metrics is the strongest.
• There should be an appropriate balance between the average age of A/R and maximizing provider collections.
A/R Days
Net Collection Rate
&
• A skewed distribution of payors should be evaluated very closely.
• RCM staff should be aware of the payor’s impact on A/R days.
A/R Days
Payor Mix
&
• The difference between these two figures represents the success of appealing denials.
• It is preferential to invest in pre-bill activities to produce a clean claim that is payable under payor guidelines on a first pass.
First-Pass Denial Rate
Terminal Denial Rate
&
No single KPI can tell the entire story of an organization’s revenue cycle. When revenue cycle metrics are available, data points must be evaluated in tandem to isolate and troubleshoot root-cause issues.

4/16/2018
15
28
Positioning for the FutureMetrics: KPI Relationships (continued)
These KPI relationships are not exhaustive, but do represent the primary metrics an organization
should use when evaluating performance.
• If A/R days are high and bad debt is low, it could mean no bad debt placements have been issued recently.
• High bad debt placement and lower A/R days could indicate a premature bad debt adjustment and minimal attention to/effort regarding self-pay and bad-debt accounts.
A/R Days
Bad Debt as a Percentage of Charges
&
• High bad debt can often be explained by a large self-pay component in the payor mix.
• Payors with high portions of patient cost sharing could indicate an above-average self-pay balance placement.
Payor Mix
Bad Debt as a Percentage of Charges
&
• There is value in reviewing raw transaction volumes to ensure corresponding rates of growth.
• A provider should monitor collections, contractual adjustments, and charges together to determine root causes for swings in gross collections and/or A/R.
TransactionVolumes Trending
29
Positioning for the Future Organizational Structure and Governance
DECENTRALIZED CENTRALIZED
Director of
Revenue Cycle
Billing Office
Manager
A/RCash Applications
Data Control
Customer Service
Revenue
Enhancement
Insurance Follow-Up
Denials
Management
Patient Follow-Up
Adjustment Posting
Eligibility
Verification
Referrals and
Authorization
Claim Submission
Statements
Payment Posting
Credit Balances
and Refunds
Patient Inquiries
Financial
Counseling
Scheduling
Claim Edits
Cash Controls
Reporting
Mail Distribution
and Clerical
System
Maintenance
Decentralized
Front-End
Operations
Registration
Coding Education
and Support
Cashiering
Charge Entry
Director of Clinic
Operations
Clinic Manager
Our experience is that most moderately-sized physician groups find success deploying a hybrid organizational model, which leverages economies of scale while also locating functional
responsibilities where it can be serviced most efficiently.
4/16/2018
16
©2017 MGMA. All rights reserved.
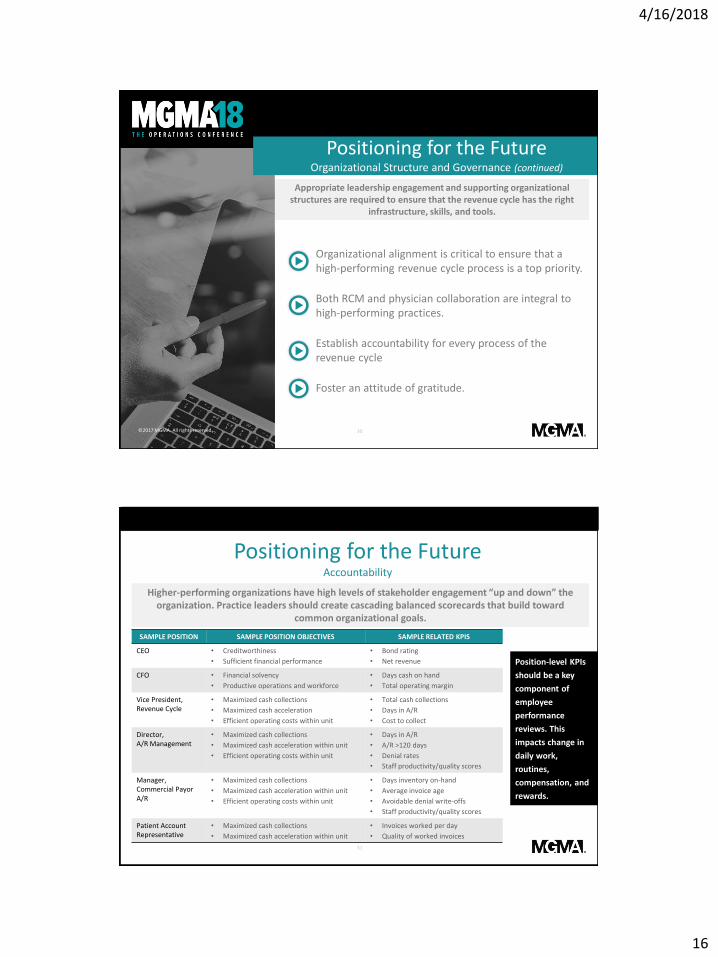
Organizational alignment is critical to ensure that a high-performing revenue cycle process is a top priority.
Both RCM and physician collaboration are integral to high-performing practices.
Establish accountability for every process of the revenue cycle
Foster an attitude of gratitude.
30
Positioning for the Future Organizational Structure and Governance (continued)
Appropriate leadership engagement and supporting organizational structures are required to ensure that the revenue cycle has the right
infrastructure, skills, and tools.
31
Positioning for the Future Accountability
SAMPLE POSITION SAMPLE POSITION OBJECTIVES SAMPLE RELATED KPIS
CEO • Creditworthiness
• Sufficient financial performance
• Bond rating
• Net revenue
CFO • Financial solvency
• Productive operations and workforce
• Days cash on hand
• Total operating margin
Vice President, Revenue Cycle
• Maximized cash collections
• Maximized cash acceleration
• Efficient operating costs within unit
• Total cash collections
• Days in A/R
• Cost to collect
Director, A/R Management
• Maximized cash collections
• Maximized cash acceleration within unit
• Efficient operating costs within unit
• Days in A/R
• A/R >120 days
• Denial rates
• Staff productivity/quality scores
Manager, Commercial Payor A/R
• Maximized cash collections
• Maximized cash acceleration within unit
• Efficient operating costs within unit
• Days inventory on-hand
• Average invoice age
• Avoidable denial write-offs
• Staff productivity/quality scores
Patient Account Representative
• Maximized cash collections
• Maximized cash acceleration within unit
• Invoices worked per day
• Quality of worked invoices
Position-level KPIs
should be a key
component of
employee
performance
reviews. This
impacts change in
daily work,
routines,
compensation, and
rewards.
Higher-performing organizations have high levels of stakeholder engagement “up and down” the organization. Practice leaders should create cascading balanced scorecards that build toward
common organizational goals.
4/16/2018
17
©2017 MGMA. All rights reserved.
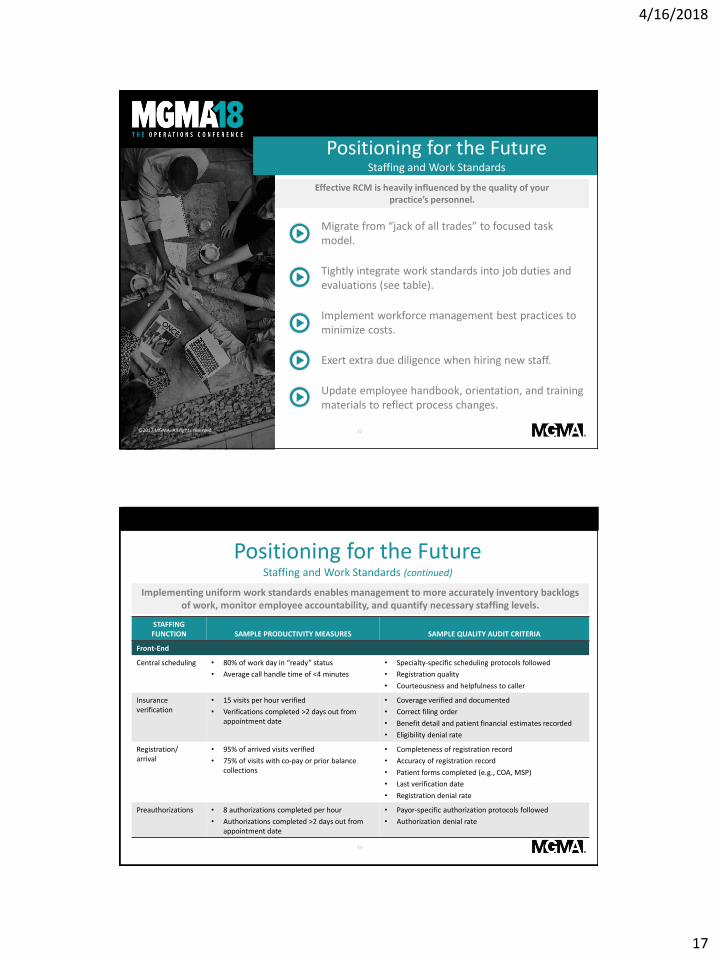
Migrate from “jack of all trades” to focused task model.
Tightly integrate work standards into job duties and evaluations (see table).
Implement workforce management best practices to minimize costs.
Exert extra due diligence when hiring new staff.
Update employee handbook, orientation, and training materials to reflect process changes.
32
Positioning for the Future Staffing and Work Standards
Effective RCM is heavily influenced by the quality of your practice’s personnel.
33
Positioning for the Future Staffing and Work Standards (continued)
STAFFING FUNCTION SAMPLE PRODUCTIVITY MEASURES SAMPLE QUALITY AUDIT CRITERIA
Front-End
Central scheduling • 80% of work day in “ready” status
• Average call handle time of <4 minutes
• Specialty-specific scheduling protocols followed
• Registration quality
• Courteousness and helpfulness to caller
Insurance verification
• 15 visits per hour verified
• Verifications completed >2 days out from appointment date
• Coverage verified and documented
• Correct filing order
• Benefit detail and patient financial estimates recorded
• Eligibility denial rate
Registration/arrival
• 95% of arrived visits verified
• 75% of visits with co-pay or prior balance collections
• Completeness of registration record
• Accuracy of registration record
• Patient forms completed (e.g., COA, MSP)
• Last verification date
• Registration denial rate
Preauthorizations • 8 authorizations completed per hour
• Authorizations completed >2 days out from appointment date
• Payor-specific authorization protocols followed
• Authorization denial rate
Implementing uniform work standards enables management to more accurately inventory backlogs of work, monitor employee accountability, and quantify necessary staffing levels.

4/16/2018
18
34
Positioning for the Future Staffing and Work Standards (continued)
STAFFING FUNCTION SAMPLE PRODUCTIVITY MEASURES SAMPLE QUALITY AUDIT CRITERIA
Mid-Cycle
Coding • 12 professional E&M abstractions per hour
• 8 professional surgical abstractions per hour
• 10 technical ancillary abstractions per hour
• 6 procedural ancillary abstractions per hour
• 2 days to final abstraction
• Coding audit score
• Coding denial rate
Charge entry • 45 keyed encounters per hour
• 20 charge corrections per hour
• Charge lag of >1 day
• Accuracy against charge tickets
• Charge entry–related denial rate
Back-end
Registration/arrival
• 20 claim edits per hour • Accuracy against documented claim edit resolution processes
Preauthorizations • 15 no-response accounts per hour
• 8 denied accounts per hour
• Maximum age of seven days in queue
• Timely resolution
• Clear and concise documented actions
• Balanced with write-offs
• Action taken based on documented process
• Appropriate cross-unit engagement (e.g., coding)
• Percentage resolved with expected outcome
35
Positioning for the Future Staffing and Work Standards (continued)
STAFFING FUNCTION SAMPLE PRODUCTIVITY MEASURES SAMPLE QUALITY AUDIT CRITERIA
Back-end (continued)
Payment posting • 150 manual lines posted per hour
• 20 electronic-posted rejections resolved per hour
• Payment file age of >2 days
• Accuracy against ERAs and EOBs
• Missed contractual adjustments
• Reconciliation to deposits
Credit balance • 10 credit balances resolved per hour • Accuracy against documented credit balance resolution processes
• Balanced with write-offs rather than issued refunds
• Auto-recoupment in lieu of manually issued refunds
• Reconciliation to generated refunds
Self-pay and customer service
• 80% of work day in “ready” status
• 80% of outbound calls resulting in patient payment or enrollment in payment plan
• Average self-pay call handle time of <4 minutes
• Average customer service call handle time of <6 minutes
• Accuracy against documented issues resolution processes
• Percentage of calls resolved in one call
• Clear and concise documented actions
• Balanced with write-offs
• Use of proper tone, empathy, and courteousness with patient/caller

4/16/2018
19
36
Positioning for the Future Outsourcing
OUTSOURCING CHECKLIST
Defined policies, procedures, work standards, and business rules.
Measurable milestones and deliverables to meet the strategic and operational goals of the organization.
Regular reporting and oversight to ensure adherence to the above.
Clear understanding of the outsourcing team’s size, skill set(s), commitment, and competing responsibilities.
Transparency for the patient (e.g., he/she should not know that customer service/billing staff are not employees of the group).
Near-seamless integration with the clinical enterprise (e.g., the clinic staff should not notice a difference).
Many practices are evaluating the use of outside partners to manage or support the revenue cycle process in order to maintain focus on quality care, improve the patient’s administrative
experience, address skilled labor shortages, and sometimes curb costs.
©2017 MGMA. All rights reserved. 37
Positioning for the FutureFifth Key Question
QWhat successes or lessons learned has your organization had with third-party vendor support arrangements?

4/16/2018
20
38
Positioning for the Future RCM Technology
TECHNOLOGY BENEFITS CONSIDERATIONS
Insurance Eligibility Tools • Increases the percentage of insured patients
• Decreases the number of claims denied, total days in A/R, and bad debt
• Creates additional resource constraints prior to an appointment
• Requires training of medical office staff who will discuss eligibility with patients
Patient Payment Portals • Increases patient awareness with respect to payment responsibility
• Reduces the need for paper bills and collection follow-up
Necessitates integration with an organization’s billing system to avoid inefficiencies in payment posting processes
Computer-Assisted Coding (CAC) Software
• Poses a prospective solution to bridge the gap in the loss of productivity due to ICD-10
• Reduces the need for time-consuming provider coding training
• Creates the potential for additional inaccuracies and increases the need for auditing
• Can only interpret findings that are documented electronically
Denials Management Tools Helps prevent and prioritize denials Requires active management of the system
Implementations that involve both IT and operations personnel are most likely to experience the highest
level of success.
Technology integrated with practice management (PM) systems has the ability to accurately automate many RCM processes, which effectively increases cash flow, decreases staffing need,
and reduces redundant costs.
©2017 MGMA. All rights reserved. 39
Positioning for the FutureFifth Key Question
QWhat unique or innovative technologic tools has your practice integrated into the revenue cycle? Does your organization have near-term plans to implement a new technology?

4/16/2018
21
©2017 MGMA. All rights reserved.
RECOMMENDATIONS• Complete an operational assessment, benchmarking your
organization’s financial performance against available industry data.
• Determine and formalize KPIs to measure and improve performance, creating shared accountability across the organization.
• Standardize and automate processes and tools.
• Invest in new technologies to improve revenue cycle management and the patient experience.
• Evaluate and implement practices that are patient-friendly and will improve patient engagement.
• Develop a best-in-class governance model and team structure to increase integration and communication.
• Centralize functions that can be easily managed remotely, leading to reduced costs and improved efficiencies.
40
Conclusion
As the industry evolves, provider organizations will need to continue to make adjustments to attain revenue cycle excellence.
Thank You.
Malita [email protected]
571-257-1014ECG Management Consultants3030 Clarendon Blvd, Ste 600
Arlington, VA 22201
Andrew [email protected]
206-701-7663ECG Management Consultants
1111 Third Ave, Ste 2500Seattle, WA 98101
4/16/2018
22
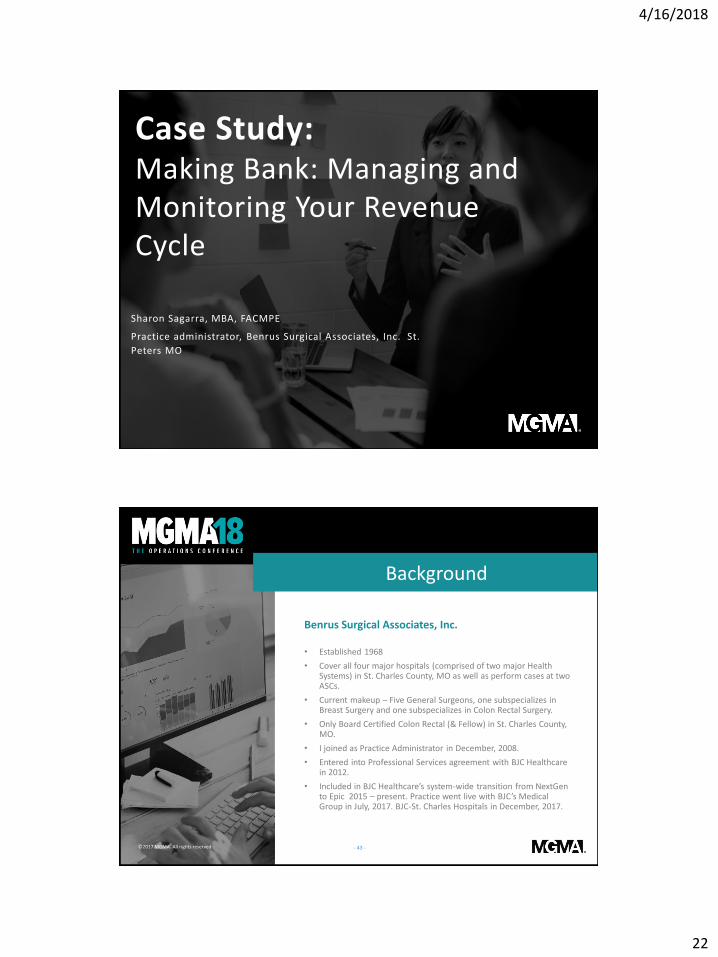
Case Study: Making Bank: Managing and Monitoring Your Revenue Cycle
Sharon Sagarra, MBA, FACMPE
Practice administrator, Benrus Surgical Associates, Inc. St.
Peters MO
©2017 MGMA. All rights reserved. - 43 -
Benrus Surgical Associates, Inc.
• Established 1968
• Cover all four major hospitals (comprised of two major Health Systems) in St. Charles County, MO as well as perform cases at two ASCs.
• Current makeup – Five General Surgeons, one subspecializes in Breast Surgery and one subspecializes in Colon Rectal Surgery.
• Only Board Certified Colon Rectal (& Fellow) in St. Charles County, MO.
• I joined as Practice Administrator in December, 2008.
• Entered into Professional Services agreement with BJC Healthcare in 2012.
• Included in BJC Healthcare’s system-wide transition from NextGen to Epic 2015 – present. Practice went live with BJC’s Medical Group in July, 2017. BJC-St. Charles Hospitals in December, 2017.
Background

4/16/2018
23
©2017 MGMA. All rights reserved. - 44 -
Change in Processes
Process prior to 6/2017• Paper Charts
• Paper Encounter Forms
• Referral/reports received from PCP by fax
• Collect co-pays at TOS
• Phone/website insurance verification (as time allowed)
• Dependent on Surgeons turning in coded encounter forms
• Batch, manual charge entry
• CBO Tasks through NextGen
Current Process• One patient/One Chart
(electronic)
• Electronic referrals WQ
• Care Everywhere
• Collect co-pays at TOS
• Real-Time Eligibility (RTE)
• Charge Capture at end of each Office Visit/Surgery
• Claim WQs
• Manual charge entry for non-BJC facilities once a week
• InBasket folder for CRM communications with CBO
• Consolidated statements across the Health System
- 45 -©2017 MGMA. All rights reserved.
Revenue Cycle Process
Prior to Appointment
• Live Staff members answer phones (including me sometimes) to schedule
appointments
• If patient in system, verify demographics/insurance coverage, etc.
• If new patient, capture as much data as possible
• Run Real-Time Eligibility (RTE), inform patient of expected co-pay at TOS
• Steer patient to our website to download medical history forms or instruct to
answer questionnaire in patient portal
• One to two days prior to appointment, staff member verifies what information still
required; referral attached to chart or scanned

4/16/2018
24
- 46 -©2017 MGMA. All rights reserved.
Revenue Cycle Process
Appointment
• Re-verify phone numbers (for surgery scheduler/hospital pre-admit staff)
• Scan photo ID and insurance cards
• Obtain electronic signatures, including for Care Everywhere access
• Scan medical history and medication lists, if needed
• Collect Co-pays ($50 for self-pay patients) and attempt to obtain self-pay
outstanding balances (system-wide) or give patient CBO information to
discuss financial assistance/payment plans
Surgery Scheduling
• Surgery scheduler obtains any pre-auths/pre-certs for tests and surgeries
mainly on-line or by phone/fax, if necessary
©2017 MGMA. All rights reserved. - 47 -
Charge Capture
Office Visits
• Surgeon selects LOS and any in-office procedures at end of appointment
• Charges go into either clean claims or coding review (or registration review) WQ
• I review for modifiers, correct coding & release for billing
• CBO has access to all notes/referrals/scanned media for appeals
Hospitals
• Consult/subsequent visits charge capture while rounding at BJC facilities through group patient list or through patient chart
• Surgeries at BJC facilities –either charge capture after surgery or after signing off on final OP note
• Staff member/surgery scheduler prepares consult/surgery paper encounter forms for non-BJC facilities

4/16/2018
25
©2017 MGMA. All rights reserved. - 48 -
Reporting
Charge Capture
• Open Encounters
Reconciliation
• OR Scheduled Surgery
Case Reconciliation Report
• Hospital Note Charge
Reconciliation Report
Productivity/AR
• Copay Collection-past
month
• Registration Verification
Rate
• Referral Productivity
• Accounts Receivable by
Payer
• Denials Summary
• Non Contractual write-offs
• Accounts Receivable Aging
- 49 -©2017 MGMA. All rights reserved.
My Dashboard

4/16/2018
26
- 50 -©2018 MGMA. All rights reserved.
Continuing Education ACMPE credit for medical practice executives…………... 1.5
*AAPC Core A credit ……………….…………………………… 1.5
ACHE credit for medical practice executives…………..…. 1.5CME AMA PRA Category 1 Credits™……………………….. 1.5CNE credit for continuing nurse education …………….... 1.5
*CPE credit for certified public accountants (CPAs)……….. 1.8
CEU credit for generic continuing education………..……. 1.5
*AAPC CODE: 5 8 7 5 9 K Y N*CPE CODE: 3 0 1 C
Let the speakers know what you thought!Evaluations will be emailed to you daily.
Thank You.
Sharon Sagarra
636-926-2041
Benrus Surgical Associates, Inc.
6 Jungermann Cir
Ste 205
St. Peters, MO 63376