making conservation and restoration count · pih xs xli izspyxmsr sj wtigmiw xlex evi jsyrh mr rs...
TRANSCRIPT
Making Conservation and Restoration Count
Guidance for Effective Monitoring and Evaluation

1
The Case for Monitoring
Making Monitoring an Integral Part of the Plan
Elements of an Effective Monitoring Plan
Mon aitoring at the L ndscape Level 1
Synthesis and E aluation of Monitoring Resultv s 1
Conclusion 18
Contents
4
6
8
4
7
2
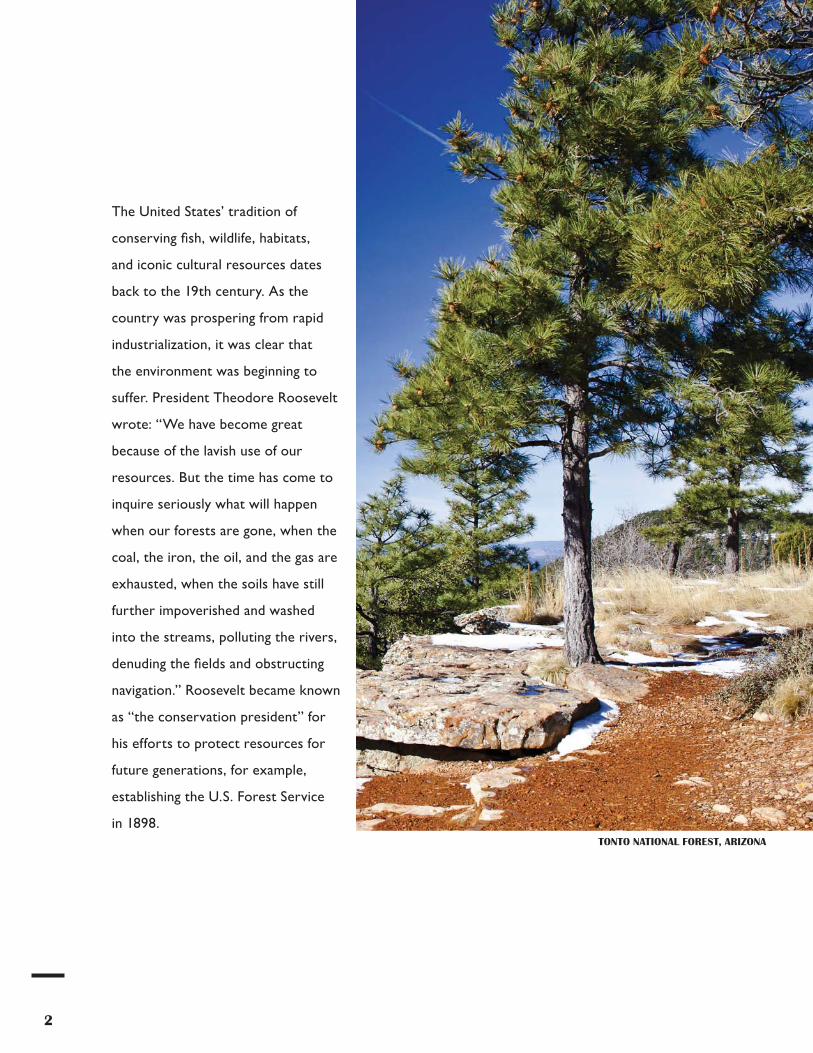
TONTO NATIONAL FOREST, ARIZONA
The United States’ tradition of

3
SEDIMENT IS SLOWLY REBUILDING EAST TIMBALIER ISLAND, LA, TO ITS ORIGINAL FOOTPRINT.

4
H
The Case for Monitoring
OYSTER HARVESTING, CHESAPEAKE BAY

5
FIGURE 1 ������������� ��������������������������������������� ��photo A������������������������ ��������������� ��������������� !��"�!��� #�������photo B�$�������������� ��������������%$����� ������������� ��&�"�!��� #����������������������photo C��'
6
I
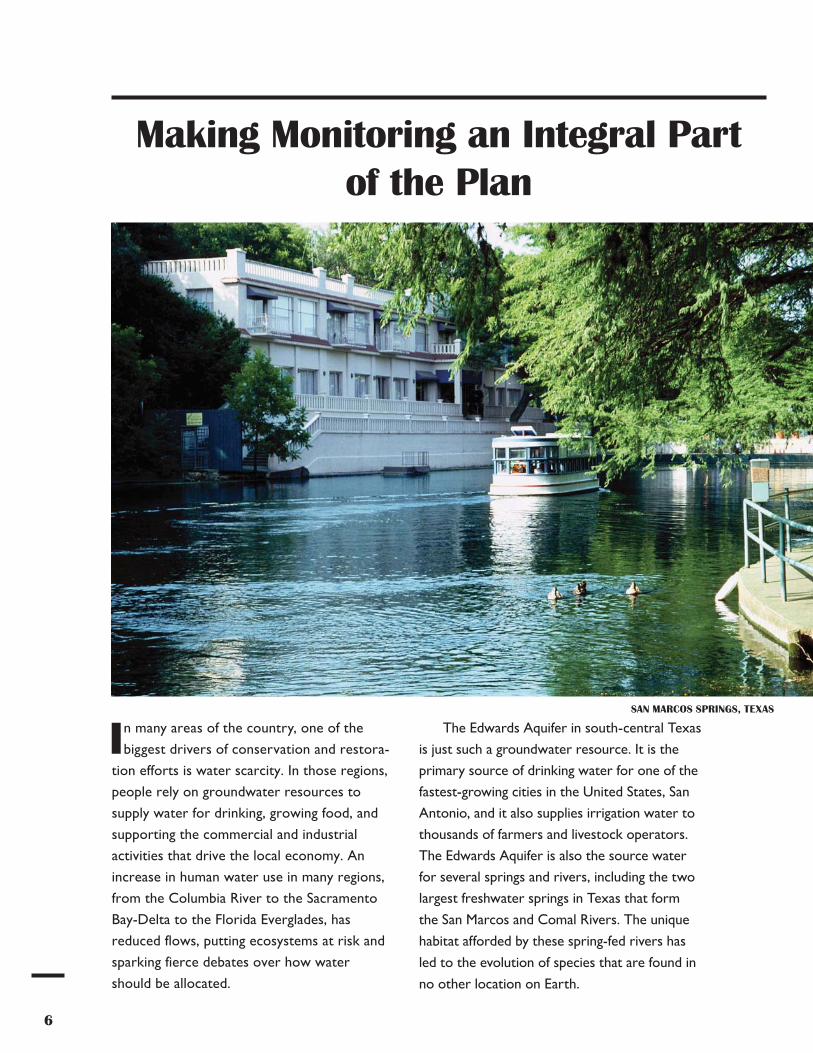
Making Monitoring an Integral Part of the Plan
SAN MARCOS SPRINGS, TEXAS

7
ENDANGERED SPECIES: (LEFT) FOUNTAIN DARTER, IN THE SAN MARCOS AND COMAL RIVERS, AND (RIGHT) TEXAS WILD RICE, IN THE UPPER SAN MARCOS RIVER.

8
I Deepwater
Horizon
Deepwater Horizon
Elements of an Effective Monitoring Plan
GREEN SEA TURTLE GRAZING SEAGRASS

9
The Deepwater Horizon
Deepwater Horizon
construc-tion monitoring
performance monitoring
FIGURE 2 (�� ���������!����������!�����!��������������� ��������������!��&���������������&��!��'���������!�!����������������������������������� ������blue box����������&��!���green boxes����������������������������������red box�'��������������!�����!������������ �������)���� ���������������purple boxes�������������������������'�*������������������������������������������������ ������������'��������&�����������������������������������������&���������������������$�����������������������&����������&����������������������������������������'

monitoring for adaptive management
Construction Monitoring.
Performance Monitoring.
Monitoring for Adaptive Manage-ment.
Metrics
SEA TURTLE HATCHLING AND EGGS
10

11
The appropriate spatial and temporal scale
encounter different threats in different as baseline data
FIGURE 3 ����������!���������������!�����&���������������������������������������������������&������������������!!����������'�����������&������+����������������"����������������������������������������������&������������������������������,�������!�����������������������������&�������������'������������������������������������&���������������������������������!�������$���,�������!��$�����!�!�����!��������$����������&�����$���������������$�������������&��!�������������!����'

reference and control sites
Understanding the constraints
Standards for Data Collection and Stewardship
Tnd
data management plan
MONITORING OIL EXPOSURE IN THE GULF OF MEXICO
12

When to Use Adaptive Management
B
intervention;
FIGURE 4. A decision tree to determine whether a project would benefit from adaptive management
13
14
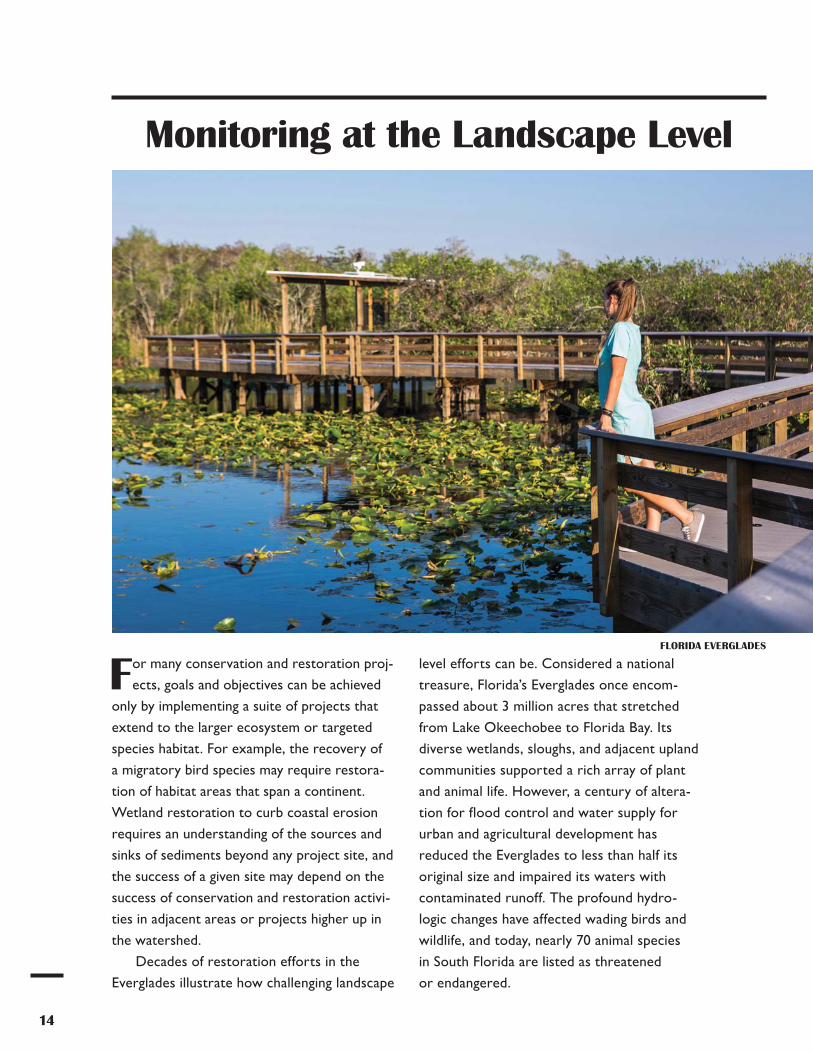
Monitoring at the Landscape Level
F
requires an understanding of the sources and
success of conservation and restoration activi
FLORIDA EVERGLADES

15
WHOOPING CRANE, EVERGLADES

16
DCollaboration at the Landscape Level
GREATER SAGE-GROUSE
17
Synthesis and Evaluation of Monitoring Results
S
contract and grant program
SEA TURTLE HATCHLING
18
ConclusionIneed to conserve functioning
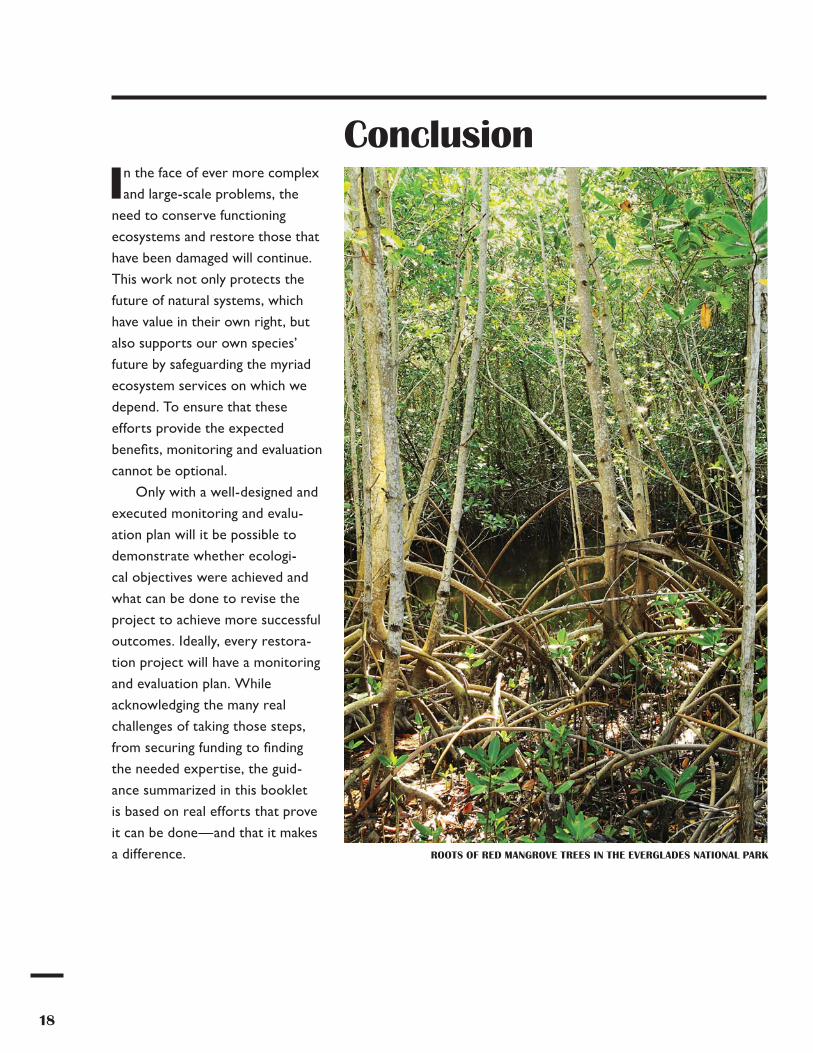
ROOTS OF RED MANGROVE TREES IN THE EVERGLADES NATIONAL PARK

Effective Monitoring to Evaluate Ecological Restoration in the Gulf of Mexico
Deepwater Horizon
Review of the Edwards Aquifer Habitat Conservation Plan
A Review of the Landscape Conservation Cooperatives
Progress Toward Restoring the Everglades, The Fifth Biennial Review.
Conservation Planning: Informed Decisions for a HealthierPlanet
Photo CreditsCover (front) Shane Myers Photography/Shutterstock1 Tom Roche / Shutterstock2, 7, 11, 16, Cover (back) ©NOAA4 E. Guy Stephens Southern Maryland Photography 5, 6 ©Edwards Aquifer Authority
9 italiansight / iStockphoto13 Yullia Podusova / Shutterstock14 Courtesy of David Policansky15 U.S. Department of the Interior17 Rudy Umans/Shutterstock
Copyright National Academy of Sciences 2017. All rights reserved.
About
