making ends meet after the great recession income...making ends meet after the great recession: the...
TRANSCRIPT
Making Ends Meet After the Great Recession:
The 2010 Living Income Standard for North Carolina
By Alexandra Forter Sirota with Edwin McLenaghan
NC BUDGET & TAX CENTERA project of the
NORTH CAROLINA JUSTICE CENTER

Making Ends Meet After the Great Recession:
The 2010 Living Income Standard for North Carolina
By Alexandra Forter Sirota with Edwin McLenaghan
NC BUDGET & TAX CENTERA project of the
NORTH CAROLINA JUSTICE CENTER
OVERVIEW
Work provides not only the ability to meet the most basic human needs but alsoaccess to new opportunities and a sense of dignity and purpose, all of which havedriven America’s economic growth for generations.
For many in North Carolina, however, work falls far short of its promise. Almost 35percent of North Carolinians in 2009 earned low incomes while working, and thenumber and proportion of such families has risen since 2000.1
During the last decade, the number of low-wage work opportunities grew at agreater rate than the number of well-paying jobs with benefits. Then the GreatRecession struck, creating significant job loss and devastating the finances of workerswho did not earn enough to build substantial nest eggs of savings and assets. Thisone-two punch of the prevalence of low-wage work and the Great Recession has
contributed to theaccelerated growthin the strugglesworking familiesface on a day-to-daybasis. These dailychallenges canquickly becomegenerationalstruggles as low-wage jobs are lesslikely to supportchildren’s healthydevelopment andincreasingly candoom children to alifetime of lowearnings and limitedeconomic mobility.2
Restoring not onlythe promise of work but also the opportunity for well-paying jobs with benefits is thecentral challenge confronting North Carolina as the state maps its course out of theGreat Recession.
Yet, without a meaningful measure of the economic pressures facing low-wage
NC Budget and Tax Center2
families, it is difficult todetermine the scope of thechallenge and guide a response.The failure of the Federal PovertyLevel to capture the full range offactors contributing to economichardship and the prolongederosion in the value of theminimum wage have left a needfor statistics that enablepolicymakers to better understandthe lives of low-wage workingfamilies.3
To that end, the North CarolinaBudget and Tax Center created the Living Income Standard (LIS), a market-basedapproach to estimating how much income a working family with children must earn
in order to pay for basic expenses. The LIS provides aconservative estimate of how much it truly costs to makeends meet in the state. First released in 2001, the Budgetand Tax Center has updated the LIS periodically toaccount for economic changes and improvements inmethodology.
This 2010 version of the Living Income Standard finds thatthe North Carolina family of two adults and two childrenmust earn $48,814 annually—an amount equal to 221percent of the federal poverty level—to afford the actualcosts of seven essential expenses: housing, food,childcare, health care, transportation, taxes and othernecessities (like clothing, personal care items, household
supplies, school supplies and local telephone service). To meet that level, the adultsin the average four-person family would need to earn a combined $23.47 per hourand work 40 hours a week, 52 weeks a year.
This special report of the Budget and Tax Center updates the LIS with the most recenteconomic data, describes job growth trends that impact families’ earnings, discussesthe role of low-wage work in holding families below the LIS and presents strategiesfor helping more low-income families share in the state’s prosperity.
THE 2010 LIVING INCOME STANDARD FOR NORTH CAROLINA 3

LOW-WAGE WORK AND THE GREATRECESSION
The last edition of the Living Income Standard, publishedin 2008, provided an analysis of the growth in jobs from
1990 to 2006, just before the onset of the Great Recession.During that period, North Carolina’s economy transformedfrom one based predominantly on manufacturing to onegrowing rapidly in the areas of technology, health care,finance and services (professional services, food service,etc.).
While there were well-paying positions available forworkers with advanced degrees, quality jobs for thosewithout post-secondary education in industries such asmanufacturing disappeared and were replaced by low-wage work. From 1990 to 2006, nearly 900,000 jobs werecreated in North Carolina, primarily in the professional andbusiness service and education and health serviceindustries, and the vast majority of these positions hadannual average earnings lower than the LIS, set at that timeat $19 per hour.4
Then the Great Recession hit. North Carolina lost morethan 320,000 jobs from December 2007, when therecession began, to February 2010, when employment hitits lowest point. As of May 2011, North Carolina’s jobshortfall stood at nearly 480,000, reflecting not only thejobs lost but also the jobs needed to match the growth inthe state’s working-age population.5
But which jobs exactly were lost over the official period ofthe Great Recession (December 2007 to June 2009) inNorth Carolina? The industries hardest hit wereconstruction, which lost 24 percent of its employment base,and manufacturing, which lost 16.6 percent of itsemployment base over that period. These two industrieshave traditionally provided family-sustaining wages forworkers with only high-school diplomas. North Carolina,like the nation, will increasingly see fewer employmentopportunities that can sustain middle-class status for peoplewho have not completed some post-secondary education.6
The Decline of Occupations that Pay a Living Wage
Increasingly, economists are turning to not only analysis ofindustry trends but also the more fine-grained analysis ofoccupational trends. This is because in the moderneconomy, demand for workers is more tightly connected tooccupations—and the role those occupations play in theeconomy—than the industry where those workers maywork. There can be wide variation of earnings within an
NC Budget and Tax Center4
SOURCE: Current Employment Statistics, December 1990, 2007, 2010
FIGURE 1:
Long‐term Shifts in Employment by Industry Accelerated during the Great Recession
n Mining and Loggingn Constructionn Manufacturingn Trade,
Transportation, and Utilities
n Informationn Professional and
Business Servicesn Educationn Leisure and
Hospitality Servicesn Other Servicesn Government
n Mining and Loggingn Constructionn Manufacturingn Trade,
Transportation, and Utilities
n Informationn Professional and
Business Servicesn Educationn Leisure and
Hospitality Servicesn Other Servicesn Government
n Mining and Loggingn Constructionn Manufacturingn Trade,
Transportation, and Utilities
n Informationn Professional and
Business Servicesn Educationn Leisure and
Hospitality Servicesn Other Servicesn Government

industry, and thereforelooking only at industrygrowth trends and wagelevels will result in amisleading assessment of jobquality.7
Since the start of the GreatRecession, three of the five occupations thatexperienced the strongestjob growth paid more thanthe Living Income Standardfor a family of three. Lossessustained over the GreatRecession period and morerecent recovery to 2010were concentrated inoccupations paying less thanthe Living Income Standard.These job losses have meantmany North Carolinaworkers earning the lowestwages have been hit thehardest. Moving forward andanalyzing the trends inspecific occupations overthe next ten years, the datashows that job growth willbe concentrated inoccupations paying below the living income standard.
According to the recently released State of the Workforce report by the Commission on Workforce Development,this growth in low-wage occupations will likely continue over the next ten years.8 Of the twenty occupationsprojected to have the highest growth rates from 2010 to 2020, only six pay average wages that meet the current
THE 2010 LIVING INCOME STANDARD FOR NORTH CAROLINA 5
SOURCE: Occupational Employment and Wages, 2007 and 2010 for 2-Digit SOC Codes. Living Income Standard is for a three-person family: one adult, two children.
SOURCE: N.C. Commission on Workforce Development, June 2011. Living Income Standard is for a three-person family: one adult, two children.
FIGURE 3:
Projected Job Growth Concentrated in Occupations Paying Below Living Income Standard
n Above the Living Income Standard for a Family of Three
Percent Average Average change in Hourly Annual employment Wage Wage Above
Occupation (2007 to 2010) (2010) (2010) LIS?
Community and Social Services ‐17.5% $18.34 $38,152 NoHealthcare Support ‐15.6% $11.53 $23,986 NoComputer and Mathematical ‐15.4% $35.79 $74,439 YESHealthcare Practitioners and Technical ‐13.4% $31.68 $65,893 YESLegal ‐12.9% $37.79 $78,593 YESProtective Service ‐10.8% $16.48 $34,285 NoPersonal Care and Service ‐8.8% $11.08 $23,045 NoArts, Design, Entertainment, Sports, and Media ‐7.9% $21.61 $44,946 YESLife, Physical, and Social Science ‐7.3% $29.47 $61,293 YESFood Preparation and Serving Related ‐5.8% $9.32 $19,387 NoEducation, Training, and Library ‐4.8% $19.85 $41,295 NoBuilding & Grounds Cleaning & Maintenance ‐2.4% $10.81 $22,488 NoArchitecture and Engineering ‐0.6% $31.76 $66,065 YESOffice and Administrative Support 0.2% $15.04 $31,285 NoSales and Related 0.9% $15.86 $32,999 NoInstallation, Maintenance, and Repair 7.0% $19.38 $40,315 NoTransportation and Material Moving 8.6% $14.18 $29,502 NoConstruction and Extraction 14.5% $16.38 $34,065 NoFarming, Fishing, and Forestry 15.8% $13.07 $27,188 NoProduction 16.7% $14.7 $30,577 No
FIGURE 2:
Heaviest Job Losses During Great Recession Hit Workers Earning Less Than Living Income Standard
NC Budget and Tax Center6
Living Income Standard. Two of the three occupations expected to experience the highest growth over the nextdecade pay just half of the LIS.
The Need for the Living Income Standard
In order to truly understand the challenges facing low-wage workers with families, policymakers need an incomestandard that measures what it takes for a family to make ends meet. Nationally, the Federal Poverty Level and theminimum wage are often used, but they have significant flaws and do not reflect the actual needs and challenges oflow-income families.
The Federal Poverty Level (FPL) has been the nation’s primary measure of economic security since its development inthe 1960s. However, the measure was designed to determine the minimum income necessary for a family to survive,not to be economically secure. The FPL has been largely criticized because of the following design flaws:
• It is based only on the cost of food and assumes that cost accounts for one-third of family expenses.
• It ignores expenses that are significant today but were not common in 1960, like child care.
• It was designed to measure after-tax income but today is applied to pre-tax income, thereby inaccuratelyportraying the amount of money a family actually has available to spend.
• It is the same across the nation and does not take into account cost-of-living variations.
The minimum wage also has distinct flaws that compromise its relevance in the task of assessing the financial realitiesthat working families face.
• It serves as a wage floor and is not meant to reflect the threshold of earnings needed to make ends meet.
• It is set by Congress or at the state level by state legislatures and thus subject to the policy process ratherthan reflective of economic realities.
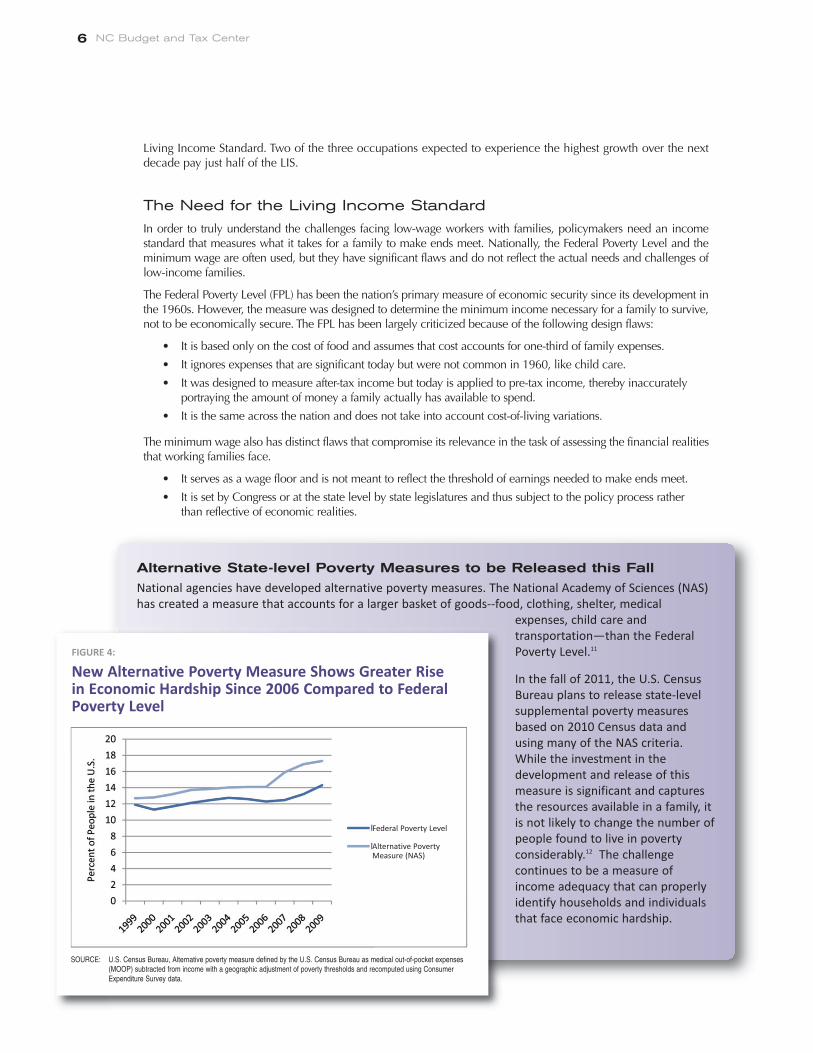
Alternative State-level Poverty Measures to be Released this Fall
National agencies have developed alternative poverty measures. The National Academy of Sciences (NAS)has created a measure that accounts for a larger basket of goods‐‐food, clothing, shelter, medical
expenses, child care andtransportation—than the FederalPoverty Level.11
In the fall of 2011, the U.S. CensusBureau plans to release state‐levelsupplemental poverty measuresbased on 2010 Census data andusing many of the NAS criteria.While the investment in thedevelopment and release of thismeasure is significant and capturesthe resources available in a family, itis not likely to change the number ofpeople found to live in povertyconsiderably.12 The challengecontinues to be a measure ofincome adequacy that can properlyidentify households and individualsthat face economic hardship.
FIGURE 4:
New Alternative Poverty Measure Shows Greater Rise in Economic Hardship Since 2006 Compared to FederalPoverty Level
SOURCE: U.S. Census Bureau, Alternative poverty measure defined by the U.S. Census Bureau as medical out-of-pocket expenses(MOOP) subtracted from income with a geographic adjustment of poverty thresholds and recomputed using ConsumerExpenditure Survey data.
Federal Poverty Level
Alternative PovertyMeasure (NAS)
The minimum wage, currently $7.25 perhour, has seen its purchasing power erodeover time.9 If the minimum wage hadmaintained its value as of the 1960s, thewage floor would be $17.54.10
NORTH CAROLINA’SLIVING INCOMESTANDARD
The Living Income Standard is a bettermeasure for understanding economic
pressures than the Federal Poverty Level orthe minimum wage (see above). Unlikethese measures, the Living IncomeStandard uses comprehensive, local costdata to assess how much money a familyneeds to pay market prices for a bundle ofgoods and services. Additionally, the LIS isthe only source of local budget data forfour common family types in all 100counties.
Those representative family types are asfollows: a family with one adult and onechild, a family with one adult and twochildren, a family with two adults and twochildren and a family with two adults andthree children. Public datasets provide theestimates of how much money is requiredto pay market prices for seven essentialexpenses: housing, food, childcare, healthcare, transportation, taxes and othernecessities (clothing, personal care items,household supplies, school supplies and
local telephone service).
The LIS is a conservative measure buildingoff of the lowest estimates for each budgetitem. Budgets only include essential itemsand contain no allowances for such
THE 2010 LIVING INCOME STANDARD FOR NORTH CAROLINA 7
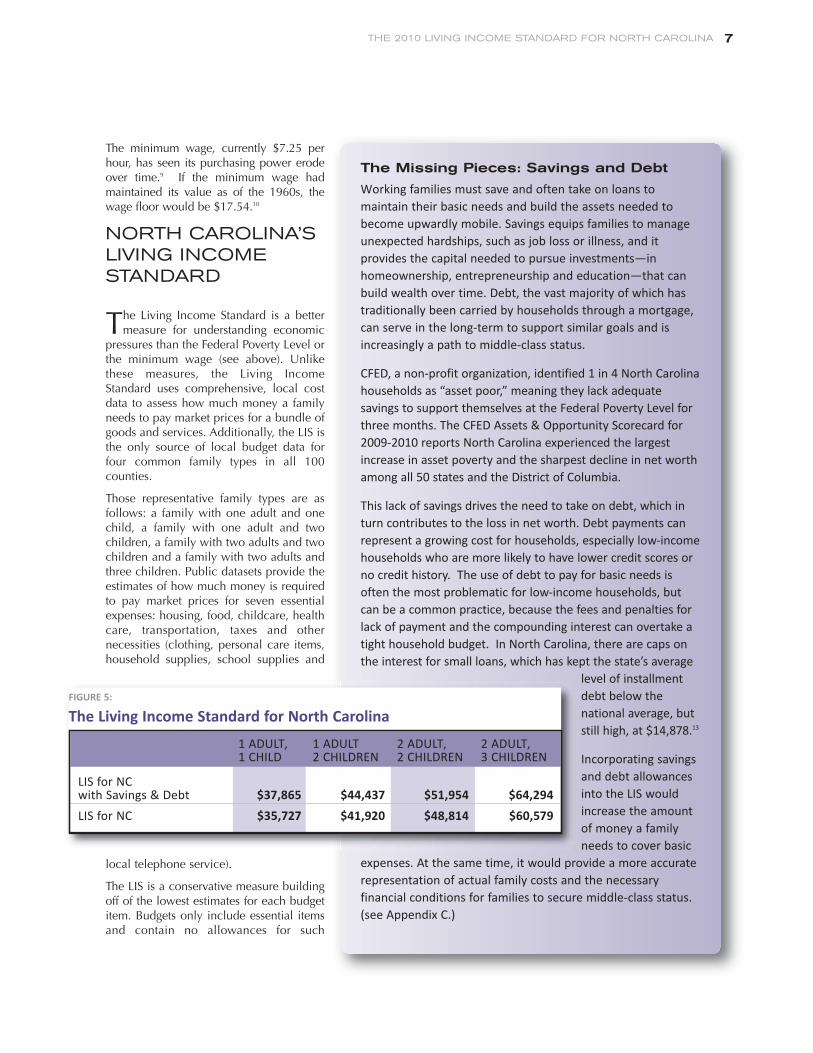
The Missing Pieces: Savings and Debt
Working families must save and often take on loans tomaintain their basic needs and build the assets needed tobecome upwardly mobile. Savings equips families to manageunexpected hardships, such as job loss or illness, and itprovides the capital needed to pursue investments—inhomeownership, entrepreneurship and education—that canbuild wealth over time. Debt, the vast majority of which hastraditionally been carried by households through a mortgage,can serve in the long‐term to support similar goals and isincreasingly a path to middle‐class status.
CFED, a non‐profit organization, identified 1 in 4 North Carolinahouseholds as “asset poor,” meaning they lack adequatesavings to support themselves at the Federal Poverty Level forthree months. The CFED Assets & Opportunity Scorecard for2009‐2010 reports North Carolina experienced the largestincrease in asset poverty and the sharpest decline in net worthamong all 50 states and the District of Columbia.
This lack of savings drives the need to take on debt, which inturn contributes to the loss in net worth. Debt payments canrepresent a growing cost for households, especially low‐incomehouseholds who are more likely to have lower credit scores orno credit history. The use of debt to pay for basic needs isoften the most problematic for low‐income households, butcan be a common practice, because the fees and penalties forlack of payment and the compounding interest can overtake atight household budget. In North Carolina, there are caps onthe interest for small loans, which has kept the state’s average
level of installmentdebt below thenational average, butstill high, at $14,878.13
Incorporating savingsand debt allowancesinto the LIS wouldincrease the amountof money a familyneeds to cover basic
expenses. At the same time, it would provide a more accuraterepresentation of actual family costs and the necessaryfinancial conditions for families to secure middle‐class status.(see Appendix C.)
FIGURE 5:
The Living Income Standard for North Carolina
1 ADULT, 1 ADULT 2 ADULT, 2 ADULT, 1 CHILD 2 CHILDREN 2 CHILDREN 3 CHILDREN
LIS for NC with Savings & Debt $37,865 $44,437 $51,954 $64,294LIS for NC $35,727 $41,920 $48,814 $60,579
luxuries as entertainment, meals eaten outside of the home, cable television, cellular phone service,extracurricular activities and gifts. (See Appendix A for methodology.)
HOW MUCH IS ENOUGH TO MAKE ENDS MEET?
To afford basic expenses, a North Carolina family of two adults and two children must earn $48,814 per year,an amount equal to 221 percent of the federal poverty level and 324 percent of the minimum wage. Thatamount requires the adults in the average family to earn a total of $23.47 per hour, 40 hours a week, 52 weeksa year.
More than 3 out of 4 families with one adult and two children live below the LIS, while nearly 1 out of 3families with two adults and two children do.14
NC Budget and Tax Center8
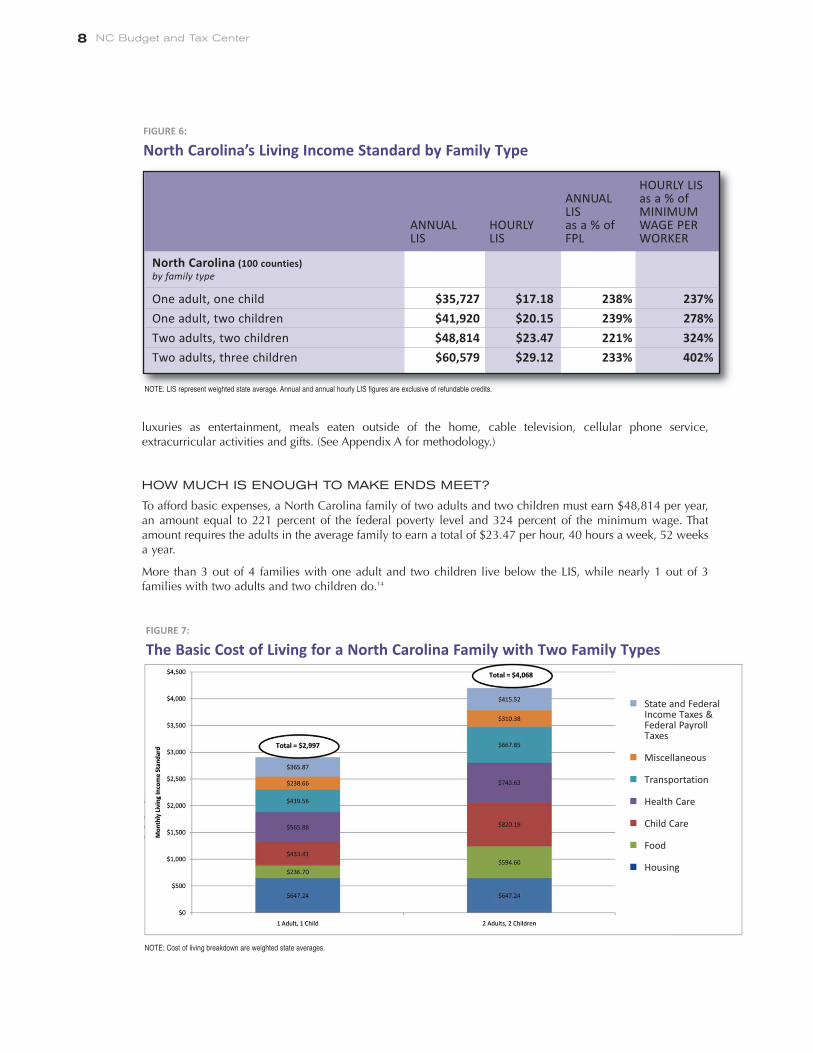
HOURLY LIS ANNUAL as a % ofLIS MINIMUM
ANNUAL HOURLY as a % of WAGE PER LIS LIS FPL WORKER
North Carolina (100 counties)by family type
One adult, one child $35,727 $17.18 238% 237%One adult, two children $41,920 $20.15 239% 278%Two adults, two children $48,814 $23.47 221% 324%Two adults, three children $60,579 $29.12 233% 402%
FIGURE 6:
North Carolina’s Living Income Standard by Family Type
FIGURE 7:
The Basic Cost of Living for a North Carolina Family with Two Family Types
NOTE: LIS represent weighted state average. Annual and annual hourly LIS figures are exclusive of refundable credits.
NOTE: Cost of living breakdown are weighted state averages.
n State and FederalIncome Taxes &Federal PayrollTaxes
n Miscellaneous
n Transportation
n Health Care
n Child Care
n Food
n Housing

The exact amount of required income to make ends meet varies with a family’s size and place of residence.Larger families and families residing in metropolitan areas typically need larger incomes. See Appendix B forthe Living Income Standard budgets for each of the four family types by county.
The largest cost in the monthly budget of most families is child care. Child care represents one fifth or more ofthe household budget for families with two and three children. The next largest expenses are housing andhealth care. For families with one child, housing represents more than one-fifth of the household budget onaverage. Taken together, these three costs—housing, childcare and health expenses—represent between 50and 60 percent of a household’s budget.
THE GEOGRAPHY OF LIVING COSTS
An important aspect of measuring economic pressures is where a family is located. Living costs vary by placeof residence and typically are higher in metropolitan areas. Housing costs account for much of this difference.However, although metropolitan areas are often more expensive places to live, they also provide greateropportunities to earn higher wages and achieve career advancement.
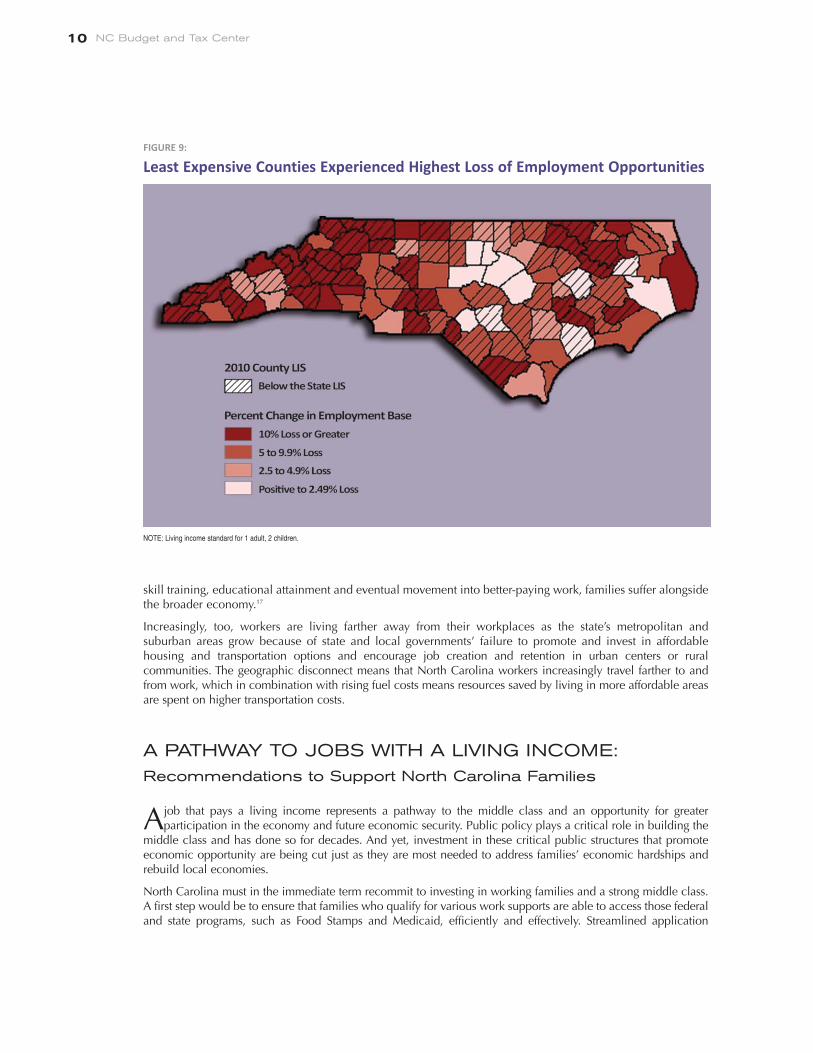
An analysis of LIS datafor the state’s 100counties illustrates theeconomic trade-offsfamilies face whenconsidering employmentopportunities and basicliving costs. Four of thefive counties with thelargest annual LISbudgets are in or nearthe Research Trianglearea. Those counties thatare least expensiveaccording to the LIS dataare concentrated in thewestern half of the state and represent exurban or suburban counties (See Figure 8).
The impact of the Great Recession has been significant to working families in these counties. The loss ofemployment at the county level was largely concentrated in least-expensive counties (See Figure 9 ) . Withthe loss o f employment opportunities in these areas, workers will be faced with an additional layer ofcomplexity in deciding whether jobs available in more expensive counties can sustain additional housing andchild care costs if moving would be required.
EMPLOYMENT TRENDS AND THEIR IMPACT ON WORKERS’ EARNINGS
Wages earned from work represent the most significant financial resource for North Carolina families. Asdetailed in the previous section, projected job growth suggests that an increasing share of jobs in NorthCarolina will fall short of the LIS.
The challenges that workers in low-wage jobs face are compounded by the fact that these jobs are less likelyto provide benefits and often represent a dead end in terms of prospects for mobility. Benefits such as healthcare and retirement plans provide workers with additional support to meet their immediate needs and long-term plans. In North Carolina, nearly one in five residents 18 years or older were uninsured in 2009, and fewerthan four in ten had access to employer-provided pension plans.15
Research has found that opportunities for workers to move from low-wage work to better-paying jobs arelimited.16 This represents a significant challenge for increasing earnings to a level sufficient to meet a family’sbasic needs. Without the potential for a worker to follow a pathway that connects current skill levels to further
THE 2010 LIVING INCOME STANDARD FOR NORTH CAROLINA 9
MOST EXPENSIVE COUNTIES LEAST EXPENSIVE COUNTIES
Wake $54,587 Davidson $41,572 Chatham $54,258 Catawba $44,245 Currituck $53,170 Surry $45,550 Durham $53,063 Cherokee $45,688 Dare $52,854 Rockingham $45,702
FIGURE 8:
Living Costs by Selected County
NOTE: LIS figures are for family of four.
NC Budget and Tax Center10
skill training, educational attainment and eventual movement into better-paying work, families suffer alongsidethe broader economy.17
Increasingly, too, workers are living farther away from their workplaces as the state’s metropolitan andsuburban areas grow because of state and local governments’ failure to promote and invest in affordablehousing and transportation options and encourage job creation and retention in urban centers or ruralcommunities. The geographic disconnect means that North Carolina workers increasingly travel farther to andfrom work, which in combination with rising fuel costs means resources saved by living in more affordable areasare spent on higher transportation costs.
A PATHWAY TO JOBS WITH A LIVING INCOME:Recommendations to Support North Carolina Families
Ajob that pays a living income represents a pathway to the middle class and an opportunity for greaterparticipation in the economy and future economic security. Public policy plays a critical role in building the
middle class and has done so for decades. And yet, investment in these critical public structures that promoteeconomic opportunity are being cut just as they are most needed to address families’ economic hardships andrebuild local economies.
North Carolina must in the immediate term recommit to investing in working families and a strong middle class.A first step would be to ensure that families who qualify for various work supports are able to access those federaland state programs, such as Food Stamps and Medicaid, efficiently and effectively. Streamlined application
FIGURE 9:
Least Expensive Counties Experienced Highest Loss of Employment Opportunities
NOTE: Living income standard for 1 adult, 2 children.

processes and eligibility determinations can reduce administrative costs and more quickly get resources intofamilies’ pockets so they can spend that money in their communities.
A second critical step in the pathway is to ensure that work pays. The state’s Earned Income Tax Credit boosts theincomes of more than 800,000 families across North Carolina and reduces the greater share of the income theselow-income families pay in state and local taxes relative to higher-income households. Maintaining andexpanding the state EITC makes the state’s tax code fairer and makes work pay for struggling families.
Another critical support for working families is child care subsidies, which ensure that parents in low-wage jobsare able to stay at work and send their children to safe, high-quality early-learning programs.
But public policy can and should do more than subsidize low-wage work. Public policy should support thecreation of quality jobs that meet, at a minimum, the living income standard and provide benefits such asretirement savings and health insurance. State policymakers should set wage and benefit standards at the livingincome standard and require businesses to meet these standards if they seek to access taxpayer dollars througheconomic development subsidies.
Finally, public policy must support the development of career pathways and encourage workers and employers toview post-secondary education as a continual process to achieve better economic outcomes. A career pathwaysmodel approaches education as a connected series of educational and training programs. Career pathways “enableindividuals to secure employment within a specific industry or occupational sector, and to advance over time tosuccessively higher levels of education and employment in that sector.” Each step in a career pathway readies “theparticipant for the next level of employment and education.”18 North Carolina policymakers should providecommunity colleges with the resources to create career pathway opportunities and leverage federal dollars forworker training that develop skills training connected to high-growth industries.
CONCLUSION
Despite working hard, a sizable number of North Carolina families with children earn too little to afford the basicgoods and services they need to get by. Long-term trends in the labor market in combination with the immediatechallenges of the Great Recession have placed significant challenges on these low-wage working families.Without focused attention on policies that create quality, well-paying jobs, the promise of work for these familieswill continue to fall short. And without strong income supports and investments in the skills and education of thecurrent and future workforce, the potential for North Carolina’s low-wage workers to advance to the middle classwill continue to be thwarted.
1 Working Poor Families Project Data, 2011. American Community Survey, 2009, analyzed by Population Reference Bureau.
2 Hertz, Tom, 2006. Understanding Economic Mobility in America. Center for American Progress, available at:http://www.americanprogress.org/issues/2006/04/Hertz_MobilityAnalysis.pdf and Harry Houzer. “Penny Wise, Pound Foolish: Why TacklingChild Poverty During the Great Recession Makes Economic Sense.” September 2010. Center for American Progress. Available athttp://www.americanprogress.org/issues/2010/09/pdf/hit_childpoverty.pdf
3 Unless otherwise noted the Federal Poverty Level reflects the U.S. Census Bureau thresholds.
4 Industry data from Current Employment Statistics, 1990 to 2006 and living income standard from Quinterno, John, et al, 2008. Making EndsMeet: The 2008 Living Income Standard, North Carolina Justice Center: Raleigh, NC.
5 Economic Policy Institute analysis of Bureau of Labor Statistics in JobWatch series.
6 Carnevale, Anthony et al, June 2010. Help Wanted: Projections of Jobs and Education Requirements through 2018. Georgetown University,Center on Education and the Workforce: Washington, DC.
7 Carnevale et al, June 2010
THE 2010 LIVING INCOME STANDARD FOR NORTH CAROLINA 11

8 N.C. Commission on Workforce Development, June 2011, 2011 State of North Carolina Workforce Report, Raleigh, NC.
9 Bernstein, Jared and Isaac Shapiro, June 2006. “Buying Power of Minimum Wage at 51 Year Low: Congress Could Break Record forLongest Period Without an Increase.” Center on Budget and Policy Priorities. Available at http://www.cbpp.org/cms/?fa=view&id=405.
10 Author’s calculation based on average wage in North Carolina in 2010.
11 For more on alternative poverty measures, see http://www.census.gov/hhes/povmeas/
12 Fremstad, Shawn. December 2008. Measuring Poverty and Economic Inclusion: The Current Poverty Measure, the NAS Alternative, and theCase for a Truly New Approach. Center for Economic Policy Research: Washington, DC.
13 CFED, 2009-2010 Assets & Opportunity Scorecard. Accessed at: http://scorecard.cfed.org/state_data/north_carolina.php
14 Economic Policy Institute analysis of American Community Survey, 2009 microdata.
15 Working Poor Families Project Data 2011 analysis of the American Community Survey, 2009.
16 Boushey, Heather, Shawn Fremstad, Rachel Gragg and Margy Walker, March 2007. Understanding Low Wage Work. The Mobliity Agenda.
17 Boushey, et al 2007
18 David Jenkins, “Career Pathways: Aligning Public Resources to Support Individual and Regional Economic Advancement in the KnowledgeEconomy.” New York, NY: Workforce Strategy Center, August 2006. p. 6, Available athttp://www.workforcestrategy.org/publications/WSC_pathways8.17.06.pdf.
NC Budget and Tax Center12
THE 2010 LIVING INCOME STANDARD FOR NORTH CAROLINA 13
Appendix A: The 2010 Living Income Standard Methodology
The 2010 Living Income Standard (LIS) is a market-based approach for estimating how much income aworking family with children needs to afford basic expenses. The LIS uses actual cost data toapproximate how much money is required for four representative family types to pay seven basicexpenses: 1) housing, 2) food, 3) childcare, 4) health care, 5) transportation, 6) other necessities and 7)taxes.
Raw data for the LIS come from a variety of federal and state sources. For each budget item, the mostconservative estimate is used. Food costs, for example, are based on the U.S. Department ofAgriculture’s “Thrifty Food Plan,” which assumes that a family always buys bulk groceries, preparesevery meal at home, never eats out and seldom purchases meat. By using conservative estimates, theLIS provides a basic budget for an extremely modest, if not austere, lifestyle.
The LIS also generally excludes the value of work supports, such as food stamps or Section 8 housingsubsidies, for which a family might be eligible. Exceptions include an allowance for public healthinsurance and certain tax credits. These exceptions are made because health insurance coverage cangreatly reduce a family’s income needs while the tax credits offset the effects of regressive tax policies.By excluding the value of work supports, the LIS shows how much a family would need to earn tomeet its basic needs without any assistance.
Most of the procedures underlying the LIS are based on the work of the Economic Policy Institute (EPI), anonprofit research organization in Washington, D.C. Owing to significant methodologicalimprovements, the 2010 LIS is not comparable to previous LIS reports by the Budget and Tax Center.
Below are detailed descriptions of the methods used to craft the LIS. Unless noted, all data are for 2009, andall dollar figures represent 2009 values. Where necessary, dollar amounts from earlier years have beenadjusted to their 2009 equivalents by using the U.S. Bureau of Labor Statistics’ Consumer Price Indexfor all urban consumers (CPI-U).
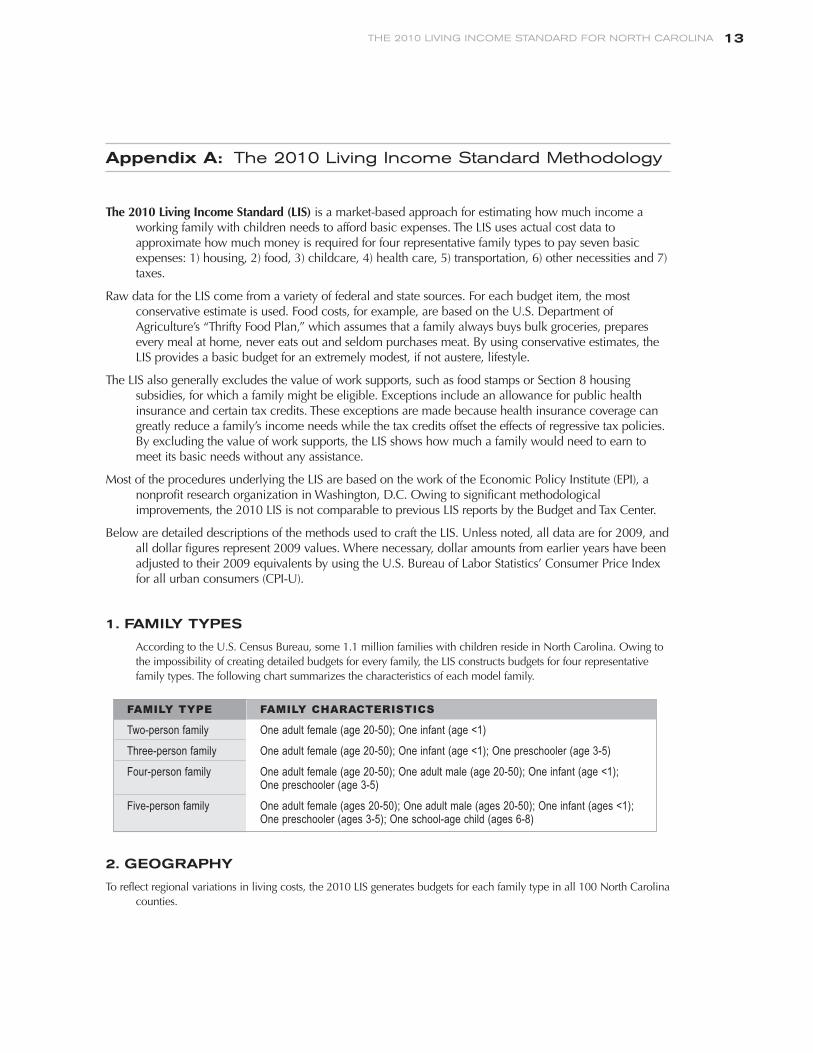
1. FAMILY TYPES
According to the U.S. Census Bureau, some 1.1 million families with children reside in North Carolina. Owing tothe impossibility of creating detailed budgets for every family, the LIS constructs budgets for four representativefamily types. The following chart summarizes the characteristics of each model family.
2. GEOGRAPHY
To reflect regional variations in living costs, the 2010 LIS generates budgets for each family type in all 100 North Carolinacounties.
FAMILY TYPE FAMILY CHARACTERISTICS
Two-person family One adult female (age 20-50); One infant (age <1)Three-person family One adult female (age 20-50); One infant (age <1); One preschooler (age 3-5)Four-person family One adult female (age 20-50); One adult male (age 20-50); One infant (age <1);
One preschooler (age 3-5)Five-person family One adult female (ages 20-50); One adult male (ages 20-50); One infant (ages <1);
One preschooler (ages 3-5); One school-age child (ages 6-8)

3. HOUSING
The LIS assumes that families rent rather than own their own homes. This is consistent with national research showingthat low-income households are more apt to rent their homes.
Housing costs are based upon the U.S. Department of Housing and Urban Development (HUD) Fair Market Rent (FMR)values for each county in 2009. FMR is a survey estimate of the actual market rent for a modest apartment in theconventional marketplace. FMR measures shelter rent and the cost of all tenant-paid utilities except for telephone,cable and internet service. Area FMR values are set at the 40th-percentile rent. This means that 40 percent of theunits in an area rent for less than the FMR, and 60 percent rent for more.
Assumptions about the appropriate size of an apartment mirror HUD’s occupancy standards. HUD guidelines state thatparents and children should have separate bedrooms and that two children can share a bedroom. Therefore, theLIS assumes that two-, three- and four-person families require a two-bedroom apartment, while a five-personfamily requires a three-bedroom apartment.
In 2009, monthly FMR for a two-bedroom apartment in North Carolina ranged between $577 and $904. Monthly FMRfor a three-bedroom apartment varied from $689 to $1,236.
4. FOOD
Food costs are based on the June 2009 Thrifty Food Plan developed by the U.S. Department of Agriculture (USDA). TheThrifty Plan, which is the basis for food stamp allotments, reflects the estimated costs associated with purchasingthe food required to prepare a nutritionally sound diet at home. There is no allowance of any kind for mealspurchased outside of the home or eaten at any kind of restaurant.
Plan costs are tied to the age and gender of the adults and the age of the children. For infants, plan costs for a one-yearold are used. For preschoolers, the costs for a four-to five-year old are used. For school-aged children, costs for asix-to eight-year old are used. For parents, the respective costs for males and females between the ages of 19 and50 are used.
5. CHILDCARE
Childcare costs are based on the 2009 North Carolina Childcare Market Rate Survey prepared by the Center for UrbanAffairs and Community Services at North Carolina State University. The LIS assumes that all adults in a family workfull-time, and all children - infants, preschoolers and school-aged children - require regular, age-appropriate care inlicensed family childcare homes that have received a three-star rating from the North Carolina Division of ChildDevelopment. North Carolina rates all licensed childcare providers on a five-star scale. A one-star rating meansthat a facility meets basic standards. Additional stars are awarded to facilities that meet higher quality standards interms of staff education and program standards.
6. HEALTH CARE
Health expenses are difficult to measure due to a lack of definitive data and the range of potential coverage options.Families may purchase coverage through an employer-sponsored group plan, obtain non-group insurance throughthe private market, receive public insurance or go uninsured. Premium and out-of-pocket costs for each optionmay vary greatly. Because health insurance is vital to a family’s well-being, the LIS assumes that every familymember is covered by some kind of insurance plan.
For families with employer-sponsored health insurance, the LIS bases the cost on the average private-sector employee’sshare of premium costs. This figure comes from the 2009 Medical Expenditure Panel Survey (MEPS) sponsored bythe U.S. Department of Health and Human Services.
For families with non-group health insurance, monthly premium costs are derived using online quotes accessed in 2007and adjusted for health care cost inflation to 2009 dollars. Estimates were developed for each family type in eachof the state’s 100 counties (based on the zip code of the county seat). More specifically, quotes were generated for
NC Budget and Tax Center14
the “Blue Advantage Plan A” with maternity coverage for females, a $500 annual deductible and $15 co-payments.Actual prices could vary significantly depending on a family’s medical history. As of 2010, the parameters of thisplan had changed making it necessary to use an inflation calculation to conservatively estimate the cost of a planwith the same parameters as the previous LIS.
To estimate out-of-pocket medical costs, the LIS uses 2007 MEPS household survey data specific to the Southern regionand selected age groups. For each family type, the appropriate MEPS results for the “Total Amount Paid bySelf/Family” are summed, divided by 12 to yield a monthly amount and adjusted for inflation using the CPI-U formedical care. The annual estimate is divided by 12 to produce a monthly cost estimate, and this figure then isadjusted for inflation using the CPI-U for medical care.
Finally, health care costs for each family type are generated by using a weighted formula developed by EPI. Formulaweights reflect the percentages of families with annual incomes between $20,000 and $30,000 that haveemployer-sponsored, non-group and public insurance, as measured by the U.S. Census Bureau’s 2004 CurrentPopulation Survey. While the LIS normally does not include the value of public insurance, some of therepresentative family types would be eligible for public insurance like the Health Choice for Children program.Such coverage would greatly reduce both a family’s health care costs and the amount of income needed to meetbasic expenses.
The formulas for deriving health care costs are the following:
One-parent family
0.66*employer-sponsored premium + 0.05*$0 (no premium for public insurance) + 0.29* non-grouppremium + out-of-pocket costs
Two-parent family
0.70*employer-sponsored premium + 0.035*$0 (no premium for public insurance) + 0.265* non-grouppremium + out-of-pocket costs
7. TRANSPORTATION
The LIS assumes that a family relies upon a private automobile to travel to work and school, as well as to conductessential family business. Automobile travel is North Carolina’s dominant mode of transportation due to low-density settlement patterns, a general separation between employment and residential centers and relatively limitedpublic transit networks. In fact, some 80 percent of North Carolina workers commute to their jobs by themselves ina private automobile, according to the U.S. Census Bureau.
Raw transportation data come from two sources: the 2009 National Household Travel Survey (NHTS) sponsored by theU.S. Department of Transportation and the 2009 per-mile deduction rate computed by the U.S. Internal RevenueService (IRS). The IRS per-mile rate ($0.55) measures the cost of owning, repairing, maintaining and registering anautomobile.
To estimate transportation costs for each family type, a four-step process is used.
First, the state’s 100 counties are classified as urban or rural based on the North Carolina Rural Center’s classification ofthe state’s counties.
Second, NHTS data showing the average annual vehicle-miles per driver are calculated for urban and rural NorthCarolinians. The appropriate values (averages for urban and rural state residents) then are assigned to each countybased on NC Rural Center’s classification. Each of the Rural Center’s fifteen urban counties is given a value of12,663 miles per driver per year. The state’s 85 rural counties are assigned a value of 16,238 miles per driver peryear.
Third, NHTS travel-day data are analyzed to isolate the annual person-miles of travel strictly for work and non-socialpurposes (using the 1990 trip purpose variable). For the typical North Carolina driver, work trips account for 35percent of the total number of miles driven each year, and non-social trips, like school meetings or medicalappointments, account for 24 percent of the total number of miles driven each year.
THE 2010 LIVING INCOME STANDARD FOR NORTH CAROLINA 15
Finally, a formula developed by EPI is used to generate a monthly estimate for transportation costs based on the numberof adults in a family. The formulas follow.
One-parent family
0.583(work and non-social trips of 1st adult) * (Average annual miles per driver/12) * 0.55(IRS cost/mile)
Two-parent family
[0.583(work and non-social trips of 1st adult) * Average annual miles per driver/12 * 0.55(IRS cost/mile)] + [0.238(work trips 2nd adult)* Average annual miles per drive/12 * 0.55(IRS cost/mile)]
8. OTHER NECESSITIES
Other necessary expenses incurred by families with children include clothing, personal care items, household supplies,reading materials, school supplies and local telephone service. Based on an analysis of the U.S. Bureau of LaborStatistics’ Consumer Expenditure Survey, other necessities are valued at 27 percent of total food and housing costs.Note the LIS contains no allowance for such items as entertainment, meals eaten outside of home, cable television,cellular phone service, extracurricular activities and gifts.
9. TAXES & CREDITS
Tax costs are computed for each family type using a tax calculator created by the Budget and Tax Center. These tax costsinclude federal personal income tax, federal Social Security and Medicare payroll taxes (employee-portion only)equal to 7.65% of pretax wages and state income taxes.
This method also produces the amounts a given family would receive from four federal tax credits: the Earned IncomeTax Credit (EITC), the Child Tax Credit , the Child and Dependent Care Credit, and the Making Work Pay Creditincluded as part of the 2009 Recovery Act. Three state credits were also included: the state Earned Income TaxCredit, the Child Tax Credit, and the Child and Dependent Care Credit.
All family types included in the study are eligible for the entire $1,000 per child federal Child Tax Credit and federalChild and Dependent Care Credit. All family types are also eligible for North Carolina’s $100 per child state ChildTax Credit and at least a portion of the state Child and Dependent Care Credit.
Given the necessary income to cover basic expenses for families, the all one adult, one infant families and most two-children families qualify for the EITC. The average EITC was $698 for both one-parent family types and $274 fortwo-parent, two-children families. While the LIS generally does not include the value of work-support benefits, thevalue of the EITC is included because it is a tax benefit that offsets the regressive nature of payroll and excise taxes.
To calculate specific tax amounts for each representative family, the after-tax family budget necessary to meet basic needsis identified by totaling the annual cost of food, housing, childcare, health care, transportation, and othernecessities for each family type within each North Carolina county. The Budget and Tax Center tax calculator isthen used to determine the pre-tax income necessary for families to achieve the after-tax family budget necessaryto meet basic needs. The tax calculator computes the payroll and federal income taxes, the value of the federalcredits, North Carolina income taxes, and the value of the state credits for each pre-tax income.
For one-adult households, the “head of household” filing status is used. “Married Filing Jointly” is used for the two-adulthouseholds. The appropriate standard deduction for each family type is used and exemptions are calculatedaccording to the size of each family type.
Families’ annual tax liability on the pre-tax income is divided by 12 and figured into the monthly LIS budget. Whereapplicable, refunds are applied to the annual pre-tax income to calculate the final annual LIS for each family typein each county.
Other taxes are accounted for in the appropriate budget item. Gas taxes, for example, are included in the transportationestimate. Similarly, an estimate for property taxes is included in the housing data, while the value of sales taxes iscaptured in the price of other necessities.
NC Budget and Tax Center16

THE 2010 LIVING INCOME STANDARD FOR NORTH CAROLINA 17
10. INCOME AND WAGE CALCULATIONS
After compiling budget data for each line item for each family type in each county, the values are summed to show thetotal amount of money that a family would need to meet its basic expenses. Annual totals then are converted intomonthly and hourly wage figures. These figures represent the total amount of income that a family requires to meetits budget. For two-parent families, the total represents how much income the family must earn from the combinedefforts of both adults.
For comparative purposes, the annual income figures also are shown as a percentage of the federal poverty threshold. Thehourly figures are expressed as a percentage of the state’s 2009 minimum wage of $7.25 per hour.
Consistent with conservative estimating techniques, the hourly wage figures are based on the assumption of full-timeemployment, meaning 40 hours per week for 52 weeks per year. Put differently, the LIS makes no allowance for aworker taking any time off. Also, research suggests that low-wage workers often are unable to work consistentlyand instead are subject to unexpected layoffs and changes in hours. As a result, the hourly LIS wage represents abest-case scenario, and the hourly wage actually needed likely is higher.

COUNTY Housing Food Childcare Health Care Transportation Miscellaneous
Payroll, State
& FederalIncome Taxes
with Non-Refundable Fed & State
Credits
RefundableTax
Credits Monthly LIS Annual LIS
LIS as % of FPL
($15,030) LIS Wage
LIS as %Min Wage
per Worker
NC Budget and Tax Center18
TWO‐PERSON FAMILY – (One Adult, One Child)
Appendix B: Detailed Living Income Standard Budgets by Family Type by County
Alamance $742 $237 $427 $555 $338 $264 $385 $(1) $2,948 $35,370 235% $17.00 235%
Alexander $614 $237 $427 $563 $434 $230 $348 $(20) $2,832 $33,989 226% $16.34 225%
Alleghany $577 $237 $417 $563 $434 $220 $312 $(37) $2,721 $32,657 217% $15.70 217%
Anson $577 $237 $417 $583 $434 $220 $327 $(31) $2,764 $33,167 221% $15.95 220%
Ashe $577 $237 $417 $563 $434 $220 $312 $(37) $2,721 $32,657 217% $15.70 217%
Avery $647 $237 $417 $563 $434 $239 $366 $(10) $2,892 $34,704 231% $16.68 230%
Beaufort $577 $237 $427 $569 $434 $220 $325 $(32) $2,756 $33,076 220% $15.90 219%
Bertie $577 $237 $418 $569 $434 $220 $316 $(35) $2,735 $32,818 218% $15.78 218%
Bladen $577 $237 $427 $593 $434 $220 $338 $(25) $2,800 $33,605 224% $16.16 223%
Brunswick $787 $237 $427 $593 $434 $276 $470 $- $3,224 $38,683 257% $18.60 257%
Buncombe $690 $237 $427 $552 $338 $250 $342 $(23) $2,814 $33,772 225% $16.24 224%
Burke $614 $237 $417 $563 $434 $230 $342 $(23) $2,814 $33,765 225% $16.23 224%
Cabarrus $757 $237 $490 $583 $338 $268 $436 $- $3,110 $37,315 248% $17.94 247%
Caldwell $614 $237 $427 $563 $434 $230 $348 $(20) $2,832 $33,989 226% $16.34 225%
Camden $656 $237 $417 $569 $434 $241 $380 $(4) $2,930 $35,155 234% $16.90 233%
Carteret $634 $237 $427 $569 $434 $235 $366 $(10) $2,891 $34,697 231% $16.68 230%
Caswell $592 $237 $417 $555 $434 $224 $318 $(34) $2,742 $32,907 219% $15.82 218%
Catawba $614 $237 $427 $563 $338 $230 $284 $(50) $2,642 $31,710 211% $15.24 210%
Chatham $827 $237 $564 $555 $434 $287 $540 $- $3,444 $41,328 275% $19.87 274%
Cherokee $577 $237 $417 $552 $434 $220 $305 $(41) $2,701 $32,417 216% $15.59 215%
Chowan $656 $237 $417 $569 $434 $241 $380 $(4) $2,930 $35,155 234% $16.90 233%
Clay $577 $237 $427 $552 $434 $220 $311 $(38) $2,720 $32,641 217% $15.69 216%
Cleveland $682 $237 $417 $563 $434 $248 $393 $- $2,974 $35,686 237% $17.16 237%
Columbus $577 $237 $417 $593 $434 $220 $332 $(28) $2,782 $33,381 222% $16.05 221%
Craven $630 $237 $427 $569 $434 $234 $363 $(12) $2,882 $34,583 230% $16.63 229%
Cumberland $678 $237 $389 $593 $338 $247 $335 $(26) $2,791 $33,488 223% $16.10 222%
Currituck $904 $237 $417 $569 $434 $308 $522 $- $3,391 $40,686 271% $19.56 270%
Dare $802 $237 $471 $569 $434 $280 $490 $- $3,283 $39,397 262% $18.94 261%
Davidson $598 $237 $377 $545 $338 $225 $255 $(102) $2,473 $29,675 197% $14.27 197%
Davie $666 $237 $427 $545 $434 $244 $379 $(5) $2,927 $35,121 234% $16.89 233%
Duplin $577 $237 $417 $593 $434 $220 $332 $(28) $2,782 $33,381 222% $16.05 221%
Durham $827 $237 $550 $555 $338 $287 $490 $- $3,285 $39,417 262% $18.95 261%
Edgecombe $577 $237 $427 $569 $434 $220 $325 $(32) $2,756 $33,075 220% $15.90 219%
Forsyth $666 $237 $491 $545 $338 $244 $357 $(15) $2,863 $34,359 229% $16.52 228%
Franklin $795 $237 $417 $555 $434 $279 $454 $- $3,170 $38,042 253% $18.29 252%
Gaston $757 $237 $427 $583 $338 $268 $406 $- $3,016 $36,197 241% $17.40 240%
Gates $656 $237 $417 $569 $434 $241 $380 $(4) $2,930 $35,155 234% $16.90 233%
Graham $577 $237 $417 $552 $434 $220 $305 $(41) $2,701 $32,417 216% $15.59 215%
Granville $640 $237 $427 $555 $434 $237 $362 $(12) $2,879 $34,552 230% $16.61 229%
Greene $577 $237 $427 $569 $434 $220 $325 $(32) $2,756 $33,076 220% $15.90 219%
Guilford $699 $237 $477 $545 $338 $253 $377 $(6) $2,920 $35,040 233% $16.85 232%
Halifax $577 $237 $417 $569 $434 $220 $315 $(36) $2,733 $32,796 218% $15.77 217%
Harnett $592 $237 $427 $555 $434 $224 $328 $(30) $2,766 $33,187 221% $15.96 220%
Haywood $633 $237 $417 $552 $434 $235 $350 $(19) $2,839 $34,066 227% $16.38 226%
Henderson $690 $237 $427 $552 $434 $250 $397 $- $2,987 $35,847 239% $17.23 238%
Hertford $577 $237 $417 $569 $434 $220 $315 $(36) $2,733 $32,796 218% $15.77 217%
Hoke $626 $237 $417 $593 $434 $233 $368 $(9) $2,898 $34,775 231% $16.72 231%
Hyde $656 $237 $427 $569 $434 $241 $386 $(1) $2,948 $35,379 235% $17.01 235%
Iredell $700 $237 $427 $563 $434 $253 $407 $- $3,021 $36,246 241% $17.43 240%
Jackson $615 $237 $427 $552 $434 $230 $343 $(22) $2,815 $33,778 225% $16.24 224%
Johnston $795 $237 $391 $555 $434 $279 $443 $- $3,133 $37,599 250% $18.08 249%
Jones $629 $237 $417 $569 $434 $234 $357 $(15) $2,861 $34,331 228% $16.51 228%
NOTE: Annual and hourly LIS do not include refundable tax credits

THE 2010 LIVING INCOME STANDARD FOR NORTH CAROLINA 19
TWO‐PERSON FAMILY – (One Adult, One Child)
Appendix B: Detailed Living Income Standard Budgets by Family Type by County (cont.)
COUNTY Housing Food Childcare Health Care Transportation Miscellaneous
Payroll, State
& FederalIncome Taxes
with Non-Refundable Fed & State
Credits
RefundableTax
Credits Monthly LIS Annual LIS
LIS as % of FPL
($15,030) LIS Wage
LIS as %Min Wage
per Worker
Lee $652 $237 $427 $555 $434 $240 $371 $(8) $2,908 $34,894 232% $16.78 231%
Lenoir $577 $237 $417 $569 $434 $220 $315 $(36) $2,733 $32,796 218% $15.77 217%
Lincoln $618 $237 $427 $583 $434 $231 $362 $(12) $2,880 $34,557 230% $16.61 229%
Macon $639 $237 $417 $552 $434 $236 $354 $(16) $2,853 $34,237 228% $16.46 227%
Madison $613 $237 $471 $552 $434 $229 $366 $(10) $2,892 $34,707 231% $16.69 230%
Martin $690 $237 $417 $569 $434 $250 $400 $- $2,997 $35,965 239% $17.29 238%
McDowell $577 $237 $417 $563 $434 $220 $312 $(37) $2,721 $32,657 217% $15.70 217%
Mecklenburg $757 $237 $509 $583 $338 $268 $444 $- $3,137 $37,639 250% $18.10 250%
Mitchell $647 $237 $451 $552 $434 $239 $383 $(2) $2,940 $35,282 235% $16.96 234%
Montgomery $577 $237 $447 $583 $434 $220 $344 $(22) $2,820 $33,839 225% $16.27 224%
Moore $669 $237 $417 $555 $434 $245 $381 $(3) $2,934 $35,209 234% $16.93 233%
Nash $577 $237 $427 $569 $434 $220 $325 $(32) $2,756 $33,075 220% $15.90 219%
New Hanover $787 $237 $491 $593 $338 $276 $457 $- $3,179 $38,145 254% $18.34 253%
Northampton $577 $237 $417 $569 $434 $220 $315 $(36) $2,733 $32,796 218% $15.77 217%
Onslow $618 $237 $391 $593 $434 $231 $347 $(20) $2,830 $33,965 226% $16.33 225%
Orange $827 $237 $627 $555 $338 $287 $523 $- $3,394 $40,731 271% $19.58 270%
Pamlico $577 $237 $417 $569 $434 $220 $315 $(36) $2,733 $32,796 218% $15.77 217%
Pasquotank $648 $237 $487 $569 $434 $239 $407 $- $3,021 $36,249 241% $17.43 240%
Pender $621 $237 $427 $593 $434 $232 $370 $(8) $2,905 $34,857 232% $16.76 231%
Perquimans $656 $237 $417 $569 $434 $241 $380 $(4) $2,930 $35,155 234% $16.90 233%
Person $609 $237 $427 $555 $434 $228 $340 $(24) $2,806 $33,671 224% $16.19 223%
Pitt $640 $237 $407 $569 $434 $237 $359 $(14) $2,868 $34,420 229% $16.55 228%
Polk $657 $237 $427 $552 $434 $241 $377 $(6) $2,919 $35,029 233% $16.84 232%
Randolph $699 $237 $417 $545 $434 $253 $395 $- $2,979 $35,747 238% $17.19 237%
Richmond $577 $237 $417 $583 $434 $220 $327 $(31) $2,764 $33,167 221% $15.95 220%
Robeson $577 $237 $417 $593 $434 $220 $332 $(28) $2,782 $33,381 222% $16.05 221%
Rockingham $584 $237 $417 $545 $434 $222 $306 $(40) $2,704 $32,452 216% $15.60 215%
Rowan $658 $237 $427 $583 $338 $242 $337 $(25) $2,796 $33,555 223% $16.13 223%
Rutherford $641 $237 $417 $563 $434 $237 $362 $(12) $2,878 $34,533 230% $16.60 229%
Sampson $577 $237 $417 $593 $434 $220 $332 $(28) $2,782 $33,381 222% $16.05 221%
Scotland $606 $237 $417 $593 $434 $228 $353 $(17) $2,851 $34,206 228% $16.45 227%
Stanly $592 $237 $427 $583 $434 $224 $344 $(22) $2,818 $33,818 225% $16.26 224%
Stokes $666 $237 $427 $545 $434 $244 $379 $(5) $2,927 $35,121 234% $16.89 233%
Surry $577 $237 $417 $545 $434 $220 $301 $(43) $2,688 $32,253 215% $15.51 214%
Swain $577 $237 $427 $552 $434 $220 $311 $(38) $2,720 $32,641 217% $15.69 216%
Transylvania $736 $237 $417 $552 $434 $263 $418 $- $3,056 $36,673 244% $17.63 243%
Tyrrell $656 $237 $417 $569 $434 $241 $380 $(4) $2,930 $35,155 234% $16.90 233%
Union $757 $237 $491 $583 $434 $268 $477 $- $3,247 $38,961 259% $18.73 258%
Vance $577 $237 $427 $555 $434 $220 $313 $(37) $2,725 $32,704 218% $15.72 217%
Wake $795 $237 $630 $555 $338 $279 $507 $- $3,341 $40,088 267% $19.27 266%
Warren $588 $237 $417 $555 $434 $223 $315 $(36) $2,733 $32,793 218% $15.77 217%
Washington $618 $237 $417 $569 $434 $231 $349 $(19) $2,835 $34,018 226% $16.35 226%
Watauga $737 $237 $465 $563 $434 $263 $447 $- $3,145 $37,739 251% $18.14 250%
Wayne $603 $237 $417 $569 $434 $227 $338 $(25) $2,799 $33,591 223% $16.15 223%
Wilkes $577 $237 $427 $563 $434 $220 $317 $(34) $2,740 $32,881 219% $15.81 218%
Wilson $661 $237 $417 $569 $434 $242 $384 $(2) $2,941 $35,297 235% $16.97 234%
Yadkin $666 $237 $417 $545 $434 $244 $369 $(8) $2,903 $34,841 232% $16.75 231%
Yancey $577 $237 $417 $552 $434 $220 $305 $(41) $2,701 $32,417 216% $15.59 215%
NC Population-
Weighted Average $692 $237 $465 $566 $386 $251 $394 $(13) $2,990 $35,727 238% $17.18 237%

NC Budget and Tax Center20
THREE‐PERSON FAMILY – (One Adult, Two Children)
Appendix B: Detailed Living Income Standard Budgets by Family Type by County (cont.)
COUNTY Housing Food Childcare Health Care Transportation Miscellaneous
Payroll, State
& FederalIncome Taxes
with Non-Refundable Fed & State
Credits
RefundableTax
Credits Monthly LIS Annual LIS
LIS as % of FPL
($15,030) LIS Wage
LIS as %Min Wage
per Worker
Alamance $742 $334 $805 $636 $338 $290 $352 $(90) $3,407 $40,887 233% $19.66 271%
Alexander $614 $334 $805 $646 $434 $256 $337 $(114) $3,311 $39,734 226% $19.10 263%
Alleghany $577 $334 $783 $646 $434 $246 $313 $(174) $3,158 $37,894 216% $18.22 251%
Anson $577 $334 $786 $671 $434 $246 $322 $(153) $3,216 $38,596 220% $18.56 256%
Ashe $577 $334 $783 $646 $434 $246 $313 $(174) $3,158 $37,894 216% $18.22 251%
Avery $647 $334 $786 $646 $434 $265 $344 $(97) $3,358 $40,301 229% $19.38 267%
Beaufort $577 $334 $805 $653 $434 $246 $323 $(152) $3,219 $38,633 220% $18.57 256%
Bertie $577 $334 $824 $653 $434 $246 $330 $(129) $3,269 $39,230 223% $18.86 260%
Bladen $577 $334 $805 $683 $434 $246 $334 $(122) $3,291 $39,489 225% $18.99 262%
Brunswick $787 $334 $805 $683 $434 $303 $395 $(35) $3,705 $44,462 253% $21.38 295%
Buncombe $690 $334 $805 $632 $338 $276 $333 $(123) $3,286 $39,428 224% $18.96 261%
Burke $614 $334 $786 $646 $434 $256 $331 $(128) $3,272 $39,262 223% $18.88 260%
Cabarrus $757 $334 $907 $671 $338 $295 $386 $(45) $3,643 $43,719 249% $21.02 290%
Caldwell $614 $334 $805 $646 $434 $256 $337 $(114) $3,311 $39,734 226% $19.10 263%
Camden $656 $334 $783 $653 $434 $267 $348 $(94) $3,381 $40,577 231% $19.51 269%
Carteret $634 $334 $805 $653 $434 $261 $347 $(95) $3,373 $40,475 230% $19.46 268%
Caswell $592 $334 $783 $636 $434 $250 $316 $(168) $3,177 $38,124 217% $18.33 253%
Catawba $614 $334 $805 $646 $338 $256 $304 $(194) $3,103 $37,234 212% $17.90 247%
Chatham $827 $334 $972 $636 $434 $313 $432 $- $3,948 $47,377 270% $22.78 314%
Cherokee $577 $334 $783 $632 $434 $246 $309 $(184) $3,130 $37,563 214% $18.06 249%
Chowan $656 $334 $786 $653 $434 $267 $348 $(93) $3,386 $40,628 231% $19.53 269%
Clay $577 $334 $801 $632 $434 $246 $314 $(171) $3,168 $38,010 216% $18.27 252%
Cleveland $682 $334 $786 $646 $434 $274 $355 $(82) $3,429 $41,145 234% $19.78 273%
Columbus $577 $334 $783 $683 $434 $246 $325 $(147) $3,235 $38,818 221% $18.66 257%
Craven $630 $334 $805 $653 $434 $260 $345 $(96) $3,366 $40,389 230% $19.42 268%
Cumberland $678 $334 $750 $683 $338 $273 $325 $(147) $3,234 $38,811 221% $18.66 257%
Currituck $904 $334 $783 $653 $434 $334 $415 $(15) $3,843 $46,120 263% $22.17 306%
Dare $802 $334 $902 $653 $434 $307 $413 $(17) $3,828 $45,940 261% $22.09 305%
Davidson $598 $334 $746 $623 $338 $252 $268 $(288) $2,871 $34,454 196% $16.56 228%
Davie $666 $334 $805 $623 $434 $270 $349 $(93) $3,388 $40,655 231% $19.55 270%
Duplin $577 $334 $783 $683 $434 $246 $325 $(147) $3,235 $38,818 221% $18.66 257%
Durham $827 $334 $1,055 $636 $338 $313 $428 $(2) $3,930 $47,163 268% $22.67 313%
Edgecombe $577 $334 $801 $653 $434 $246 $321 $(155) $3,211 $38,533 219% $18.53 256%
Forsyth $666 $334 $917 $623 $338 $270 $353 $(83) $3,418 $41,021 233% $19.72 272%
Franklin $795 $334 $786 $636 $434 $305 $384 $(47) $3,626 $43,511 248% $20.92 289%
Gaston $757 $334 $805 $671 $338 $295 $364 $(72) $3,491 $41,894 238% $20.14 278%
Gates $656 $334 $786 $653 $434 $267 $348 $(93) $3,386 $40,628 231% $19.53 269%
Graham $577 $334 $786 $632 $434 $246 $310 $(182) $3,136 $37,637 214% $18.09 250%
Granville $640 $334 $805 $636 $434 $263 $344 $(97) $3,359 $40,306 229% $19.38 267%
Greene $577 $334 $801 $653 $434 $246 $321 $(155) $3,211 $38,533 219% $18.53 256%
Guilford $699 $334 $903 $623 $338 $279 $359 $(77) $3,458 $41,497 236% $19.95 275%
Halifax $577 $334 $785 $653 $434 $246 $316 $(167) $3,178 $38,135 217% $18.33 253%
Harnett $592 $334 $805 $636 $434 $250 $323 $(151) $3,223 $38,671 220% $18.59 256%
Haywood $633 $334 $786 $632 $434 $261 $334 $(120) $3,294 $39,531 225% $19.01 262%
Henderson $690 $334 $805 $632 $434 $276 $358 $(78) $3,451 $41,415 236% $19.91 275%
Hertford $577 $334 $783 $653 $434 $246 $315 $(169) $3,174 $38,086 217% $18.31 253%
Hoke $626 $334 $785 $683 $434 $259 $346 $(95) $3,372 $40,463 230% $19.45 268%
Hyde $656 $334 $801 $653 $434 $267 $351 $(90) $3,407 $40,884 233% $19.66 271%
Iredell $700 $334 $805 $646 $434 $279 $363 $(73) $3,488 $41,859 238% $20.12 278%
Jackson $615 $334 $805 $632 $434 $256 $333 $(123) $3,286 $39,435 224% $18.96 262%
Johnston $795 $334 $769 $636 $434 $305 $380 $(51) $3,602 $43,221 246% $20.78 287%
Jones $629 $334 $783 $653 $434 $260 $339 $(111) $3,321 $39,853 227% $19.16 264%
NOTE: Annual and hourly LIS do not include refundable tax credits

THE 2010 LIVING INCOME STANDARD FOR NORTH CAROLINA 21
THREE‐PERSON FAMILY – (One Adult, Two Children)
Appendix B: Detailed Living Income Standard Budgets by Family Type by County (cont.)
COUNTY Housing Food Childcare Health Care Transportation Miscellaneous
Payroll, State
& FederalIncome Taxes
with Non-Refundable Fed & State
Credits
RefundableTax
Credits Monthly LIS Annual LIS
LIS as % of FPL
($15,030) LIS Wage
LIS as %Min Wage
per Worker
Lee $652 $334 $805 $636 $434 $266 $348 $(94) $3,381 $40,566 231% $19.50 269%
Lenoir $577 $334 $785 $653 $434 $246 $316 $(167) $3,178 $38,135 217% $18.33 253%
Lincoln $618 $334 $805 $671 $434 $257 $346 $(96) $3,369 $40,427 230% $19.44 268%
Macon $639 $334 $783 $632 $434 $263 $336 $(117) $3,304 $39,646 226% $19.06 263%
Madison $613 $334 $879 $632 $434 $256 $353 $(83) $3,417 $41,009 233% $19.72 272%
Martin $690 $334 $786 $653 $434 $276 $358 $(78) $3,454 $41,450 236% $19.93 275%
McDowell $577 $334 $783 $646 $434 $246 $313 $(174) $3,158 $37,894 216% $18.22 251%
Mecklenburg $757 $334 $977 $671 $338 $295 $401 $(30) $3,743 $44,913 256% $21.59 298%
Mitchell $647 $334 $825 $632 $434 $265 $350 $(92) $3,395 $40,739 232% $19.59 270%
Montgomery $577 $334 $813 $671 $434 $246 $332 $(124) $3,283 $39,392 224% $18.94 261%
Moore $669 $334 $786 $636 $434 $271 $348 $(93) $3,384 $40,611 231% $19.52 269%
Nash $577 $334 $821 $653 $434 $246 $329 $(132) $3,263 $39,155 223% $18.82 260%
New Hanover $787 $334 $937 $671 $338 $303 $400 $(30) $3,740 $44,881 255% $21.58 298%
Northampton $577 $334 $783 $653 $434 $246 $315 $(169) $3,174 $38,086 217% $18.31 253%
Onslow $618 $334 $749 $671 $434 $257 $327 $(142) $3,248 $38,971 222% $18.74 258%
Orange $827 $334 $1,191 $636 $338 $313 $484 $- $4,124 $49,483 282% $23.79 328%
Pamlico $577 $334 $783 $653 $434 $246 $315 $(169) $3,174 $38,086 217% $18.31 253%
Pasquotank $648 $334 $865 $653 $434 $265 $364 $(72) $3,491 $41,887 238% $20.14 278%
Pender $621 $334 $801 $671 $434 $258 $346 $(96) $3,369 $40,424 230% $19.43 268%
Perquimans $656 $334 $783 $653 $434 $267 $348 $(94) $3,381 $40,577 231% $19.51 269%
Person $609 $334 $801 $636 $434 $255 $330 $(129) $3,269 $39,233 223% $18.86 260%
Pitt $640 $334 $785 $653 $434 $263 $344 $(99) $3,354 $40,250 229% $19.35 267%
Polk $657 $334 $805 $632 $434 $268 $348 $(93) $3,385 $40,615 231% $19.53 269%
Randolph $699 $334 $785 $623 $434 $279 $354 $(82) $3,426 $41,114 234% $19.77 273%
Richmond $577 $334 $783 $671 $434 $246 $321 $(156) $3,210 $38,521 219% $18.52 255%
Robeson $577 $334 $786 $683 $434 $246 $328 $(136) $3,251 $39,016 222% $18.76 259%
Rockingham $584 $334 $785 $623 $434 $248 $309 $(183) $3,134 $37,607 214% $18.08 249%
Rowan $658 $334 $805 $671 $338 $268 $332 $(125) $3,281 $39,376 224% $18.93 261%
Rutherford $641 $334 $785 $646 $434 $263 $342 $(104) $3,341 $40,090 228% $19.27 266%
Sampson $577 $334 $783 $683 $434 $246 $325 $(147) $3,235 $38,818 221% $18.66 257%
Scotland $606 $334 $786 $683 $434 $254 $340 $(108) $3,328 $39,933 227% $19.20 265%
Stanly $592 $334 $805 $671 $434 $250 $336 $(116) $3,306 $39,667 226% $19.07 263%
Stokes $666 $334 $805 $623 $434 $270 $349 $(93) $3,388 $40,655 231% $19.55 270%
Surry $577 $334 $785 $623 $434 $246 $306 $(190) $3,116 $37,386 213% $17.97 248%
Swain $577 $334 $805 $632 $434 $246 $316 $(168) $3,176 $38,110 217% $18.32 253%
Transylvania $736 $334 $786 $632 $434 $289 $366 $(70) $3,507 $42,087 240% $20.23 279%
Tyrrell $656 $334 $783 $653 $434 $267 $348 $(94) $3,381 $40,577 231% $19.51 269%
Union $757 $334 $910 $671 $434 $295 $407 $(24) $3,783 $45,400 258% $21.83 301%
Vance $577 $334 $805 $636 $434 $246 $317 $(165) $3,183 $38,197 217% $18.36 253%
Wake $795 $334 $1,151 $636 $338 $305 $450 $- $4,009 $48,107 274% $23.13 319%
Warren $588 $334 $783 $636 $434 $249 $314 $(171) $3,166 $37,998 216% $18.27 252%
Washington $618 $334 $783 $653 $434 $257 $334 $(121) $3,292 $39,505 225% $18.99 262%
Watauga $737 $334 $843 $646 $434 $289 $382 $(49) $3,616 $43,394 247% $20.86 288%
Wayne $603 $334 $786 $653 $434 $253 $329 $(133) $3,259 $39,106 223% $18.80 259%
Wilkes $577 $334 $804 $646 $434 $246 $320 $(159) $3,201 $38,416 219% $18.47 255%
Wilson $661 $334 $786 $653 $434 $269 $350 $(92) $3,395 $40,736 232% $19.58 270%
Yadkin $666 $334 $783 $623 $434 $270 $344 $(98) $3,356 $40,272 229% $19.36 267%
Yancey $577 $334 $786 $632 $434 $246 $310 $(182) $3,136 $37,637 214% $18.09 250%
NC Population
Weighted Average $692 $334 $876 $650 $386 $277 $365 $(86) $3579 $41,920 239% $20.15 278%

NC Budget and Tax Center22
FOUR‐PERSON FAMILY – (Two Adults, Two Children)
Appendix B: Detailed Living Income Standard Budgets by Family Type by County (cont.)
COUNTY Housing Food Childcare Health Care Transportation Miscellaneous
Payroll, State
& FederalIncome Taxes
with Non-Refundable Fed & State
Credits
RefundableTax
Credits Monthly LIS Annual LIS
LIS as % of FPL
($15,030) LIS Wage
LIS as %Min Wage
per Worker
Alamance $742 $502 $812 $729 $539 $336 $409 $(138) $3,930 $47,162 213% $22.67 156%
Alexander $614 $502 $812 $740 $691 $301 $409 $(138) $3,931 $47,168 213% $22.68 156%
Alleghany $577 $502 $787 $740 $691 $291 $394 $(154) $3,828 $45,940 208% $22.09 152%
Anson $577 $502 $790 $768 $691 $291 $401 $(147) $3,872 $46,469 210% $22.34 154%
Ashe $577 $502 $787 $740 $691 $291 $394 $(154) $3,828 $45,940 208% $22.09 152%
Avery $647 $502 $790 $740 $691 $310 $413 $(134) $3,959 $47,508 215% $22.84 158%
Beaufort $577 $502 $833 $748 $691 $291 $406 $(142) $3,906 $46,871 212% $22.53 155%
Bertie $577 $502 $803 $748 $691 $291 $399 $(148) $3,863 $46,359 210% $22.29 154%
Bladen $577 $502 $812 $781 $691 $291 $408 $(140) $3,922 $47,070 213% $22.63 156%
Brunswick $787 $502 $812 $781 $691 $348 $463 $(83) $4,302 $51,619 233% $24.82 171%
Buncombe $690 $502 $812 $725 $539 $322 $394 $(153) $3,831 $45,969 208% $22.10 152%
Burke $614 $502 $790 $740 $691 $301 $405 $(143) $3,899 $46,793 212% $22.50 155%
Cabarrus $757 $502 $914 $768 $539 $340 $442 $(104) $4,157 $49,890 226% $23.99 165%
Caldwell $614 $502 $812 $740 $691 $301 $409 $(138) $3,931 $47,168 213% $22.68 156%
Camden $656 $502 $787 $748 $691 $313 $417 $(130) $3,983 $47,798 216% $22.98 158%
Carteret $634 $502 $812 $748 $691 $307 $416 $(131) $3,979 $47,748 216% $22.96 158%
Caswell $592 $502 $787 $729 $691 $295 $396 $(152) $3,840 $46,080 208% $22.15 153%
Catawba $614 $502 $812 $740 $539 $301 $373 $(193) $3,687 $44,245 200% $21.27 147%
Chatham $827 $502 $968 $729 $691 $359 $496 $(50) $4,521 $54,258 245% $26.09 180%
Cherokee $577 $502 $787 $725 $691 $291 $391 $(157) $3,807 $45,688 207% $21.97 151%
Chowan $656 $502 $790 $748 $691 $313 $417 $(130) $3,987 $47,849 216% $23.00 159%
Clay $577 $502 $809 $725 $691 $291 $396 $(152) $3,839 $46,064 208% $22.15 153%
Cleveland $682 $502 $790 $740 $691 $320 $423 $(125) $4,022 $48,266 218% $23.20 160%
Columbus $577 $502 $787 $781 $691 $291 $403 $(145) $3,887 $46,643 211% $22.42 155%
Craven $630 $502 $812 $748 $691 $306 $415 $(132) $3,972 $47,661 216% $22.91 158%
Cumberland $678 $502 $761 $781 $539 $319 $392 $(155) $3,816 $45,794 207% $22.02 152%
Currituck $904 $502 $787 $748 $691 $380 $482 $(63) $4,431 $53,170 240% $25.56 176%
Dare $802 $502 $898 $748 $691 $352 $479 $(67) $4,404 $52,854 239% $25.41 175%
Davidson $598 $502 $750 $715 $539 $297 $338 $(274) $3,464 $41,572 188% $19.99 138%
Davie $666 $502 $812 $715 $691 $315 $418 $(130) $3,989 $47,870 216% $23.01 159%
Duplin $577 $502 $787 $781 $691 $291 $403 $(145) $3,887 $46,643 211% $22.42 155%
Durham $827 $502 $1,050 $729 $539 $359 $481 $(65) $4,422 $53,063 240% $25.51 176%
Edgecombe $577 $502 $809 $748 $691 $291 $401 $(147) $3,872 $46,462 210% $22.34 154%
Forsyth $666 $502 $913 $715 $539 $315 $407 $(140) $3,917 $47,000 213% $22.60 156%
Franklin $795 $502 $790 $729 $691 $350 $450 $(96) $4,211 $50,528 229% $24.29 168%
Gaston $757 $502 $812 $768 $539 $340 $421 $(126) $4,012 $48,150 218% $23.15 160%
Gates $656 $502 $790 $748 $691 $313 $417 $(130) $3,987 $47,849 216% $23.00 159%
Graham $577 $502 $790 $725 $691 $291 $392 $(156) $3,812 $45,739 207% $21.99 152%
Granville $640 $502 $812 $729 $691 $308 $414 $(134) $3,962 $47,546 215% $22.86 158%
Greene $577 $502 $809 $748 $691 $291 $401 $(147) $3,872 $46,462 210% $22.34 154%
Guilford $699 $502 $899 $715 $539 $324 $413 $(134) $3,956 $47,476 215% $22.82 157%
Halifax $577 $502 $789 $748 $691 $291 $396 $(151) $3,843 $46,120 209% $22.17 153%
Harnett $592 $502 $812 $729 $691 $295 $401 $(147) $3,876 $46,506 210% $22.36 154%
Haywood $633 $502 $790 $725 $691 $307 $407 $(141) $3,913 $46,953 212% $22.57 156%
Henderson $690 $502 $812 $725 $691 $322 $426 $(121) $4,047 $48,563 220% $23.35 161%
Hertford $577 $502 $787 $748 $691 $291 $396 $(152) $3,841 $46,086 208% $22.16 153%
Hoke $626 $502 $789 $781 $691 $305 $416 $(131) $3,978 $47,739 216% $22.95 158%
Hyde $656 $502 $809 $748 $691 $313 $421 $(126) $4,014 $48,173 218% $23.16 160%
Iredell $700 $502 $812 $740 $691 $325 $432 $(115) $4,086 $49,031 222% $23.57 163%
Jackson $615 $502 $812 $725 $691 $302 $406 $(141) $3,911 $46,938 212% $22.57 156%
Johnston $795 $502 $776 $729 $691 $350 $447 $(99) $4,191 $50,290 227% $24.18 167%
Jones $629 $502 $787 $748 $691 $305 $410 $(138) $3,934 $47,213 214% $22.70 157%
NOTE: Annual and hourly LIS do not include refundable tax credits

THE 2010 LIVING INCOME STANDARD FOR NORTH CAROLINA 23
FOUR‐PERSON FAMILY – (Two Adults, Two Children)
Appendix B: Detailed Living Income Standard Budgets by Family Type by County (cont.)
COUNTY Housing Food Childcare Health Care Transportation Miscellaneous
Payroll, State
& FederalIncome Taxes
with Non-Refundable Fed & State
Credits
RefundableTax
Credits Monthly LIS Annual LIS
LIS as % of FPL
($15,030) LIS Wage
LIS as %Min Wage
per Worker
Lee $652 $502 $812 $729 $691 $312 $417 $(130) $3,984 $47,806 216% $22.98 159%
Lenoir $577 $502 $789 $748 $691 $291 $396 $(151) $3,843 $46,120 209% $22.17 153%
Lincoln $618 $502 $812 $768 $691 $302 $416 $(131) $3,978 $47,732 216% $22.95 158%
Macon $639 $502 $787 $725 $691 $308 $407 $(140) $3,919 $47,031 213% $22.61 156%
Madison $613 $502 $875 $725 $691 $301 $419 $(128) $3,997 $47,969 217% $23.06 159%
Martin $690 $502 $790 $748 $691 $322 $426 $(121) $4,049 $48,585 220% $23.36 161%
McDowell $577 $502 $787 $740 $691 $291 $394 $(154) $3,828 $45,940 208% $22.09 152%
Mecklenburg $757 $502 $986 $768 $539 $340 $457 $(89) $4,260 $51,118 231% $24.58 169%
Mitchell $647 $502 $833 $725 $691 $310 $419 $(128) $3,999 $47,989 217% $23.07 159%
Montgomery $577 $502 $817 $768 $691 $291 $406 $(141) $3,911 $46,930 212% $22.56 156%
Moore $669 $502 $790 $729 $691 $316 $417 $(130) $3,983 $47,799 216% $22.98 158%
Nash $577 $502 $829 $748 $691 $291 $405 $(143) $3,900 $46,803 212% $22.50 155%
New Hanover $787 $502 $933 $781 $539 $348 $457 $(89) $4,257 $51,089 231% $24.56 169%
Northampton $577 $502 $787 $748 $691 $291 $396 $(152) $3,841 $46,086 208% $22.16 153%
Onslow $618 $502 $756 $781 $691 $302 $407 $(140) $3,917 $47,003 213% $22.60 156%
Orange $827 $502 $1,191 $729 $539 $359 $510 $(35) $4,622 $55,468 251% $26.67 184%
Pamlico $577 $502 $787 $748 $691 $291 $396 $(152) $3,841 $46,086 208% $22.16 153%
Pasquotank $648 $502 $872 $748 $691 $311 $432 $(114) $4,090 $49,074 222% $23.59 163%
Pender $621 $502 $809 $781 $691 $303 $419 $(128) $3,998 $47,972 217% $23.06 159%
Perquimans $656 $502 $787 $748 $691 $313 $417 $(130) $3,983 $47,798 216% $22.98 158%
Person $609 $502 $809 $729 $691 $300 $405 $(143) $3,902 $46,823 212% $22.51 155%
Pitt $640 $502 $792 $748 $691 $308 $414 $(134) $3,961 $47,536 215% $22.85 158%
Polk $657 $502 $812 $725 $691 $313 $417 $(130) $3,987 $47,848 216% $23.00 159%
Randolph $699 $502 $789 $715 $691 $324 $422 $(126) $4,016 $48,193 218% $23.17 160%
Richmond $577 $502 $787 $768 $691 $291 $400 $(148) $3,868 $46,418 210% $22.32 154%
Robeson $577 $502 $790 $781 $691 $291 $403 $(144) $3,891 $46,695 211% $22.45 155%
Rockingham $584 $502 $789 $715 $691 $293 $391 $(157) $3,808 $45,702 207% $21.97 152%
Rowan $658 $502 $812 $768 $539 $313 $395 $(153) $3,834 $46,005 208% $22.12 153%
Rutherford $641 $502 $789 $740 $691 $309 $411 $(136) $3,947 $47,361 214% $22.77 157%
Sampson $577 $502 $787 $781 $691 $291 $403 $(145) $3,887 $46,643 211% $22.42 155%
Scotland $606 $502 $790 $781 $691 $299 $411 $(136) $3,944 $47,323 214% $22.75 157%
Stanly $592 $502 $812 $768 $691 $295 $409 $(138) $3,931 $47,169 213% $22.68 156%
Stokes $666 $502 $812 $715 $691 $315 $418 $(130) $3,989 $47,870 216% $23.01 159%
Surry $577 $502 $789 $715 $691 $291 $389 $(159) $3,796 $45,550 206% $21.90 151%
Swain $577 $502 $812 $725 $691 $291 $396 $(151) $3,843 $46,115 209% $22.17 153%
Transylvania $736 $502 $790 $725 $691 $334 $434 $(113) $4,099 $49,184 222% $23.65 163%
Tyrrell $656 $502 $787 $748 $691 $313 $417 $(130) $3,983 $47,798 216% $22.98 158%
Union $757 $502 $906 $768 $691 $340 $472 $(74) $4,362 $52,347 237% $25.17 174%
Vance $577 $502 $812 $729 $691 $291 $397 $(151) $3,848 $46,181 209% $22.20 153%
Wake $795 $502 $1,180 $729 $539 $350 $500 $(46) $4,549 $54,587 247% $26.24 181%
Warren $588 $502 $787 $729 $691 $294 $395 $(153) $3,833 $45,993 208% $22.11 152%
Washington $618 $502 $787 $748 $691 $302 $407 $(141) $3,915 $46,974 212% $22.58 156%
Watauga $737 $502 $850 $740 $691 $335 $450 $(97) $4,207 $50,481 228% $24.27 167%
Wayne $603 $502 $790 $748 $691 $298 $403 $(144) $3,892 $46,701 211% $22.45 155%
Wilkes $577 $502 $812 $740 $691 $291 $399 $(148) $3,864 $46,367 210% $22.29 154%
Wilson $661 $502 $790 $748 $691 $314 $419 $(128) $3,996 $47,957 217% $23.06 159%
Yadkin $666 $502 $787 $715 $691 $315 $413 $(135) $3,954 $47,444 215% $22.81 157%
Yancey $577 $502 $790 $725 $691 $291 $392 $(156) $3,812 $45,739 207% $21.99 152%
NC Population
Weighted Average $692 $502 $883 $744 $614 $322 $429 $(119) $4,187 $48,814 221% $23.47 162%
NC Budget and Tax Center24
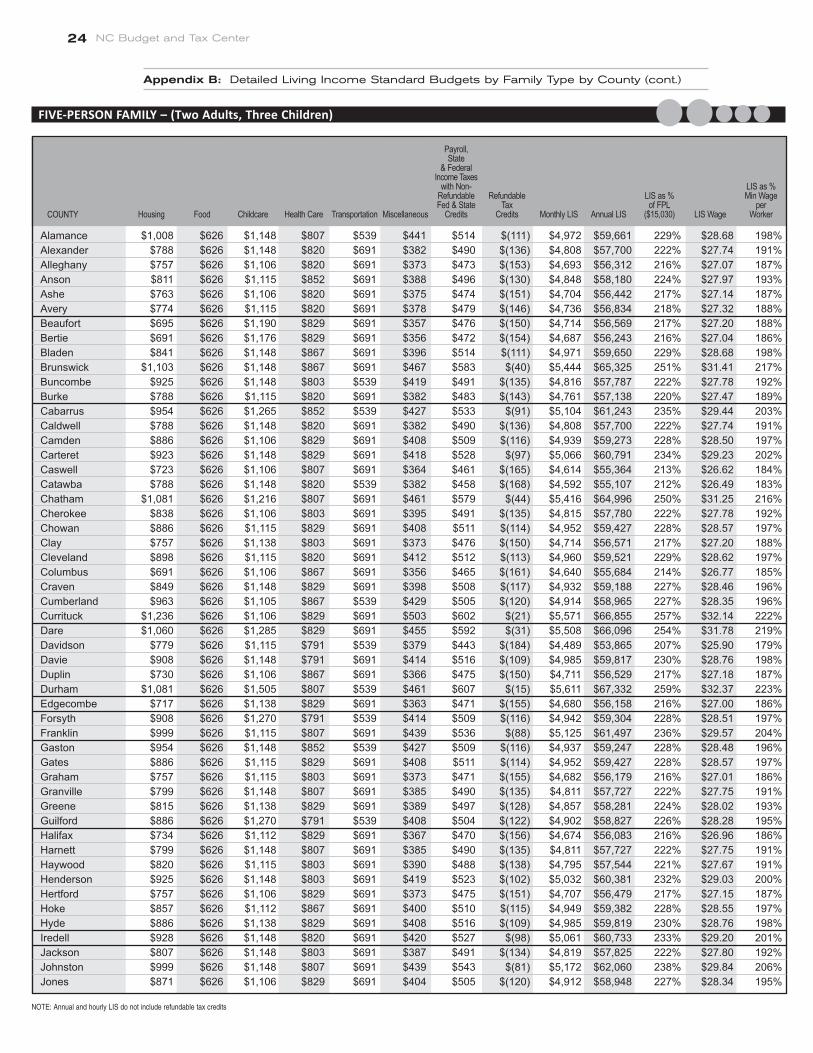
FIVE‐PERSON FAMILY – (Two Adults, Three Children)
Appendix B: Detailed Living Income Standard Budgets by Family Type by County (cont.)
COUNTY Housing Food Childcare Health Care Transportation Miscellaneous
Payroll, State
& FederalIncome Taxes
with Non-Refundable Fed & State
Credits
RefundableTax
Credits Monthly LIS Annual LIS
LIS as % of FPL
($15,030) LIS Wage
LIS as %Min Wage
per Worker
Alamance $1,008 $626 $1,148 $807 $539 $441 $514 $(111) $4,972 $59,661 229% $28.68 198%
Alexander $788 $626 $1,148 $820 $691 $382 $490 $(136) $4,808 $57,700 222% $27.74 191%
Alleghany $757 $626 $1,106 $820 $691 $373 $473 $(153) $4,693 $56,312 216% $27.07 187%
Anson $811 $626 $1,115 $852 $691 $388 $496 $(130) $4,848 $58,180 224% $27.97 193%
Ashe $763 $626 $1,106 $820 $691 $375 $474 $(151) $4,704 $56,442 217% $27.14 187%
Avery $774 $626 $1,115 $820 $691 $378 $479 $(146) $4,736 $56,834 218% $27.32 188%
Beaufort $695 $626 $1,190 $829 $691 $357 $476 $(150) $4,714 $56,569 217% $27.20 188%
Bertie $691 $626 $1,176 $829 $691 $356 $472 $(154) $4,687 $56,243 216% $27.04 186%
Bladen $841 $626 $1,148 $867 $691 $396 $514 $(111) $4,971 $59,650 229% $28.68 198%
Brunswick $1,103 $626 $1,148 $867 $691 $467 $583 $(40) $5,444 $65,325 251% $31.41 217%
Buncombe $925 $626 $1,148 $803 $539 $419 $491 $(135) $4,816 $57,787 222% $27.78 192%
Burke $788 $626 $1,115 $820 $691 $382 $483 $(143) $4,761 $57,138 220% $27.47 189%
Cabarrus $954 $626 $1,265 $852 $539 $427 $533 $(91) $5,104 $61,243 235% $29.44 203%
Caldwell $788 $626 $1,148 $820 $691 $382 $490 $(136) $4,808 $57,700 222% $27.74 191%
Camden $886 $626 $1,106 $829 $691 $408 $509 $(116) $4,939 $59,273 228% $28.50 197%
Carteret $923 $626 $1,148 $829 $691 $418 $528 $(97) $5,066 $60,791 234% $29.23 202%
Caswell $723 $626 $1,106 $807 $691 $364 $461 $(165) $4,614 $55,364 213% $26.62 184%
Catawba $788 $626 $1,148 $820 $539 $382 $458 $(168) $4,592 $55,107 212% $26.49 183%
Chatham $1,081 $626 $1,216 $807 $691 $461 $579 $(44) $5,416 $64,996 250% $31.25 216%
Cherokee $838 $626 $1,106 $803 $691 $395 $491 $(135) $4,815 $57,780 222% $27.78 192%
Chowan $886 $626 $1,115 $829 $691 $408 $511 $(114) $4,952 $59,427 228% $28.57 197%
Clay $757 $626 $1,138 $803 $691 $373 $476 $(150) $4,714 $56,571 217% $27.20 188%
Cleveland $898 $626 $1,115 $820 $691 $412 $512 $(113) $4,960 $59,521 229% $28.62 197%
Columbus $691 $626 $1,106 $867 $691 $356 $465 $(161) $4,640 $55,684 214% $26.77 185%
Craven $849 $626 $1,148 $829 $691 $398 $508 $(117) $4,932 $59,188 227% $28.46 196%
Cumberland $963 $626 $1,105 $867 $539 $429 $505 $(120) $4,914 $58,965 227% $28.35 196%
Currituck $1,236 $626 $1,106 $829 $691 $503 $602 $(21) $5,571 $66,855 257% $32.14 222%
Dare $1,060 $626 $1,285 $829 $691 $455 $592 $(31) $5,508 $66,096 254% $31.78 219%
Davidson $779 $626 $1,115 $791 $539 $379 $443 $(184) $4,489 $53,865 207% $25.90 179%
Davie $908 $626 $1,148 $791 $691 $414 $516 $(109) $4,985 $59,817 230% $28.76 198%
Duplin $730 $626 $1,106 $867 $691 $366 $475 $(150) $4,711 $56,529 217% $27.18 187%
Durham $1,081 $626 $1,505 $807 $539 $461 $607 $(15) $5,611 $67,332 259% $32.37 223%
Edgecombe $717 $626 $1,138 $829 $691 $363 $471 $(155) $4,680 $56,158 216% $27.00 186%
Forsyth $908 $626 $1,270 $791 $539 $414 $509 $(116) $4,942 $59,304 228% $28.51 197%
Franklin $999 $626 $1,115 $807 $691 $439 $536 $(88) $5,125 $61,497 236% $29.57 204%
Gaston $954 $626 $1,148 $852 $539 $427 $509 $(116) $4,937 $59,247 228% $28.48 196%
Gates $886 $626 $1,115 $829 $691 $408 $511 $(114) $4,952 $59,427 228% $28.57 197%
Graham $757 $626 $1,115 $803 $691 $373 $471 $(155) $4,682 $56,179 216% $27.01 186%
Granville $799 $626 $1,148 $807 $691 $385 $490 $(135) $4,811 $57,727 222% $27.75 191%
Greene $815 $626 $1,138 $829 $691 $389 $497 $(128) $4,857 $58,281 224% $28.02 193%
Guilford $886 $626 $1,270 $791 $539 $408 $504 $(122) $4,902 $58,827 226% $28.28 195%
Halifax $734 $626 $1,112 $829 $691 $367 $470 $(156) $4,674 $56,083 216% $26.96 186%
Harnett $799 $626 $1,148 $807 $691 $385 $490 $(135) $4,811 $57,727 222% $27.75 191%
Haywood $820 $626 $1,115 $803 $691 $390 $488 $(138) $4,795 $57,544 221% $27.67 191%
Henderson $925 $626 $1,148 $803 $691 $419 $523 $(102) $5,032 $60,381 232% $29.03 200%
Hertford $757 $626 $1,106 $829 $691 $373 $475 $(151) $4,707 $56,479 217% $27.15 187%
Hoke $857 $626 $1,112 $867 $691 $400 $510 $(115) $4,949 $59,382 228% $28.55 197%
Hyde $886 $626 $1,138 $829 $691 $408 $516 $(109) $4,985 $59,819 230% $28.76 198%
Iredell $928 $626 $1,148 $820 $691 $420 $527 $(98) $5,061 $60,733 233% $29.20 201%
Jackson $807 $626 $1,148 $803 $691 $387 $491 $(134) $4,819 $57,825 222% $27.80 192%
Johnston $999 $626 $1,148 $807 $691 $439 $543 $(81) $5,172 $62,060 238% $29.84 206%
Jones $871 $626 $1,106 $829 $691 $404 $505 $(120) $4,912 $58,948 227% $28.34 195%
NOTE: Annual and hourly LIS do not include refundable tax credits

THE 2010 LIVING INCOME STANDARD FOR NORTH CAROLINA 25
FIVE‐PERSON FAMILY – (Two Adults, Three Children)
Appendix B: Detailed Living Income Standard Budgets by Family Type by County (cont.)
COUNTY Housing Food Childcare Health Care Transportation Miscellaneous
Payroll, State
& FederalIncome Taxes
with Non-Refundable Fed & State
Credits
RefundableTax
Credits Monthly LIS Annual LIS
LIS as % of FPL
($15,030) LIS Wage
LIS as %Min Wage
per Worker
Lee $801 $626 $1,148 $807 $691 $385 $491 $(135) $4,814 $57,771 222% $27.77 192%
Lenoir $690 $626 $1,112 $829 $691 $355 $458 $(168) $4,594 $55,130 212% $26.50 183%
Lincoln $747 $626 $1,148 $852 $691 $371 $486 $(140) $4,780 $57,356 220% $27.58 190%
Macon $789 $626 $1,106 $803 $691 $382 $478 $(148) $4,727 $56,718 218% $27.27 188%
Madison $745 $626 $1,216 $803 $691 $370 $489 $(136) $4,803 $57,642 222% $27.71 191%
Martin $925 $626 $1,115 $829 $691 $419 $521 $(103) $5,023 $60,272 232% $28.98 200%
McDowell $747 $626 $1,106 $820 $691 $371 $470 $(156) $4,675 $56,096 216% $26.97 186%
Mecklenburg $954 $626 $1,422 $852 $539 $427 $566 $(58) $5,327 $63,921 246% $30.73 212%
Mitchell $774 $626 $1,138 $803 $691 $378 $481 $(145) $4,745 $56,939 219% $27.37 189%
Montgomery $720 $626 $1,106 $852 $691 $363 $470 $(156) $4,671 $56,055 215% $26.95 186%
Moore $962 $626 $1,115 $807 $691 $429 $526 $(98) $5,058 $60,695 233% $29.18 201%
Nash $717 $626 $1,198 $829 $691 $363 $483 $(142) $4,765 $57,182 220% $27.49 190%
New Hanover $1,103 $626 $1,330 $867 $539 $467 $589 $(34) $5,486 $65,836 253% $31.65 218%
Northampton $734 $626 $1,106 $829 $691 $367 $469 $(157) $4,665 $55,981 215% $26.91 186%
Onslow $868 $626 $1,088 $867 $691 $403 $508 $(117) $4,934 $59,211 228% $28.47 196%
Orange $1,081 $626 $1,692 $807 $539 $461 $671 $- $5,877 $70,522 271% $33.90 234%
Pamlico $726 $626 $1,106 $829 $691 $365 $467 $(159) $4,651 $55,807 214% $26.83 185%
Pasquotank $941 $626 $1,148 $829 $691 $423 $532 $(92) $5,098 $61,181 235% $29.41 203%
Pender $817 $626 $1,138 $867 $691 $390 $505 $(120) $4,913 $58,959 227% $28.35 195%
Perquimans $886 $626 $1,106 $829 $691 $408 $509 $(116) $4,939 $59,273 228% $28.50 197%
Person $727 $626 $1,138 $807 $691 $365 $469 $(157) $4,666 $55,997 215% $26.92 186%
Pitt $887 $626 $1,148 $829 $691 $409 $518 $(107) $5,001 $60,011 231% $28.85 199%
Polk $821 $626 $1,148 $803 $691 $391 $495 $(130) $4,844 $58,128 223% $27.95 193%
Randolph $886 $626 $1,112 $791 $691 $408 $502 $(123) $4,894 $58,726 226% $28.23 195%
Richmond $725 $626 $1,106 $852 $691 $365 $471 $(155) $4,680 $56,163 216% $27.00 186%
Robeson $692 $626 $1,115 $867 $691 $356 $467 $(159) $4,655 $55,859 215% $26.86 185%
Rockingham $725 $626 $1,112 $791 $691 $365 $460 $(166) $4,603 $55,238 212% $26.56 183%
Rowan $939 $626 $1,148 $852 $539 $423 $505 $(120) $4,910 $58,922 226% $28.33 195%
Rutherford $767 $626 $1,112 $820 $691 $376 $477 $(149) $4,719 $56,631 218% $27.23 188%
Sampson $801 $626 $1,106 $867 $691 $385 $494 $(131) $4,839 $58,067 223% $27.92 193%
Scotland $736 $626 $1,115 $867 $691 $368 $479 $(147) $4,734 $56,812 218% $27.31 188%
Stanly $806 $626 $1,148 $852 $691 $387 $501 $(124) $4,886 $58,634 225% $28.19 194%
Stokes $908 $626 $1,148 $791 $691 $414 $516 $(109) $4,985 $59,817 230% $28.76 198%
Surry $771 $626 $1,112 $791 $691 $377 $472 $(154) $4,686 $56,235 216% $27.04 186%
Swain $757 $626 $1,148 $803 $691 $373 $478 $(148) $4,728 $56,742 218% $27.28 188%
Transylvania $929 $626 $1,115 $803 $691 $420 $517 $(108) $4,992 $59,905 230% $28.80 199%
Tyrrell $886 $626 $1,106 $829 $691 $408 $509 $(116) $4,939 $59,273 228% $28.50 197%
Union $954 $626 $1,249 $852 $691 $427 $561 $(62) $5,297 $63,563 244% $30.56 211%
Vance $691 $626 $1,148 $807 $691 $356 $462 $(165) $4,616 $55,388 213% $26.63 184%
Wake $999 $626 $1,621 $807 $539 $439 $610 $(13) $5,628 $67,534 260% $32.47 224%
Warren $719 $626 $1,106 $807 $691 $363 $460 $(166) $4,606 $55,278 212% $26.58 183%
Washington $742 $626 $1,106 $829 $691 $369 $471 $(155) $4,679 $56,154 216% $27.00 186%
Watauga $896 $626 $1,148 $820 $691 $411 $518 $(106) $5,003 $60,040 231% $28.87 199%
Wayne $755 $626 $1,115 $829 $691 $373 $476 $(150) $4,716 $56,589 217% $27.21 188%
Wilkes $740 $626 $1,147 $820 $691 $369 $477 $(149) $4,720 $56,644 218% $27.23 188%
Wilson $791 $626 $1,115 $829 $691 $383 $486 $(140) $4,781 $57,369 220% $27.58 190%
Yadkin $908 $626 $1,106 $791 $691 $414 $507 $(118) $4,925 $59,100 227% $28.41 196%
Yancey $689 $626 $1,115 $803 $691 $355 $453 $(173) $4,559 $54,706 210% $26.30 181%
NC Population
Weighted Average $899 $626 $1,246 $825 $614 $412 $525 $(100) $5,148 $60,579 233% $29.12 201%

NC Budget and Tax Center26
COUNTYAnnual LIS (1 Ad; 1 Ch)
LIS 1:1 + Savings and Debt
Annual LIS (1 Ad; 2 Ch)
LIS 1:2 + Savings and Debt
Annual LIS (2 Ad; 2 Ch)
LIS 2:2 + Savings and Debt
Annual LIS (2 Ad; 3 Ch)
LIS 2:3 + Savings and Debt
Appendix C: Living Income Standard with Savings and Debt Components by County
Alamance $35,370 $37,505 $40,887 $43,397 $47,162 $50,292 $59,661 $63,371
Alexander $33,989 $36,118 $39,734 $42,239 $47,168 $50,298 $57,700 $61,399
Alleghany $32,657 $34,780 $37,894 $40,392 $45,940 $49,063 $56,312 $60,003
Anson $33,167 $35,292 $38,596 $41,096 $46,469 $49,595 $58,180 $61,881
Ashe $32,657 $34,780 $37,894 $40,392 $45,940 $49,063 $56,442 $60,133
Avery $34,704 $36,836 $40,301 $42,808 $47,508 $50,640 $56,834 $60,528
Beaufort $33,076 $35,201 $38,633 $41,134 $46,871 $49,999 $56,569 $60,260
Bertie $32,818 $34,942 $39,230 $41,733 $46,359 $49,485 $56,243 $59,933
Bladen $33,605 $35,733 $39,489 $41,993 $47,070 $50,199 $59,650 $63,359
Brunswick $38,683 $40,837 $44,462 $46,993 $51,619 $54,775 $65,325 $69,068
Buncombe $33,772 $35,900 $39,428 $41,932 $45,969 $49,092 $57,787 $61,486
Burke $33,765 $35,893 $39,262 $41,765 $46,793 $49,921 $57,138 $60,833
Cabarrus $37,315 $39,461 $43,719 $46,246 $49,890 $53,036 $61,243 $64,962
Caldwell $33,989 $36,118 $39,734 $42,239 $47,168 $50,298 $57,700 $61,399
Camden $35,155 $37,289 $40,577 $43,085 $47,798 $50,931 $59,273 $62,981
Carteret $34,697 $36,829 $40,475 $42,983 $47,748 $50,881 $60,791 $64,508
Caswell $32,907 $35,032 $38,124 $40,623 $46,080 $49,203 $55,364 $59,049
Catawba $31,710 $33,829 $37,234 $39,729 $44,245 $47,360 $55,107 $58,790
Chatham $41,328 $43,497 $47,377 $49,924 $54,258 $57,430 $64,996 $68,737
Cherokee $32,417 $34,539 $37,563 $40,059 $45,688 $48,810 $57,780 $61,479
Chowan $35,155 $37,289 $40,628 $43,137 $47,849 $50,983 $59,427 $63,135
Clay $32,641 $34,764 $38,010 $40,509 $46,064 $49,187 $56,571 $60,263
Cleveland $35,686 $37,823 $41,145 $43,656 $48,266 $51,403 $59,521 $63,229
Columbus $33,381 $35,508 $38,818 $41,319 $46,643 $49,770 $55,684 $59,370
Craven $34,583 $36,715 $40,389 $42,896 $47,661 $50,794 $59,188 $62,895
Cumberland $33,488 $35,614 $38,811 $41,313 $45,794 $48,916 $58,965 $62,671
Currituck $40,686 $42,852 $46,120 $48,660 $53,170 $56,335 $66,855 $70,607
Dare $39,397 $41,556 $45,940 $48,479 $52,854 $56,017 $66,096 $69,844
Davidson $29,675 $31,786 $34,454 $36,940 $41,572 $44,676 $53,865 $57,541
Davie $35,121 $37,255 $40,655 $43,164 $47,870 $51,005 $59,817 $63,527
Duplin $33,381 $35,508 $38,818 $41,319 $46,643 $49,770 $56,529 $60,220
Durham $39,417 $41,575 $47,163 $49,709 $53,063 $56,228 $67,332 $71,087
Edgecombe $33,075 $35,200 $38,533 $41,034 $46,462 $49,588 $56,158 $59,847
Forsyth $34,359 $36,490 $41,021 $43,532 $47,000 $50,129 $59,304 $63,012
Franklin $38,042 $40,192 $43,511 $46,036 $50,528 $53,678 $61,497 $65,217
Gaston $36,197 $38,337 $41,894 $44,410 $48,150 $51,286 $59,247 $62,954
Gates $35,155 $37,289 $40,628 $43,137 $47,849 $50,983 $59,427 $63,135
Graham $32,417 $34,539 $37,637 $40,134 $45,739 $48,861 $56,179 $59,868
Granville $34,552 $36,684 $40,306 $42,814 $47,546 $50,678 $57,727 $61,426
Greene $33,076 $35,201 $38,533 $41,034 $46,462 $49,588 $58,281 $61,983
Guilford $35,040 $37,174 $41,497 $44,011 $47,476 $50,608 $58,827 $62,532
Halifax $32,796 $34,920 $38,135 $40,634 $46,120 $49,244 $56,083 $59,772
Harnett $33,187 $35,313 $38,671 $41,172 $46,506 $49,632 $57,727 $61,426
Haywood $34,066 $36,196 $39,531 $42,035 $46,953 $50,081 $57,544 $61,241
Henderson $35,847 $37,985 $41,415 $43,928 $48,563 $51,701 $60,381 $64,095
Hertford $32,796 $34,920 $38,086 $40,584 $46,086 $49,210 $56,479 $60,170
Hoke $34,775 $36,908 $40,463 $42,971 $47,739 $50,872 $59,382 $63,090
Hyde $35,379 $37,514 $40,884 $43,394 $48,173 $51,309 $59,819 $63,530
Iredell $36,246 $38,386 $41,859 $44,375 $49,031 $52,172 $60,733 $64,449
Jackson $33,778 $35,906 $39,435 $41,938 $46,938 $50,067 $57,825 $61,524
Johnston $37,599 $39,746 $43,221 $45,744 $50,290 $53,438 $62,060 $65,784
Jones $34,331 $36,462 $39,853 $42,358 $47,213 $50,343 $58,948 $62,654
Lee $34,894 $37,027 $40,566 $43,075 $47,806 $50,940 $57,771 $61,469
NOTE: Annual and hourly LIS do not include refundable tax credits

THE 2010 LIVING INCOME STANDARD FOR NORTH CAROLINA 27
COUNTYAnnual LIS (1 Ad; 1 Ch)
LIS 1:1 + Savings and Debt
Annual LIS (1 Ad; 2 Ch)
LIS 1:2 + Savings and Debt
Annual LIS (2 Ad; 2 Ch)
LIS 2:2 + Savings and Debt
Annual LIS (2 Ad; 3 Ch)
LIS 2:3 + Savings and Debt
Appendix C: Living Income Standard with Savings and Debt Components by County (cont.)
Lenoir $32,796 $34,920 $38,135 $40,634 $46,120 $49,244 $55,130 $58,813
Lincoln $34,557 $36,689 $40,427 $42,935 $47,732 $50,866 $57,356 $61,053
Macon $34,237 $36,367 $39,646 $42,150 $47,031 $50,161 $56,718 $60,411
Madison $34,707 $36,839 $41,009 $43,520 $47,969 $51,104 $57,642 $61,340
Martin $35,965 $38,103 $41,450 $43,963 $48,585 $51,724 $60,272 $63,985
McDowell $32,657 $34,780 $37,894 $40,392 $45,940 $49,063 $56,096 $59,785
Mecklenburg $37,639 $39,787 $44,913 $47,447 $51,118 $54,271 $63,921 $67,655
Mitchell $35,282 $37,417 $40,739 $43,249 $47,989 $51,124 $56,939 $60,633
Montgomery $33,839 $35,967 $39,392 $41,895 $46,930 $50,058 $56,055 $59,744
Moore $35,209 $37,344 $40,611 $43,120 $47,799 $50,933 $60,695 $64,411
Nash $33,075 $35,200 $39,155 $41,658 $46,803 $49,931 $57,182 $60,877
New Hanover $38,145 $40,296 $44,881 $47,414 $51,089 $54,242 $65,836 $69,582
Northampton $32,796 $34,920 $38,086 $40,584 $46,086 $49,210 $55,981 $59,669
Onslow $33,965 $36,094 $38,971 $41,473 $47,003 $50,132 $59,211 $62,918
Orange $40,731 $42,896 $49,483 $52,043 $55,468 $58,647 $70,522 $74,295
Pamlico $32,796 $34,920 $38,086 $40,584 $46,086 $49,210 $55,807 $59,494
Pasquotank $36,249 $38,389 $41,887 $44,403 $49,074 $52,216 $61,181 $64,900
Pender $34,857 $36,990 $40,424 $42,932 $47,972 $51,107 $58,959 $62,665
Perquimans $35,155 $37,289 $40,577 $43,085 $47,798 $50,931 $59,273 $62,981
Person $33,671 $35,798 $39,233 $41,736 $46,823 $49,951 $55,997 $59,685
Pitt $34,420 $36,551 $40,250 $42,757 $47,536 $50,669 $60,011 $63,723
Polk $35,029 $37,162 $40,615 $43,124 $47,848 $50,982 $58,128 $61,829
Randolph $35,747 $37,884 $41,114 $43,625 $48,193 $51,329 $58,726 $62,430
Richmond $33,167 $35,292 $38,521 $41,022 $46,418 $49,544 $56,163 $59,853
Robeson $33,381 $35,508 $39,016 $41,518 $46,695 $49,822 $55,859 $59,546
Rockingham $32,452 $34,575 $37,607 $40,104 $45,702 $48,823 $55,238 $58,922
Rowan $33,555 $35,683 $39,376 $41,879 $46,005 $49,129 $58,922 $62,627
Rutherford $34,533 $36,665 $40,090 $42,596 $47,361 $50,492 $56,631 $60,323
Sampson $33,381 $35,508 $38,818 $41,319 $46,643 $49,770 $58,067 $61,767
Scotland $34,206 $36,336 $39,933 $42,438 $47,323 $50,454 $56,812 $60,505
Stanly $33,818 $35,946 $39,667 $42,171 $47,169 $50,299 $58,634 $62,338
Stokes $35,121 $37,255 $40,655 $43,164 $47,870 $51,005 $59,817 $63,527
Surry $32,253 $34,375 $37,386 $39,882 $45,550 $48,671 $56,235 $59,924
Swain $32,641 $34,764 $38,110 $40,609 $46,115 $49,239 $56,742 $60,434
Transylvania $36,673 $38,816 $42,087 $44,605 $49,184 $52,326 $59,905 $63,616
Tyrrell $35,155 $37,289 $40,577 $43,085 $47,798 $50,931 $59,273 $62,981
Union $38,961 $41,117 $45,400 $47,936 $52,347 $55,508 $63,563 $67,296
Vance $32,704 $34,828 $38,197 $40,696 $46,181 $49,305 $55,388 $59,072
Wake $40,088 $42,251 $48,107 $50,659 $54,587 $57,761 $67,534 $71,290
Warren $32,793 $34,917 $37,998 $40,496 $45,993 $49,116 $55,278 $58,962
Washington $34,018 $36,147 $39,505 $42,009 $46,974 $50,103 $56,154 $59,843
Watauga $37,739 $39,887 $43,394 $45,918 $50,481 $53,631 $60,040 $63,752
Wayne $33,591 $35,719 $39,106 $41,608 $46,701 $49,828 $56,589 $60,281
Wilkes $32,881 $35,005 $38,416 $40,916 $46,367 $49,492 $56,644 $60,336
Wilson $35,297 $37,432 $40,736 $43,246 $47,957 $51,092 $57,369 $61,065
Yadkin $34,841 $36,974 $40,272 $42,779 $47,444 $50,576 $59,100 $62,807
Yancey $32,417 $34,539 $37,637 $40,134 $45,739 $48,861 $54,706 $58,386
NC Average $35,727 $37,865 $41,920 $44,437 $48,814 $51,954 $60,579 $64,294

NORTH CAROLINA JUSTICE CENTER
Opportunity and Prosperity for All
224 S. Dawson Street • P.O. Box 28068 • Raleigh, NC 27611
919/856-2570 voice • 919/856-2175 fax • www.ncjustice.org
© COPYRIGHT 2011
NO PORTION OF THIS DOCUMENT MAY BE REPRODUCED WITHOUT PERMISSION.COVER PRINTS
IN COLOR - USE
OTHER FILE