making health systems work for child survival: developing and monitoring critical human resources...
TRANSCRIPT
Making Health Systems Work for Child Survival: Developing and
Monitoring Critical Human Resources
David SandersAndy Haines
Robert Scherpbier

Outline of Presentation
• A definition of health systems and the place of human resources
• Two case studies of ‘child survival’ interventions illustrating key human resource issues
• Africa’s HRH crisis and out-migration• The HR development cycle and key interventions
needed - in policies and planning - in production and management - in monitoring progress• Conclusions
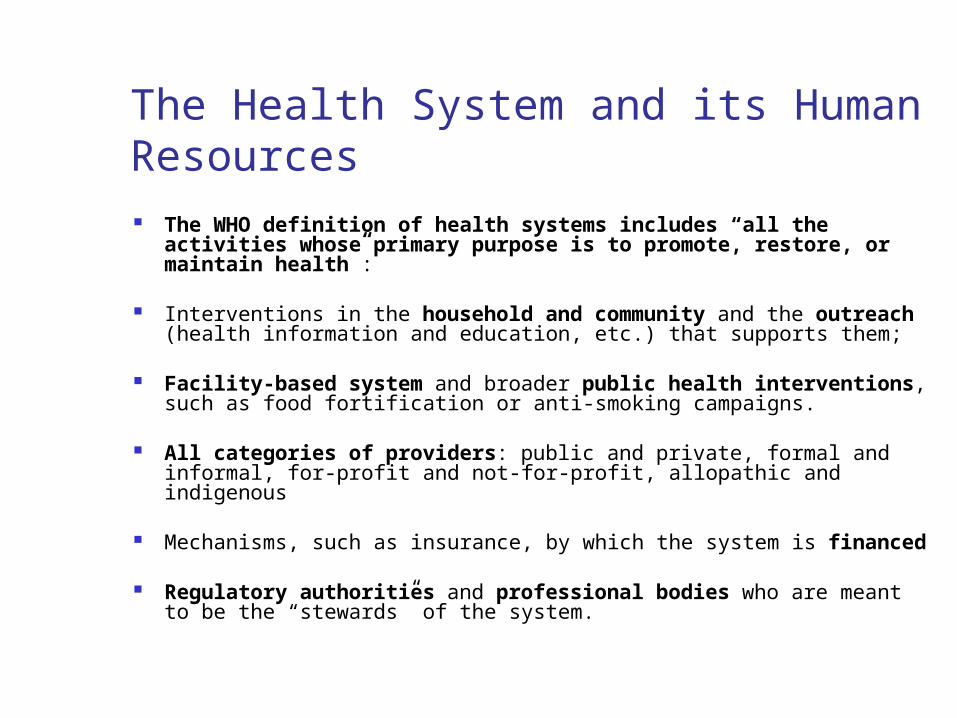
The Health System and its Human Resources The WHO definition of health systems includes “all the
activities whose primary purpose is to promote, restore, or maintain health”:
Interventions in the household and community and the outreach
(health information and education, etc.) that supports them;
Facility-based system and broader public health interventions, such as food fortification or anti-smoking campaigns.
All categories of providers: public and private, formal and
informal, for-profit and not-for-profit, allopathic and indigenous
Mechanisms, such as insurance, by which the system is financed
Regulatory authorities and professional bodies who are meant to be the “stewards” of the system.

Components of Health Systems ”HARDWARE” Facilities e.g. Hospitals, Health Centres
Technology / Equipment / Drugs
Transport
Communications
Finance
“SOFTWARE” *Human Resources for
Human Resources Health
*Communities
*Other Sectors’ Personnel
Processes – policies, service provision, legislation/regulation,
advocacy

Human resources are centrally important
Stewardship Financing
Service delivery
HUMAN RESOURCES convert other resources
into outputs that contribute to better health
outcomes
Neglect of human resources planning, production,
retention, and motivation will continue to cause other
resources to be wasted
HUMAN RESOURCES
account for 60-70% of health expenditures
Resource generation
HEALTH OUTCOMES
Source: Adapted from JLI
Health system functions

A case study of management of malnutrition
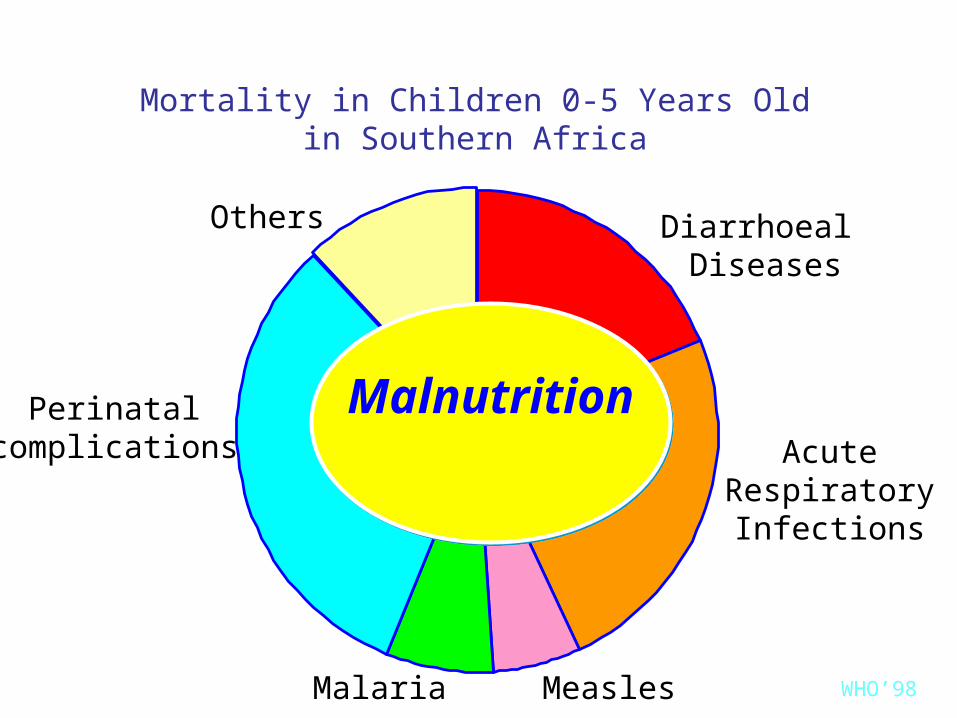
Mortality in Children 0-5 Years Oldin Southern Africa
MalnutritionMalnutrition
Diarrhoeal Diseases
AcuteRespiratoryInfections
MeaslesMalaria
Perinatal complications
Others
WHO’98

Political, cultural,religious,economic, andsocial systems,including women’sstatus, limit theutilization ofpotential resources
Inadequateand/or
inappropriateknowledge anddiscriminatoryattitudes limit
household accessto actual resources
Poor water/sanitation and inadequate health services
Child malnutrition, death and disability
Inadequate maternal and
childcare practises
Insufficient access to food
Potential resources: environment,
technology, people
Causes of Child MalnutritionCauses of Child Malnutrition
Inadequateefficacious nutrient
supply
Disease
Basiccauses atsocietallevel
Outcomes
Immediatecauses
Underlyingcauses athousehold /family level
Quantity and quality of actual resources - human,economic, and organisational - and the way they
are controlled
UNICEF Conceptual Framework

‘Globalisation’ results in unequal growth of wealth
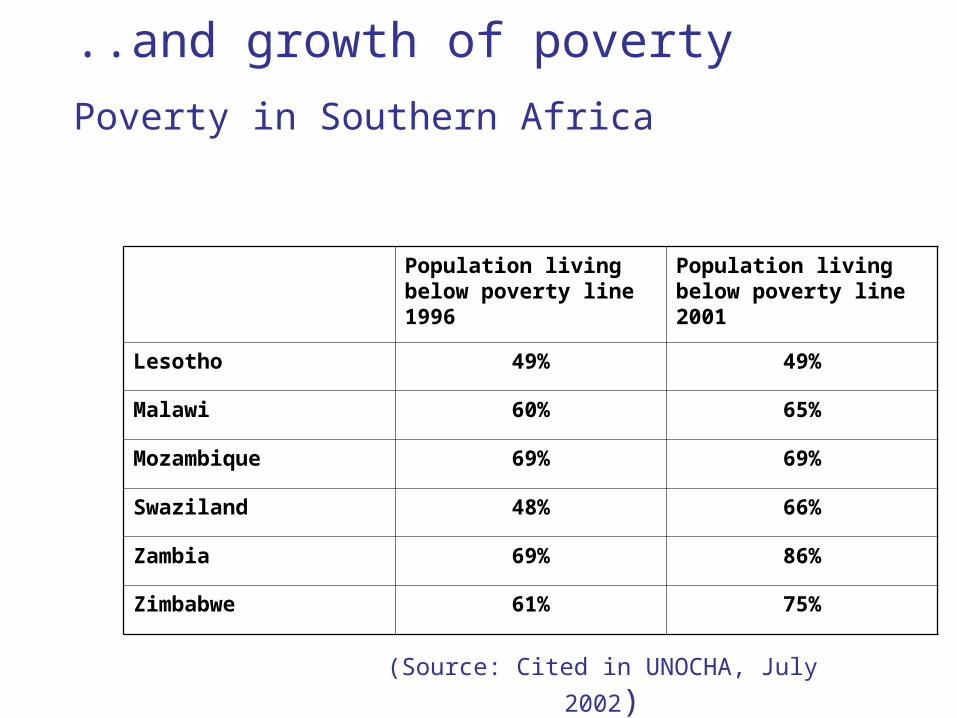
..and growth of poverty
Poverty in Southern Africa
Population living below poverty line 1996
Population living below poverty line 2001
Lesotho 49% 49%
Malawi 60% 65%
Mozambique 69% 69%
Swaziland 48% 66%
Zambia 69% 86%
Zimbabwe 61% 75%
(Source: Cited in UNOCHA, July 2002)
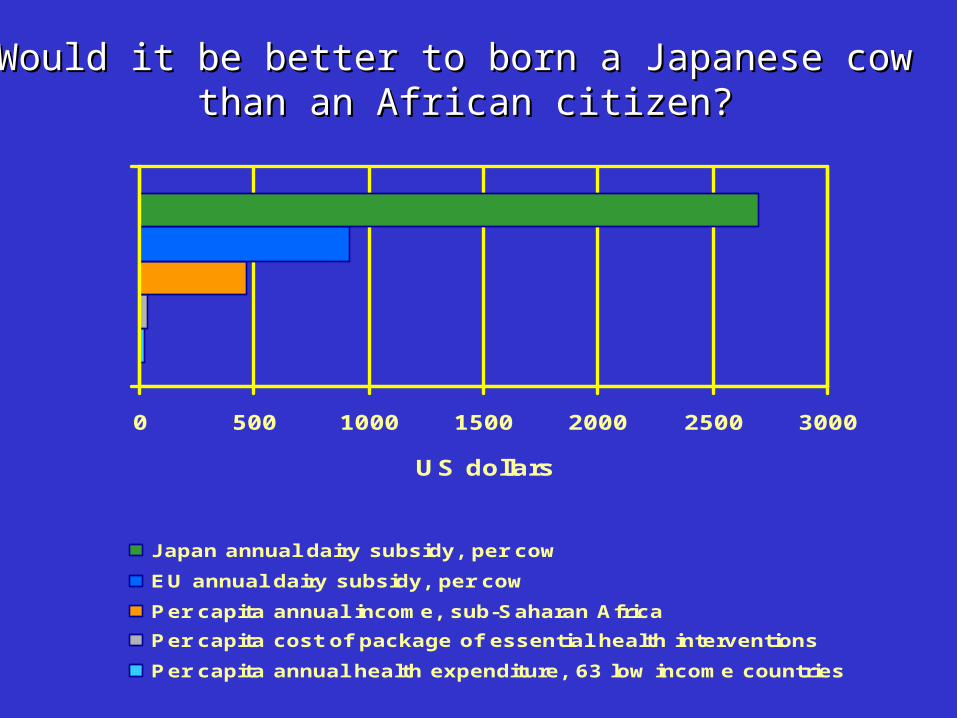
0 500 1000 1500 2000 2500 3000
US dollars
J apan annual dairy subsidy, per cow
EU annual dairy subsidy, per cow
Per capita annual income, sub-Saharan Africa
Per capita cost of package of essential health interventions
Per capita annual health expenditure, 63 low income countries
Would it be better to born a Japanese cow Would it be better to born a Japanese cow than an African citizen?than an African citizen?
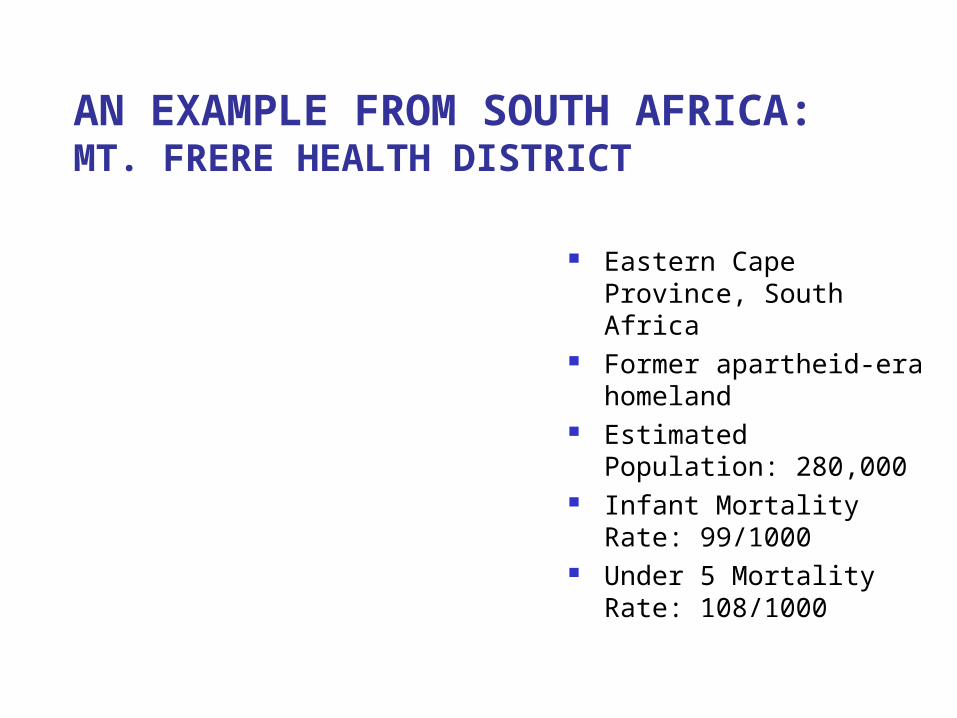
AN EXAMPLE FROM SOUTH AFRICA: MT. FRERE HEALTH DISTRICT
Eastern Cape Province, South Africa
Former apartheid-era homeland
Estimated Population: 280,000
Infant Mortality Rate: 99/1000
Under 5 Mortality Rate: 108/1000

STUDY SETTING:PAEDIATRIC WARDS IN RURAL HOSPITALS
Nurses have the main responsibility for malnourished children
Per Ward: 2-3 nurses and 1-2 nursing
assistants on day duty, and 2 nurses on night duty 10-15 general paediatric
beds and 5-6 malnutrition beds
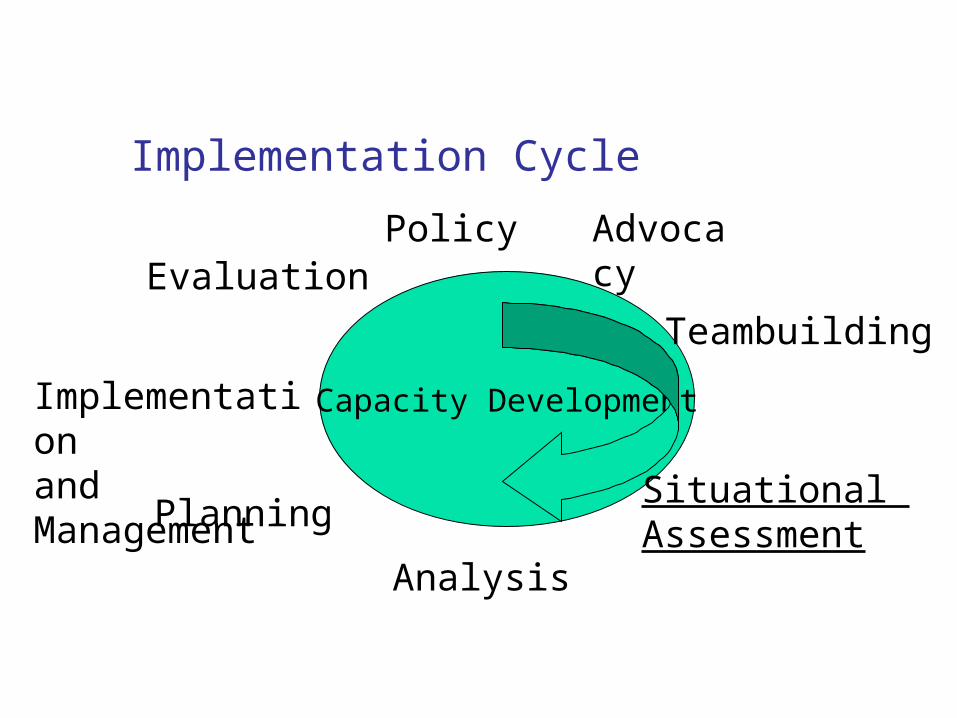
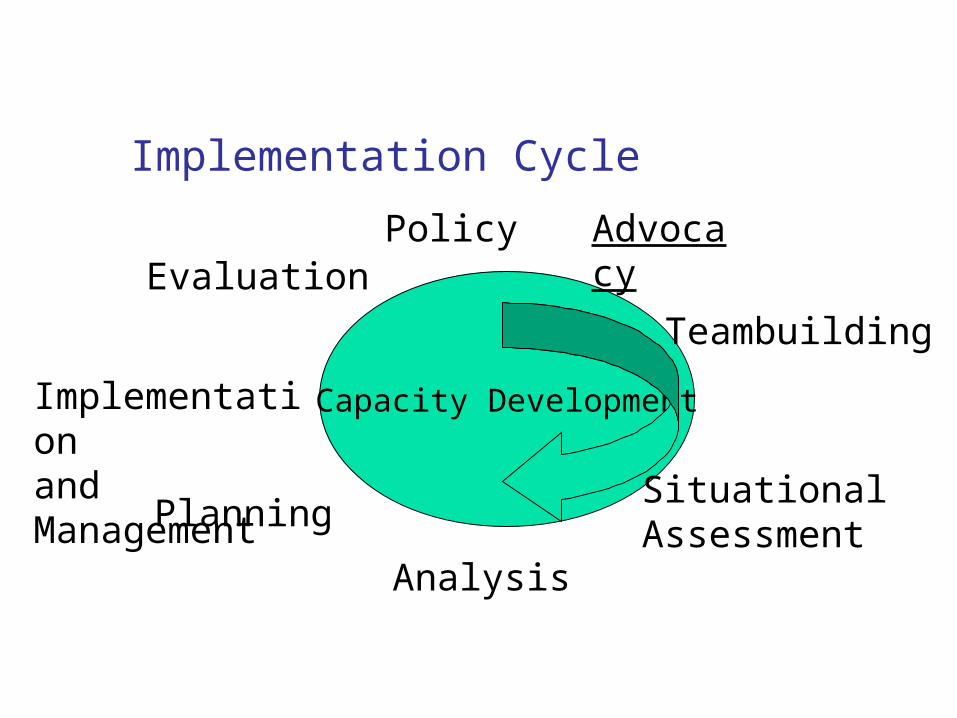
Implementation Cycle
Capacity Development
Advocacy
Teambuilding
Analysis
Situational Assessment
Planning
Implementationand Management
EvaluationPolicy

CASE FATALITY IN RURAL HOSPITALS
PRE-INTERVENTION CFRs –calculated from ward registers
Mary Teresa 46% Sipetu 25%Holy Cross 45% St Margaret’s 24%St. Elizabeth’s 36% Taylor Bequest 21%Mt. Ayliff 34% Greenville 15%St. Patrick’s 30% Rietvlei 10%Bambisana 28%
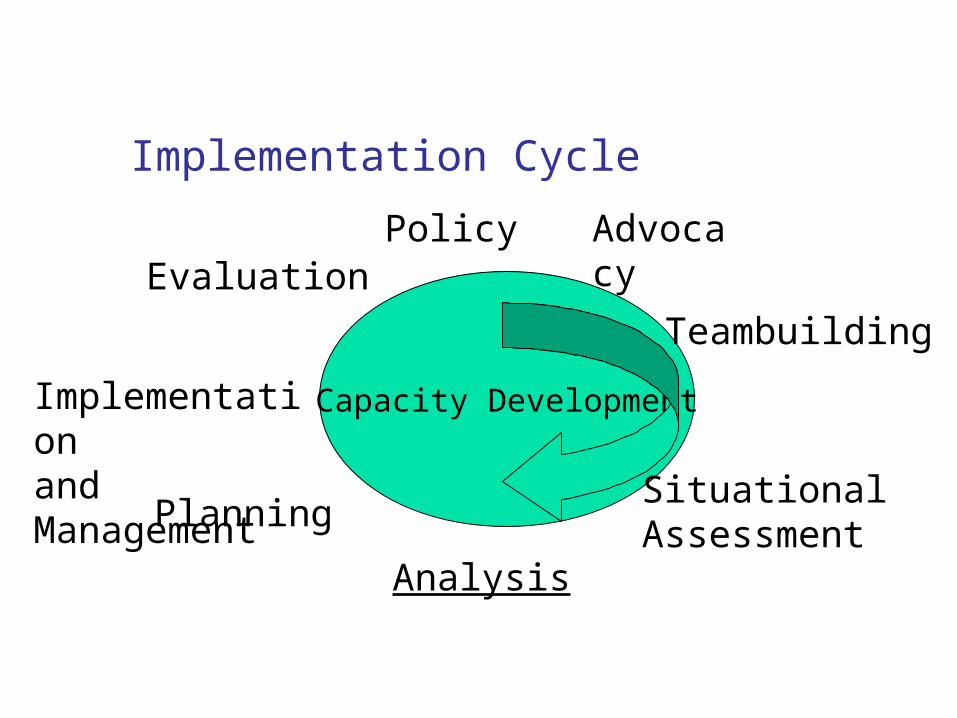
Implementation Cycle
Capacity Development
Advocacy
Teambuilding
Analysis
Situational Assessment
Planning
Implementationand Management
EvaluationPolicy
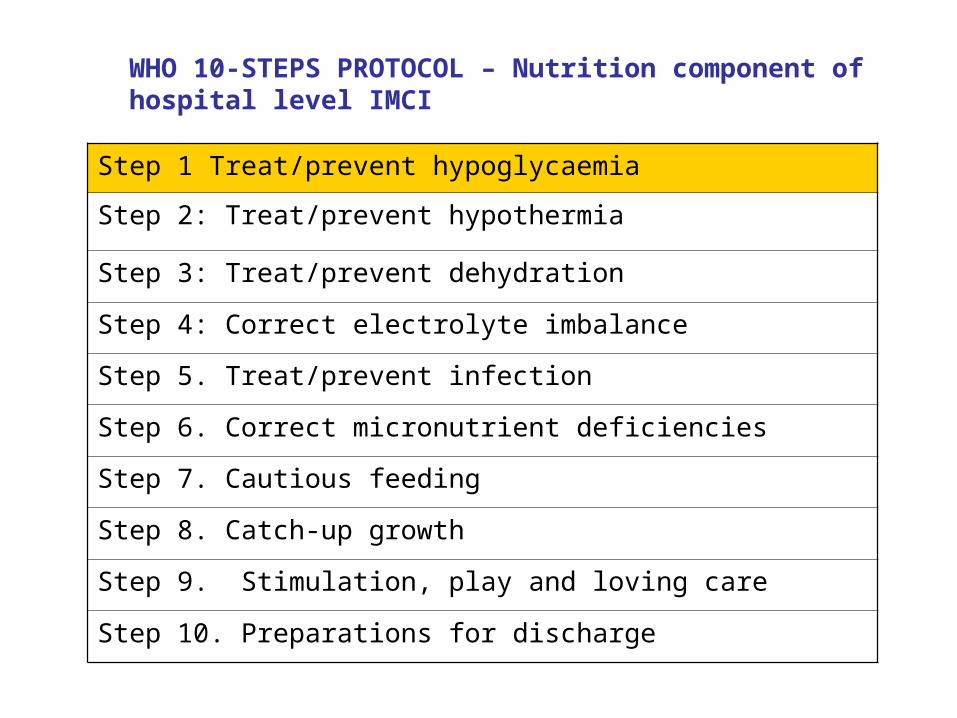
WHO 10-STEPS PROTOCOL – Nutrition component of hospital level IMCI
Step 1 Treat/prevent hypoglycaemia
Step 2: Treat/prevent hypothermia
Step 3: Treat/prevent dehydration
Step 4: Correct electrolyte imbalance
Step 5. Treat/prevent infection
Step 6. Correct micronutrient deficiencies
Step 7. Cautious feeding
Step 8. Catch-up growth
Step 9. Stimulation, play and loving care
Step 10. Preparations for discharge
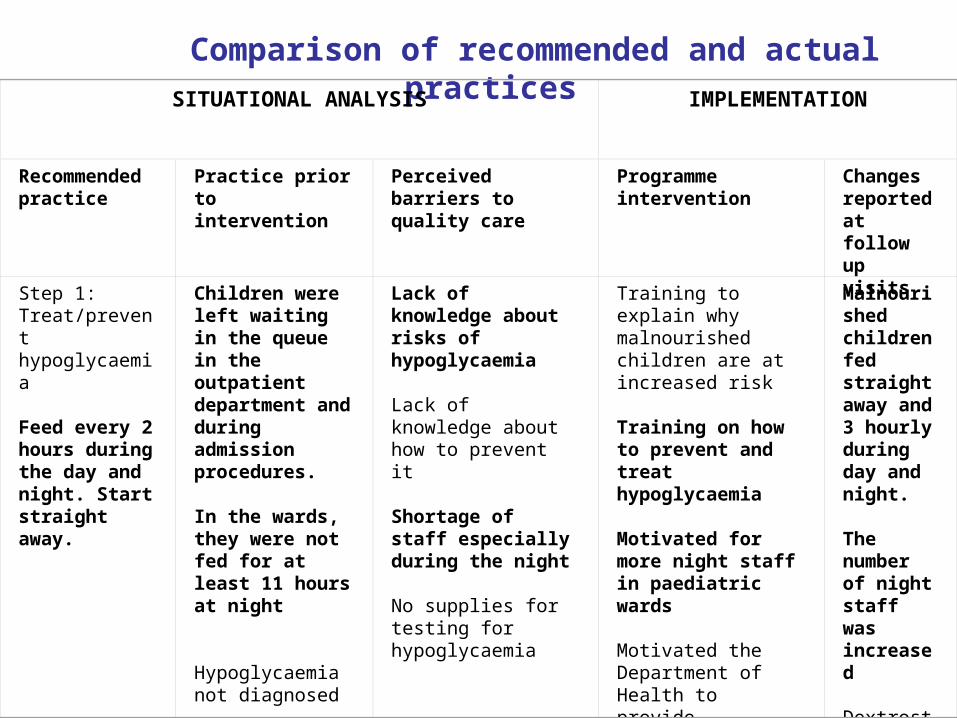
Comparison of recommended and actual practicesSITUATIONAL ANALYSIS IMPLEMENTATION
Recommended practice
Practice prior to intervention
Perceived barriers to quality care
Programme intervention
Changes reported at follow up visits
Step 1: Treat/prevent hypoglycaemia Feed every 2 hours during the day and night. Start straight away.
Children were left waiting in the queue in the outpatient department and during admission procedures. In the wards, they were not fed for at least 11 hours at night Hypoglycaemia not diagnosed
Lack of knowledge about risks of hypoglycaemia Lack of knowledge about how to prevent it Shortage of staff especially during the night No supplies for testing for hypoglycaemia
Training to explain why malnourished children are at increased risk Training on how to prevent and treat hypoglycaemia Motivated for more night staff in paediatric wards Motivated the Department of Health to provide resources (10% glucose and Dextrostix.)
Malnourished childrenfed straightaway and 3 hourly during day and night. The number of night staff was increased Dextrostix and 10% glucose obtained

WHO 10-STEPS TRAINING – Mt. Frere District, Eastern Cape
Developed as part of a District-Level INP
Training & Implementation from March 98 to Aug 99
Two formal training workshops for Paeds staff
On-site facilitation by nurse-trainer
Adaptation of protocols – Now have Eastern Cape Provincial Guidelines
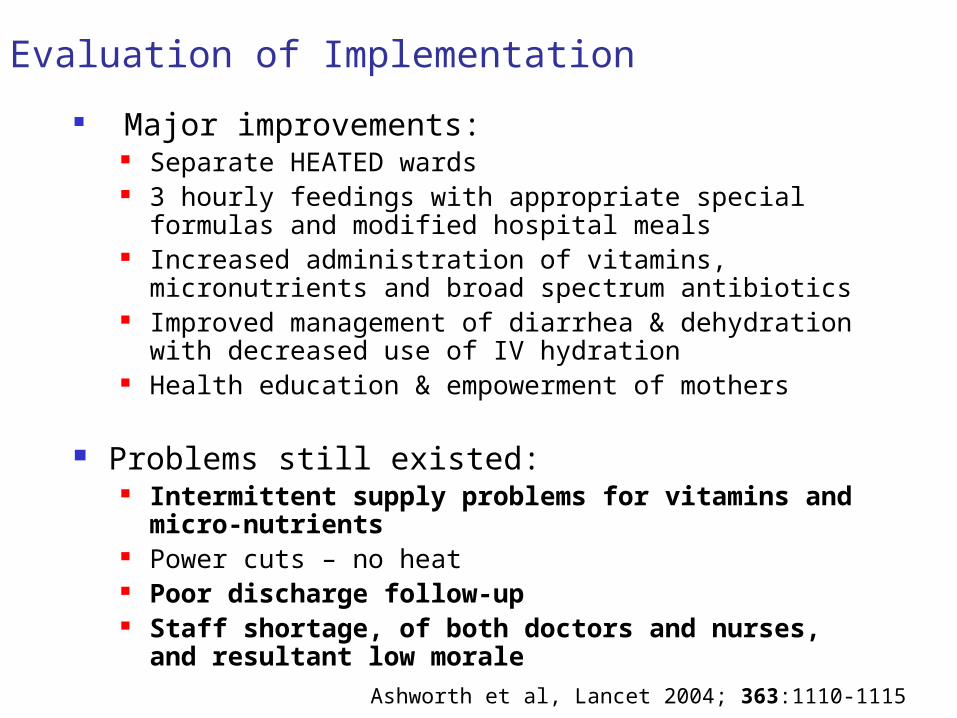
Evaluation of Implementation
Major improvements: Separate HEATED wards 3 hourly feedings with appropriate special formulas
and modified hospital meals Increased administration of vitamins, micronutrients
and broad spectrum antibiotics Improved management of diarrhea & dehydration
with decreased use of IV hydration Health education & empowerment of mothers
Problems still existed: Intermittent supply problems for vitamins and
micro-nutrients Power cuts – no heat Poor discharge follow-up Staff shortage, of both doctors and nurses, and
resultant low moraleAshworth et al, Lancet 2004; 363:1110-1115

SIPETU CASE FATALITY RATES BY TRAINED/UNTRAINED PERIODS
25
2018
38
0
5
10
15
20
25
30
35
40
Cas
e F
ata
lity
Rate
(%
)
PRE-INTV TRAINED TRAINED-STUDY UN-TRAINED
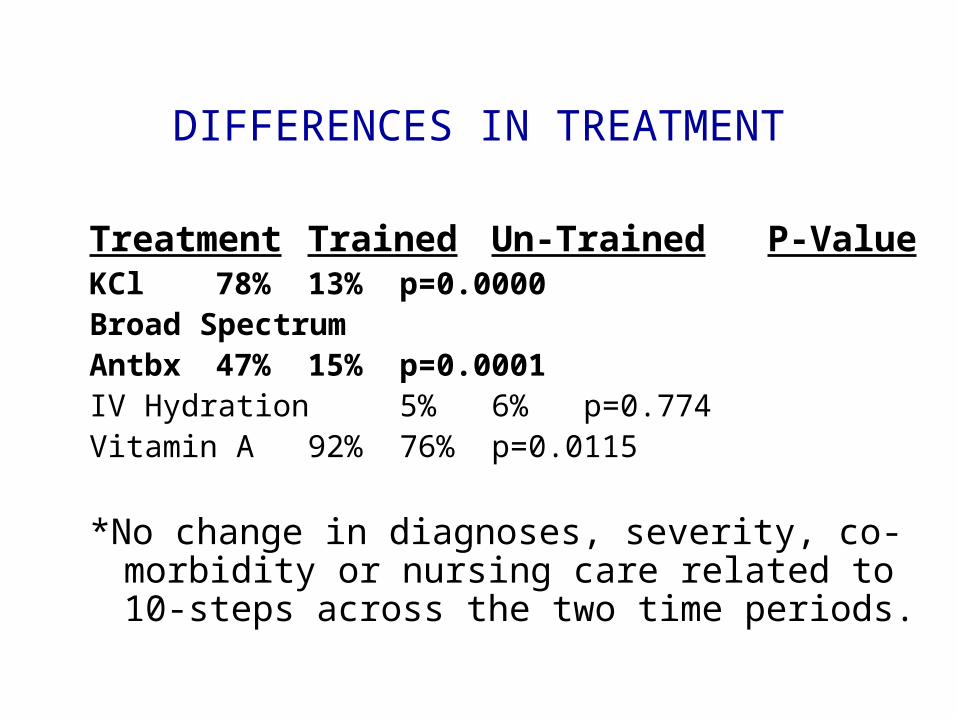
DIFFERENCES IN TREATMENT
Treatment Trained Un-Trained P-ValueKCl 78% 13% p=0.0000Broad SpectrumAntbx 47% 15% p=0.0001IV Hydration 5% 6% p=0.774Vitamin A 92% 76% p=0.0115
*No change in diagnoses, severity, co-morbidity or nursing care related to 10-steps across the two time periods.

“There wasn't enough emphasis on patient management in a lower level institution, our training was mostly theoretical…most patients are filtered out at this lower level therefore the students don't see them...
…it's not so much WHAT as WHERE the training takes place…
...the Sister is teaching me a lot, I'm learning more than I ever learnt in my whole training!”
Quotes from a Community Service Doctor

CHANGES IN CFRs IN RURAL HOSPITALS
0
5
10
15
20
25
30
35
40
45
50
Holy-cross St. Patricks Mt. Ayliff St. Elizabeth
1998-1999
2000-2001
2002
2003
Ongoing research indicates leadership and management at all levels are the keyreasons for the differences between well and poorly performing hospitals
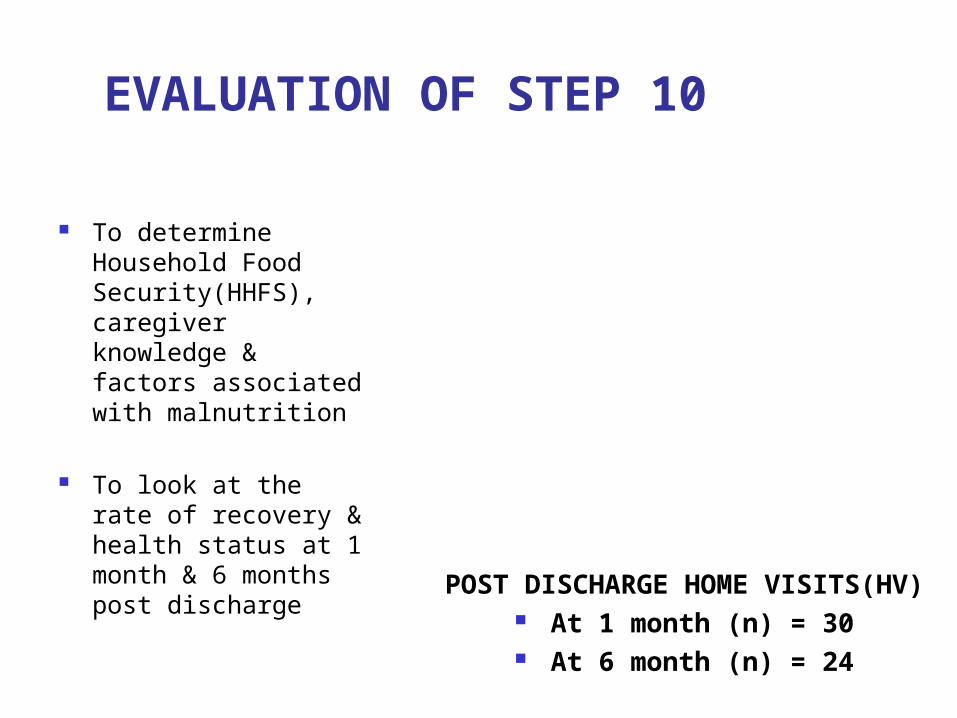
EVALUATION OF STEP 10
To determine Household Food Security(HHFS), caregiver knowledge & factors associated with malnutrition
To look at the rate of recovery & health status at 1 month & 6 months post discharge
POST DISCHARGE HOME VISITS(HV)
At 1 month (n) = 30 At 6 month (n) = 24
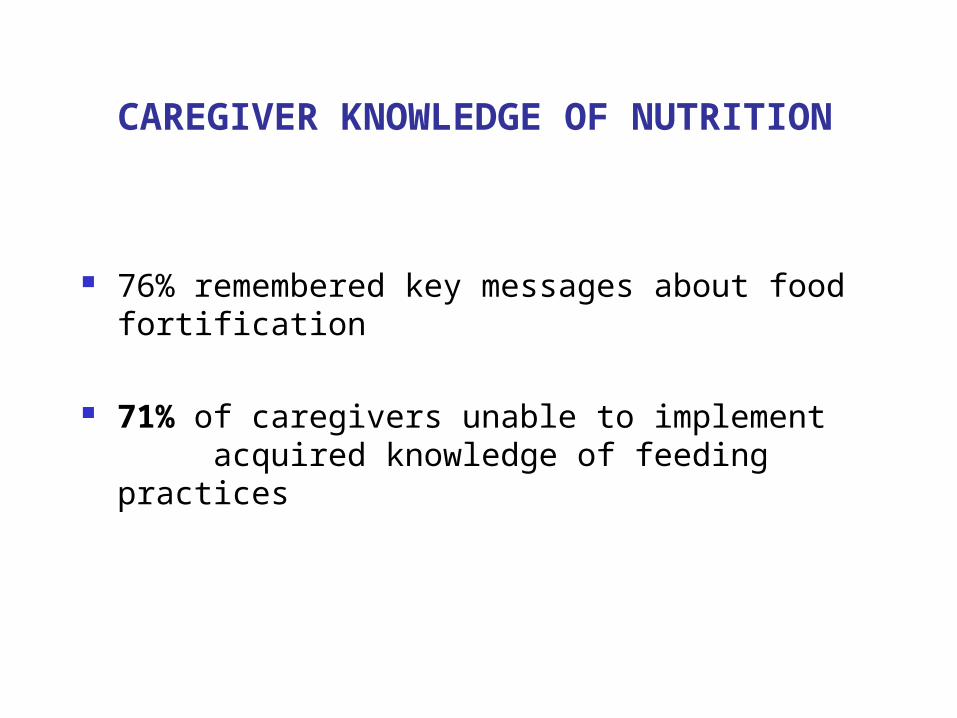
76% remembered key messages about food fortification
71% of caregivers unable to implement acquired knowledge of feeding practices
CAREGIVER KNOWLEDGE OF NUTRITION
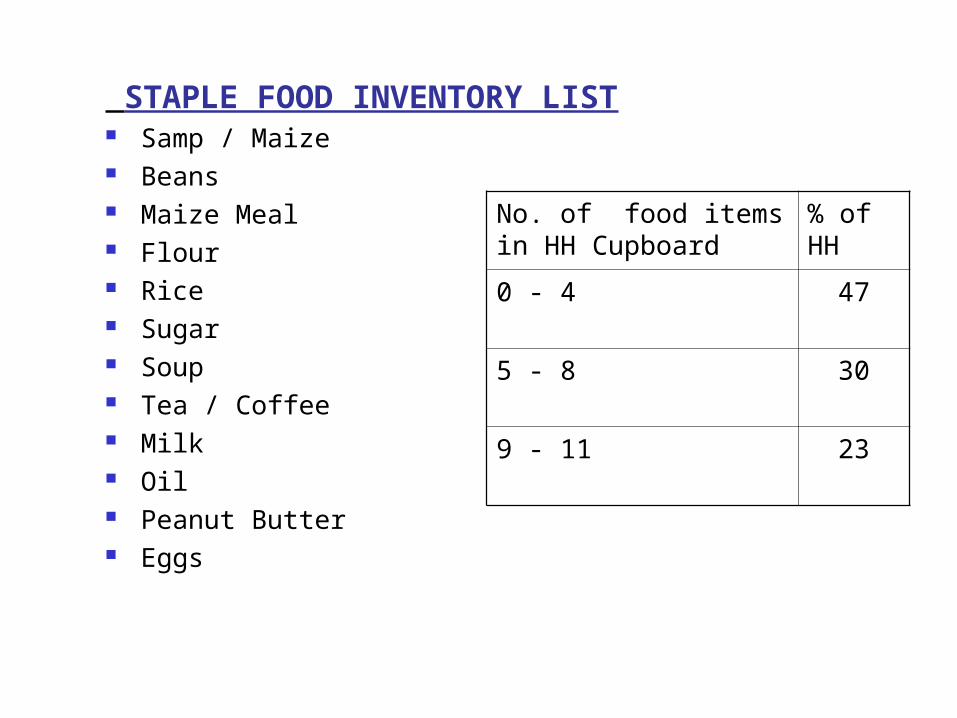
STAPLE FOOD INVENTORY LIST Samp / Maize Beans Maize Meal Flour Rice Sugar Soup Tea / Coffee Milk Oil Peanut Butter Eggs
No. of food items in HH Cupboard
% of HH
0 - 4 47
5 - 8 30
9 - 11 23
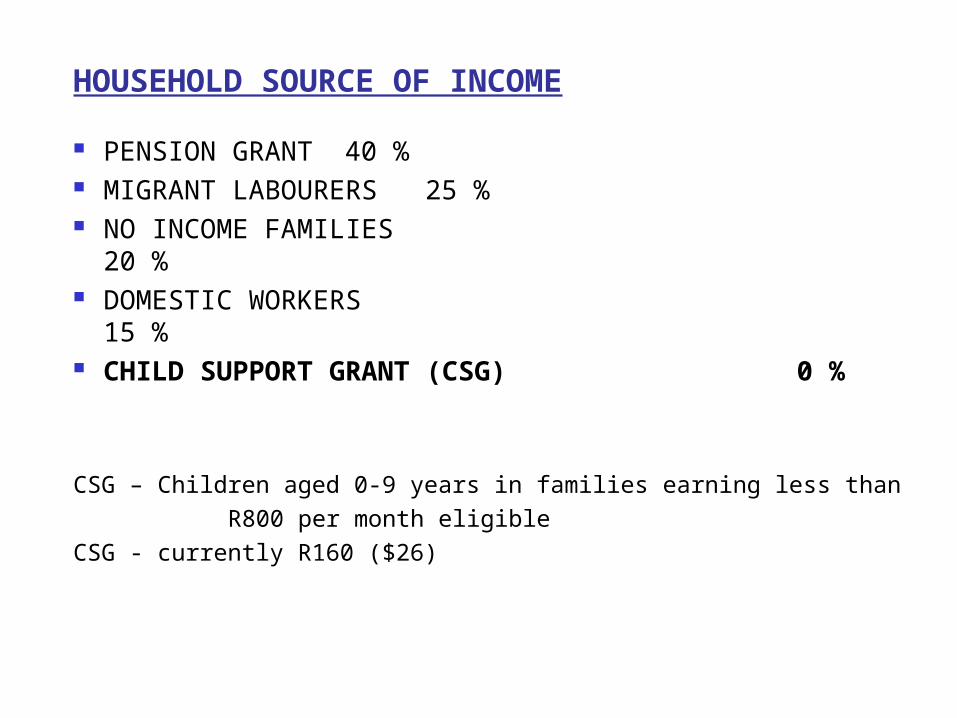
HOUSEHOLD SOURCE OF INCOME
PENSION GRANT 40 % MIGRANT LABOURERS 25 % NO INCOME FAMILIES 20 % DOMESTIC WORKERS 15 % CHILD SUPPORT GRANT (CSG) 0 %
CSG – Children aged 0-9 years in families earning less than R800 per month eligibleCSG - currently R160 ($26)
Implementation Cycle
Capacity Development
Advocacy
Teambuilding
Analysis
Situational Assessment
Planning
Implementationand Management
EvaluationPolicy
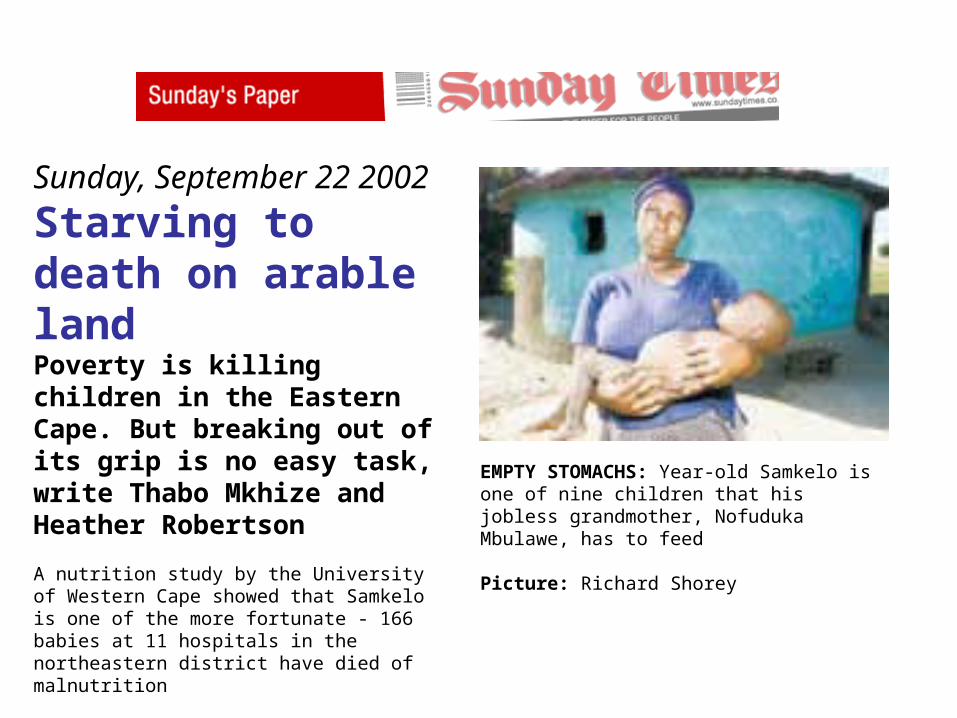
EMPTY STOMACHS: Year-old Samkelo is one of nine children that his jobless grandmother, Nofuduka Mbulawe, has to feed
Picture: Richard Shorey
Sunday, September 22 2002
Starving to death on arable land Poverty is killing children in the Eastern Cape. But breaking out of its grip is no easy task, write Thabo Mkhize and Heather Robertson
A nutrition study by the University of Western Cape showed that Samkelo is one of the more fortunate - 166 babies at 11 hospitals in the northeastern district have died of malnutrition
ONE-year-old Samkelo Mbulawe has only a tattered blanket to cover his distended stomach and flaking skin. He has just returned home after two months in the Mount Ayliff Hospital where he was treated for kwashiorkor, a form of malnutrition.

Advocacy Component
Presentation of data to Government Commission on Social Welfare
Partnership with ACESS resulted in TV documentary – ‘Special Assignment’ – elicited unexpected response from both public and government
Minister of Social Development visited Mt Frere and ordered mobile team in to process CSGs
Questions in Parliament re child welfare
Massive Child Support Grant Campaign in E. Cape, October 2002
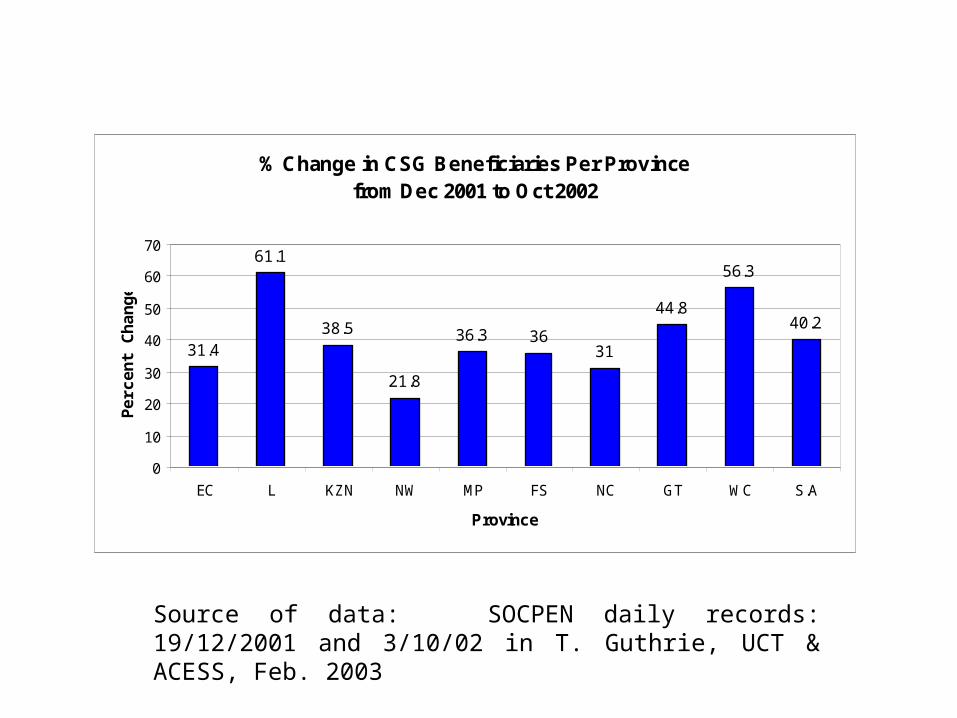
% Change in CSG Beneficiaries Per Province from Dec 2001 to Oct 2002
31.4
61.1
38.5
21.8
36.3 3631
44.8
56.3
40.2
0
10
20
30
40
50
60
70
EC L KZN NW MP FS NC GT WC S.A
Province
Pe
rce
nt
Ch
an
ge
Source of data: SOCPEN daily records: 19/12/2001 and 3/10/02 in T. Guthrie, UCT & ACESS, Feb. 2003
A Case Study of Management of Pneumonia

IMCI pneumonia case management (Tanzania)
Coverage: child actually receives the intervention
0
10
20
30
40
50
60
70
80
90
100
Breastfe
eding
6-11
mo
Measle
s vacc
ine
Vitamin
A
Skilled
birth
atten
dant
Tetanu
s toxo
id
Antibiot
ics for
pneu
monia
ORT
Newbo
rn res
uscita
tion
% ch
ildre
n re
ceivi
ng in
terv
entio
n
Source: Jones et al, Lancet 2003, 362: 65-71
Towards population impact
Population effectiveness =
Intervention efficacy x
Intervention availability x
Diagnostic accuracy x
Provider compliance x
Patient compliance x
Coverage
Tugwell framework applied to multi-country evaluation data
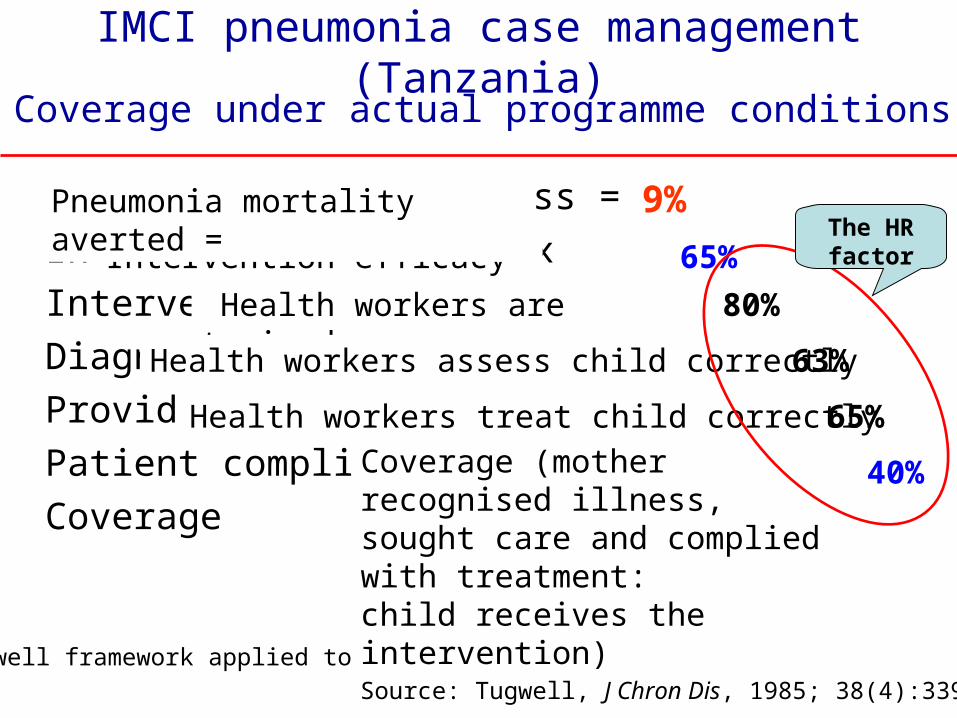
IMCI pneumonia case management (Tanzania)
Intervention efficacy 65%
Health workers are trained 80%
Health workers assess child correctly63%
Health workers treat child correctly 65%
Coverage (mother recognised illness, sought care and complied with treatment: child receives the intervention)
40%
Pneumonia mortality averted =
9%
Source: Tugwell, J Chron Dis, 1985; 38(4):339-51
The HR factor
Coverage under actual programme conditions

Towards population impact
Population effectiveness =
Intervention efficacy x
Intervention availability x
Diagnostic accuracy x
Provider compliance x
Patient compliance x
Coverage
IMCI pneumonia case management (Tanzania)
Intervention efficacy 65%
Health workers are trained 90%
Health workers assess child correctly90%
Health workers treat child correctly 90%Coverage (mother recognised illness, sought care and complied with treatment: child receives the intervention)
40%
Pneumonia mortality averted =
19%
Source: Tugwell, J Chron Dis, 1985; 38(4):339-51
The HR factor
Coverage under improved programme conditions

HR Issues Raised by Case Studies
Low doctor/nurse : patient ratio due to inadequate production, distribution and retention
Inappropriate training Poor health worker performance – assessment,
treatment, care, communication, advocacy Inadequate monitoring and support/supervision,
management, leadership incl senior policymakers
Erratic ordering of supplies Poor community coverage and follow-up Poor performance of health-related sectors
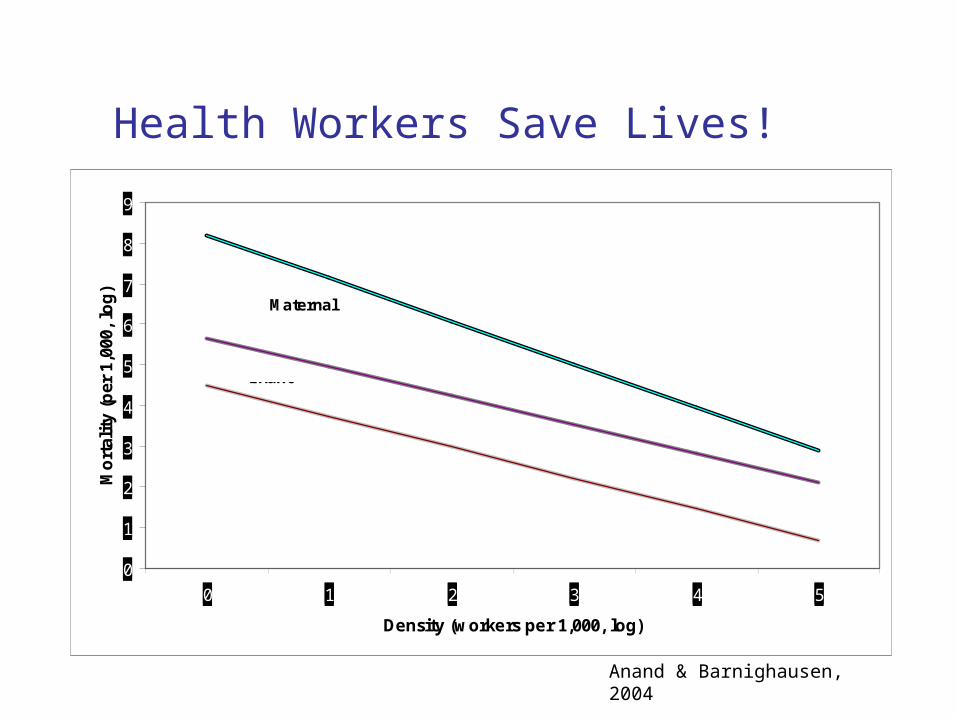
Health Workers Save Lives!
0
1
2
3
4
5
6
7
8
9
0 1 2 3 4 5
Density (workers per 1,000, log)
Mo
rtal
ity
(per
1,0
00,
log
)
Maternal
Infant
Under-5
Anand & Barnighausen, 2004

Nurse density and vaccination
0102030405060708090
100
1 10 100 1,000Density (per 100,000)
Co
vera
ge
(%)
MEASLES
DTP
POLIO
Anand & Barnighausen (forthcoming)

Accumulating Evidence of Effectiveness of Community Health
Workers • Experiences of improved coverage and health
outcomes in large-scale NGO programmes in Bangladesh (BRAC, GK), India (Jamkhed) (1970s/80s.
• Experiences of Good Health at Low Cost countries – Sri Lanka, Kerala, China (1960s-80s
• Experiences of Thailand, Ceara Brazil (1990s)• Recent studies in India (Bang), Nepal
(Manandhar), Pakistan (Bhutta)
Coverage increased in all through community participation and CBHWs

HR Policies and Planning for child survival programmes
Policies
Production
Management
Planning
Human resource cycle
Based on: Hall and Mejia, 1978
Align and link HR and CS programme
policies (based on population health
needs and programme
interventions & targets)
Define tasks and skills required per
level.Estimate time requirements.
Define distribution and skills mix.
Estimate total HW numbers required
(FTE) per level

Planning for HRH needs
Assessment of numbers, skills and distribution of HRH is complex. Service-target planning requires knowledge of
• Needs• Targets• Tasks and skills• Time • Productivity Dreesch et al, Health Policy and Planning,
2005
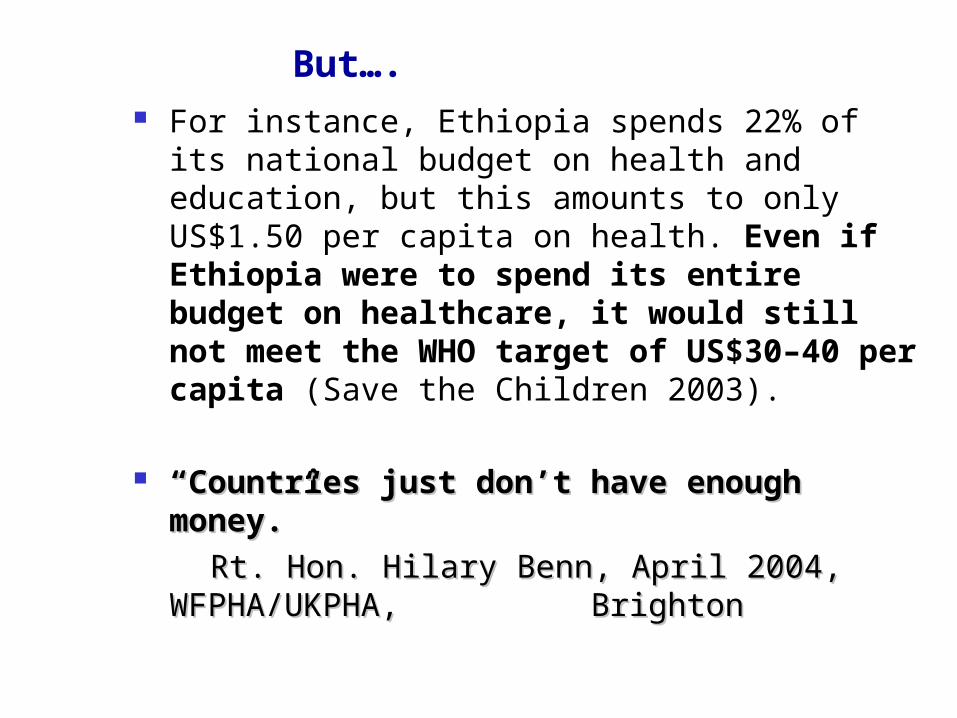
For instance, Ethiopia spends 22% of its national budget on health and education, but this amounts to only US$1.50 per capita on health. Even if Ethiopia were to spend its entire budget on healthcare, it would still not meet the WHO target of US$30–40 per capita (Save the Children 2003).
““Countries just don’t have enough Countries just don’t have enough money.”money.”
Rt. Hon. Hilary Benn, April 2004, Rt. Hon. Hilary Benn, April 2004, WFPHA/UKPHA, BrightonWFPHA/UKPHA, Brighton
But….
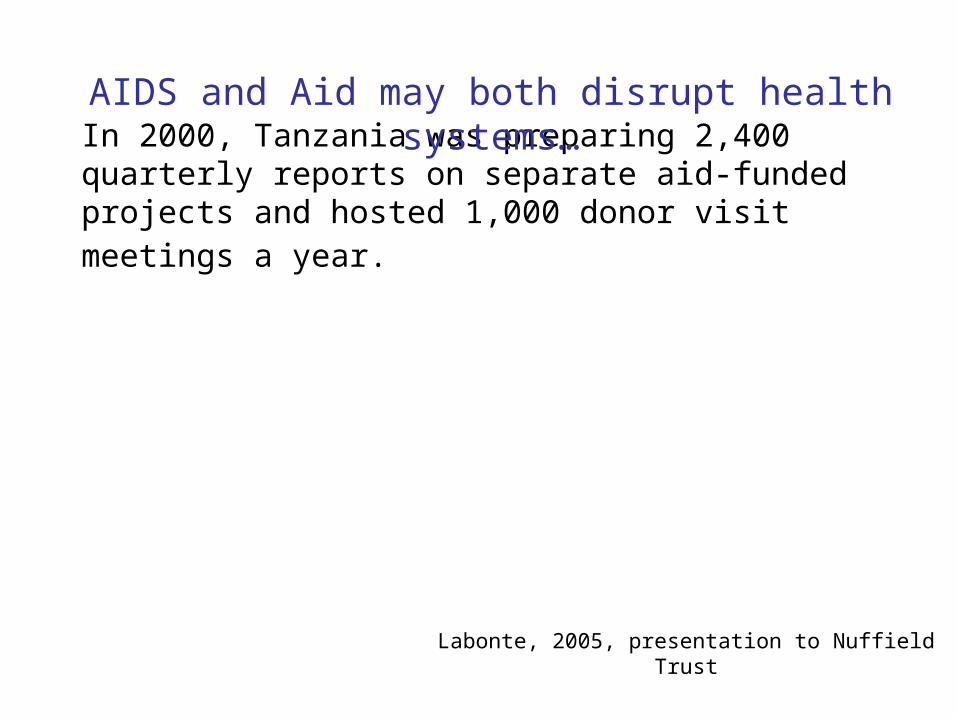
In 2000, Tanzania was preparing 2,400 quarterly reports on separate aid-funded projects and hosted 1,000 donor visit meetings a year.
AIDS and Aid may both disrupt health systems…
Labonte, 2005, presentation to Nuffield Trust
HRH and Africa…
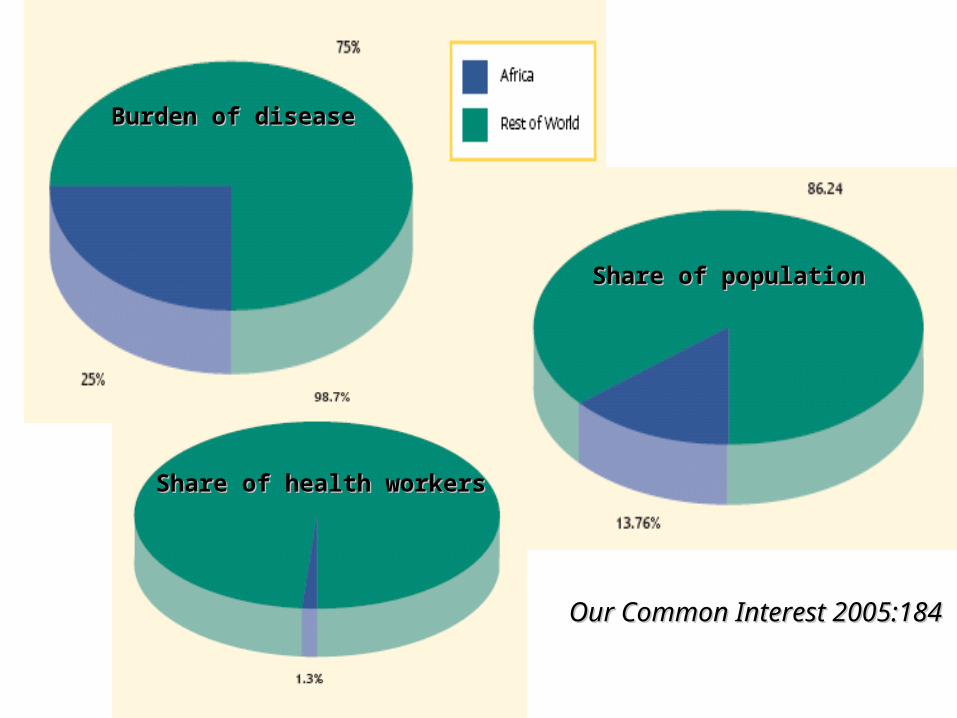
Burden of diseaseBurden of disease
Share of populationShare of population
Share of health workersShare of health workers
Our Common Interest 2005:184 Our Common Interest 2005:184
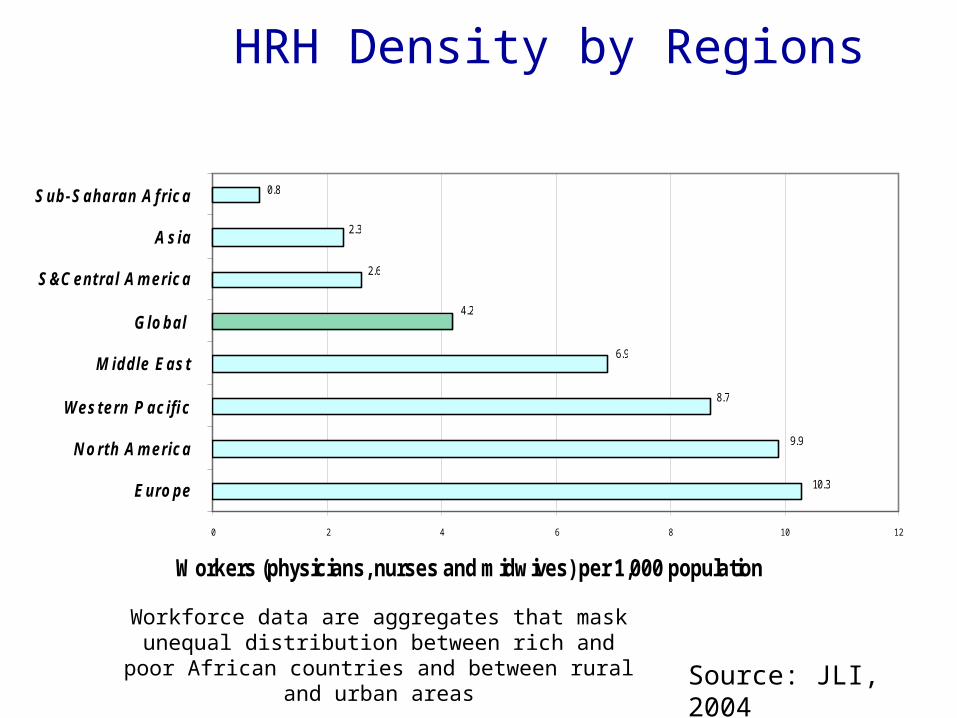
HRH Density by Regions
2.3
2.6
4.2
6.9
8.7
9.9
10.3
0.8
0 2 4 6 8 10 12
Europe
North America
Western Pacific
Middle East
Global
S&Central America
Asia
Sub-Saharan Africa
Workers (physicians, nurses and midwives) per 1,000 population
Source: JLI, 2004
Workforce data are aggregates that mask unequal distribution between rich and poor
African countries and between rural and urban areas
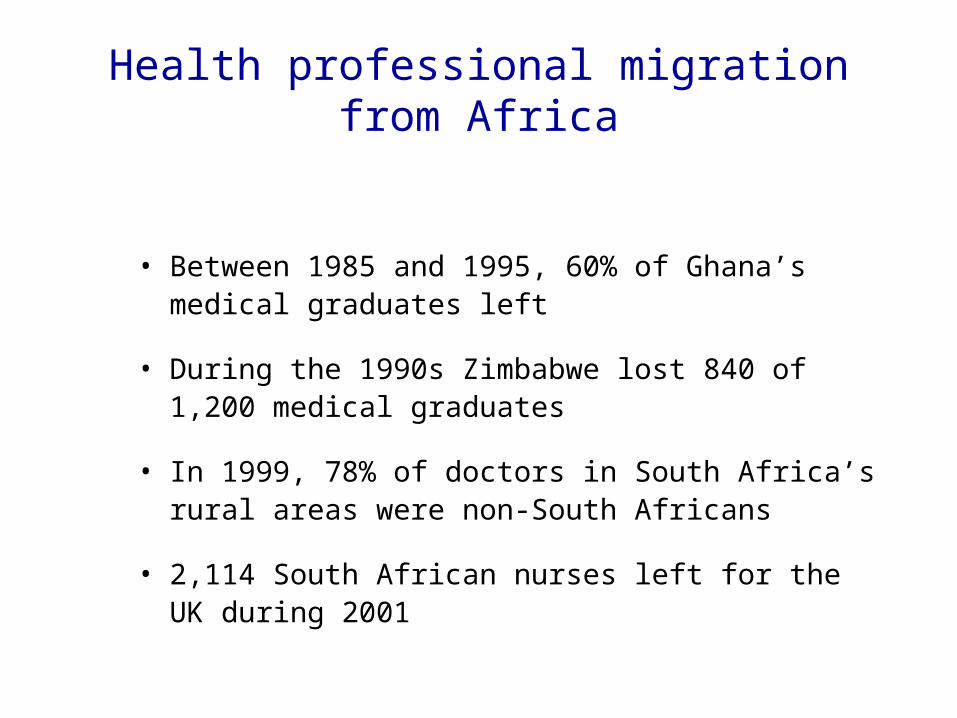
Health professional migration from Africa
• Between 1985 and 1995, 60% of Ghana’s medical graduates left
• During the 1990s Zimbabwe lost 840 of 1,200 medical graduates
• In 1999, 78% of doctors in South Africa’s rural areas were non-South Africans
• 2,114 South African nurses left for the UK during 2001
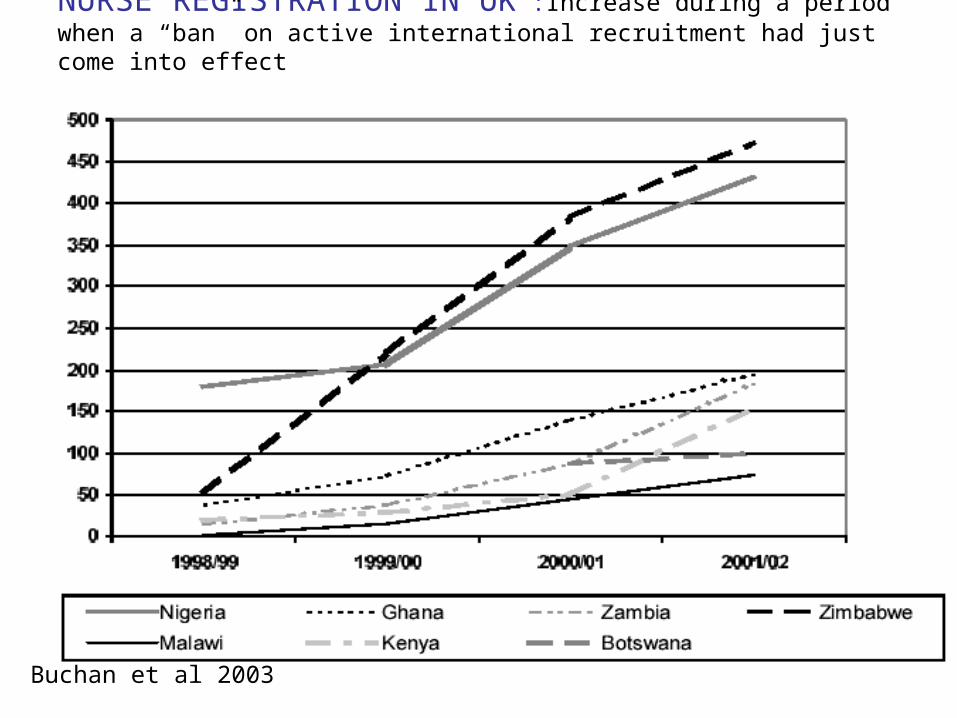
NURSE REGISTRATION IN UK :Increase during a period when a “ban” on active international recruitment had just come into effect
Buchan et al 2003

Migration ‘Carousel’ From rich to poor sectors/nations within and between
countries/continents Push and pull factors In search not just of better economic conditions but also.. Promotion prospects New techniques and knowledge Better working conditions- (hours , burn-out, support, less
disease risk ) Some positive effects (e.g. remittances, improved skills of
returnees etc)
The GATS (General Agreement on Trade in Services) is likely to aggravate “trade” in health professionals by increasing the size of the private sector North and South (GATS Mode 3) and easing cross-border movement (GATS Mode 4).
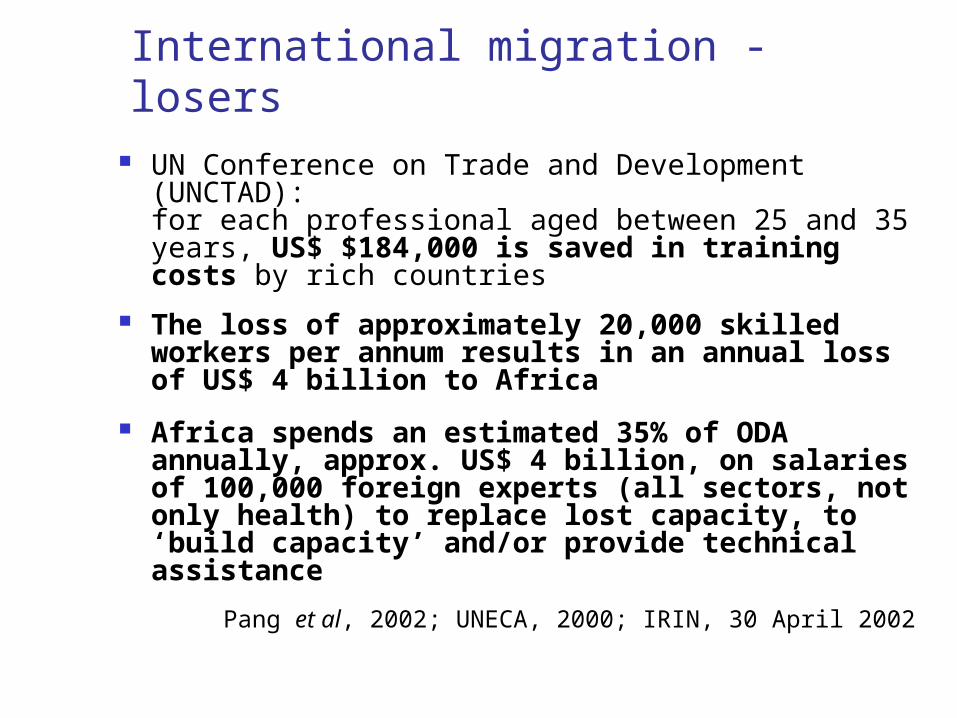
International migration - losers UN Conference on Trade and Development
(UNCTAD):for each professional aged between 25 and 35 years, US$ $184,000 is saved in training costs by rich countries
The loss of approximately 20,000 skilled workers per annum results in an annual loss of US$ 4 billion to Africa
Africa spends an estimated 35% of ODA annually, approx. US$ 4 billion, on salaries of 100,000 foreign experts (all sectors, not only health) to replace lost capacity, to ‘build capacity’ and/or provide technical assistance
Pang et al, 2002; UNECA, 2000; IRIN, 30 April 2002

Potential policy options to address migration
Source countries Pay and non pay incentives ( hardship allowances, better support,
promotion, training access, child education , housing etc) Train more mid level cadres ( clinical assistants, nursing aides etc)
Address HIV/AIDS and gender issues Structured return programmesReceiving countries Increase own production ‘Ethical recruitment’ Bilateral agreements Compensation inc. educational initiatives
But little evidence of what works

HR “Production” and Management for child survival programmes
Policies
Production
Management
Planning
Health outcomes
Based on: Hall and Mejia, 1978
Design retention
strategies,Institutionalise
supportive supervision
Harmonise HW estimates and skills
needs with ‘production’ plans and curricula (of medical schools,
‘auxiliary’ schools, nursing colleges).
More in-service and CE. Train CHWs.
Outputs (quality)

Basic and Pre-registration training
• Review alignment of under- and post-graduate training (and texts) of doctors and nurses towards major child health problems
• Increase amount and importance of practice-based learning in low-resource settings
Waterston and Sanders, Medical Education, 21, 1987
• Accelerate production of mid-level workers such as medical assistants and nurse aides (Overcome resistance of professional registering bodies)
• Revisit evidence for effectiveness of CHWs and accelerate their production
Lewin SA et al, Cochrane Database 2005, Issue 1.
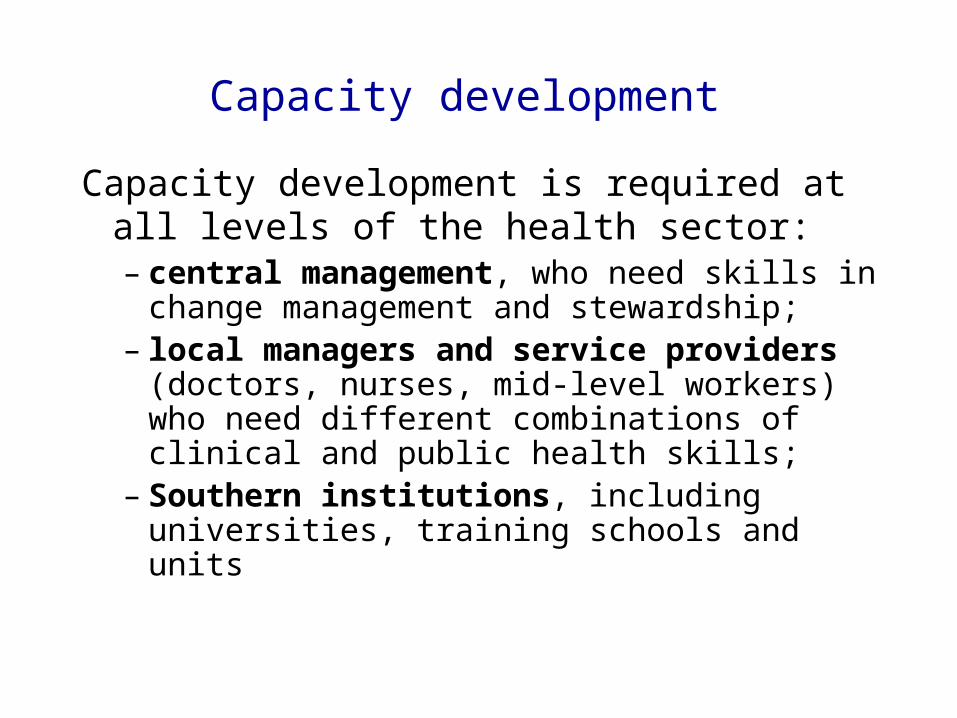
Capacity development
Capacity development is required at all levels of the health sector: – central management, who need skills
in change management and stewardship;
– local managers and service providers (doctors, nurses, mid-level workers) who need different combinations of clinical and public health skills;
– Southern institutions, including universities, training schools and units

Improving performance of existing health workers is a priority Rowe A et
al, Lancet 2005
Audit and feedback – more focus on problem-solving through health systems research
Supportive supervision Educational outreach Guideline implementation strategies Performance – related allowances ? Harries A,
Salaniponi F, Lancet 2005
“ ..If training and guidelines are to have an impact they must be provided within a context that provides reminders, supportive supervision, feedback and, perhaps, more formal quality assurance…”
English M, Arch Dis Child 2005

Monitoring
• Policies– Targets (# HW trained and distribution)– Quality of care (standards for competencies)
• Planning– Estimates (# HW trained and distribution)
• "Production"– Balance inflow/outflow– New trainees and old trainees upgraded
• Management– Supervision and support– Implementation of retention strategies– Quality of care (measurements though special
surveys and tools)

Possible Indicators
Several sources of data e.g. censuses, labour force surveys, enrolment and completion figures (N.B forthcoming World Health Report)
Criteria – policy relevance, reliability, validity, simplicity, ability to (dis)aggregate
• Density per 1000 population• Skill mix• Participation, employment opportunities ,
retention• Distribution – geographical ( equity), private vs
public, disease specific programmes etc• Production - training, attrition rates etc • Performance

Conclusions• Prioritise and plan Human Resources
• Reinstitute mid-level and community health work
• Education should be problem-oriented and practice-based - especially in low-resource environments.
• Reorientate and upgrade skills of teaching staff through continuing education.
• Improve problem-solving, audit, support and supervision
• Invest in leadership development
• Develop regulations and incentives to improve staff retention
• Develop mechanisms, including compensation of poor countries, to mitigate migration of health professionals to rich countries.
• Advocate for increased investment in enhancing capacity of and reorientating Southern institutions (incl. equitable collaboration/partnerships with Northern institutions)
• ADDRESS UNFAIR GLOBAL MACROECONOMIC REGIME