making reforms happen - oecd.org (ewf launch).pdf · vet with academic exam (2010); better more...
TRANSCRIPT

1 1
Education Policy Outlook
Making Reforms Happen
Education systems perform
differently, policy
can make a difference…

Australia Austria
Belgium Canada
Chile
Czech Rep.
Denmark
Estonia
Finland
France
Germany
Greece
Hungary
Iceland Ireland
Israel
Italy
Japan
Korea
Luxembourg
Mexico
Netherlands
New Zealand
Norway
Poland
Portugal
Slovak Rep.
Slovenia
Spain Sweden
Switzerland
Turkey
UK
US
Australia
Austria
Belgium
Canada
Chile
Czech Rep.
Denmark
Estonia
Finland
France
Germany
Greece
Hungary
Iceland
Ireland
Israel
Italy
Japan
Korea
Luxembourg
Mexico
Netherlands
New Zealand
Norway
Poland
Portugal
Slovak Rep.
Slovenia
Spain
Sweden
Switzerland
Turkey
UK
US
Socially equitable
distribution of learning
opportunities
High mathematics performance
Low mathematics performance
Strong socio-economic
impact on student
performance

Australia Austria
Belgium Canada
Chile
Czech Rep.
Denmark
Estonia
Finland
France
Germany
Greece
Hungary
Iceland Ireland
Israel
Italy
Japan
Korea
Luxembourg
Mexico
Netherlands
New Zealand
Norway
Poland
Portugal
Slovak Rep.
Slovenia
Spain Sweden
Switzerland
Turkey
UK
US
Australia
Austria
Belgium
Canada
Chile
Czech Rep.
Denmark
Estonia
Finland
France
Germany
Greece
Hungary
Iceland
Ireland
Israel
Italy
Japan
Korea
Luxembourg
Mexico
Netherlands
New Zealand
Norway
Poland
Portugal
Slovak Rep.
Slovenia
Spain
Sweden
Switzerland
Turkey
UK
US
Singapore
Shanghai
Singapore
2003 - 2012 Germany, Turkey and Mexico improved
both their mathematics performance
and equity levels
Brazil, Italy, Macao-China, Poland,
Portugal, Russian Federation,
Thailand and Tunisia improved
their mathematics performance
(no change in equity)
Liechtenstein, Norway, the United
States and Switzerland improved
their equity levels (no change in
performance)

Mean mathematics performance, by school location,
after accounting for socio-economic status Fig II.3.3 5 We need education policy reforms that improve outcomes
5
… our schools today are our economy tomorrow
Better education can shape economic prosperity…
Bringing all countries up to the performance of Finland would result in financial gains of USD 260 trillion over the lifetime of today’s 15-year-olds.
Societies with skilled individuals are prepared to respond to the current and future potential crises...
• More educated people contribute to more democratic societies and sustainable economies, are less dependent on public aid and less vulnerable to economic downturns.
• Investing in education for all, and in particular for children from disadvantaged backgrounds, is both fair and economically efficient.
Mean mathematics performance, by school location,
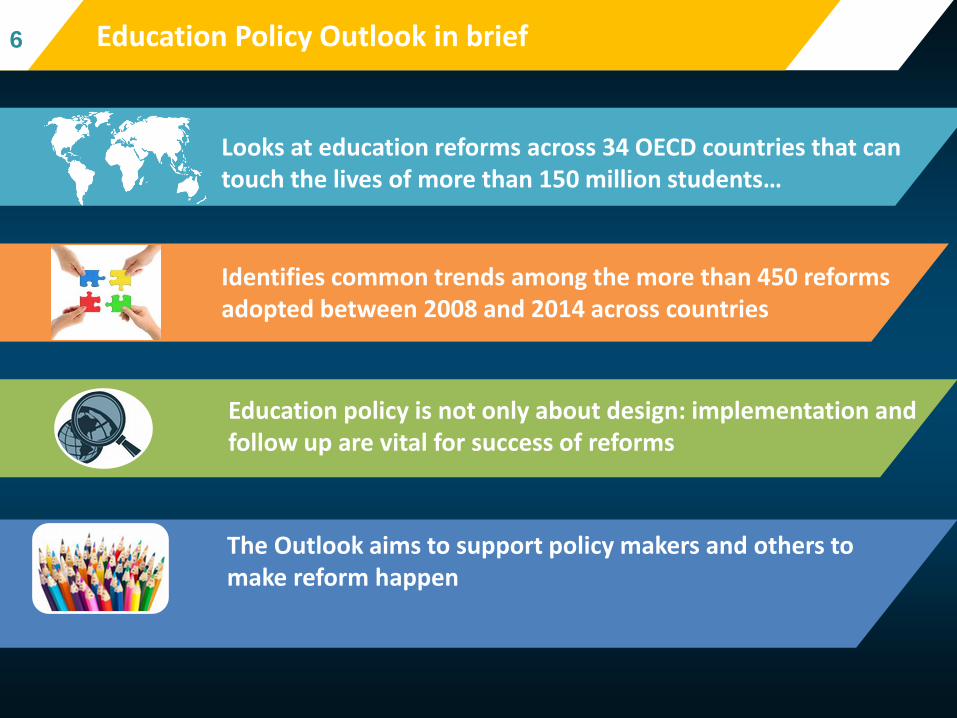
after accounting for socio-economic status Fig II.3.3 6 6 Education Policy Outlook in brief
Identifies common trends among the more than 450 reforms adopted between 2008 and 2014 across countries
Education policy is not only about design: implementation and follow up are vital for success of reforms
The Outlook aims to support policy makers and others to make reform happen
Looks at education reforms across 34 OECD countries that can touch the lives of more than 150 million students…

Mean mathematics performance, by school location,
after accounting for socio-economic status Fig II.3.3 8 8 There are clear common policy trends across countries
Policies implemented across OECD countries, 2008-14
0
5
10
15
20
25
30
35
Equity andquality
Preparingstudents for the
future
Schoolimprovement
Evaluation andassessment
Governance Funding
%
Students: Raising Outcomes
Institutions: Enhancing quality
Systems: Governing effectively

Mean mathematics performance, by school location,
after accounting for socio-economic status Fig II.3.3 9 Making effective reforms happen is key
9
Funding
grants
Subsidies for
disadvantaged
schools Reforms in
school leadership
and teachers
Support to
students
from specific
populations
Setting national
priorities for
education
New middle
school reform National
commitment to
ECEC
School
improvement
VET
reforms
Teacher training
reform
OECD countries are using different policy options to improve their education systems…
School
evaluation
reform
Student
funding
But only around 1 in 10 reforms reported evaluation to gauge impact

Mean mathematics performance, by school location,
after accounting for socio-economic status Fig II.3.3 10 We need education policy reforms that improve outcomes
10
Students: Raising Outcomes
1) Investing in quality and equity (16% of reforms reported):
Targeting policies to specific disadvantaged groups (e.g. New Zealand, England, France), and investing early on in ECEC (e.g. Australia, Poland and Korea).
2) Preparing students for the future (29% of reforms reported):
Focusing on VET (e.g. Portugal, Denmark and Sweden) & tertiary education (e.g. Belgium, Fl. & Hungary).

Mean mathematics performance, by school location,
after accounting for socio-economic status Fig II.3.3 11 11
0.0
0.5
1.0
1.5
2.0
2.5
3.0
3.5
Esto
nia
Ice
lan
dK
ore
aTu
rke
yN
orw
ayC
anad
aM
exi
coU
nit
ed
Kin
gdo
mFi
nla
nd
Ital
ySw
ed
en
Jap
anN
eth
erl
and
sU
nit
ed
Sta
tes
Slo
ven
iaG
ree
ceSw
itze
rlan
dIr
ela
nd
Au
stra
liaO
ECD
ave
rage
Po
lan
dSp
ain
Cze
ch R
ep
ub
licP
ort
uga
lA
ust
ria
De
nm
ark
Ch
ileLu
xem
bo
urg
Ge
rman
yB
elg
ium
Isra
el
Fran
ceN
ew
Ze
alan
dH
un
gary
Slo
vak
Re
pu
blic
Ratio
Increased likelihood of students in the bottom quarter of the ESCS index scoring in the bottom quarter of the mathematicsperformance distribution
Increased likelihood of immigrant students scoring in the bottom quarter of the mathematics performance distribution
Students from disadvantaged or diverse backgrounds face higher risk of low performance (PISA)
Source: OECD, PISA 2012 Database, Table II.2.4a and Table II.3.4a.
New Zealand: Policies to support
Māori/Pasifika populations (2008-13)
Finland: National Core Curriculum for Instruction
Preparing Immigrants for Basic Education (2009)
France/Portugal: Education Priority
Zones
Chile: Law on Preferential
Subsidies (2008)
Austria: New middle
school reform
Germany: National Action Plan
on Integration (2011)
ECEC: Poland, Korea, Australia, Italy,
Nordic Countries, Slovenia, United States….
UK England: Pupil premium

Mean mathematics performance, by school location,
after accounting for socio-economic status Fig II.3.3 12 12
Prioritising vocational education and training (VET)
0
20
40
60
80
100
Can
ada
Me
xico
Ko
rea
Jap
anH
un
gary
Ne
w Z
eal
and
Ch
ileIr
ela
nd
Gre
ece
Ice
lan
dEs
ton
iaU
nit
ed
Kin
gdo
mIs
rae
lP
ort
uga
lTu
rke
y1Fr
ance
Spai
nO
ECD
ave
rage
De
nm
ark
Po
lan
dG
erm
any
Swe
de
nA
ust
ralia
No
rway
Ital
yLu
xem
bo
urg
Swit
zerl
and
Slo
ven
iaN
eth
erl
and
sFi
nla
nd
Slo
vak
Re
pu
blic
Cze
ch R
ep
ub
licB
elg
ium
Au
stri
a
% General Pre-vocational Vocational
Enrolment of upper secondary students in pre-vocational or vocational programmes
Denmark: VET with academic exam
(2010); Better More attractive VET (2014)
Portugal: National Integrated Strategy(2012-14)
Italy: Governance & Higher Technical
Institutes (2011)
New Zealand: Trades Academies(2009)
Germany: Information & transitions into
Tertiary
Japan: Guidelines for enhancing
provision
Luxembourg: VET Reform (2008)
Canada: Apprenticeship grants (2007-)

Mean mathematics performance, by school location,
after accounting for socio-economic status Fig II.3.3 14 We need education policy reforms that improve outcomes
14
Institutions: Enhancing quality
3) Supporting school improvement (24% of reforms reported):
Investing in improving the teaching profession (e.g. Finland, France) and revising curricula (Scotland (UK), Japan , Finland)
4) Strengthening evaluation and assessment (12% of reforms reported): System evaluation (e.g. Italy) & student assessments (e.g. Australia).
0
10
20
30
40
50
60
70
80
90
100
Kore
a
Fin
land
Me
xic
o
Alb
ert
a (
Can
ada
)
Fla
nde
rs (
Belg
ium
)
Ne
therl
and
s
Austr
alia
Engla
nd
(U
K)
Isra
el
Un
ite
d S
tate
s
Ch
ile
Ave
rage
No
rwa
y
Japa
n
De
nm
ark
Pola
nd
Icela
nd
Esto
nia
Bra
zil
Ita
ly
Czech R
epu
blic
Port
ug
al
Spain
Sw
ede
n
Fra
nce
Slo
vak R
epub
lic
Perc
en
tag
e o
f te
ach
ers
Mean mathematics performance, by school location,
after accounting for socio-economic status Fig II.3.3 15
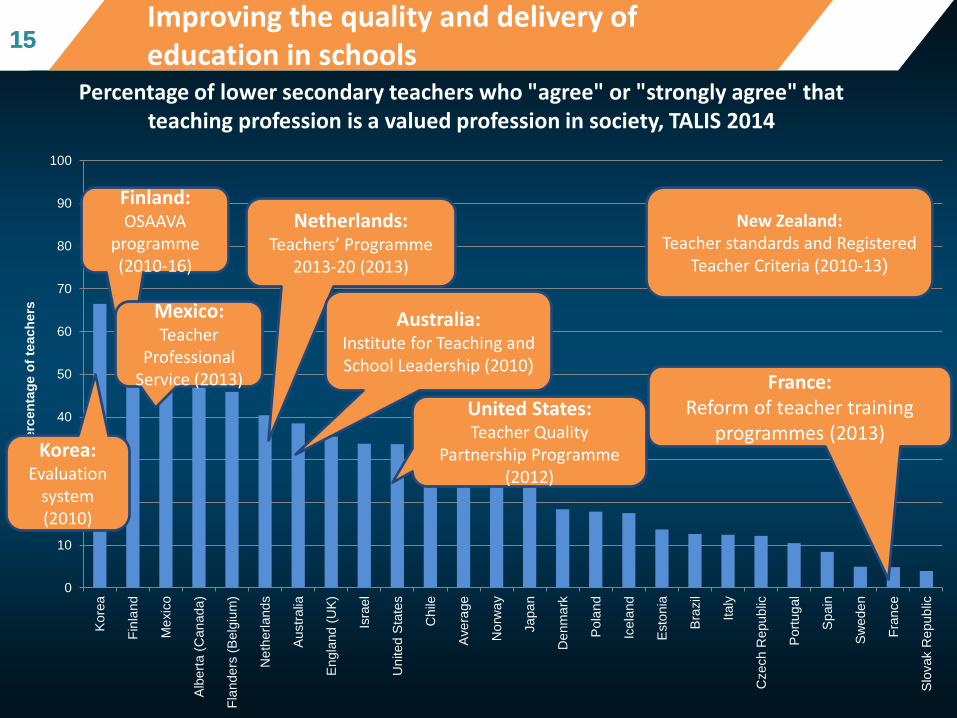
Improving the quality and delivery of education in schools
15
Percentage of lower secondary teachers who "agree" or "strongly agree" that teaching profession is a valued profession in society, TALIS 2014
15
Netherlands: Teachers’ Programme
2013-20 (2013)
Australia: Institute for Teaching and School Leadership (2010)
Finland: OSAAVA
programme (2010-16)
New Zealand: Teacher standards and Registered
Teacher Criteria (2010-13)
United States: Teacher Quality
Partnership Programme (2012)
France: Reform of teacher training
programmes (2013) Korea:
Evaluation system (2010)
Mexico: Teacher
Professional Service (2013)

Mean mathematics performance, by school location,
after accounting for socio-economic status Fig II.3.3 16 Developing learning environments 16
Students reports of teacher student relations and classrooms conduciveness to learning, PISA 2012
16
-0.5-0.4-0.3-0.2-0.1
00.10.20.30.40.50.60.70.8
Mex
ico
Po
rtu
gal
Can
ada
Icel
and
Un
ited
Sta
tes
Ch
ile
Turk
ey
Un
ited
Kin
gdo
m
Den
mar
k
Au
stra
lia
Swit
zerl
and
New
Zea
lan
d
Swed
en
Isra
el
Irel
and
OEC
D a
vera
ge
Spai
n
Hu
nga
ry
Luxe
mb
ou
rg
Esto
nia
Fin
lan
d
Be
lgiu
m
Ko
rea
Gre
ece
No
rway
Au
stri
a
Net
her
lan
ds
Ital
y
Cze
ch R
epu
blic
Jap
an
Fran
ce
Slo
vak
Rep
ub
lic
Ger
man
y
Slo
ven
ia
Po
lan
d
Mean index
Index of teacher-student relations Index of disciplinary climate
Japan: Course of Study
UK: Curriculum for Excellence (Scotland), and National Literacy and Numeracy (Wales, 2013)
Slovenia: Updated curricula
(2012)
Denmark: National Common Objectives (2009)
Finland: Curriculum reform (2014)
Italy: Curriculum
guidelines (2012)
Sweden: New curriculum
(2011)
France: Redistribution of learning time
0
10
20
30
40
50
60
70
80
90
100
OEC
D
Gre
ece
10
0
Po
rtu
gal
100
Net
her
lan
ds
99
Po
lan
d 9
9
Fran
ce 9
7
Bel
giu
m 9
7
Ger
man
y 9
6
Can
ada
10
0
Spai
n 9
9
Au
stri
a 9
6
Luxe
mb
ou
rg 9
5
Slo
vak
Rep
ub
lic…
Fin
lan
d 9
9
Slo
ven
ia 9
8
Mex
ico
99
Jap
an 9
9
Ch
ile 1
00
Ital
y 9
9
Swit
zerl
and
94
Esto
nia
99
Isra
el
10
0
Cze
ch R
epu
blic
93
New
Ze
alan
d 1
00
OEC
D a
vera
ge 9
8
Hu
nga
ry
94
Un
ited
Kin
gdo
m…
Au
stra
lia
10
0
Irel
and
1
00
Un
ited
Sta
tes
9
9
Ko
rea
95
Turk
ey
97
Swed
en
94
Icel
and
1
00
Den
mar
k
99
No
rway
9
8
%
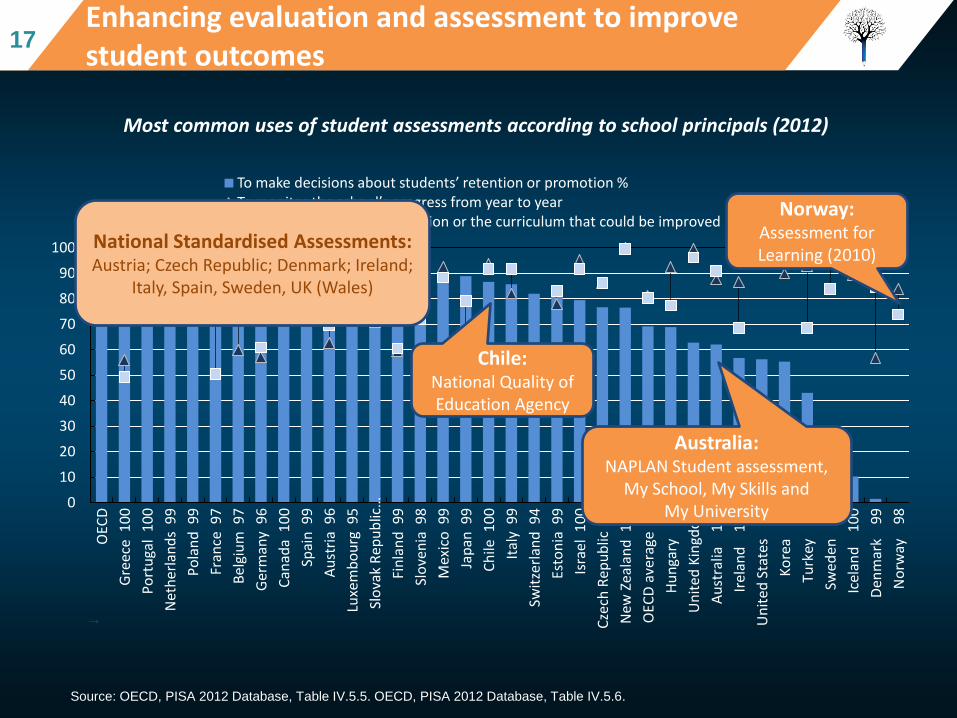
To make decisions about students’ retention or promotion % To monitor the school’s progress from year to year To identify aspects of instruction or the curriculum that could be improved
→
Source: OECD, PISA 2012 Database, Table IV.5.5. OECD, PISA 2012 Database, Table IV.5.6.
Most common uses of student assessments according to school principals (2012)
Mean mathematics performance, by school location,
after accounting for socio-economic status Fig II.3.3 17 17
Enhancing evaluation and assessment to improve student outcomes
Australia: NAPLAN Student assessment,
My School, My Skills and My University
Chile: National Quality of Education Agency
National Standardised Assessments: Austria; Czech Republic; Denmark; Ireland;
Italy, Spain, Sweden, UK (Wales)
Norway: Assessment for Learning (2010)

Mean mathematics performance, by school location,
after accounting for socio-economic status Fig II.3.3 18 We need education policy reforms that improve outcomes
18
Systems: Governing effectively
5) Steering policy setting priorities and funding effectively by: setting clear policy priorities (9%) (e.g. Denmark) with concrete objectives or using funding strategically (11%) (e.g. Germany, United States).

Mean mathematics performance, by school location,
after accounting for socio-economic status Fig II.3.3 19 19 Steering education systems towards higher performance
Increasingly complex policy-making environments
Central
Austria
Czech Republic France
Greece
Hungary Israel
Italy
Luxembourg Portugal
Turkey
Central with local
Chile Denmark
Estonia
Finland
Iceland
Japan
Korea Norway
Poland
Slovak Republic Slovenia
Sweden
Central with schools
Ireland Netherlands New Zealand
Shared central agreed with regional
Mexico Spain
Decentralised
Australia Canada Belgium Germany Switzerland United Kingdom United States

Mean mathematics performance, by school location,
after accounting for socio-economic status Fig II.3.3 20 20 Steering education systems towards higher performance
Increasingly complex policy-making environments
Central
Austria
Czech Republic France
Greece
Hungary Israel
Italy
Luxembourg Portugal
Turkey
Central with local
Chile Denmark
Estonia
Finland
Iceland
Japan
Korea Norway
Poland
Slovak Republic Slovenia
Sweden
Central with schools
Ireland Netherlands New Zealand
Shared central agreed with regional
Mexico Spain
Decentralised
Australia Canada Belgium Germany Switzerland United Kingdom United States
Many countries defined general education strategies or priorities
Estonia: LLL strategy 2014-2010
Denmark:
Denmark that stands together (2011); Folkeskole reform (2013)
Mexico: Pact for Mexico (2012); Constitutional Reform (2012-13)
Canada:
Learn Canada 2020 (2008)

Mean mathematics performance, by school location,
after accounting for socio-economic status Fig II.3.3 22 Making effective reforms happen
22
School
improvement Quality and equity
Preparing students for
the future
Evaluation and
assessment
Governance
Funding
Next steps: to make them
work for all and for good.

Mean mathematics performance, by school location, after accounting for
socio-economic status Fig II.3.3 23 23
Key factors for effective implementation of
education policy
Placing the student and
learning at the centre
Capacity-building
Leadership and
coherence
Policy evaluation
Reforms are specific to country’s
education system context
Stakeholder
engagement

Education Policy Trends
• Policy options across different policy levers
Implementation of Reforms
• Key factors to support effective implementation
Country Snapshots
• 34 individual country reform stories
The Education Policy Outlook reviews trends and implementation to help make the policy choices
#OECDEPO @oecd.org
www.oecd.com/edu/policyoutlook.htm 24

Mean mathematics performance, by school location, after accounting for
socio-economic status Fig II.3.3 25
Searching for policies adopted across OECD countries
25
Education Policy Outlook Reforms Finder
presents policies collected:
http://www.oecd.org/edu/reformsfinder.htm

Find out more about the Education Policy Outlook Series at
www.oecd.com/edu/policyoutlook.htm
#OECDEPO
@oecd.org
26