making spirits bright deloitte’s 2014 holiday shopping … · making spirits bright deloitte’s...
TRANSCRIPT
Making spirits brightDeloitte’s 2014 holiday shopping survey
October 2014
1 Copyright © 2014 Deloitte Development LLC. All rights reserved.
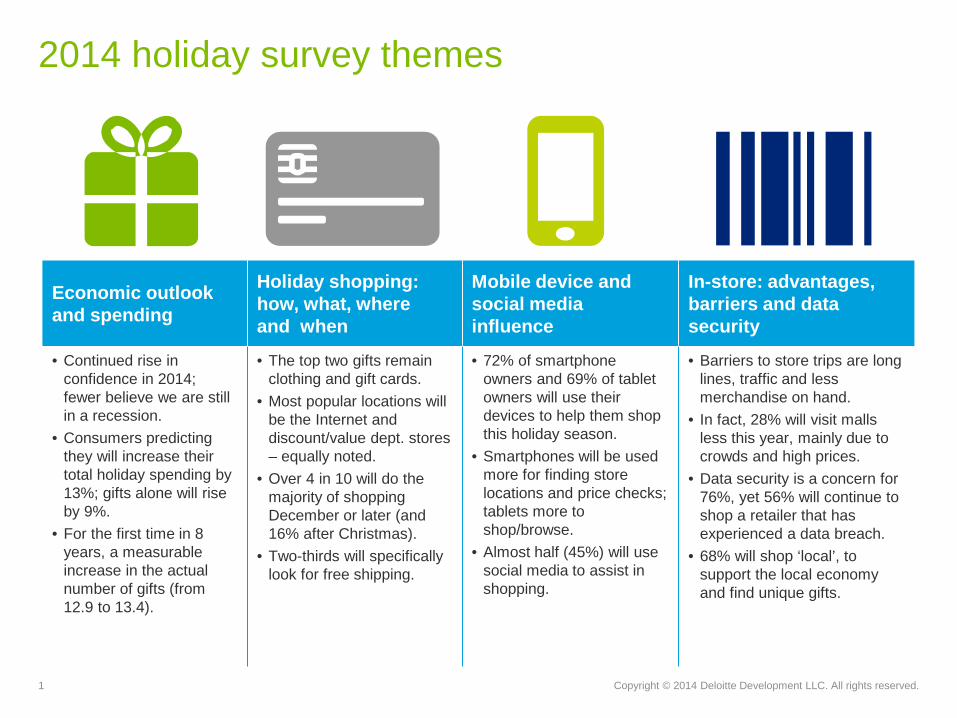
2014 holiday survey themes
Economic outlook and spending
Holiday shopping:how, what, where and when
Mobile device and social media influence
In-store: advantages, barriers and data security
• Continued rise in confidence in 2014; fewer believe we are still in a recession.
• Consumers predicting they will increase their total holiday spending by 13%; gifts alone will rise by 9%.
• For the first time in 8 years, a measurable increase in the actual number of gifts (from 12.9 to 13.4).
• The top two gifts remain clothing and gift cards.
• Most popular locations will be the Internet and discount/value dept. stores – equally noted.
• Over 4 in 10 will do the majority of shopping December or later (and 16% after Christmas).
• Two-thirds will specifically look for free shipping.
• 72% of smartphone owners and 69% of tablet owners will use their devices to help them shop this holiday season.
• Smartphones will be used more for finding store locations and price checks; tablets more to shop/browse.
• Almost half (45%) will use social media to assist in shopping.
• Barriers to store trips are long lines, traffic and less merchandise on hand.
• In fact, 28% will visit mallsless this year, mainly due to crowds and high prices.
• Data security is a concern for 76%, yet 56% will continue to shop a retailer that has experienced a data breach.
• 68% will shop ‘local’, to support the local economy and find unique gifts.

Economic outlook and spending
3 Copyright © 2014 Deloitte Development LLC. All rights reserved.
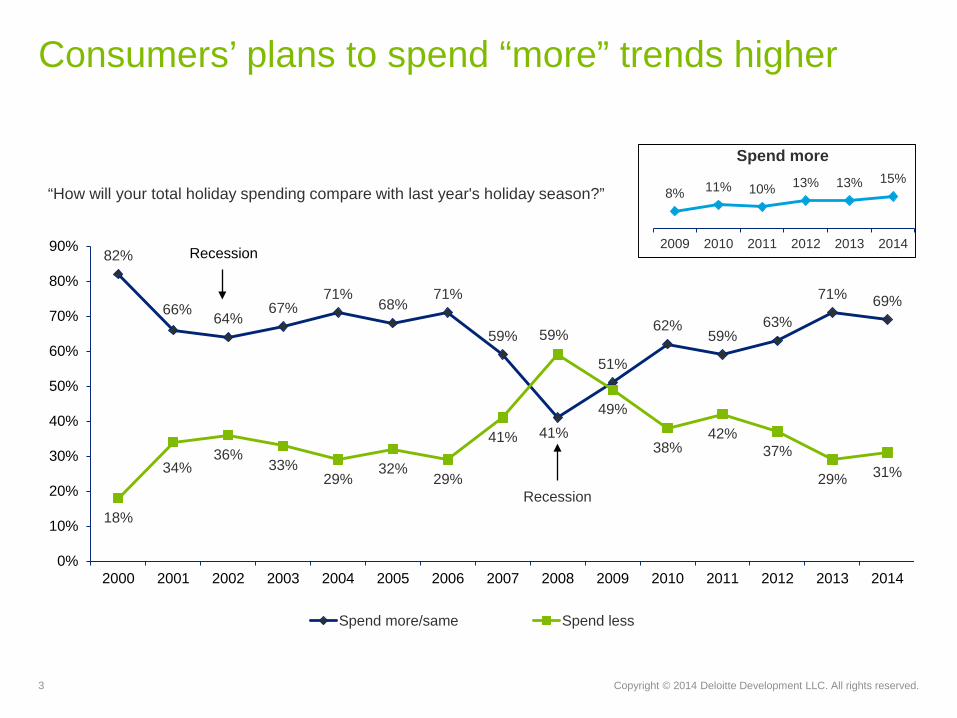
Consumers’ plans to spend “more” trends higher
82%
66% 64%67%
71%68%
71%
59%
41%
51%
62%59%
63%
71% 69%
18%
34%36%
33%29%
32%29%
41%
59%
49%
38%42%
37%
29% 31%
0%
10%
20%
30%
40%
50%
60%
70%
80%
90%
2000 2001 2002 2003 2004 2005 2006 2007 2008 2009 2010 2011 2012 2013 2014
Spend more/same Spend less
Recession
Recession
8% 11% 10% 13% 13% 15%
2009 2010 2011 2012 2013 2014
Spend more
“How will your total holiday spending compare with last year's holiday season?”
4 Copyright © 2014 Deloitte Development LLC. All rights reserved.
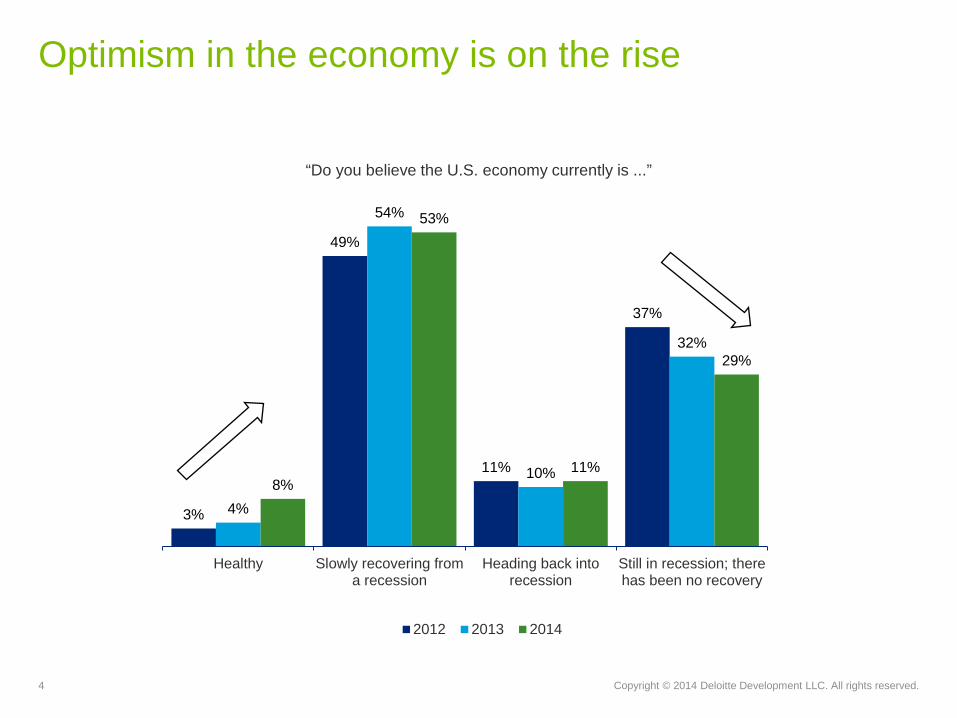
Optimism in the economy is on the rise
3%
49%
11%
37%
4%
54%
10%
32%
8%
53%
11%
29%
Healthy Slowly recovering froma recession
Heading back intorecession
Still in recession; therehas been no recovery
2012 2013 2014
“Do you believe the U.S. economy currently is ...”

5 Copyright © 2014 Deloitte Development LLC. All rights reserved.
Confidence is resulting in higher expected spending
2013 2014 % change
Gifts $421 $458 +9%
Socializing away from home $270 $310 +15%
Entertaining at home $159 $194 +22%
Non-gift clothing for family or yourself $136 $144 +6%
Home/holiday furnishings $81 $93 +15%
Any other holiday-related spendingnot listed above $87 $100 +15%
Total $1,154 $1,299 +13%
“How much do you expect you will spend during the upcoming year-end holiday season on each of the following items?”
42% of respondents have a specific budget in mind they plan on spending this holiday season
6 Copyright © 2014 Deloitte Development LLC. All rights reserved.
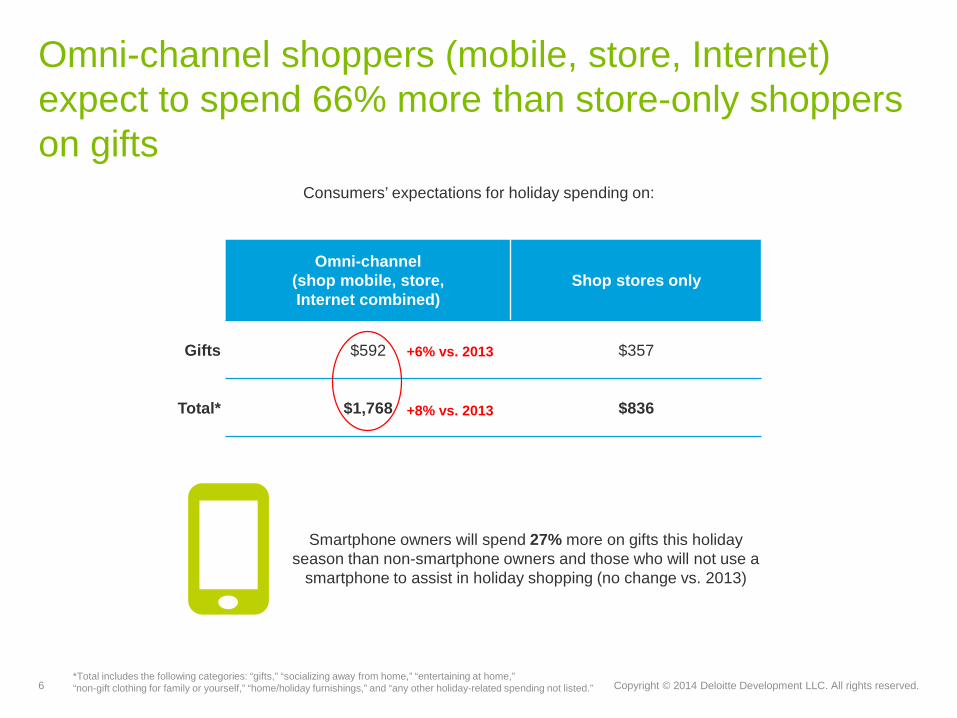
Omni-channel shoppers (mobile, store, Internet) expect to spend 66% more than store-only shoppers on gifts
Consumers’ expectations for holiday spending on:
Omni-channel(shop mobile, store, Internet combined)
Shop stores only
Gifts $592 $357
Total* $1,768 $836
*Total includes the following categories: “gifts,” “socializing away from home,” “entertaining at home,” “non-gift clothing for family or yourself,” “home/holiday furnishings,” and “any other holiday-related spending not listed.”
Smartphone owners will spend 27% more on gifts this holiday season than non-smartphone owners and those who will not use a
smartphone to assist in holiday shopping (no change vs. 2013)
+6% vs. 2013
+8% vs. 2013
7 Copyright © 2014 Deloitte Development LLC. All rights reserved.
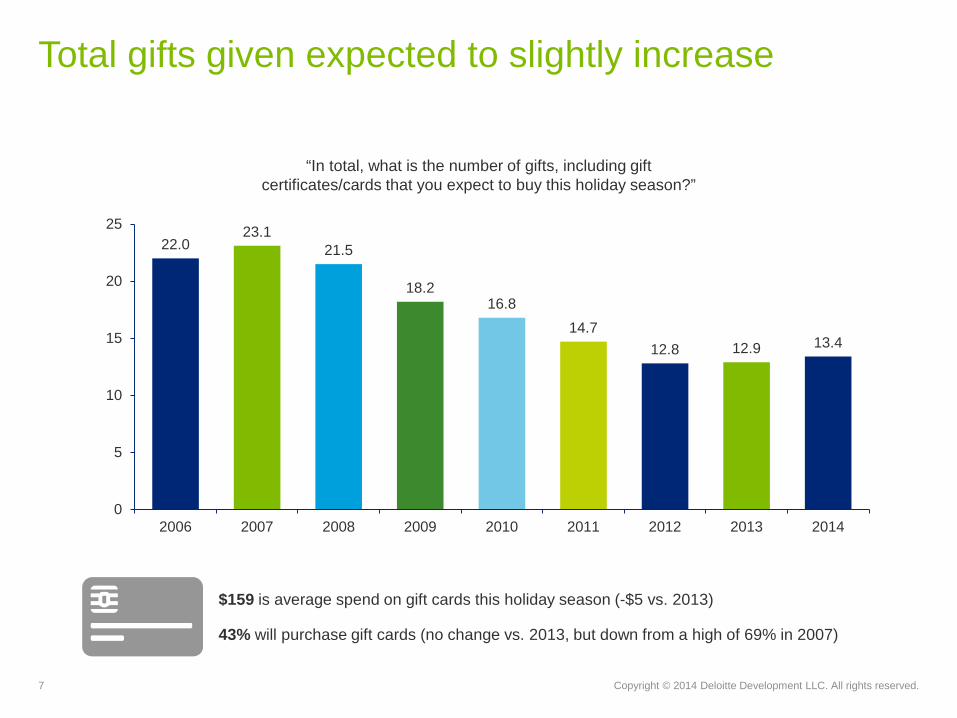
Total gifts given expected to slightly increase
22.023.1
21.5
18.216.8
14.712.8 12.9 13.4
0
5
10
15
20
25
2006 2007 2008 2009 2010 2011 2012 2013 2014
“In total, what is the number of gifts, including gift certificates/cards that you expect to buy this holiday season?”
$159 is average spend on gift cards this holiday season (-$5 vs. 2013)
43% will purchase gift cards (no change vs. 2013, but down from a high of 69% in 2007)
Holiday shopping:how, what, where and when
9 Copyright © 2014 Deloitte Development LLC. All rights reserved.
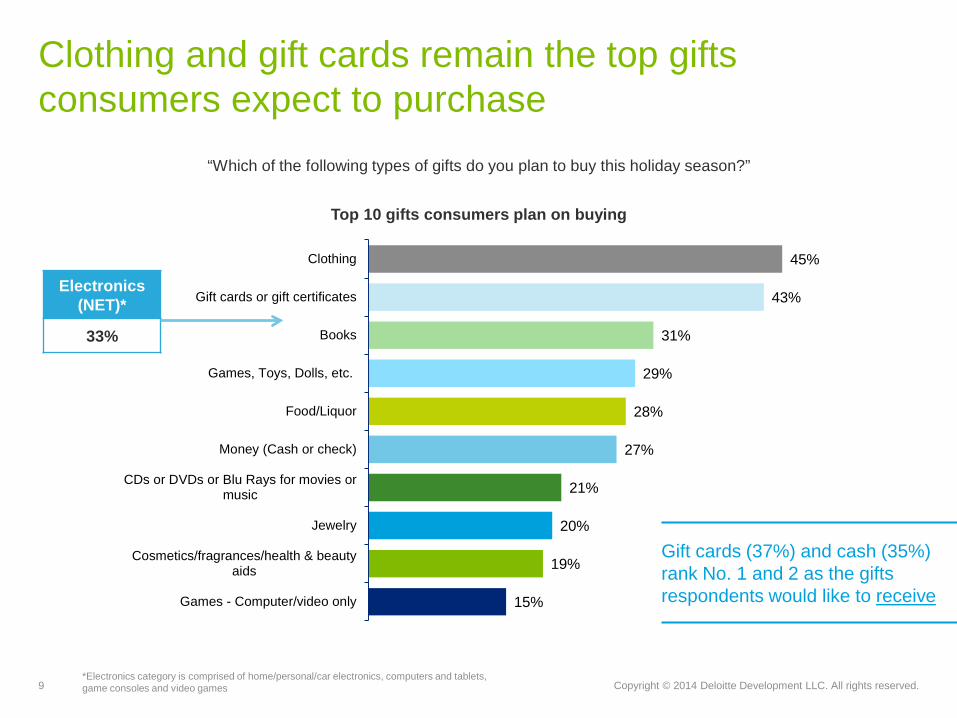
Clothing and gift cards remain the top gifts consumers expect to purchase
“Which of the following types of gifts do you plan to buy this holiday season?”
45%
43%
31%
29%
28%
27%
21%
20%
19%
15%
Clothing
Gift cards or gift certificates
Books
Games, Toys, Dolls, etc.
Food/Liquor
Money (Cash or check)
CDs or DVDs or Blu Rays for movies ormusic
Jewelry
Cosmetics/fragrances/health & beautyaids
Games - Computer/video only
Electronics (NET)*
33%
*Electronics category is comprised of home/personal/car electronics, computers and tablets, game consoles and video games
Gift cards (37%) and cash (35%) rank No. 1 and 2 as the gifts respondents would like to receive
Top 10 gifts consumers plan on buying
10 Copyright © 2014 Deloitte Development LLC. All rights reserved.
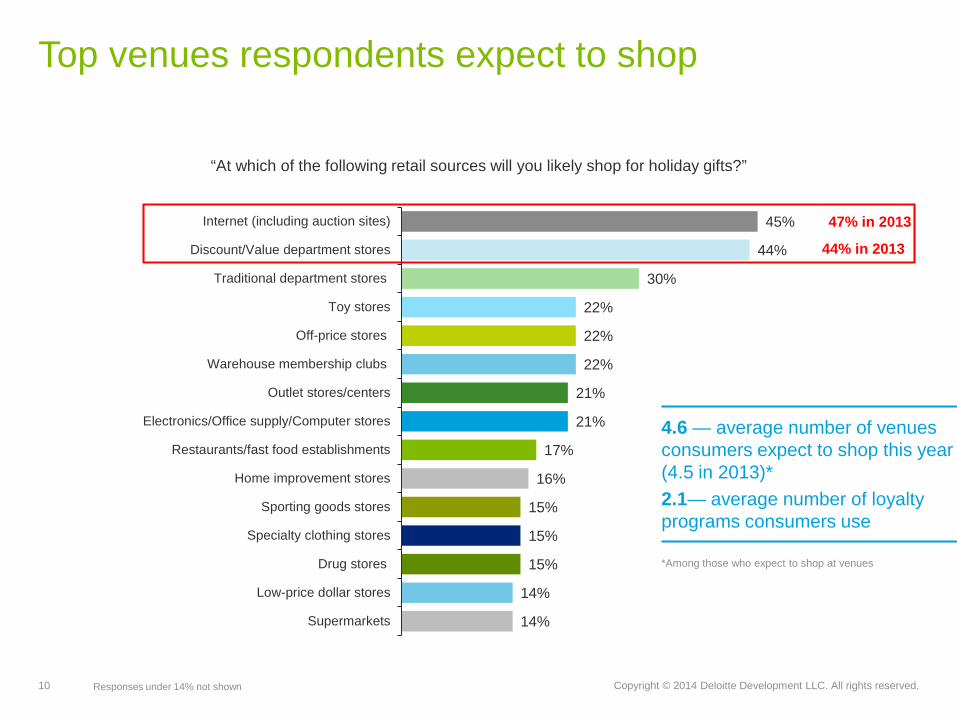
Top venues respondents expect to shop
45%
44%
30%
22%
22%
22%
21%
21%
17%
16%
15%
15%
15%
14%
14%
Internet (including auction sites)
Discount/Value department stores
Traditional department stores
Toy stores
Off-price stores
Warehouse membership clubs
Outlet stores/centers
Electronics/Office supply/Computer stores
Restaurants/fast food establishments
Home improvement stores
Sporting goods stores
Specialty clothing stores
Drug stores
Low-price dollar stores
Supermarkets
*Among those who expect to shop at venues
4.6 — average number of venues consumers expect to shop this year (4.5 in 2013)*2.1— average number of loyalty programs consumers use
47% in 2013
44% in 2013
“At which of the following retail sources will you likely shop for holiday gifts?”
Responses under 14% not shown
11 Copyright © 2014 Deloitte Development LLC. All rights reserved.
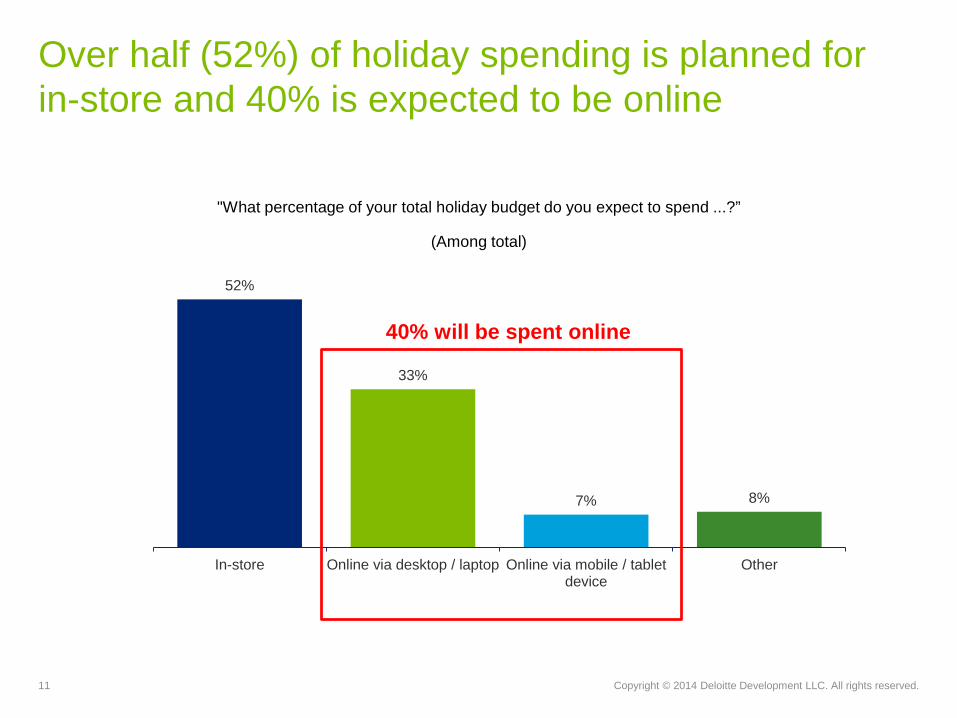
Over half (52%) of holiday spending is planned for in-store and 40% is expected to be online
"What percentage of your total holiday budget do you expect to spend ...?”
(Among total)
52%
33%
7% 8%
In-store Online via desktop / laptop Online via mobile / tabletdevice
Other
40% will be spent online
12 Copyright © 2014 Deloitte Development LLC. All rights reserved.
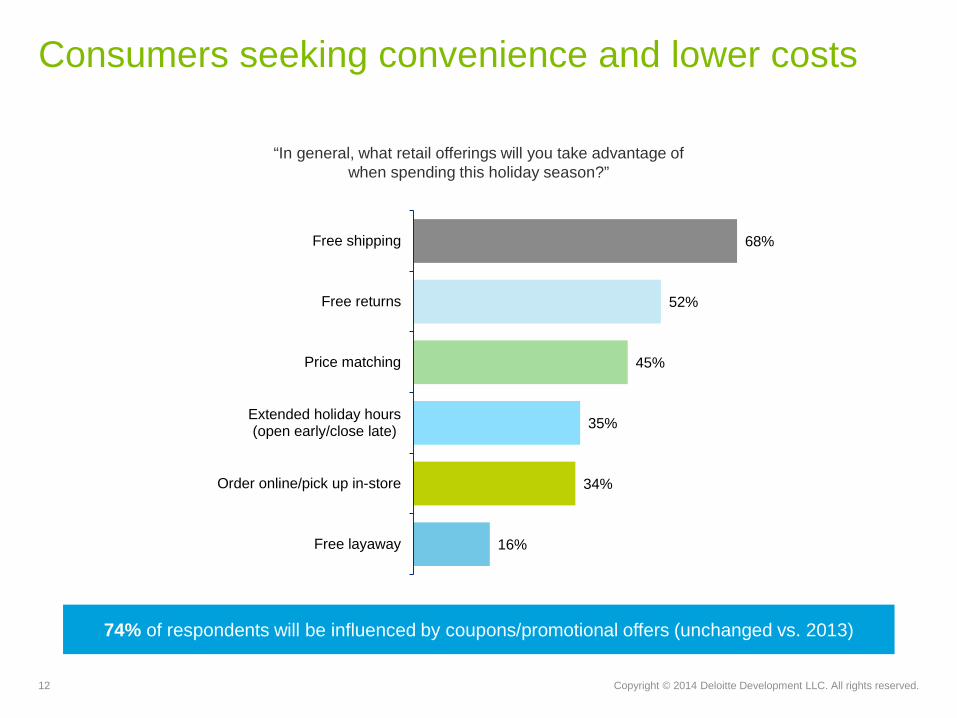
Consumers seeking convenience and lower costs
“In general, what retail offerings will you take advantage of when spending this holiday season?”
68%
52%
45%
35%
34%
16%
Free shipping
Free returns
Price matching
Extended holiday hours(open early/close late)
Order online/pick up in-store
Free layaway
74% of respondents will be influenced by coupons/promotional offers (unchanged vs. 2013)
13 Copyright © 2014 Deloitte Development LLC. All rights reserved.
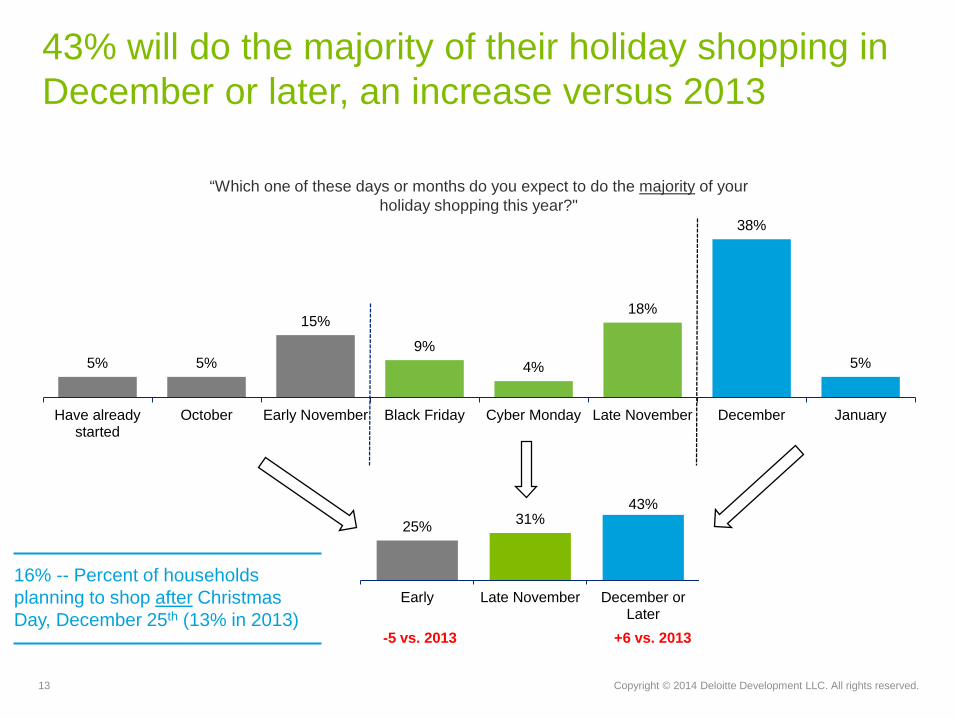
5% 5%
15%9%
4%
18%
38%
5%
Have alreadystarted
October Early November Black Friday Cyber Monday Late November December January
43% will do the majority of their holiday shopping in December or later, an increase versus 2013
25% 31%43%
Early Late November December orLater
-5 vs. 2013 +6 vs. 2013
“Which one of these days or months do you expect to do the majority of your holiday shopping this year?"
16% -- Percent of householdsplanning to shop after ChristmasDay, December 25th (13% in 2013)
14 Copyright © 2014 Deloitte Development LLC. All rights reserved.
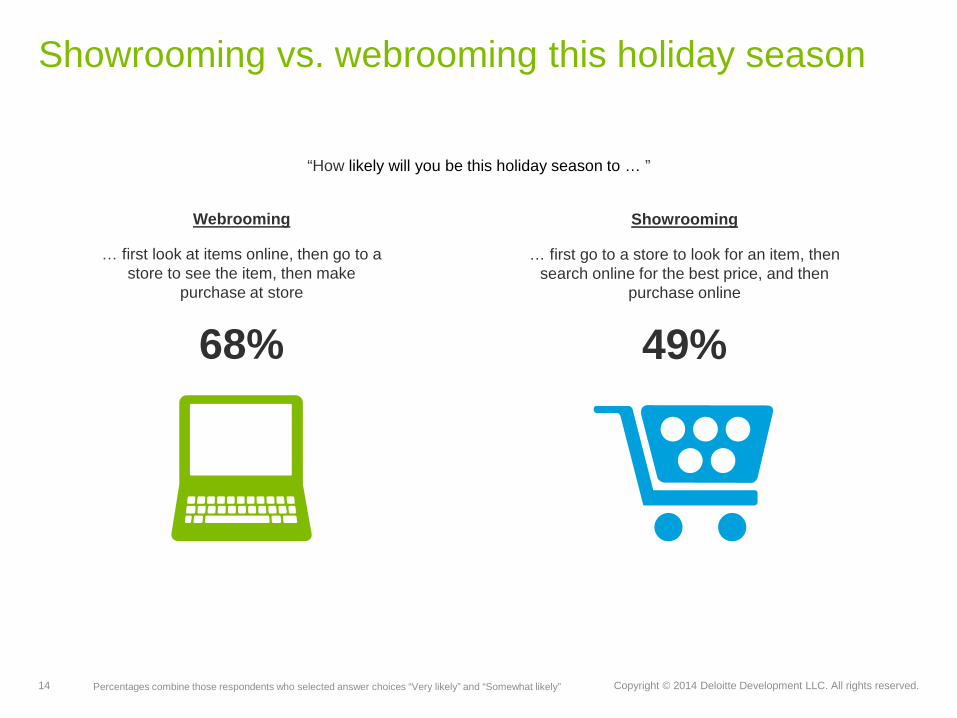
Showrooming vs. webrooming this holiday season
Showrooming
… first go to a store to look for an item, then search online for the best price, and then
purchase online
49%
Webrooming
… first look at items online, then go to a store to see the item, then make
purchase at store
68%
Percentages combine those respondents who selected answer choices “Very likely” and “Somewhat likely”
“How likely will you be this holiday season to … ”

Consumer technologies, digital influence and social media
16 Copyright © 2014 Deloitte Development LLC. All rights reserved.
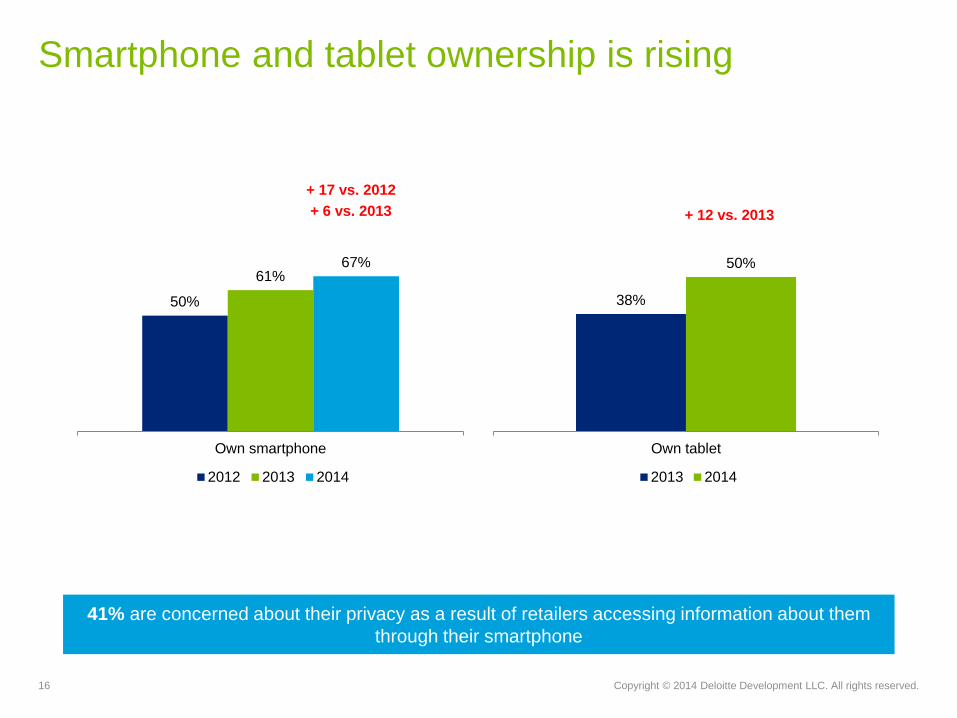
Smartphone and tablet ownership is rising
50%
61%67%
Own smartphone
2012 2013 2014
+ 17 vs. 2012+ 6 vs. 2013
38%
50%
Own tablet
2013 2014
+ 12 vs. 2013
41% are concerned about their privacy as a result of retailers accessing information about them through their smartphone
17 Copyright © 2014 Deloitte Development LLC. All rights reserved.
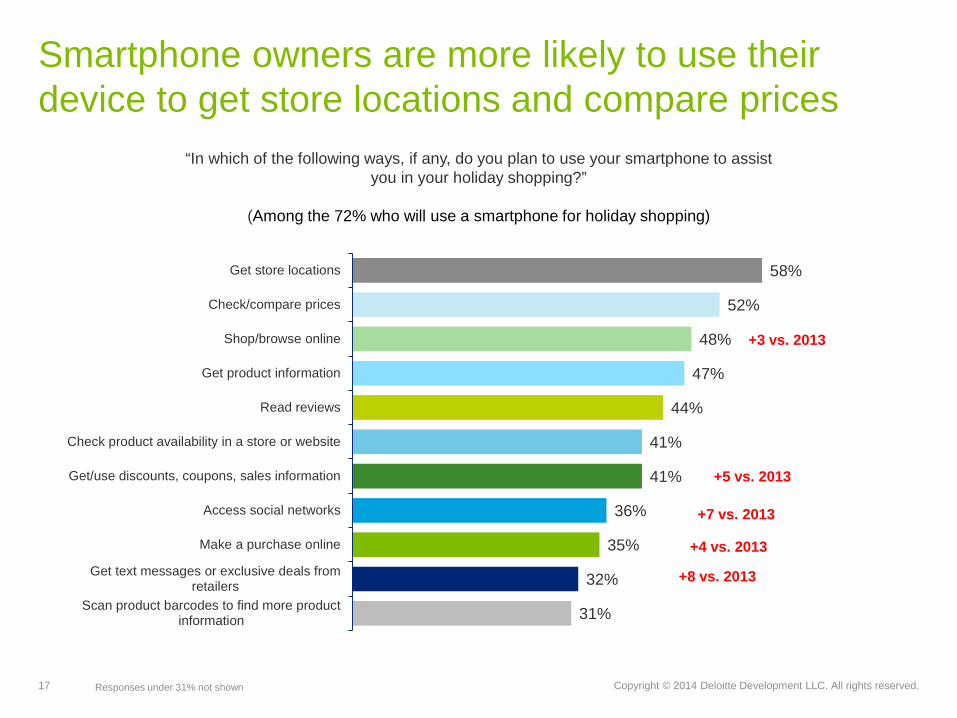
Smartphone owners are more likely to use their device to get store locations and compare prices
“In which of the following ways, if any, do you plan to use your smartphone to assist you in your holiday shopping?”
(Among the 72% who will use a smartphone for holiday shopping)
Responses under 31% not shown
58%
52%
48%
47%
44%
41%
41%
36%
35%
32%
31%
Get store locations
Check/compare prices
Shop/browse online
Get product information
Read reviews
Check product availability in a store or website
Get/use discounts, coupons, sales information
Access social networks
Make a purchase online
Get text messages or exclusive deals fromretailers
Scan product barcodes to find more productinformation
+3 vs. 2013
+7 vs. 2013
+4 vs. 2013
+8 vs. 2013
+5 vs. 2013
18 Copyright © 2014 Deloitte Development LLC. All rights reserved.
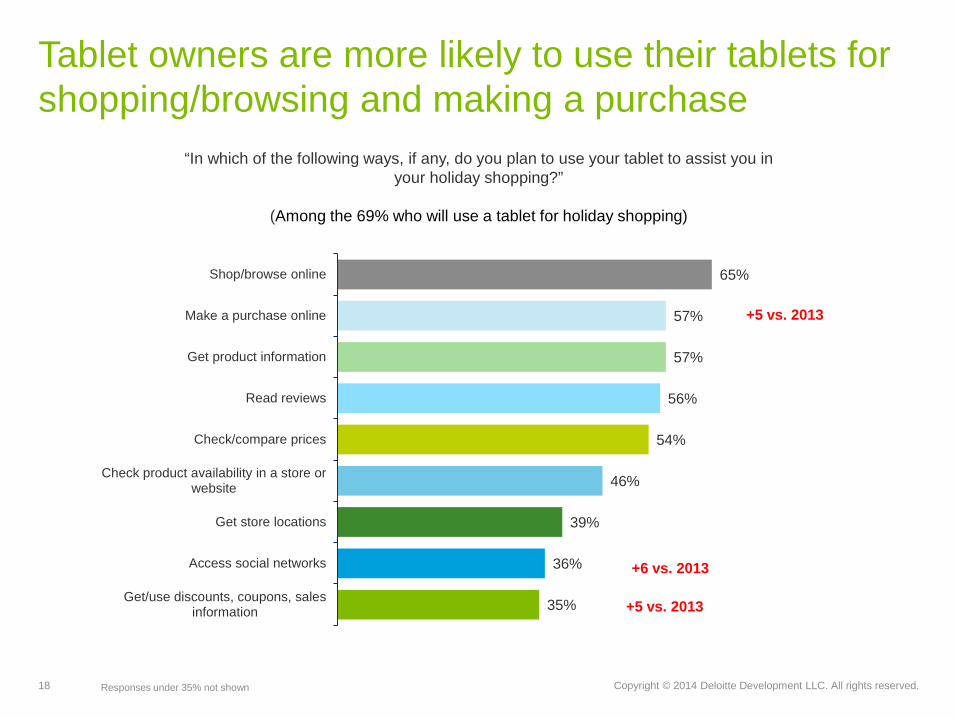
Tablet owners are more likely to use their tablets for shopping/browsing and making a purchase
“In which of the following ways, if any, do you plan to use your tablet to assist you in your holiday shopping?”
(Among the 69% who will use a tablet for holiday shopping)
Responses under 35% not shown
65%
57%
57%
56%
54%
46%
39%
36%
35%
Shop/browse online
Make a purchase online
Get product information
Read reviews
Check/compare prices
Check product availability in a store orwebsite
Get store locations
Access social networks
Get/use discounts, coupons, salesinformation
+6 vs. 2013
+5 vs. 2013
+5 vs. 2013
19 Copyright © 2014 Deloitte Development LLC. All rights reserved.
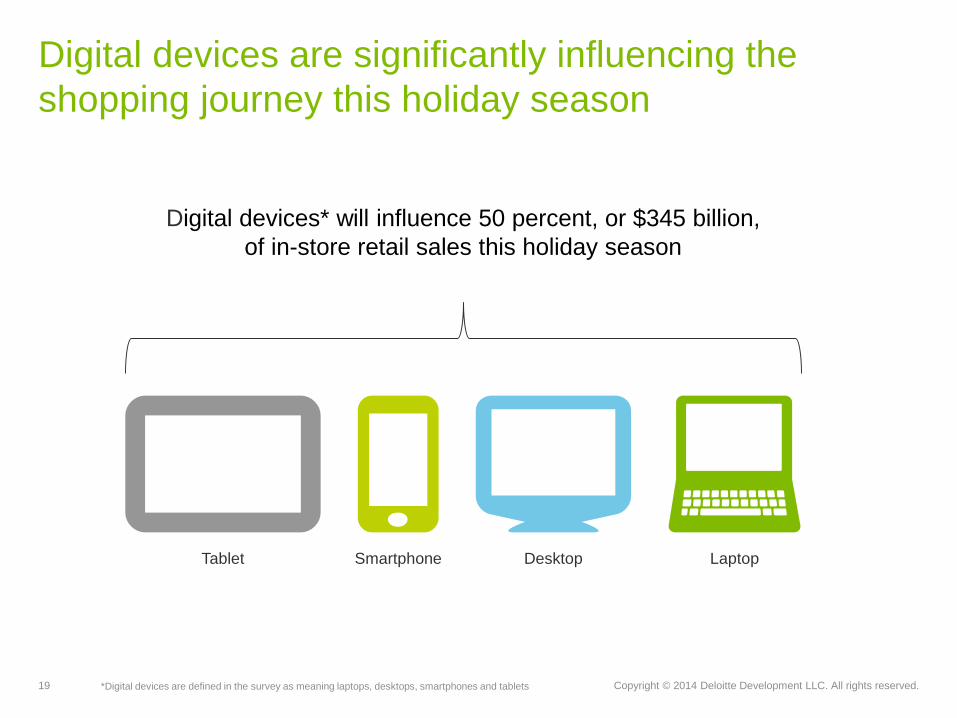
Digital devices are significantly influencing the shopping journey this holiday season
*Digital devices are defined in the survey as meaning laptops, desktops, smartphones and tablets
Digital devices* will influence 50 percent, or $345 billion, of in-store retail sales this holiday season
Tablet Smartphone Desktop Laptop
20 Copyright © 2014 Deloitte Development LLC. All rights reserved.
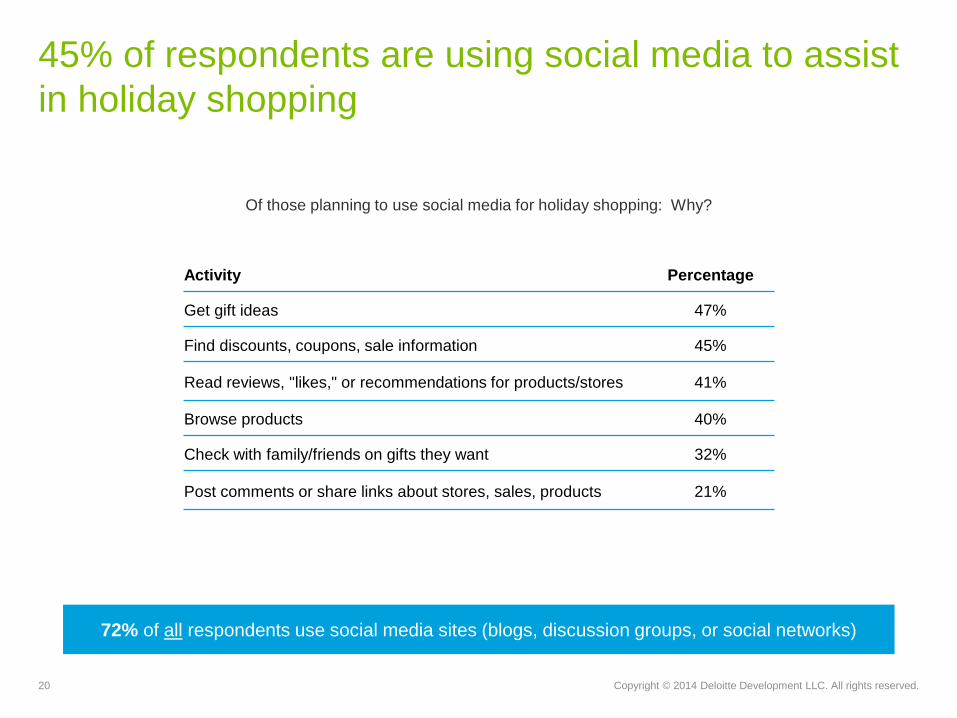
45% of respondents are using social media to assist in holiday shopping
Of those planning to use social media for holiday shopping: Why?
72% of all respondents use social media sites (blogs, discussion groups, or social networks)
Activity Percentage
Get gift ideas 47%
Find discounts, coupons, sale information 45%
Read reviews, "likes," or recommendations for products/stores 41%
Browse products 40%
Check with family/friends on gifts they want 32%
Post comments or share links about stores, sales, products 21%
In-store shopping:advantages, barriers and data security
22 Copyright © 2014 Deloitte Development LLC. All rights reserved.
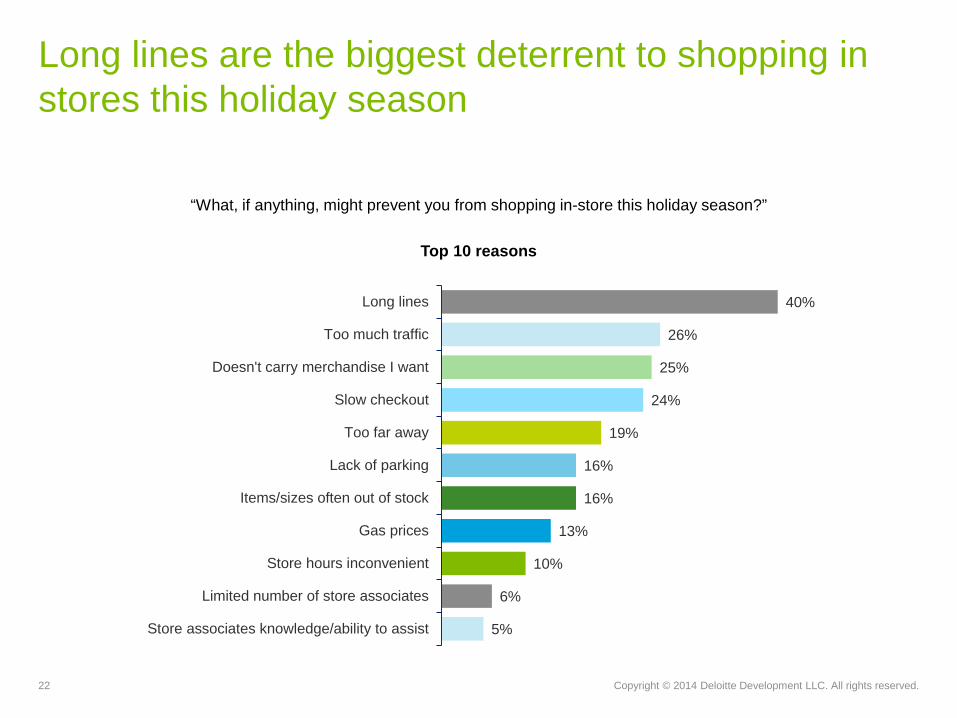
Long lines are the biggest deterrent to shopping in stores this holiday season
“What, if anything, might prevent you from shopping in-store this holiday season?”
Top 10 reasons
40%
26%
25%
24%
19%
16%
16%
13%
10%
6%
5%
Long lines
Too much traffic
Doesn't carry merchandise I want
Slow checkout
Too far away
Lack of parking
Items/sizes often out of stock
Gas prices
Store hours inconvenient
Limited number of store associates
Store associates knowledge/ability to assist
23 Copyright © 2014 Deloitte Development LLC. All rights reserved.
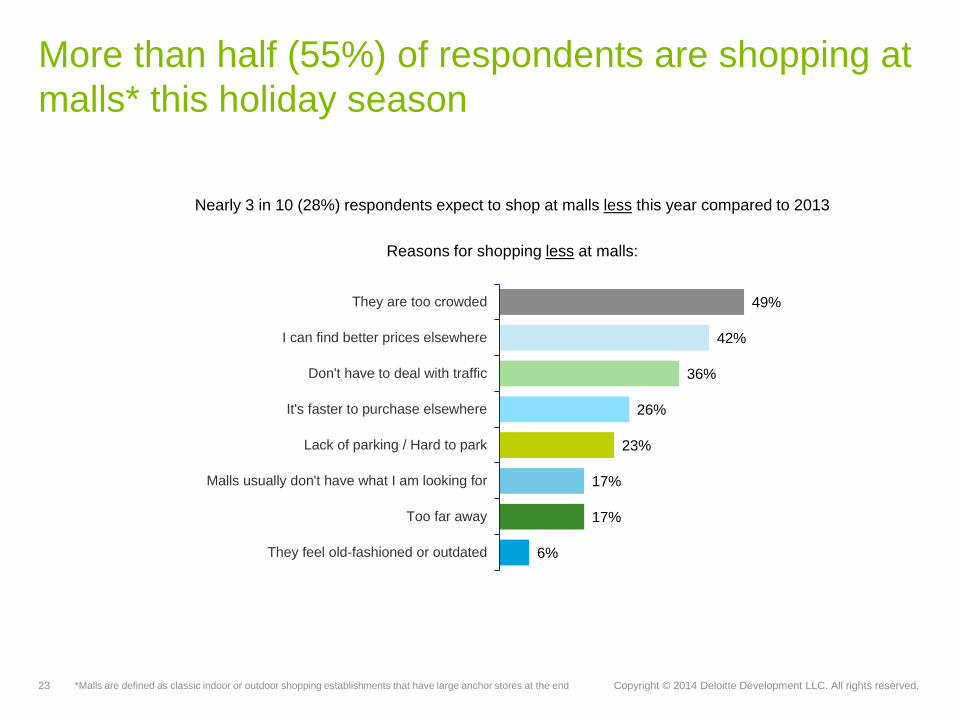
More than half (55%) of respondents are shopping at malls* this holiday season
Nearly 3 in 10 (28%) respondents expect to shop at malls less this year compared to 2013
Reasons for shopping less at malls:
*Malls are defined as classic indoor or outdoor shopping establishments that have large anchor stores at the end
49%
42%
36%
26%
23%
17%
17%
6%
They are too crowded
I can find better prices elsewhere
Don't have to deal with traffic
It's faster to purchase elsewhere
Lack of parking / Hard to park
Malls usually don't have what I am looking for
Too far away
They feel old-fashioned or outdated
24 Copyright © 2014 Deloitte Development LLC. All rights reserved.
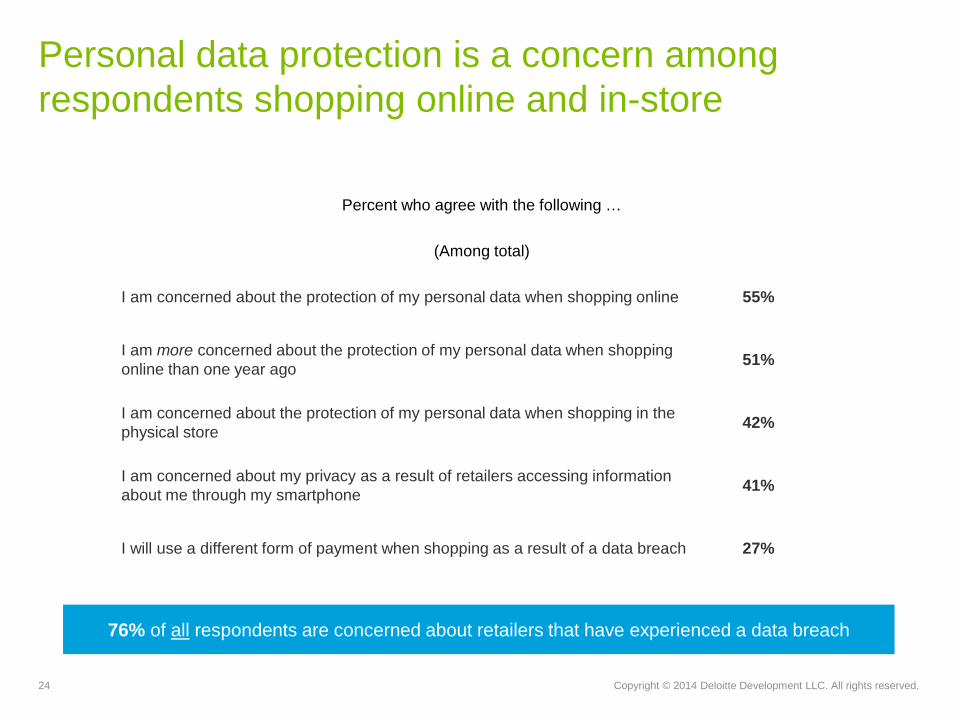
Personal data protection is a concern among respondents shopping online and in-store
Percent who agree with the following …
(Among total)
I am concerned about the protection of my personal data when shopping online 55%
I am more concerned about the protection of my personal data when shopping online than one year ago 51%
I am concerned about the protection of my personal data when shopping in the physical store 42%
I am concerned about my privacy as a result of retailers accessing information about me through my smartphone 41%
I will use a different form of payment when shopping as a result of a data breach 27%
76% of all respondents are concerned about retailers that have experienced a data breach
25 Copyright © 2014 Deloitte Development LLC. All rights reserved.
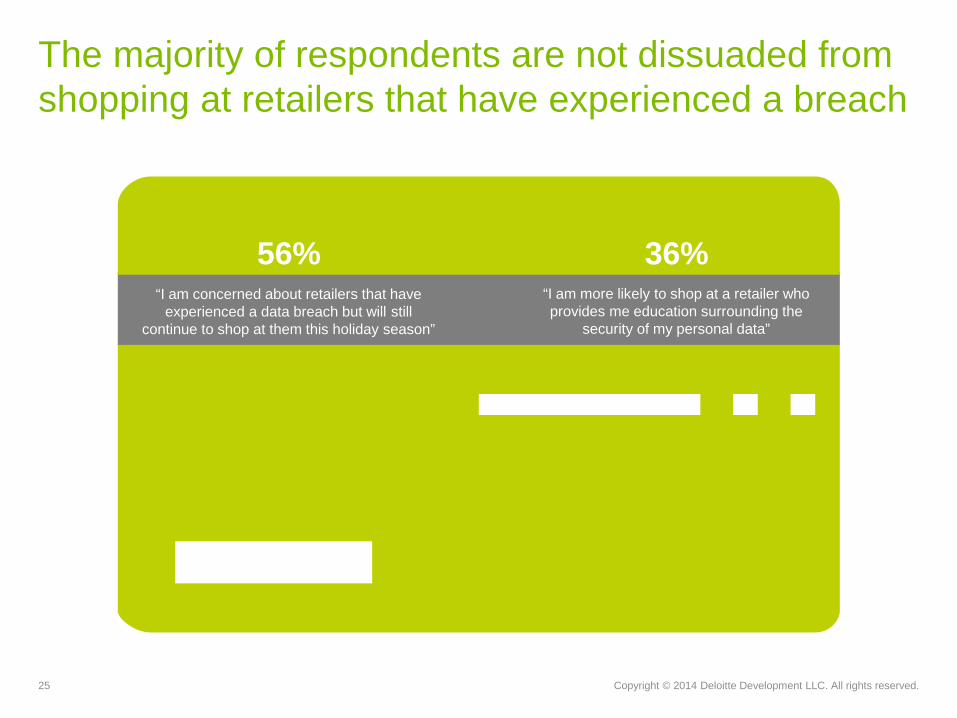
The majority of respondents are not dissuaded from shopping at retailers that have experienced a breach
“I am more likely to shop at a retailer who provides me education surrounding the
security of my personal data”
56% 36%“I am concerned about retailers that have
experienced a data breach but will still continue to shop at them this holiday season”
26 Copyright © 2014 Deloitte Development LLC. All rights reserved.
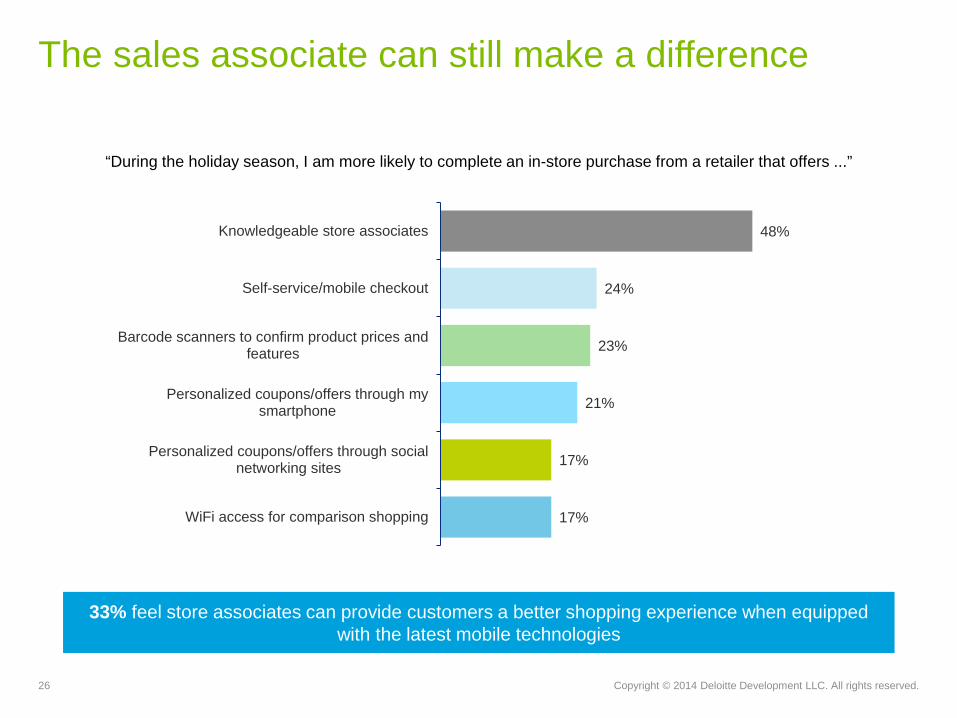
The sales associate can still make a difference
“During the holiday season, I am more likely to complete an in-store purchase from a retailer that offers ...”
48%
24%
23%
21%
17%
17%
Knowledgeable store associates
Self-service/mobile checkout
Barcode scanners to confirm product prices andfeatures
Personalized coupons/offers through mysmartphone
Personalized coupons/offers through socialnetworking sites
WiFi access for comparison shopping
33% feel store associates can provide customers a better shopping experience when equipped with the latest mobile technologies
27 Copyright © 2014 Deloitte Development LLC. All rights reserved.
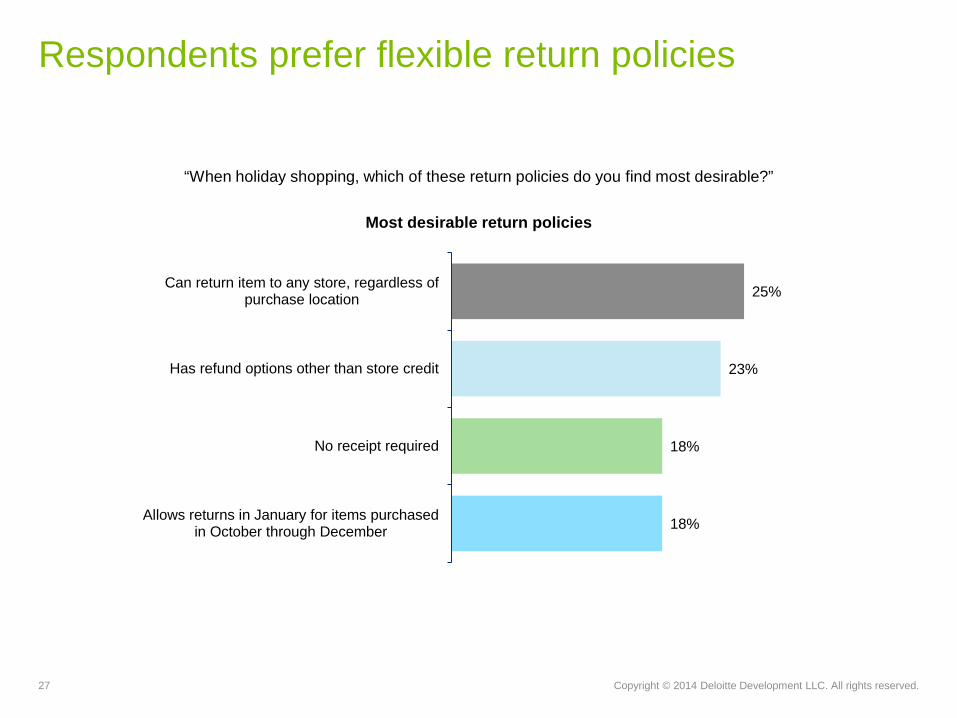
Respondents prefer flexible return policies
“When holiday shopping, which of these return policies do you find most desirable?”
Most desirable return policies
25%
23%
18%
18%
Can return item to any store, regardless ofpurchase location
Has refund options other than store credit
No receipt required
Allows returns in January for items purchasedin October through December
28 Copyright © 2014 Deloitte Development LLC. All rights reserved.
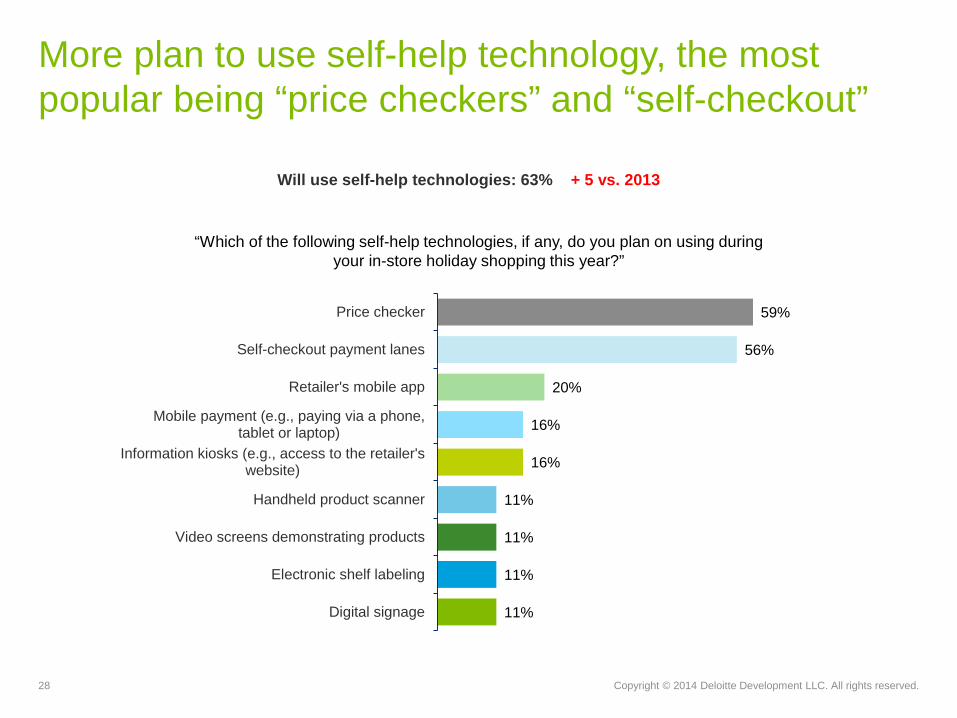
More plan to use self-help technology, the most popular being “price checkers” and “self-checkout”
“Which of the following self-help technologies, if any, do you plan on using during your in-store holiday shopping this year?”
59%
56%
20%
16%
16%
11%
11%
11%
11%
Price checker
Self-checkout payment lanes
Retailer's mobile app
Mobile payment (e.g., paying via a phone,tablet or laptop)
Information kiosks (e.g., access to the retailer'swebsite)
Handheld product scanner
Video screens demonstrating products
Electronic shelf labeling
Digital signage
+ 5 vs. 2013Will use self-help technologies: 63%
29 Copyright © 2014 Deloitte Development LLC. All rights reserved.
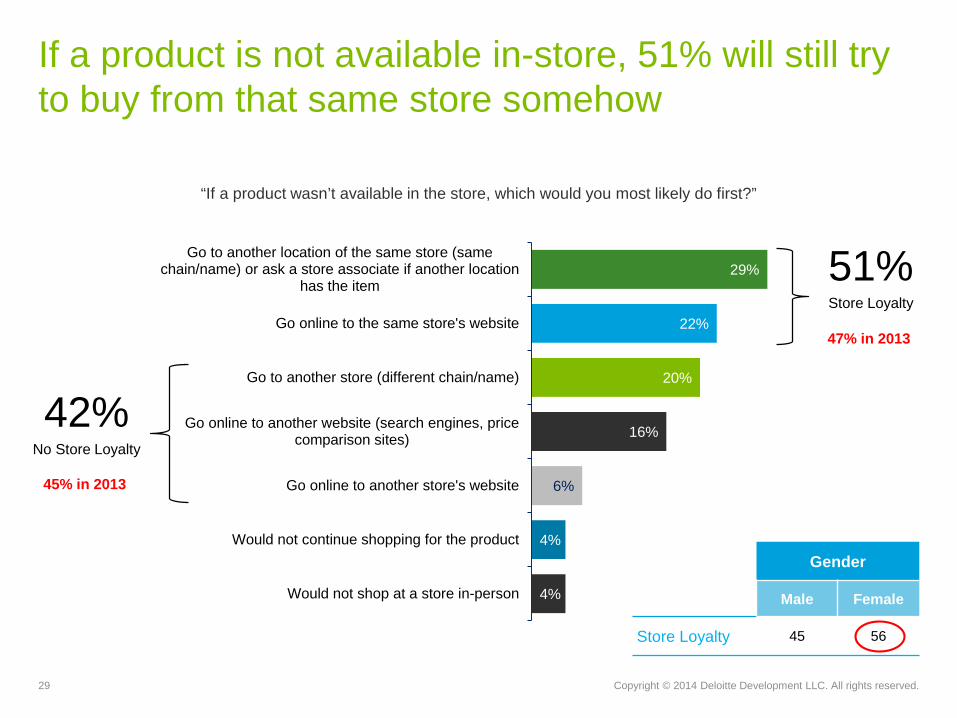
If a product is not available in-store, 51% will still try to buy from that same store somehow
“If a product wasn’t available in the store, which would you most likely do first?”
29%
22%
20%
16%
6%
4%
4%
Go to another location of the same store (samechain/name) or ask a store associate if another location
has the item
Go online to the same store's website
Go to another store (different chain/name)
Go online to another website (search engines, pricecomparison sites)
Go online to another store's website
Would not continue shopping for the product
Would not shop at a store in-person
51%Store Loyalty
42%No Store Loyalty
47% in 2013
45% in 2013
Gender
Male Female
Store Loyalty 45 56

30 Copyright © 2014 Deloitte Development LLC. All rights reserved.
If a product is not available on a store’s website, the majority will look at a different store or website
“If the product wasn’t available on a store’s website, which would you most likely do first?”
34%
29%
14%
11%
6%
5%
Go online to another store's website
Go online to another website (search engines, pricecomparison sites)
Go to same store in-person (same chain/name)
Go to another store in-person (different chain/name)
Would not shop online
Would not continue shopping for the product
74%Go elsewhere
31 Copyright © 2014 Deloitte Development LLC. All rights reserved.
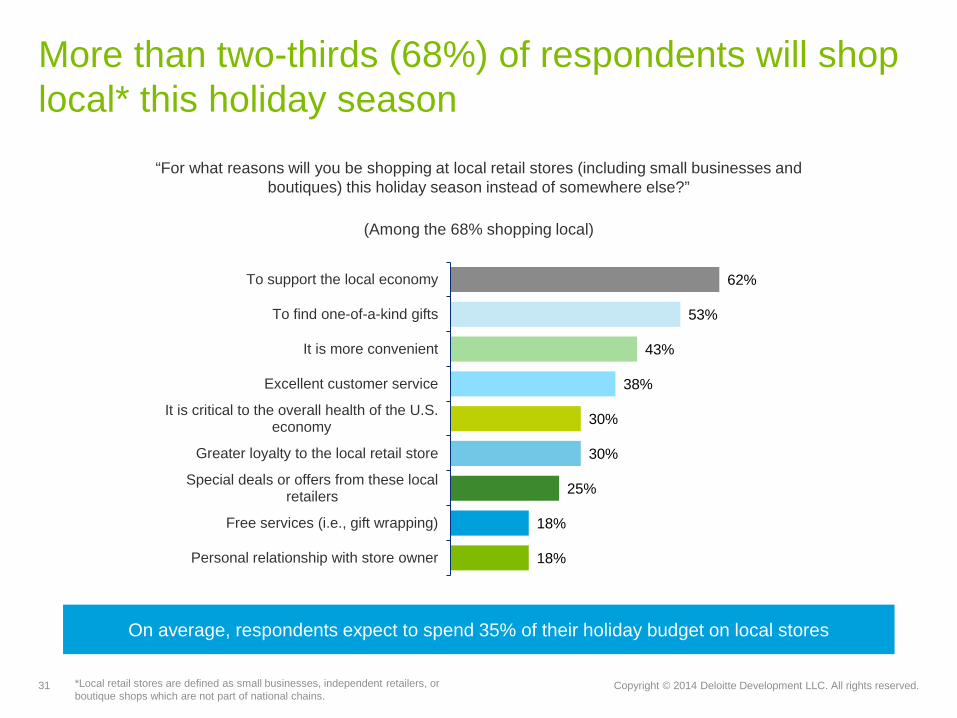
More than two-thirds (68%) of respondents will shop local* this holiday season
“For what reasons will you be shopping at local retail stores (including small businesses and boutiques) this holiday season instead of somewhere else?”
(Among the 68% shopping local)
*Local retail stores are defined as small businesses, independent retailers, or boutique shops which are not part of national chains.
On average, respondents expect to spend 35% of their holiday budget on local stores
62%
53%
43%
38%
30%
30%
25%
18%
18%
To support the local economy
To find one-of-a-kind gifts
It is more convenient
Excellent customer service
It is critical to the overall health of the U.S.economy
Greater loyalty to the local retail store
Special deals or offers from these localretailers
Free services (i.e., gift wrapping)
Personal relationship with store owner
32 Copyright © 2014 Deloitte Development LLC. All rights reserved.
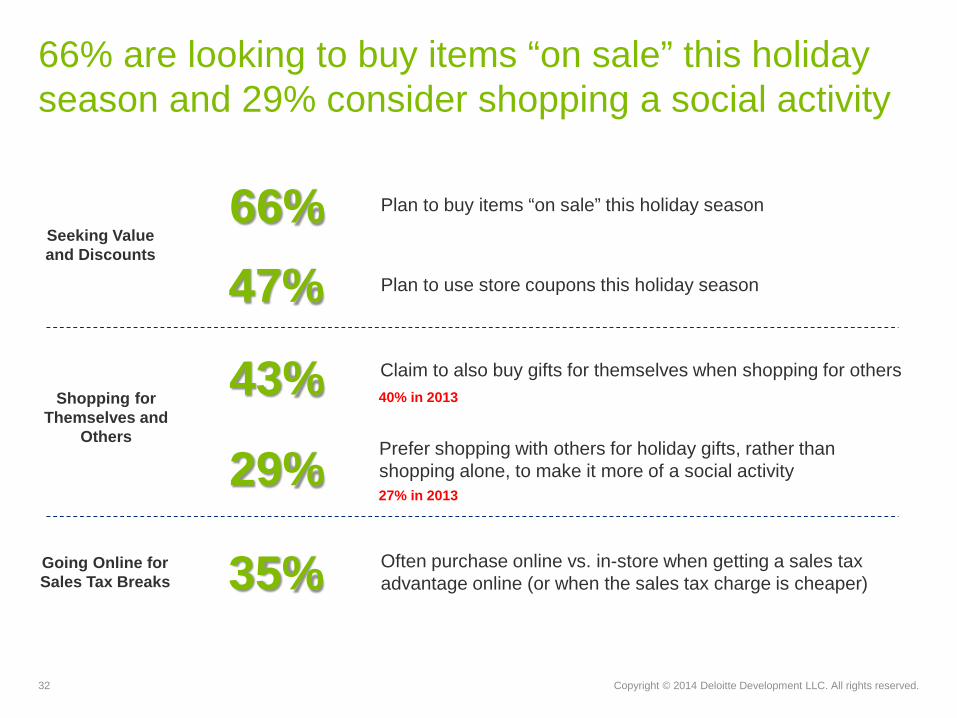
66% are looking to buy items “on sale” this holiday season and 29% consider shopping a social activity
29%
43%
66%
35% Often purchase online vs. in-store when getting a sales tax advantage online (or when the sales tax charge is cheaper)
Plan to buy items “on sale” this holiday season
Shopping for Themselves and
Others
Going Online for Sales Tax Breaks
47% Plan to use store coupons this holiday season
Seeking Value and Discounts
Claim to also buy gifts for themselves when shopping for others40% in 2013
Prefer shopping with others for holiday gifts, rather than shopping alone, to make it more of a social activity27% in 2013
33 Copyright © 2014 Deloitte Development LLC. All rights reserved.
About the survey
The survey was commissioned by Deloitte andconducted online by an independent research company between September 13–24, 2014. It polled a national sample of 5,033 consumers and has a margin of error for the entire sample of plus or minus one percentage point.
As used in this document, "Deloitte" means Deloitte LLP and its subsidiaries. Please see www.deloitte.com/us/about for a detailed description of the legal structure of Deloitte LLP and its subsidiaries. Certain services may not be available to attest clients under the rules and regulations of public accounting.
Copyright © 2014 Deloitte Development LLC. All rights reserved.36 USC 220506Member of Deloitte Touche Tohmatsu Limited
This presentation contains general information only and is based on the experiences and research of Deloitte practitioners. Deloitte is not, by means of this presentation, rendering business, financial, investment, or other professional advice or services. This presentation is not a substitute for such professional advice or services, nor should it be used as a basis for any decision or action that may affect your business. Before making any decision or taking any action that may affect your business, you should consult a qualified professional advisor. Deloitte, its affiliates, and related entities shall not be responsible for any loss sustained by any person who relies on this presentation.