making the grade - home - office of elementary and
TRANSCRIPT
WWW.AMERICANPROGRESS.ORG
CA
P/PETE MO
RELEWICZ
Making the GradeA 50-State Analysis of School Accountability Systems
By Carmel Martin, Scott Sargrad, and Samantha Batel May 2016

Making the GradeA 50-State Analysis of School Accountability Systems Part of a Series on Implementation of the Every Student Succeeds Act
By Carmel Martin, Scott Sargrad, and Samantha Batel May 2016

1 Introduction and summary
4 Statewide school accountability: A brief history
7 Statewide accountability systems
30 Next steps for statewide accountability
32 Recommendations
35 Conclusion
36 About the authors
38 Appendix A: Methodology
40 Appendix B: Indicator analysis
68 Appendix C: Weighting analysis
81 Appendix D: Sources
89 Endnotes
Contents

1 Center for American Progress | Making the Grade
Introduction and summary
One of the most enduring and contentious debates in education circles concerns the best way to hold schools and districts accountable for improving outcomes for students and closing achievement gaps. Lawmakers, teachers, district administra-tors, parents, and other stakeholders—all with strong and differing opinions—have wrestled for decades with questions about the appropriate role of the federal government compared with that of states and school districts in the operation of schools and the measurement of their success. Over the past 15 years, however, a national consensus slowly has emerged among the disparate parties and coalesced into a clear movement toward more sophisticated accountability systems and fewer federal mandates.
The Every Student Succeeds Act, or ESSA, signed into law in December 2015, was in many ways the culmination of the accountability movement. After months of negotiations, Congress outlined new requirements for statewide accountability systems that give states the opportunity to design their own sys-tems that move beyond just test scores, while maintaining a clear federal role to protect historically underserved students.
Under ESSA, states must hold schools accountable for student performance in English language arts, or ELA, and mathematics; a second academic indicator, such as growth in ELA and mathematics; progress in achieving English language proficiency; high school graduation rates, if applicable; and at least one measure of school quality or student success. In addition, states are required to disaggregate these indicators, excluding English language proficiency, by individual subgroups of students, including those from low-income families, those from major racial and ethnic groups, those with disabilities, and English language learners.1
Along with requiring states to use specific categories of indicators, ESSA also includes requirements related to the emphasis that states must place on the dif-ferent indicators. States must give “substantial weight” to the first four indicators above and “much greater weight” to the combination of those indicators than to the measures of school quality or student success.2

2 Center for American Progress | Making the Grade
ESSA’s new requirements build on the history of school accountability, which began at the state level in the 1990s amid a broader effort to measure school perfor-mance.3 The No Child Left Behind Act, or NCLB—the 2001 reauthorization of the Elementary and Secondary Education Act, or ESEA—increased the federal role in accountability.4 Under NCLB, states were responsible for improving student profi-ciency in ELA and mathematics as well as high school graduation rates. Additionally, schools were required to meet proficiency targets for every subgroup of students annually, with the targets increasing to 100 percent proficiency by 2014.5
ESSA, the most recent reauthorization of ESEA, gives states greater flexibility in designing more holistic accountability systems that take into account multiple indicators of school success, while continuing to hold schools accountable for academic achievement. This report analyzes the measures that states currently include in their accountability systems and examines how state systems compare with the new law’s provisions, which will take effect in the 2017-18 school year.6 To this end, the Center for American Progress analyzed ESEA flexibility waivers and accountability workbooks, supplementing the data from those sources with information and materials from state departments of education.
The authors find that statewide accountability measures fall into one of seven main categories of indicators: achievement indicators, such as proficiency in read-ing and mathematics; student growth indicators in multiple academic subjects; English language acquisition indicators; early warning indicators, such as chronic absenteeism; persistence indicators, such as graduation rates; college- and career-ready indicators, such as participation in and performance on college entry exams; and other indicators, such as access to the arts.
It is apparent from the research for this report that state accountability systems vary in complexity. It is also abundantly clear that while the majority of states have surpassed the requirements of NCLB, nearly all states will need to make adjust-ments to comply fully with the new law. As states plan for this transition, CAP recommends that they take the following steps:
• States should set a vision for their accountability systems and be purposeful
about the incentives they create when selecting system indicators. All states, for example, should set as a clear objective that all students graduate from high school ready for college and a career. States must then select indicators to quan-tify this goal and gauge progress, while being mindful of the actions and oppor-tunities that these measures encourage schools to prioritize.

3 Center for American Progress | Making the Grade
• States must weigh the trade-offs between simplicity and complexity to cre-
ate a tailored yet comprehensive system of accountability. States should be thoughtful in designing systems that capture a complete picture of student suc-cess and strike a balance between straightforward and nuanced accountability. Systems should be comprehensive, but states should not dilute their systems with unnecessary measures.
• States, districts, and schools should increase transparency and clarity of school
accountability and rating methodology for communities and families. States’ accountability systems align with federal requirements and state priorities, but they serve a much greater purpose than compliance. They also must clearly communicate to communities and families which measures determine a school’s performance rating in order to enable stakeholders to make informed choices and better advocate for students.
Over the next year, states should take advantage of the opportunity to improve their current accountability systems with a set of indicators that better captures student achievement and school success.

4 Center for American Progress | Making the Grade
Statewide school accountability: A brief history
Passed in 1965, the Elementary and Secondary Education Act initially awarded more than $1 billion per year to districts serving disadvantaged students.7 The 1994 reauthorization of ESEA, the Improving America’s Schools Act, or IASA, increased accountability for states and districts. IASA required states to establish reading or English language arts and mathematics standards; assess students at least once in elementary, middle, and high school against those standards; make assessment results public and break them out by student subgroup; and intervene in schools whose students were not making adequate yearly progress, or AYP.8
Alongside IASA, some states began to implement school accountability systems that not only reported student academic performance but also tied achievement to rewards and sanctions.9 In 1993, for example, Texas began to rate schools as “low-performing,” “acceptable,” “recognized,” or “exemplary.” Texas schools rated as low performing could face serious consequences, such as layoffs or closure.10
In the late 1990s, Massachusetts also designed a system of school performance and improvement ratings. Low student achievement and improvement data could desig-nate schools as “underperforming” and trigger required support and oversight from local and state education authorities.11 Conversely, schools with positive ratings could serve as exemplars of effective teaching or administration practices.12
The 2001 reauthorization of ESEA, No Child Left Behind, increased the federal role in holding states responsible for students’ academic progress. Expanding on IASA, NCLB required states to test students in reading and mathematics in third through eighth grades and once in high school and in science once in elementary school, middle school, and high school.13 The law also required states to publicly report results for all students and subgroups of students, including major racial and ethnic groups, students with disabilities, English language learners, and stu-dents from low-income families.14

5 Center for American Progress | Making the Grade
NCLB also outlined accountability provisions, requiring that all states develop and implement a single, statewide system that used sanctions and rewards to hold schools accountable for student achievement.15 As part of that system, schools were required to bring all students to proficiency in reading and math-ematics by the 2013-14 school year and set annual measurable objectives, or AMOs, as progress benchmarks. If a school failed to reach its proficiency goals for any subgroup of students, it failed to make AYP. If a school failed to make AYP for two or more years in a row, NCLB guidelines required it to take par-ticular improvement actions, including offering free tutoring or the option for students to transfer to another public school.16
In response to the law’s 100 percent proficiency goal, some states lowered their standards to avoid missing yearly targets. From 2005 to 2007, for example, 15 states lowered their benchmarks in fourth- or eighth-grade reading or mathemat-ics, and three states lowered standards in both subjects at both grade levels.17 As a result of these changes, lower state test scores qualified as proficient under NCLB, making it easier for schools to meet their proficiency targets without actually improving student achievement.18
In addition, an increasing number of schools, many of which were traditionally high performing, failed to meet the law’s requirements. In 2007, for example, 28 percent of schools failed to make AYP. By 2011, this number had risen to 38 per-cent.19 By the end of 2011, more than 50 percent of schools in several states failed to make AYP, including some states that had previously lowered their standards.20
As states and schools struggled with NCLB’s AYP requirements, parents, educa-tors, advocates, and other stakeholders called on Congress to rewrite the law. Although NCLB was due for reauthorization in 2007, Congress still had not passed a new bill by 2011. That same year, in response to state and local requests to move beyond NCLB’s rigid accountability framework, the U.S. Department of Education began to offer states waivers from NCLB’s provisions.21
Through these waivers, known as “ESEA flexibility,” states were no longer required to meet AYP. Instead, states had the opportunity to design new, more holistic sys-tems of school accountability that looked at individual student achievement and growth in at least ELA or reading and mathematics, graduation rates, and school performance and progress over time.22

6 Center for American Progress | Making the Grade
Under ESEA flexibility, states also were required to set ambitious but achievable AMOs in at least ELA or reading and mathematics. Unlike NCLB, these targets did not need to result in 100 percent proficiency, and states could determine exactly how to set their goals and targets to best support improvement for all students.23 Together, these new proficiency goals and accountability indicators would help states more accurately differentiate schools and better support those that were lowest performing than under NCLB.
When the Every Student Succeeds Act was signed into law, the Department of Education already had approved 42 states and the District of Columbia for ESEA flexibility. Using these waivers, states designed new accountability systems to varying degrees of complexity, from mirroring NCLB requirements to incorporat-ing multiple measures of student performance and school success. Eight states still operated under NCLB.24

7 Center for American Progress | Making the Grade
Statewide accountability systems
Today, statewide accountability systems across all 50 states and the District of Columbia range in sophistication and include a variety of indicators, for a total of 60 unique measures nationwide. To provide a framework for understanding all of these indicators, the authors of this report organize measures into seven main cat-egories of indicators: achievement indicators; student growth indicators; English language acquisition indicators; early warning indicators; persistence indicators; college- and career-ready indicators; and other indicators.
Each state has its own distinct system with measures from some or all of the seven categories. Some states also have put in place a state accountability system in addi-tion to their federal statewide accountability system. The authors analyzed these systems to capture fully how states hold schools accountable for student success.25 In addition, some state indicators consolidate more than one measure into an indicator. The authors reported each measure in these composite indicators as its own indicator to better show the range of measures included.
TABLE 1
Indicators across states
Note: The minimum number of indicators is four, and the maximum number of indicators is 26.
Source: Data are based on authors' analysis of ESEA �exibility waivers, state accountability workbooks, and information and materials from state departments of education.
Number of indicators Number of states
Less than 5
5 to 10
11 to 15
16 to 20
Greater than 20
3
24
15
7
2

8 Center for American Progress | Making the Grade
On average, states include a total of 11 indicators across some or all indicator categories in elementary, middle, and high school accountability systems, with a minimum of four indicators and a maximum of 26 indicators.26
The following analysis also quantifies how states weight accountability indicators to determine a school’s overall rating or grade. The weighting analysis, like the indica-tor analysis, is based on the authors’ seven-category framework such that individual category weightings within each state sum to 100 percent. Average weights of each category across states, however, do not sum to 100 percent, as they do not include data from states that do not include or weight indicators in that category.
Overall, the authors excluded 15 states from the weighting analysis for various reasons. These states do not have an Elementary and Secondary Education Act flexibility waiver or additional state system—and therefore use adequate yearly progress for accountability; do not combine their accountability indicators in a way that results in an overall score or grade; use business rules that do not trans-late to weightings; or are transitioning to a new system.
For more detail, see Appendix A.

9 Center for American Progress | Making the Grade
FIGURE 1
Achievement indicators by state
Source: Data are based on authors' analysis of ESEA �exibility waivers, state accountability workbooks, and information and materials from state departments of education.
ELA or reading Math
Writing
Social studies
Science
VT NH
MA
RI
CT
NJ
DE
MD
DC
VT NH
MA
RI
CT
NJ
DE
MD
DC
VT NH
MA
RI
CT
NJ
DE
MD
DC
VT NH
MA
RI
CT
NJ
DE
MD
DC
VT NH
MA
RI
CT
NJ
DE
MD
DC

10 Center for American Progress | Making the Grade
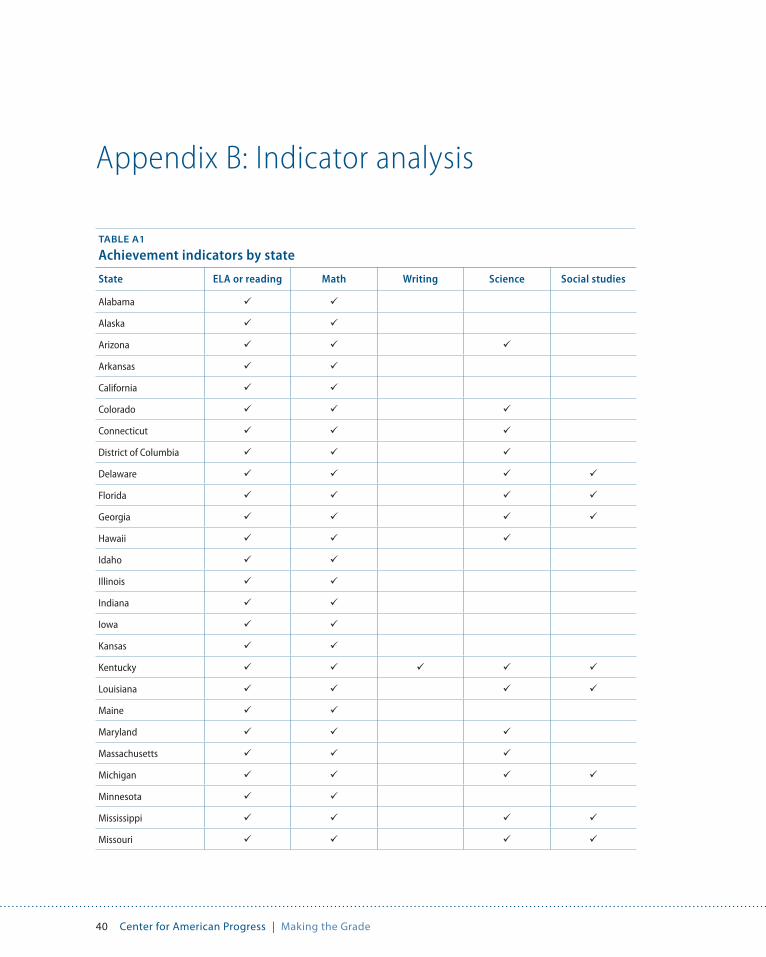
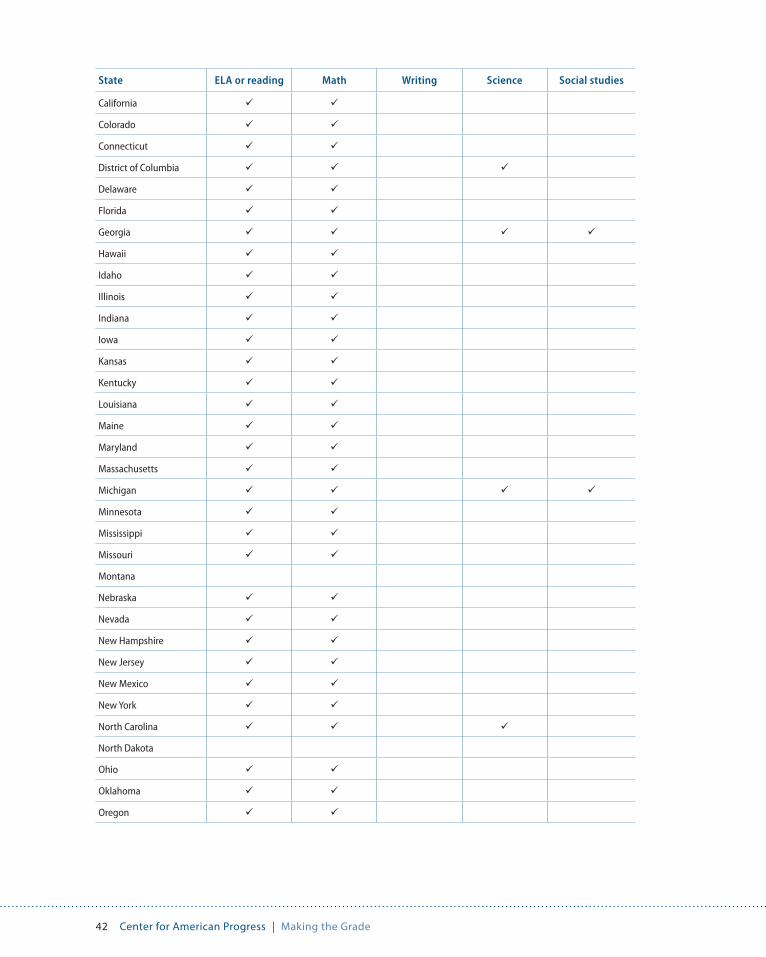
Achievement indicators
Every state measures student academic achievement in English language arts and mathematics, and 29 states include a measure of student academic achieve-ment in science, writing, or social studies. Of the states that measure additional academic subjects, 15 states measure science; two states measure science and writing; nine states measure science and social studies; and three states measure science, writing, and social studies.27
Holding schools accountable for academic achievement gives states a picture of how all students perform each year. In addition to this baseline understanding of achievement, some states also hold schools responsible for other slices of profi-ciency, such as subgroup achievement gaps and school progress. West Virginia, for example, includes in its accountability system schoolwide proficiency rates in ELA and mathematics and achievement gaps between certain subgroups—including low-income students and non-low-income students; students of color and white students; migrant and nonmigrant students; English language learners and non-English language learners; and students with and without disabilities.28 Nebraska, on the other hand, includes in its accountability system the three-year nonproficiency trend and the three-year school improvement trend, in addition to a school’s average score in reading, mathematics, writing, and science.29
To measure achievement, states rely on a variety of assessments. In the 2015-16 school year, for example, 23 states planned to participate in assessments devel-oped by two consortia of states, the Partnership for Assessment of Readiness for College and Careers and the Smarter Balanced Assessment Consortium.30 At least 25 states planned to administer state-developed assessments, such as the Kentucky Performance Rating for Educational Progress, or K-PREP, and the State of Texas Assessments of Academic Readiness, or STAAR, in multiple subjects.31 And Wyoming and Wisconsin, along with a handful of other states, are assessing high school students’ ELA and mathematics proficiency using college readiness exams such as the SAT and ACT.32
Furthermore, states rely on different statistical methods to incorporate achieve-ment data into their accountability systems. Maryland, for example, counts the percentage of students who score “proficient” or “advanced” in ELA, mathemat-ics, and science.33 This method is intuitive, easily communicating achievement to

11 Center for American Progress | Making the Grade
schools, parents, and students. However, focusing on the proficiency cut point limits the information to a label and masks student performance at both high and low achievement levels. States also may set different cut points, so a proficient student in one state may not be the same as a proficient student in another.34
South Carolina, on the other hand, uses scale scores to incorporate ELA, mathemat-ics, science, and social studies achievement into its accountability system.35 Scale scores convert a student’s raw score to a common scale—for example, 300 to 900—and in doing so, are better able to distinguish the relative performance of students at the high and low ends of the same proficiency level.36 Using this method, however, does require more context to understand what scores mean in terms of proficiency, and states using scale scores each have their own conversion table.
Of the states that weight the indicators in their accountability systems, academic achievement accounts for an average of 48 percent of a school’s accountability rating, ranging from 20 percent for elementary and middle schools and 15 percent for high schools to 100 percent for all schools. States assign greater weight to achievement in elementary and middle school systems—51 percent, on average—than high school systems—42 percent, on average.37
TABLE 2
Achievement indicators
Elementary and middle schools
Note: The minimum weighting is 20 percent, and the maximum weighting is 100 percent.
Source: Data are based on authors' analysis of ESEA �exibility waivers, state accountability workbooks, and information and materials from state departments of education.
Weighting Number of states
0% to 25%
26% to 50%
51% to 75%
76% to 100%
4
19
9
4

12 Center for American Progress | Making the Grade
FIGURE 2
Student growth indicators by state
Source: Data are based on authors' analysis of ESEA �exibility waivers, state accountability workbooks, and information and materials from state departments of education.
Math
Writing
Social studies
Science
ELA or readingVT NH
MA
RI
CT
NJ
DE
MD
DC
VT NH
MA
RI
CT
NJ
DE
MD
DC
VT NH
MA
RI
CT
NJ
DE
MD
DC
VT NH
MA
RI
CT
NJ
DE
MD
DC
VT NH
MA
RI
CT
DE
MD
DC
NJ

13 Center for American Progress | Making the Grade
Student growth indicators
Compared with academic achievement, which provides a snapshot of student pro-ficiency each year, student growth indicators capture the difference in individual student proficiency between two points in time to assess student progress from year to year. Growth measurements enable schools to better understand student performance by identifying students who have improved but are not yet proficient and those who have progressed to meet proficiency but are not yet advanced.
Forty-six states measure growth in ELA and mathematics, and seven states also measure growth in science or science and social studies.38 Definitions of growth vary by state, such as the percentage of students making one year’s growth or the percentage of students who are on track to be on grade level within three years.39 Some states, in addition to measuring growth for all students, include measures that capture the growth of historically disadvantaged subgroups.40
Like academic achievement, states use different methods to incorporate growth into their accountability systems. The state of Washington, for example, uses student growth percentiles, or SGPs. SGPs measure the amount of growth a student makes in a subject relative to his or her peers, which include students in the same grade who had similar scores in that subject the previous year. A student with an SGP of 85, for example, has shown more growth than 85 percent of his or her academic peers. The state also calculates a median SGP to summarize growth for districts and schools.41
Colorado, on the other hand, uses adequate growth percentiles, or AGPs. AGPs build on the basics of SGPs to determine if a student has made sufficient growth. In other words, AGPs measure the growth percentile needed for a student to catch up to or to maintain proficiency in a subject. Colorado calculates the AGP for every student and also aggregates the percentiles to create a median AGP, which is the growth needed for a typical student in a school or district, on average, to reach or to maintain proficiency.42
Rather than percentiles, Florida uses what it calls “learning gains” to measure stu-dent growth from one year to the next in ELA and mathematics for all students, as well as the lowest-performing 25 percent of students. Students can demonstrate learning gains in four different ways: increasing at least one achievement level, which categorizes a student’s level of proficiency based on cut scores; improving performance within Achievement Level 1 or Achievement Level 2; remaining at Achievement Level 3 or 4 and increasing their scale score; or maintaining the highest achievement level—Achievement Level 5.43

14 Center for American Progress | Making the Grade
Lastly, states such as Pennsylvania and Tennessee use value-added models to mea-sure a district or school’s impact on academic progress.44 Typically, value-added measures determine the amount of growth expected for a classroom and calculate the amount of growth that the class actually makes. The difference between these two measures is the “value” that the school added. In addition to student test scores, value-added models often include student and teacher characteristics, such as student demographics.45
Of the states that measure student growth, 32 states weight student growth for elementary and middle schools and 25 states weight student growth for high schools.46 Overall, these states assign greater weight to growth in elementary and middle school accountability systems—45 percent, on average, with a minimum of 20 percent and a maximum of 75 percent—compared with high school sys-tems—30 percent, on average, with a minimum of 10 percent and a maximum of 50 percent.47 Some states—such as Delaware, Minnesota, and Oregon—weight growth more heavily than academic achievement.48
TABLE 3
Achievement indicators
High schools
Note: The minimum weighting is 15 percent, and the maximum weighting is 100 percent.
Source: Data are based on authors' analysis of ESEA �exibility waivers, state accountability workbooks, and information and materials from state departments of education.
Weighting Number of states
0% to 25%
26% to 50%
51% to 75%
76% to 100%
8
20
5
3

15 Center for American Progress | Making the Grade
Together, academic achievement and student growth make up a combined aver-age of 91 percent of elementary and middle school ratings—with a minimum of 71 percent and maximum of 100 percent—and an average of 63 percent of high school ratings—with a minimum of 40 percent and a maximum of 100 percent.49
TABLE 4
Student growth indicators
Elementary and middle schools
Note: The minimum weighting is 20 percent, and the maximum weighting is 75 percent.
Source: Data are based on authors' analysis of ESEA �exibility waivers, state accountability workbooks, and information and materials from state departments of education.
Weighting Number of states
0% to 25%
26% to 50%
51% to 75%
76% to 100%
4
17
11
0
TABLE 5
Student growth indicators
High schools
Note: The minimum weighting is 10 percent, and the maximum weighting is 50 percent.
Source: Data are based on authors' analysis of ESEA �exibility waivers, state accountability workbooks, and information and materials from state departments of education.
Weighting Number of states
0% to 25%
26% to 50%
51% to 75%
76% to 100%
10
15
0
0

16 Center for American Progress | Making the Grade
TABLE 6
Combined achievement and student growth indicators
Elementary and middle schools
Note: The minimum weighting is 71 percent, and the maximum weighting is 100 percent.
Source: Data are based on authors' analysis of ESEA �exibility waivers, state accountability workbooks, and information and materials from state departments of education.
Weighting Number of states
0% to 25%
26% to 50%
51% to 75%
76% to 100%
0
0
3
33

17 Center for American Progress | Making the Grade
English language acquisition indicators
Under No Child Left Behind, states were responsible for improving English learners’ language proficiency in addition to their academic achievement. NCLB, however, treated language acquisition differently than subject area achievement, which required states to set up a separate accountability system that only applied to districts, not schools.50
Through ESEA flexibility, six states—Arizona, Colorado, Georgia, Illinois, Massachusetts, and Texas—incorporated a measure of English language profi-ciency or growth into their statewide accountability systems.51 Under the Every Student Succeeds Act, all states will be required to include a measure of prog-ress in achieving English language proficiency as a specific indicator in statewide accountability systems.
FIGURE 3
English language acquisition indicators by state
Source: Data are based on authors' analysis of ESEA �exibility waivers, state accountability workbooks, and information and materials from state departments of education.
VT NH
MA
RI
CT
NJ
DE
MD
DC
18 Center for American Progress | Making the Grade
Like achievement and growth, states that currently include English language acquisition in accountability use different measures to incorporate this indicator. Arizona, for example, includes in its system the English language learner reclassifi-cation rate on the Arizona English Language Learner Assessment, or AZELLA.52 Georgia, on the other hand, measures the percentage of English language learn-ers who have improved to a higher state-determined performance band on the Assessing Comprehension and Communication in English State-to-State for English Language Learners exam, or ACCESS for ELLs.53 And Illinois assesses English language proficiency by the percentage of students achieving a half score increase or a maximum score on the ACCESS for ELLs.54
On average, states that measure English language acquisition weight this indica-tor as 7 percent of elementary and middle school systems and 6 percent of high school systems.55 Illinois and Colorado give the most weight to language profi-ciency, with an average of 13 percent and 6 percent across all schools, respectively. Massachusetts schools, through extra credit points, and Georgia elementary and middle schools weight language proficiency, on average, as 3 percent of a school’s total possible rating. Georgia high schools earn bonus points for improving stu-dents’ English language skills.
19 Center for American Progress | Making the Grade
Early warning indicators
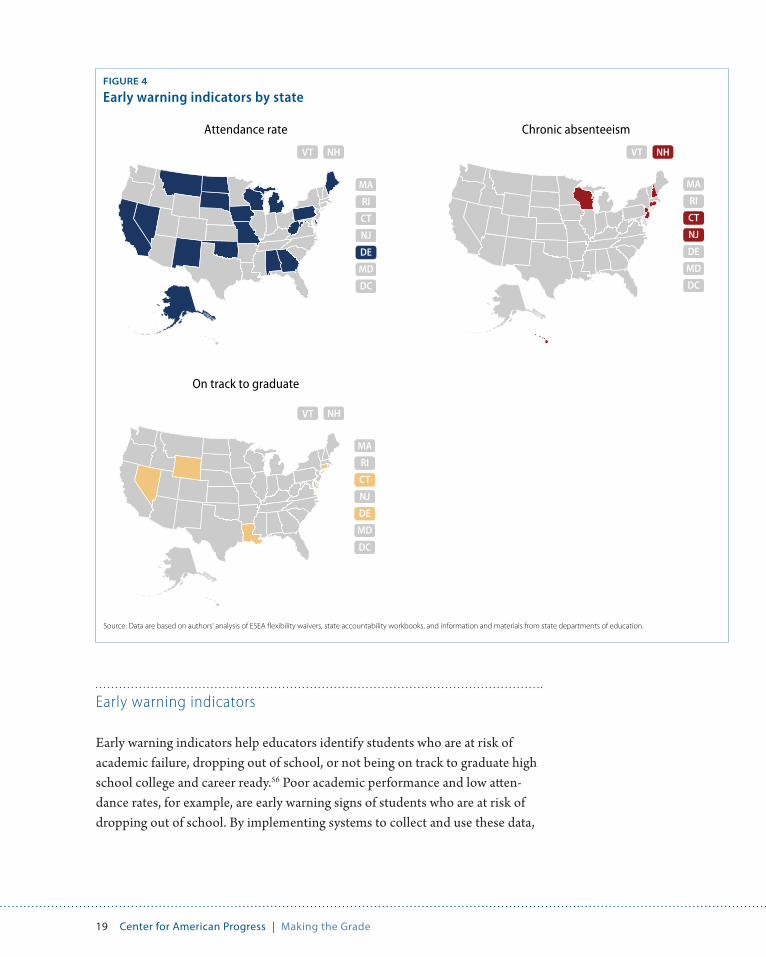
Early warning indicators help educators identify students who are at risk of academic failure, dropping out of school, or not being on track to graduate high school college and career ready.56 Poor academic performance and low atten-dance rates, for example, are early warning signs of students who are at risk of dropping out of school. By implementing systems to collect and use these data,
FIGURE 4
Early warning indicators by state
Source: Data are based on authors' analysis of ESEA �exibility waivers, state accountability workbooks, and information and materials from state departments of education.
On track to graduate
Attendance rate Chronic absenteeism
VT NH
MA
RI
CT
NJ
DE
MD
DC
VT NH
MA
RI
CT
NJ
DE
MD
DC
VT NH
MA
RI
CT
NJ
DE
MD
DC

20 Center for American Progress | Making the Grade
educators can better identify these students and provide appropriate supports and interventions.57 Aggregating early warning system data at the school level also allows school and district leaders to identify areas for school improvement and develop turnaround strategies.58
Under NCLB, states were required to include academic achievement in English language arts and mathematics in their accountability systems. States also were required to include in their systems an additional academic indicator for elemen-tary and middle schools; for high schools, states were required to include the graduation rate. States commonly relied on attendance, or the percentage of stu-dents who come to school each day, as their additional academic indicator.59
As an early warning indicator, however, average daily attendance masks what schools want to prevent—chronic absence—by focusing on the number of students who attend school on a given day rather than on those students who persistently fail to show up and are most at risk of struggling academically.60 Accordingly, some states with ESEA waivers opted to include other or additional early warning indicators in their accountability systems, such as chronic absenteeism.
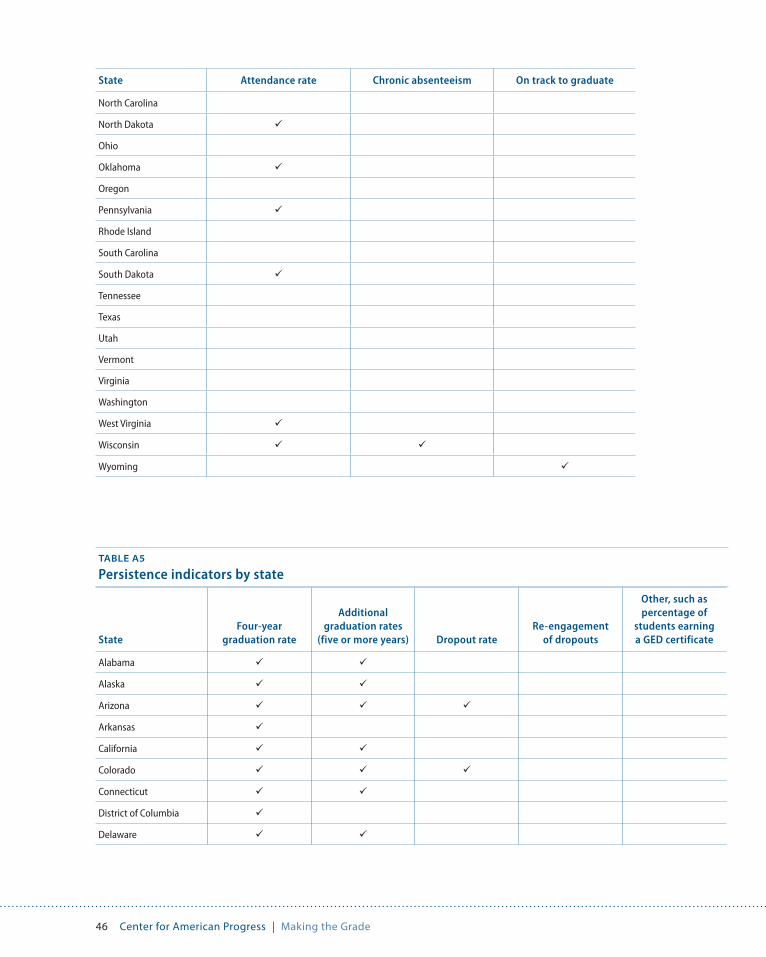
Overall, 24 states include at least one early warning indicator in their systems. Of these 24 states, 18 states measure attendance rates, and five states measure chronic absenteeism, with one state measuring both.61 Additionally, some states, such as Connecticut and Louisiana, incorporate an indicator that measures whether a ninth-grade student is on track to graduate.62
Of states measuring and weighting these indicators, early warning indicators make up an average of 11 percent of elementary and middle school ratings, with a minimum of 2 percent and maximum of 25 percent. For high schools, these indi-cators make up an average of 7 percent of ratings, with a minimum of 1 percent and a maximum of 14 percent.63

21 Center for American Progress | Making the Grade
FIGURE 5
Persistence indicators by state
Source: Data are based on authors' analysis of ESEA �exibility waivers, state accountability workbooks, and information and materials from state departments of education.
Four-year graduation rate Additional graduation rates (five or more years)
Dropout rate Re-engagement of dropouts
Other
VT NH
MA
RI
CT
NJ
DE
MD
DC
VT NH
MA
RI
CT
NJ
DE
MD
DC
VT NH
MA
RI
CT
NJ
DE
MD
DC
MA
RI
CT
NJ
DE
VT NH
MD
DC
VT NH
MA
RI
CT
DE
MD
DC
NJ
22 Center for American Progress | Making the Grade
Persistence indicators
NCLB required states to measure and set targets for graduation rates in determin-ing AYP. Most states measured the four-year adjusted cohort graduation rate, and through ESEA flexibility, many states also incorporated extended graduation rates—such as five-, six-, or even seven-year rates—to better reflect the success of all students and subgroups.64
Accordingly, persistence indicators include the four-year cohort graduation rate and the extended cohort graduation rates. All states but one include the four-year graduation rate, and 37 states capture at least one extended-year cohort graduate rate, including the state that does not include the four-year rate, Washington. In addition, some states include in their accountability systems closing graduation gaps between target groups of students.65
Graduation rates are the standard measure of student persistence and high school success, while dropout rates are an annual measure of the percentage of students who drop out of school in a given year. As a result, while the cohort graduation rate captures whether students ultimately succeed in graduating high school, the dropout rate can provide a more real-time measure of student persistence. Eleven states measure dropout rates, and Massachusetts and Texas also capture the rate at which schools re-engage dropouts.66 Some states incorporate both dropout and graduation rates into their systems, while other states include the annual dropout rate when graduation rate data are unavailable.67
Further, five states incorporate other measures of persistence into accountability, including the percentage of students graduating from a particular program or with a GED certificate.68 Texas, for example, includes a graduation plan component, which captures the annual percentage of graduates who have graduated through a regular or a distinguished achievement program.69 Virginia incorporates into its graduation index students who earn a GED certificate or certificate of comple-tion.70 And South Dakota includes a completer rate, which captures the percent-age of students who have attained a diploma or GED certificate.71
Overall, of states measuring and weighting these indicators, persistence indicators account for an average of 22 percent of high school accountability scores, with a minimum of 2 percent and a maximum of 50 percent.72 Some systems, such as the District of Columbia’s, do not factor graduation rates into a school’s score but
23 Center for American Progress | Making the Grade
rather use this indicator separately to identify high-performing schools or those in need of improvement.73 Of elementary and middle school systems that include persistence indicators—such as retention, promotion, or dropout rates—these measures account for an average of 3 percent of a school’s total score.74

24 Center for American Progress | Making the Grade
FIGURE 6
College- and career-ready indicators by state
Source: Data are based on authors' analysis of ESEA �exibility waivers, state accountability workbooks, and information and materials from state departments of education.
Participation in or performance on advanced course work or exams
Participation in or performance oncollege entry exams
Career preparedness participation or performance Postsecondary enrollment
Other advanced coursework indicators Other college- and career-ready indicators
VT NH
MA
RI
CT
NJ
DE
MD
DC
VT NH
MA
RI
CT
NJ
DE
MD
DC
VT NH
MA
RI
CT
NJ
DE
MD
DC
VT NH
MA
RI
CT
NJ
DE
MD
DC
VT NH
MA
RI
CT
NJ
DE
MD
DC
VT NH
MA
RI
CT
DE
MD
DC
NJ

25 Center for American Progress | Making the Grade
College- and career-ready indicators
The ultimate goal of the K-12 education system is not only to ensure that all students graduate from high school but also that they are college and career ready. Academic achievement and growth, early warning indicators, and measures of persistence are necessary to get students to the finish line but do not fully capture whether students are prepared for success after high school.
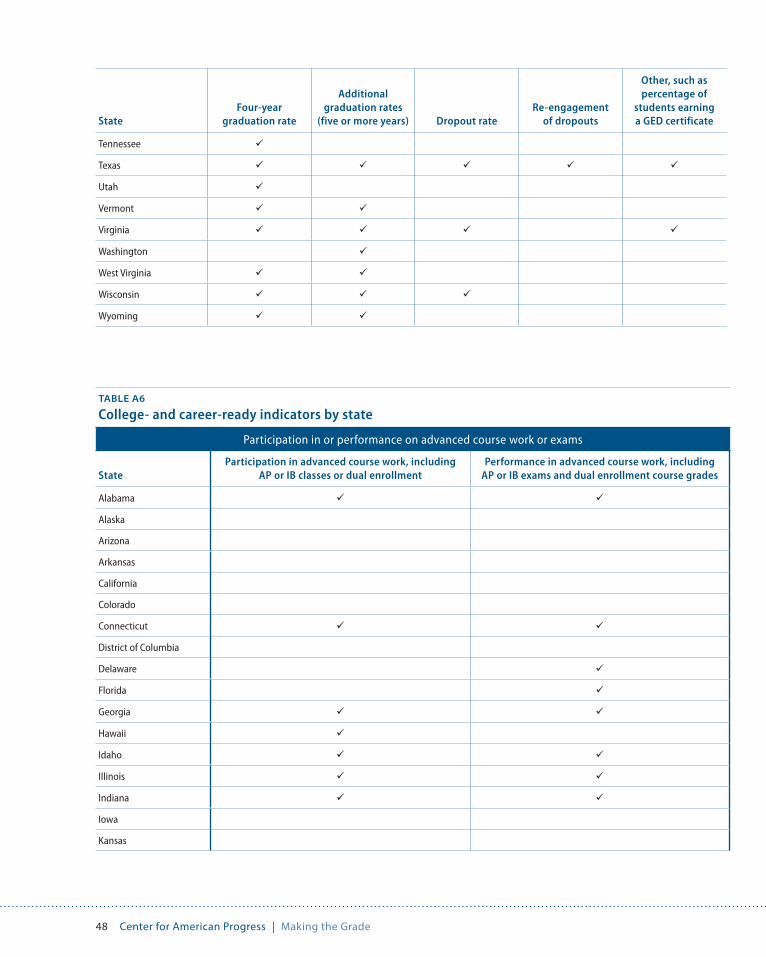
Accordingly, 30 states include some measure of college and career readiness in their accountability systems. College- and career-ready indicators include par-ticipation and performance in advanced course work or exams and college entry exams; participation in career and technical education courses and earning career readiness certificates; postsecondary enrollment; and participation of middle school students in high-school-level courses.75
Utah, for example, includes one college- and career-ready measure, while other states, such as New Mexico and Nevada, capture multiple measures of col-lege and career readiness, from taking the PSAT to the percentage of students required to take remedial course work in college.76 Other indicators include the percentage of students who receive advanced or honors diplomas and the per-centage of graduates who join the armed forces.77
Notably, the specific measures that states include as college- and career-ready indicators can create very different incentives. Participation in advanced place-ment, or AP, classes and performance on AP exams, for example, are discrete measures that may have different implications. The former motivates schools to expand access to advanced course work, at the risk of ignoring whether stu-dents actually succeed in those courses. The latter motivates schools to improve results, while creating the potential incentive to exclude students from advanced courses who may not perform well.
Accordingly, accountability systems that include both of these measures as indi-cators ensure that schools are held responsible for both student participation and attainment in advanced course work. Some states that include performance on the SAT or ACT in high school accountability systems fund all students to take these exams to ensure participation.78

26 Center for American Progress | Making the Grade
Overall, of states measuring and weighting these indicators, college- and career-ready indicators average 15 percent of high school accountability scores, with a minimum of 3 percent and a maximum of 30 percent. Of middle school systems that include these measures, college- and career-ready indicators average 11 per-cent of school scores.79
27 Center for American Progress | Making the Grade
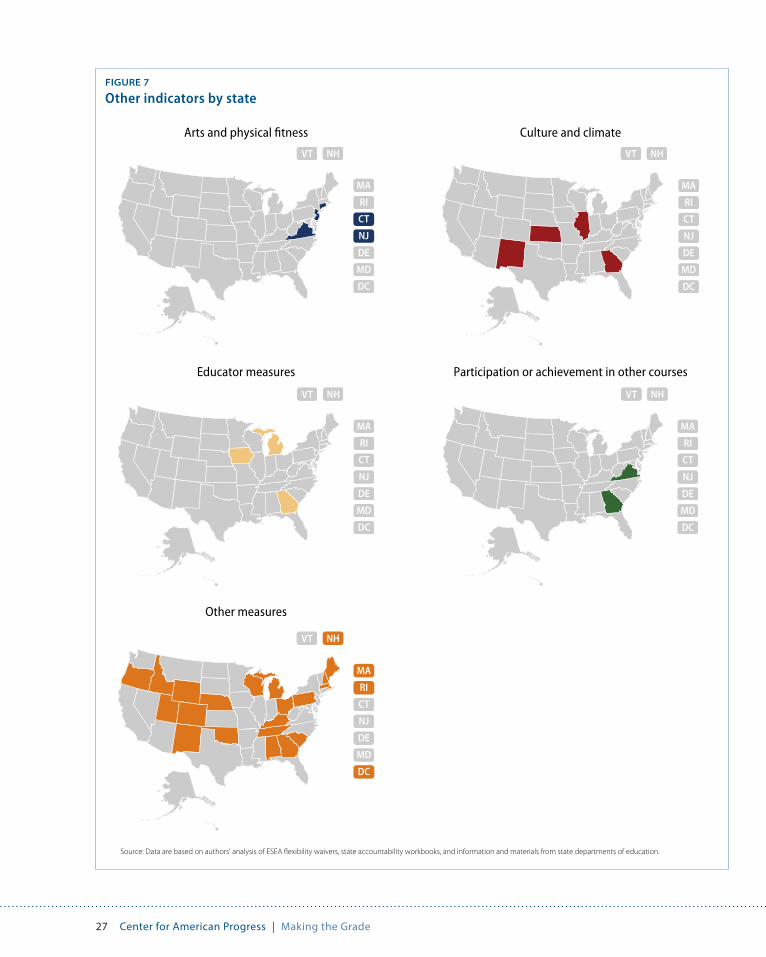
FIGURE 7
Other indicators by state
Source: Data are based on authors' analysis of ESEA �exibility waivers, state accountability workbooks, and information and materials from state departments of education.
Arts and physical fitness Culture and climate
Educator measures
Other measures
Participation or achievement in other courses
VT NH
MA
RI
CT
NJ
DE
MD
DC
VT NH
MA
RI
CT
NJ
DE
MD
DC
VT NH
MA
RI
CT
NJ
DE
MD
DC
VT NH
MA
RI
CT
DE
MD
DC
NJ
VT NH
MA
RI
CT
NJ
DE
MD
DC

28 Center for American Progress | Making the Grade
Other indicators
Lastly, 27 states include other indicators, or measures that are unique to individual states or outside the scope of the main categories of indicators. Other indicators may reflect particular state values or incentives for particular school activities. Accordingly, this category captures measures ranging from arts access and physical fitness to students earning credit in courses such as world languages and physics.80
Virginia, for example, includes additional criteria in its Virginia Index of Performance, or VIP, program. Schools in the commonwealth may earn VIP points for offering foreign language instruction in elementary grades and for stu-dents who participate in advanced science, technology, engineering, and mathe-matics course work, among other measures. Schools meeting particular VIP point thresholds earn awards from the governor or the Virginia Board of Education.81
Ohio includes an indicator for improving K-3 literacy.82 Georgia awards additional points to schools based on what it terms “exceeding the bar” indicators, which include measures such as the percentage of teachers using the state’s longitudinal data system, the percentage of graduates earning three or more high school credits in the same world language, and the percentage of middle school or elementary school students with disabilities served in general education classes for more than 80 percent of the school day.83 And Iowa factors staff retention into school ratings.84
In addition, several states include a measure of school climate and culture in their accountability systems. Illinois, for example, awards bonus points to schools that have received an “excellent” school rating for fostering a positive learning environ-ment.85 New Mexico incorporates in its school ratings results from an opportunity-to-learn student survey, which measures how well teachers’ instructional methods facilitate student learning.86 And Georgia schools may earn additional points for school programming aimed at improving the school climate, such as conflict media-tion, mentoring, and positive behavioral interventions and supports.87
A group of nine districts in California, known as the California Office to Reform Education, or CORE, have taken this work a step further.88 In addition to incorpo-rating student, staff, and parent culture-climate survey results into accountability, CORE districts include measures of students’ social-emotional skills, which are increasingly recognized as important for student success.89 To capture these skills,

29 Center for American Progress | Making the Grade
students self-report on a series of behaviors and beliefs based on four competencies: growth mindset, or a student’s belief that his or her “abilities can grow with effort”; self-efficacy, or a student’s belief in his or her ability to meet a goal; self-manage-ment, or a student’s ability to control his or her emotions; and social awareness.90
In addition, NCLB required that schools test at least 95 percent of all students and subgroups of students in the required grades and academic subjects.91 Through ESEA flexibility, some states chose to limit or reduce the overall rating or classifi-cation of schools that miss this threshold. Oklahoma, for example, docks schools a whole letter grade if fewer than 95 percent of students have valid scores.92 Rhode Island, similarly, classifies schools that fail to test at least 95 percent of all students as “Warning Schools”—the third lowest of six classifications—at best.93 South Carolina, on the other hand, includes meeting participation requirements as a percentage of a school’s index score.94 ESSA continues to require that schools annually measure the achievement of at least 95 percent of all students and each subgroup of students as a stand-alone factor in statewide accountability.95
Of the states measuring and weighting these measures, other indicators make up an average of 10 percent of elementary and middle school accountability scores—with a minimum of 5 percent and maximum of 23 percent—and an average of 12 percent of high school scores—with a minimum of 6 percent and maximum of 23 percent.96 For CORE districts, other indicators account for 24 percent of school accountability.97

30 Center for American Progress | Making the Grade
Next steps for statewide accountability
Going forward, states will need to revamp their current accountability systems to comply with the requirements of the Every Student Succeeds Act.
Currently, all states measure achievement in mathematics and reading, and all but five states measure growth in those subjects. For high schools, nearly all states include the four-year adjusted cohort graduation rate, and almost three-quarters of states include an extended cohort graduation rate in rating school performance. The majority of states, however, will need to incorporate a measure of English lan-guage acquisition into their statewide accountability systems. Furthermore, some states that already include this measure, such as Massachusetts and Georgia, may have to revise their methodology to afford English language acquisition “substan-tial weight” in school determinations.99
ESSA requires states to incorporate the following measures into their accountability systems:
• Student achievement in English language arts and mathematics
• A second academic indicator, such as growth in ELA and mathematics
• English language acquisition
• Graduation rates, which take the place of a second academic indicator for high schools
• At least one measure of school quality or student success
States are required to disaggregate all indicators, excluding English language acquisition, by the follow-
ing subgroups of students: economically disadvantaged students; students from major racial and ethnic
groups; students with disabilities; and English language learners. ESSA further requires states to give
“substantial weight” to the first four indicators above and “much greater weight” to the combination of
those indicators compared with the measures of school quality or student success.98

31 Center for American Progress | Making the Grade
When it comes to satisfying the most novel component of ESSA—the school quality or student success indicator—states can measure student engagement, educator engagement, student access to and completion of advanced course work, postsecondary readiness, school climate and safety, or any other measure that the state chooses as long as the measure allows for meaningful differentiation among schools and is valid, reliable, comparable, and statewide.100 At present, 42 states include in their accountability systems at least one early warning indicator, persis-tence indicator other than graduation rates, college- and career-ready indicator, or other indicator—excluding test participation—that might fulfill ESSA criteria.101
However, not all of the states that include a school quality or student success indicator in their accountability systems do so for all schools. For example, 14 states incorporate a measure that might meet these criteria only in their high school accountability systems.102
Furthermore, under ESSA, the school quality or student success indicator must receive substantially less weight than academic achievement, a second academic indicator, English language proficiency, and graduation rates combined.103 Currently, of states that weight their systems and include at least one school qual-ity or student success measure, these indicators average 16 percent of elementary and middle school scores and 21 percent of high school scores.104
In addition to outlining the indicators that states must include in their accountability systems, ESSA also requires that states disaggregate indicators by subgroup. Under No Child Left Behind, states were required to disaggregate academic achievement, graduation rate, and the other academic indicator for elementary and middle schools by several subgroups of students: economically disadvantaged students; students from major racial and ethnic groups; students with disabilities; and English language learners.105 Under ESSA, states will have to disaggregate all indicators by these same subgroups, excluding indicators of English language acquisition.106
Meeting this requirement necessitates that states re-evaluate their current systems to ensure that every indicator can be disaggregated. It also requires that states select new indicators—such as the school quality or student success mea-sure—that they can measure by subgroup. Disaggregating data by subgroup also increases complexity and data collection costs, which also will factor into state decisions that determine which indicators to incorporate.
32 Center for American Progress | Making the Grade
Recommendations
In August 2016, states will transition from No Child Left Behind and Elementary and Secondary Education Act flexibility to the Every Student Succeeds Act. States will have an additional year to implement their new accountability systems, which must be in place by the 2017-18 school year.107 As states plan for this transition, CAP recommends that they take the following steps.
Set a vision for accountability systems and be purposeful about incentives when selecting system indicators
States must first create a vision for their accountability systems and then choose the indicators that align with their goals. All states, for example, should set as a clear objective that all students graduate from high school ready for college and a career. But within this broad objective, states may have different specific targets based on the challenges and struggles of schools on the ground. Perhaps a state wants to increase its college-going rate, boost graduation rates, or improve student engagement; by setting a clear aim, states will be better able to design systems that meet particular needs.
When choosing indicators, states must be purposeful about the incentives they create. For example, by selecting particular college- and career-ready measures, states may incentivize participation in advanced course work; performance on AP or International Baccalaureate, or IB, exams; or both. Similarly, by holding schools accountable for subjects other than English language arts and mathemat-ics, states encourage schools to prioritize content areas such as science and social studies. In addition, by measuring student growth, states are recognizing schools’ success when it comes to helping students improve, rather than simply focusing on student proficiency.

33 Center for American Progress | Making the Grade
Weigh the trade-offs between simplicity and complexity to create a tailored yet comprehensive system of accountability
ESSA outlines the minimum requirements that states must include in their accountability systems, while ensuring that academic achievement is not masked. This, however, does not mean that states should just tinker around the edges for compliance. Instead, states should be thoughtful in designing systems based on a clear vision that capture a complete picture of student success while maintaining clarity for stakeholders. While a system that includes dozens of indicators might send the signal that all of these indicators are important to the state, it also makes it nearly impossible for school leaders to know where to focus and difficult for parents to understand why their child’s school received a particular rating.
To accomplish this goal, states must weigh trade-offs between simplicity and complexity. School accountability should be comprehensive, but states should not dilute their systems with unnecessary measures. Instead, states should select the fewest number of indicators needed to provide the most impactful outcomes and yield measures that paint an accurate and clearly discernible picture of whether schools have achieved their system’s objective.
States also face trade-offs between simplicity and complexity when choosing how to measure system indicators. Value-added models, for example, may more accurately reflect student growth than other methods but are also more difficult for stakeholders to understand. States must weigh the pros and cons to strike a balance between straightforward and nuanced accountability.
Increase transparency and clarity of school accountability and rating methodology for communities and families
States design accountability systems to comply with federal requirements and their own priorities. Accountability systems, however, are much more than just government tools. Accountability systems also must speak to communities and families to communicate clearly which measures determine a school’s perfor-mance rating. Clear and transparent accountability will allow parents to make more informed choices and better advocate for students.

34 Center for American Progress | Making the Grade
Accordingly, states and districts should provide all stakeholders clear guidance that explains which indicators states include in accountability systems and how states use these systems to calculate school scores. Stakeholders also must have access to information on how states use these systems to intervene in schools. The purpose of school accountability is to identify struggling schools and provide them with additional supports. It is not enough for stakeholders to understand how a school is scored; they also must know what measures produced that score, the purpose of those measures, and how the score will be used.
35 Center for American Progress | Making the Grade
Conclusion
Many states are on the right track to meet the accountability requirements of the Every Student Succeeds Act, capturing measures of academic proficiency and student growth, early warning indicators, persistence indicators, measures of college and career readiness, and other measures of student performance. The majority of states, however, will need to incorporate a measure of English language acquisition into their accountability systems and ensure that subgroup performance is considered for all indicators in order to comply fully with the law. In addition, many states have the opportunity to include new indicators of school quality and student success in their systems to move beyond exclusively test-score-based measures of achievement.
However, designing accountability systems is just the first step. States must use these systems to effectively differentiate schools and provide proper supports for those that are struggling. Statewide accountability is a resource to help states know where and how to intervene effectively in schools. As states develop their new systems, it is critical that they stay focused on their ultimate objective: ensuring that all students succeed.

36 Center for American Progress | Making the Grade
About the authors
Carmel Martin is the Executive Vice President for Policy at the Center for American Progress. She manages policy across issue areas and is a key member of CAP’s Executive team. Before joining CAP, Martin was the assistant secretary for planning, evaluation, and policy development at the Department of Education. In this position, she led the department’s policy and budget development activities and served as a senior advisor to then-Secretary of Education Arne Duncan.
Martin has appeared on PBS, NBC, CNN, and Fox. She has been cited in publica-tions including The New York Times and The Washington Post. She also was named one of the five women who shape education policy by the National Journal in 2014 and has testified as an expert witness in front of legislative committees.
She is a graduate of the University of Texas School of Law and holds a master’s degree in public affairs from the Lyndon B. Johnson School of Public Affairs.
Scott Sargrad is the Managing Director of the K-12 Education Policy team at the Center. Prior to joining CAP, Sargrad served as the deputy assistant secretary for policy and strategic initiatives in the Office of Elementary and Secondary Education at the Department of Education, where he had the primary respon-sibility for key K-12 education programs and initiatives, including the Title I program, Elementary and Secondary Education Act flexibility, and School Improvement Grants. He joined the department in 2009 as a presidential management fellow in the National Institute on Disability and Rehabilitation Research and also worked as a senior policy advisor in the Office of Planning, Evaluation and Policy Development.
Sargrad received his undergraduate degree in mathematics with a minor in phi-losophy from Haverford College and a master’s degree in education policy and management from the Harvard Graduate School of Education.
Samantha Batel is a Policy Analyst with the K-12 Education team at the Center. Her work focuses on school standards, school and district accountability, and school improvement. Prior to joining CAP, Batel was a confidential assistant at the Department of Education in the Office of Elementary and Secondary Education and a fellow at the American Constitution Society for Law and Policy.
She graduated with a bachelor’s degree from the Woodrow Wilson School of Public and International Affairs at Princeton University.

37 Center for American Progress | Making the Grade
Acknowledgments
The authors wish to acknowledge those at the Center for American Progress behind this project’s skillful editing and artwork, including Carl Chancellor, Meghan Miller, Meredith Lukow, Pete Morelewicz, Erin Whalen, and Andrew Lomax.

38 Center for American Progress | Making the Grade
Appendix A: Methodology
CAP analyzed the federal statewide accountability systems of all 50 states and the District of Columbia using approved Elementary and Secondary Education Act waivers and state accountability workbooks. The authors supplemented their analysis with publicly available information from state departments of education, including technical manuals and school letter-grade calculation appendices. The authors also reached out to state contacts to review the analysis, some of whom confirmed data or provided updated information.
The authors conducted their analysis in two phases: an indicator analysis and a weighting analysis. The indicator analysis includes all indicators used in school ratings, such as A–F grades and school classifications, and identification of schools for rewards or interventions. The analysis excludes measures used only for reporting purposes. Some states use different or additional indicators for subsets of schools, such as K-2 schools, small schools, or alternative and special needs schools. These measures also are excluded from the analysis.
To complete the indicator analysis, the authors recorded all unique measures in each of the seven indicator categories. For example, some states include the per-centage of students earning a particular score on reading and mathematics exams as a separate indicator in their accountability systems. The authors did not record meeting state benchmarks on these exams as a unique indicator, as it is simply a different way of examining achievement data. In addition, some state systems con-solidate multiple measures into an indicator. The authors reported each measure in these composite indicators as its own indicator. Accordingly, the analysis may reflect fewer or more indicators than how a state describes its system.
For the second phase of the analysis, the authors determined the weights that states assign to each of the indicator categories to determine a school’s score. Fifteen states were excluded from this analysis. The authors calculated weight-ings based on total points or percentage points a school can earn or the relative weights of each indicator. The weightings of the seven categories of indicators sum to 100 percent for each state.

39 Center for American Progress | Making the Grade
The authors assigned the weighting of nonunique measures that were excluded from the indicator analysis to the corresponding indicator category for the weighting analysis. For example, while the authors excluded meeting state benchmarks on reading and mathematics exams from the indicator analysis, they included the weight assigned to this measure in the weighting of the state’s achievement indicators category.
Also of note, the student growth indicators category is based on individual student growth between two points in time. Accordingly, some measures labeled as “growth” or “progress” in a state’s accountability system in fact measure the performance of different cohorts of students from year to year. The authors added the weight that states assigned to these indicators to the weighting of the achieve-ment indicators category.
40 Center for American Progress | Making the Grade
Appendix B: Indicator analysis
State ELA or reading Math Writing Science Social studies
Alabama
Alaska
Arizona
Arkansas
California
Colorado
Connecticut
District of Columbia
Delaware
Florida
Georgia
Hawaii
Idaho
Illinois
Indiana
Iowa
Kansas
Kentucky
Louisiana
Maine
Maryland
Massachusetts
Michigan
Minnesota
Mississippi
Missouri
TABLE A1
Achievement indicators by state

41 Center for American Progress | Making the Grade
State ELA or reading Math Writing Science Social studies
Montana
Nebraska
Nevada
New Hampshire
New Jersey
New Mexico
New York
North Carolina
North Dakota
Ohio
Oklahoma
Oregon
Pennsylvania
Rhode Island
South Carolina
South Dakota
Tennessee
Texas
Utah
Vermont
Virginia
Washington
West Virginia
Wisconsin
Wyoming
TABLE A2
Student growth indicators by state
State ELA or reading Math Writing Science Social studies
Alabama
Alaska
Arizona
Arkansas
42 Center for American Progress | Making the Grade
State ELA or reading Math Writing Science Social studies
California
Colorado
Connecticut
District of Columbia
Delaware
Florida
Georgia
Hawaii
Idaho
Illinois
Indiana
Iowa
Kansas
Kentucky
Louisiana
Maine
Maryland
Massachusetts
Michigan
Minnesota
Mississippi
Missouri
Montana
Nebraska
Nevada
New Hampshire
New Jersey
New Mexico
New York
North Carolina
North Dakota
Ohio
Oklahoma
Oregon

43 Center for American Progress | Making the Grade
State ELA or reading Math Writing Science Social studies
Pennsylvania
Rhode Island
South Carolina
South Dakota
Tennessee
Texas
Utah
Vermont
Virginia
Washington
West Virginia
Wisconsin
Wyoming
TABLE A3
English language acquisition indicators by state
State English language acquisition
Alabama
Alaska
Arizona
Arkansas
California
Colorado
Connecticut
District of Columbia
Delaware
Florida
Georgia
Hawaii
Idaho
Illinois
Indiana
Iowa
Kansas

44 Center for American Progress | Making the Grade
State English language acquisition
Kentucky
Louisiana
Maine
Maryland
Massachusetts
Michigan
Minnesota
Mississippi
Missouri
Montana
Nebraska
Nevada
New Hampshire
New Jersey
New Mexico
New York
North Carolina
North Dakota
Ohio
Oklahoma
Oregon
Pennsylvania
Rhode Island
South Carolina
South Dakota
Tennessee
Texas
Utah
Vermont
Virginia
Washington
West Virginia
Wisconsin
Wyoming

45 Center for American Progress | Making the Grade
TABLE A4
Early warning indicators by state
State Attendance rate Chronic absenteeism On track to graduate
Alabama
Alaska
Arizona
Arkansas
California
Colorado
Connecticut
District of Columbia
Delaware
Florida
Georgia
Hawaii
Idaho
Illinois
Indiana
Iowa
Kansas
Kentucky
Louisiana
Maine
Maryland
Massachusetts
Michigan
Minnesota
Mississippi
Missouri
Montana
Nebraska
Nevada
New Hampshire
New Jersey
New Mexico
New York
46 Center for American Progress | Making the Grade
State Attendance rate Chronic absenteeism On track to graduate
North Carolina
North Dakota
Ohio
Oklahoma
Oregon
Pennsylvania
Rhode Island
South Carolina
South Dakota
Tennessee
Texas
Utah
Vermont
Virginia
Washington
West Virginia
Wisconsin
Wyoming
TABLE A5
Persistence indicators by state
StateFour-year
graduation rate
Additional graduation rates
(five or more years) Dropout rateRe-engagement
of dropouts
Other, such as percentage of
students earning a GED certificate
Alabama
Alaska
Arizona
Arkansas
California
Colorado
Connecticut
District of Columbia
Delaware

47 Center for American Progress | Making the Grade
StateFour-year
graduation rate
Additional graduation rates
(five or more years) Dropout rateRe-engagement
of dropouts
Other, such as percentage of
students earning a GED certificate
Florida
Georgia
Hawaii
Idaho
Illinois
Indiana
Iowa
Kansas
Kentucky
Louisiana
Maine
Maryland
Massachusetts
Michigan
Minnesota
Mississippi
Missouri
Montana
Nebraska
Nevada
New Hampshire
New Jersey
New Mexico
New York
North Carolina
North Dakota
Ohio
Oklahoma
Oregon
Pennsylvania
Rhode Island
South Carolina
South Dakota
48 Center for American Progress | Making the Grade
StateFour-year
graduation rate
Additional graduation rates
(five or more years) Dropout rateRe-engagement
of dropouts
Other, such as percentage of
students earning a GED certificate
Tennessee
Texas
Utah
Vermont
Virginia
Washington
West Virginia
Wisconsin
Wyoming
TABLE A6
College- and career-ready indicators by state
StateParticipation in advanced course work, including
AP or IB classes or dual enrollmentPerformance in advanced course work, including
AP or IB exams and dual enrollment course grades
Alabama
Alaska
Arizona
Arkansas
California
Colorado
Connecticut
District of Columbia
Delaware
Florida
Georgia
Hawaii
Idaho
Illinois
Indiana
Iowa
Kansas
Participation in or performance on advanced course work or exams

49 Center for American Progress | Making the Grade
StateParticipation in advanced course work, including
AP or IB classes or dual enrollmentPerformance in advanced course work, including
AP or IB exams and dual enrollment course grades
Kentucky
Louisiana
Maine
Maryland
Massachusetts
Michigan
Minnesota
Mississippi
Missouri
Montana
Nebraska
Nevada
New Hampshire
New Jersey
New Mexico
New York
North Carolina
North Dakota
Ohio
Oklahoma
Oregon
Pennsylvania
Rhode Island
South Carolina
South Dakota
Tennessee
Texas
Utah
Vermont
Virginia
Washington
West Virginia
Wisconsin
Wyoming

50 Center for American Progress | Making the Grade
Participation in or performance on college entry exams
State
Participation in college entry exams such as SAT or ACT
Performance on college entry exams
such as SAT, ACT, ACCUPLACER, or
COMPASSParticipation in PSAT
or ACT AspirePerformance on
PSAT or ACT Aspire
Participation and performance in SAT
subject tests
Alabama
Alaska
Arizona
Arkansas
California
Colorado
Connecticut
District of Columbia
Delaware
Florida
Georgia
Hawaii
Idaho
Illinois
Indiana
Iowa
Kansas
Kentucky
Louisiana
Maine
Maryland
Massachusetts
Michigan
Minnesota
Mississippi
Missouri
Montana
Nebraska
Nevada
New Hampshire
New Jersey
New Mexico

51 Center for American Progress | Making the Grade
State
Participation in college entry exams such as SAT or ACT
Performance on college entry exams
such as SAT, ACT, ACCUPLACER, or
COMPASSParticipation in PSAT
or ACT AspirePerformance on
PSAT or ACT Aspire
Participation and performance in SAT
subject tests
New York
North Carolina
North Dakota
Ohio
Oklahoma
Oregon
Pennsylvania
Rhode Island
South Carolina
South Dakota
Tennessee
Texas
Utah
Vermont
Virginia
Washington
West Virginia
Wisconsin
Wyoming
Career preparedness participation or performance
State
Career preparedness participation, including completing career and technical
education classes or WorkKeys assessments and participating in job training
Career preparedness performance, including earning credentials or certificates, performance
on WorkKeys, and grades in career and technical education courses
Alabama
Alaska
Arizona
Arkansas
California
Colorado
Connecticut
District of Columbia
Delaware
Florida

52 Center for American Progress | Making the Grade
State
Career preparedness participation, including completing career and technical
education classes or WorkKeys assessments and participating in job training
Career preparedness performance, including earning credentials or certificates, performance
on WorkKeys, and grades in career and technical education courses
Georgia
Hawaii
Idaho
Illinois
Indiana
Iowa
Kansas
Kentucky
Louisiana
Maine
Maryland
Massachusetts
Michigan
Minnesota
Mississippi
Missouri
Montana
Nebraska
Nevada
New Hampshire
New Jersey
New Mexico
New York
North Carolina
North Dakota
Ohio
Oklahoma
Oregon
Pennsylvania
Rhode Island
South Carolina
South Dakota
Tennessee

53 Center for American Progress | Making the Grade
State
Career preparedness participation, including completing career and technical
education classes or WorkKeys assessments and participating in job training
Career preparedness performance, including earning credentials or certificates, performance
on WorkKeys, and grades in career and technical education courses
Texas
Utah
Vermont
Virginia
Washington
West Virginia
Wisconsin
Wyoming
Postsecondary enrollment
StatePostsecondary
enrollment
Military enrollment within six months
of graduationCollege remedial
course enrollment
Percentage of graduates not requiring
college remediation
Alabama
Alaska
Arizona
Arkansas
California
Colorado
Connecticut
District of Columbia
Delaware
Florida
Georgia
Hawaii
Idaho
Illinois
Indiana
Iowa
Kansas
Kentucky
Louisiana
Maine
Maryland
Massachusetts

54 Center for American Progress | Making the Grade
StatePostsecondary
enrollment
Military enrollment within six months
of graduationCollege remedial
course enrollment
Percentage of graduates not requiring
college remediation
Michigan
Minnesota
Mississippi
Missouri
Montana
Nebraska
Nevada
New Hampshire
New Jersey
New Mexico
New York
North Carolina
North Dakota
Ohio
Oklahoma
Oregon
Pennsylvania
Rhode Island
South Carolina
South Dakota
Tennessee
Texas
Utah
Vermont
Virginia
Washington
West Virginia
Wisconsin
Wyoming

55 Center for American Progress | Making the Grade
Other advanced coursework indicators
State
Percentage of students earning an advanced diploma
AP, International Baccalaureate, or college
credit offered
Participation of middle school students in hon-
ors, pre-AP, or high school level courses
Percentage of middle schoolers who passed
a high-school-level end-of-course
assessment or earned industry certification
Alabama
Alaska
Arizona
Arkansas
California
Colorado
Connecticut
District of Columbia
Delaware
Florida
Georgia
Hawaii
Idaho
Illinois
Indiana
Iowa
Kansas
Kentucky
Louisiana
Maine
Maryland
Massachusetts
Michigan
Minnesota
Mississippi
Missouri
Montana
Nebraska
Nevada
New Hampshire
New Jersey

56 Center for American Progress | Making the Grade
State
Percentage of students earning an advanced diploma
AP, International Baccalaureate, or college
credit offered
Participation of middle school students in hon-
ors, pre-AP, or high school level courses
Percentage of middle schoolers who passed
a high-school-level end-of-course
assessment or earned industry certification
New Mexico
New York
North Carolina
North Dakota
Ohio
Oklahoma
Oregon
Pennsylvania
Rhode Island
South Carolina
South Dakota
Tennessee
Texas
Utah
Vermont
Virginia
Washington
West Virginia
Wisconsin
Wyoming
Other college- and career-ready indicators
State State exit-level or college placement test Unweighted GPA
Alabama
Alaska
Arizona
Arkansas
California
Colorado
Connecticut
District of Columbia
Delaware
Florida

57 Center for American Progress | Making the Grade
State State exit-level or college placement test Unweighted GPA
Georgia
Hawaii
Idaho
Illinois
Indiana
Iowa
Kansas
Kentucky
Louisiana
Maine
Maryland
Massachusetts
Michigan
Minnesota
Mississippi
Missouri
Montana
Nebraska
Nevada
New Hampshire
New Jersey
New Mexico
New York
North Carolina
North Dakota
Ohio
Oklahoma
Oregon
Pennsylvania
Rhode Island
South Carolina
South Dakota
Tennessee
Texas
Utah

58 Center for American Progress | Making the Grade
State State exit-level or college placement test Unweighted GPA
Vermont
Virginia
Washington
West Virginia
Wisconsin
Wyoming
TABLE A7
Other indicators by state
State
Percentage of students meeting or exceeding
physical fitness standardsParticipation in nutrition
and physical activity programParticipation in visual
and performing art classes
Alabama
Alaska
Arizona
Arkansas
California
Colorado
Connecticut
District of Columbia
Delaware
Florida
Georgia
Hawaii
Idaho
Illinois
Indiana
Iowa
Kansas
Kentucky
Louisiana
Maine
Maryland
Massachusetts
Arts and physical fitness

59 Center for American Progress | Making the Grade
State
Percentage of students meeting or exceeding
physical fitness standardsParticipation in nutrition
and physical activity programParticipation in visual
and performing art classes
Michigan
Minnesota
Mississippi
Missouri
Montana
Nebraska
Nevada
New Hampshire
New Jersey
New Mexico
New York
North Carolina
North Dakota
Ohio
Oklahoma
Oregon
Pennsylvania
Rhode Island
South Carolina
South Dakota
Tennessee
Texas
Utah
Vermont
Virginia
Washington
West Virginia
Wisconsin
Wyoming
Culture and climate
StateMeasure of school
climate and cultureStudent and
parent engagement Promotion of
extracurricular activities Reduction of truancy
Alabama
Alaska
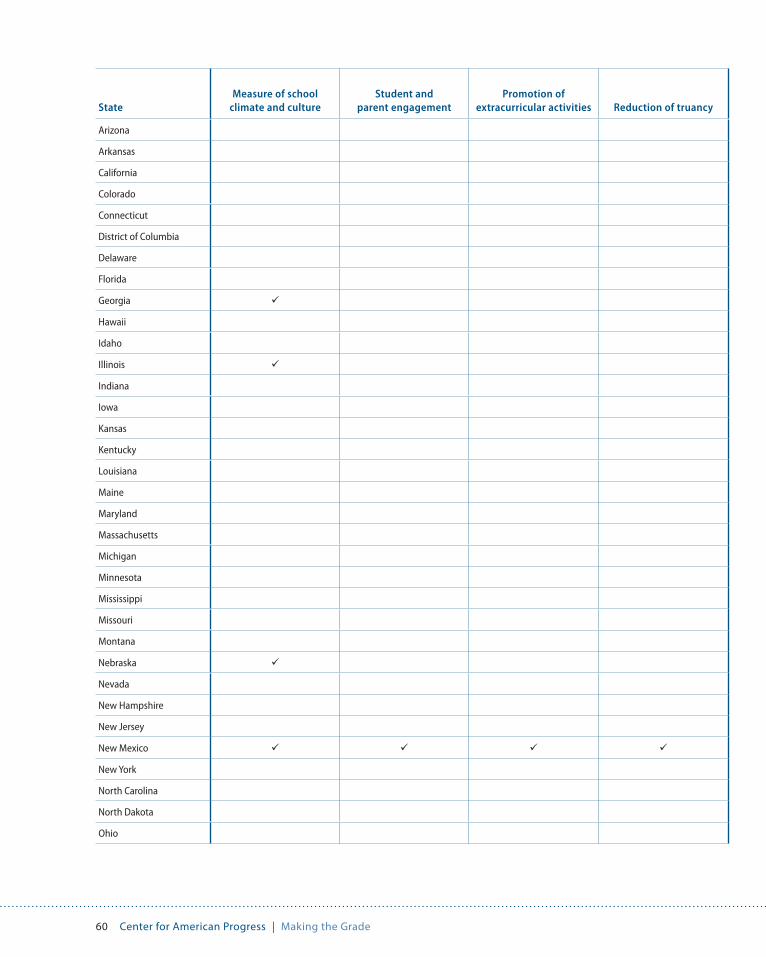
60 Center for American Progress | Making the Grade
StateMeasure of school
climate and cultureStudent and
parent engagement Promotion of
extracurricular activities Reduction of truancy
Arizona
Arkansas
California
Colorado
Connecticut
District of Columbia
Delaware
Florida
Georgia
Hawaii
Idaho
Illinois
Indiana
Iowa
Kansas
Kentucky
Louisiana
Maine
Maryland
Massachusetts
Michigan
Minnesota
Mississippi
Missouri
Montana
Nebraska
Nevada
New Hampshire
New Jersey
New Mexico
New York
North Carolina
North Dakota
Ohio

61 Center for American Progress | Making the Grade
StateMeasure of school
climate and cultureStudent and
parent engagement Promotion of
extracurricular activities Reduction of truancy
Oklahoma
Oregon
Pennsylvania
Rhode Island
South Carolina
South Dakota
Tennessee
Texas
Utah
Vermont
Virginia
Washington
West Virginia
Wisconsin
Wyoming
Educator measures
State
Teacher use of state data systems or school use of teacher-student data systems
Reporting educator effectiveness labels Staff retention
Alabama
Alaska
Arizona
Arkansas
California
Colorado
Connecticut
District of Columbia
Delaware
Florida
Georgia
Hawaii
Idaho
Illinois
Indiana
Iowa

62 Center for American Progress | Making the Grade
State
Teacher use of state data systems or school use of teacher-student data systems
Reporting educator effectiveness labels Staff retention
Kansas
Kentucky
Louisiana
Maine
Maryland
Massachusetts
Michigan
Minnesota
Mississippi
Missouri
Montana
Nebraska
Nevada
New Hampshire
New Jersey
New Mexico
New York
North Carolina
North Dakota
Ohio
Oklahoma
Oregon
Pennsylvania
Rhode Island
South Carolina
South Dakota
Tennessee
Texas
Utah
Vermont
Virginia
Washington
West Virginia
Wisconsin
Wyoming
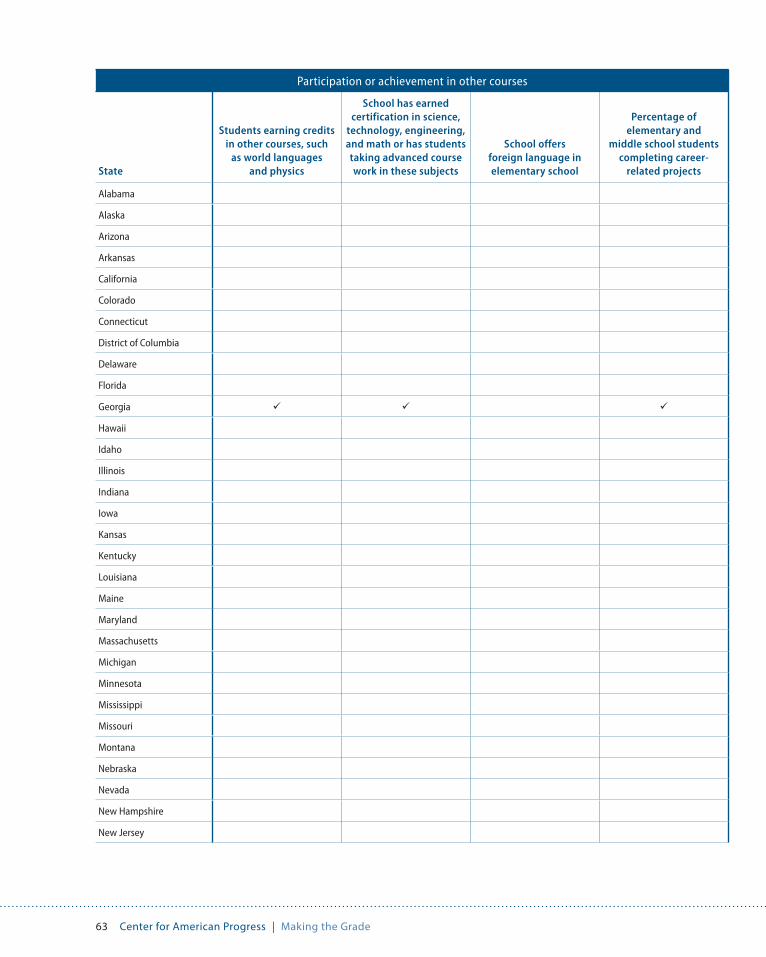
63 Center for American Progress | Making the Grade
Participation or achievement in other courses
State
Students earning credits in other courses, such
as world languages and physics
School has earned certification in science,
technology, engineering, and math or has students taking advanced course work in these subjects
School offers foreign language in elementary school
Percentage of elementary and
middle school students completing career-
related projects
Alabama
Alaska
Arizona
Arkansas
California
Colorado
Connecticut
District of Columbia
Delaware
Florida
Georgia
Hawaii
Idaho
Illinois
Indiana
Iowa
Kansas
Kentucky
Louisiana
Maine
Maryland
Massachusetts
Michigan
Minnesota
Mississippi
Missouri
Montana
Nebraska
Nevada
New Hampshire
New Jersey
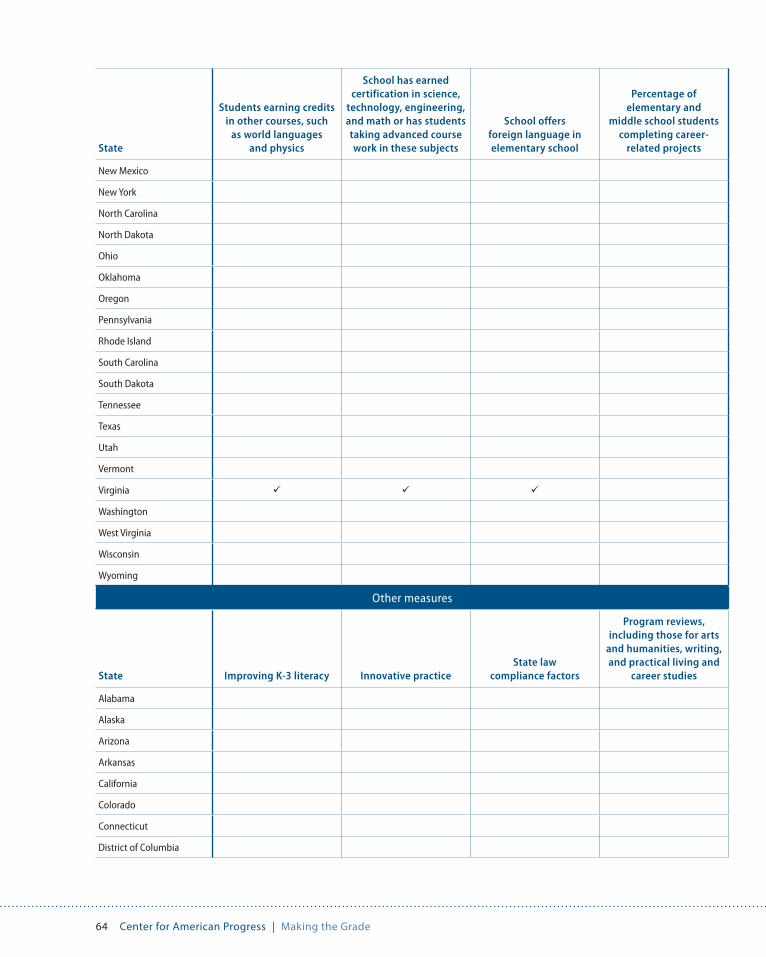
64 Center for American Progress | Making the Grade
State
Students earning credits in other courses, such
as world languages and physics
School has earned certification in science,
technology, engineering, and math or has students taking advanced course work in these subjects
School offers foreign language in elementary school
Percentage of elementary and
middle school students completing career-
related projects
New Mexico
New York
North Carolina
North Dakota
Ohio
Oklahoma
Oregon
Pennsylvania
Rhode Island
South Carolina
South Dakota
Tennessee
Texas
Utah
Vermont
Virginia
Washington
West Virginia
Wisconsin
Wyoming
State Improving K-3 literacy Innovative practiceState law
compliance factors
Program reviews, including those for arts
and humanities, writing, and practical living and
career studies
Alabama
Alaska
Arizona
Arkansas
California
Colorado
Connecticut
District of Columbia
Other measures
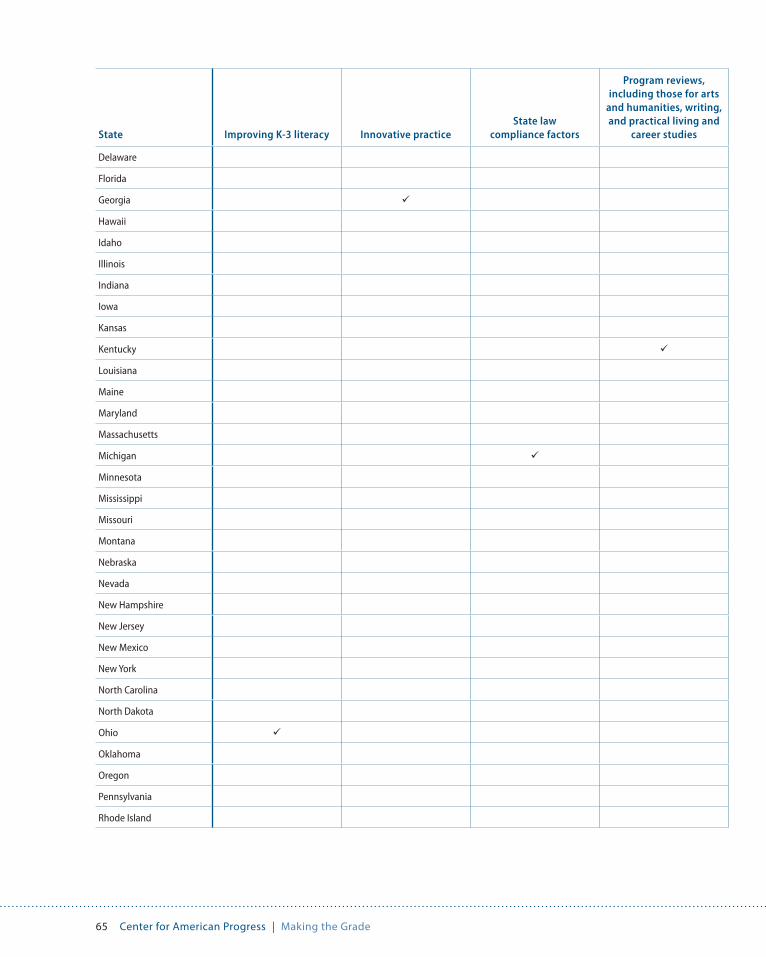
65 Center for American Progress | Making the Grade
State Improving K-3 literacy Innovative practiceState law
compliance factors
Program reviews, including those for arts
and humanities, writing, and practical living and
career studies
Delaware
Florida
Georgia
Hawaii
Idaho
Illinois
Indiana
Iowa
Kansas
Kentucky
Louisiana
Maine
Maryland
Massachusetts
Michigan
Minnesota
Mississippi
Missouri
Montana
Nebraska
Nevada
New Hampshire
New Jersey
New Mexico
New York
North Carolina
North Dakota
Ohio
Oklahoma
Oregon
Pennsylvania
Rhode Island
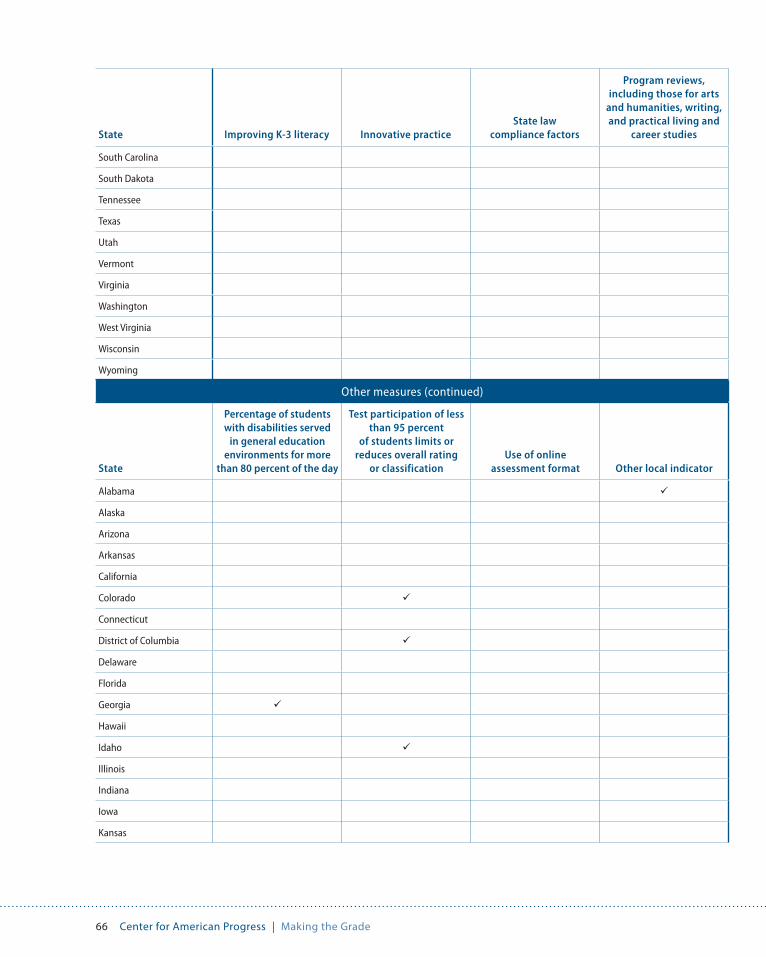
66 Center for American Progress | Making the Grade
State Improving K-3 literacy Innovative practiceState law
compliance factors
Program reviews, including those for arts
and humanities, writing, and practical living and
career studies
South Carolina
South Dakota
Tennessee
Texas
Utah
Vermont
Virginia
Washington
West Virginia
Wisconsin
Wyoming
Other measures (continued)
State
Percentage of students with disabilities served
in general education environments for more
than 80 percent of the day
Test participation of less than 95 percent
of students limits or reduces overall rating
or classificationUse of online
assessment format Other local indicator
Alabama
Alaska
Arizona
Arkansas
California
Colorado
Connecticut
District of Columbia
Delaware
Florida
Georgia
Hawaii
Idaho
Illinois
Indiana
Iowa
Kansas

67 Center for American Progress | Making the Grade
State
Percentage of students with disabilities served
in general education environments for more
than 80 percent of the day
Test participation of less than 95 percent
of students limits or reduces overall rating
or classificationUse of online
assessment format Other local indicator
Kentucky
Louisiana
Maine
Maryland
Massachusetts
Michigan
Minnesota
Mississippi
Missouri
Montana
Nebraska
Nevada
New Hampshire
New Jersey
New Mexico
New York
North Carolina
North Dakota
Ohio
Oklahoma
Oregon
Pennsylvania
Rhode Island
South Carolina
South Dakota
Tennessee
Texas
Utah
Vermont
Virginia
Washington
West Virginia
Wisconsin
Wyoming

68 Center for American Progress | Making the Grade
Appendix C: Weighting analysis
TABLE A8
Color key for weighting analysis
A blank cell signifies that a state: (1) does not have an ESEA flexibility waiver or additional state system and there-fore uses AYP for accountability; (2) does not combine its accountability indicators in a way that results in an overall score or grade; (3) uses business rules that do not translate to weightings; or (4) is transitioning to a new system.
--A double dash signifies that a state does not include this category of indicators in its accountability system at the state or school level.
A light blue cell means that the weighting data for some or all of the indicators in this category could not be unpacked from another indicator category’s weighting. The cell in the corresponding category of indicators with the weighting is also light blue.
A medium blue cell means that this category of indicators contributes to bonus points not included in the category’s weighting or in a school’s classification.
A dark blue cell means that performance of some or all of the indicators in this category contribute to a point or rating deduction or to a school’s classification.
A list of sources for this analysis can be found in Appendix D.

69 Center for American Progress | Making the Grade
TABLE A9
Achievement indicators weighting
StatePercentage of elementary
school ratingPercentage of middle
school ratingPercentage of high
school rating
Alabama 50.0% 50.0% 25.0%
Alaska 35.0% 35.0% 20.0%
Arizona
Arkansas 51.0% 51.0% 34.6%
California
Colorado 25.0% 25.0% 15.0%
Connecticut 35.3% 33.3% 48.0%
District of Columbia 100.0% 100.0% 100.0%
Delaware 30.0% 30.0% 25.0%
Florida 42.9% 44.4% 40.0%
Georgia 50.0% 48.0% 33.8%
Hawaii 52.4% 46.3% 34.1%
Idaho 25.0% 25.0% 20.0%
Illinois 50.0% 50.0% 22.2%
Indiana 50.0% 50.0% 26.7%
Iowa 57.2% 62.5% 55.5%
Kansas
Kentucky 51.3% 43.1% 30.8%
Louisiana 100.0% 95.0% 50.0%
Maine 50.0% 50.0% 80.0%
Maryland 70.0% 70.0% 64.0%
Massachusetts 66.7% 66.7% 50.0%
Michigan
Minnesota 33.3% 33.3% 25.0%
Mississippi 42.9% 42.9% 30.0%
Missouri 75.0% 75.0% 50.0%
Montana
Nebraska
Nevada 30.0% 30.0% 30.0%
New Hampshire 20.0% 20.0% 50.0%
New Jersey
New Mexico 33.3% 33.3% 28.6%
New York
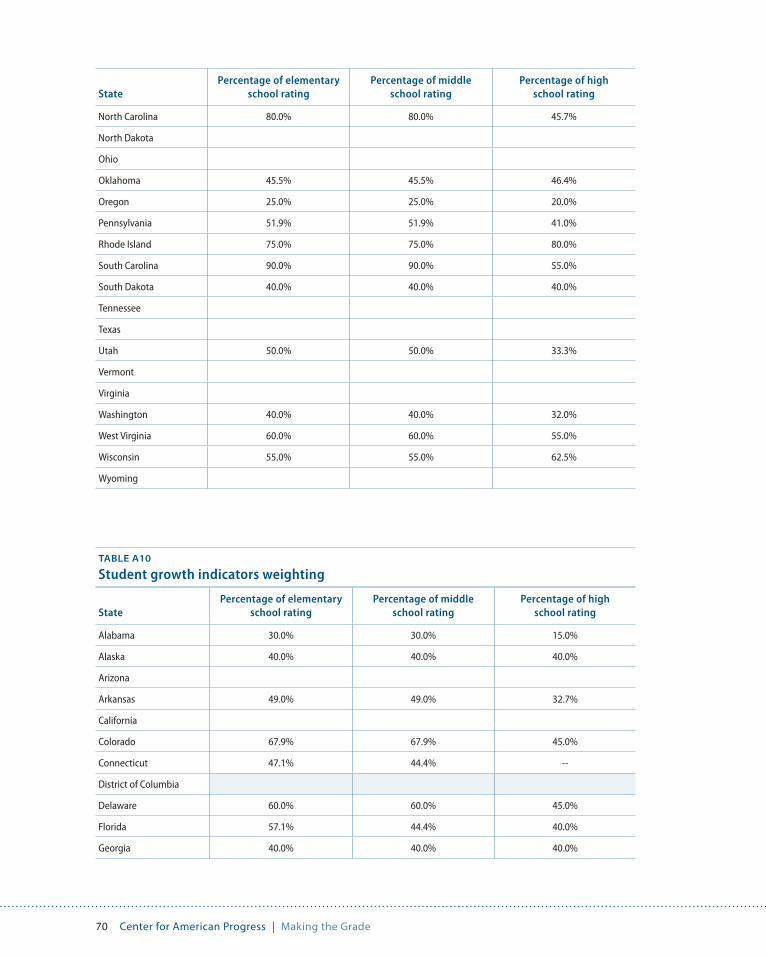
70 Center for American Progress | Making the Grade
StatePercentage of elementary
school ratingPercentage of middle
school ratingPercentage of high
school rating
North Carolina 80.0% 80.0% 45.7%
North Dakota
Ohio
Oklahoma 45.5% 45.5% 46.4%
Oregon 25.0% 25.0% 20.0%
Pennsylvania 51.9% 51.9% 41.0%
Rhode Island 75.0% 75.0% 80.0%
South Carolina 90.0% 90.0% 55.0%
South Dakota 40.0% 40.0% 40.0%
Tennessee
Texas
Utah 50.0% 50.0% 33.3%
Vermont
Virginia
Washington 40.0% 40.0% 32.0%
West Virginia 60.0% 60.0% 55.0%
Wisconsin 55.0% 55.0% 62.5%
Wyoming
StatePercentage of elementary
school ratingPercentage of middle
school ratingPercentage of high
school rating
Alabama 30.0% 30.0% 15.0%
Alaska 40.0% 40.0% 40.0%
Arizona
Arkansas 49.0% 49.0% 32.7%
California
Colorado 67.9% 67.9% 45.0%
Connecticut 47.1% 44.4% --
District of Columbia
Delaware 60.0% 60.0% 45.0%
Florida 57.1% 44.4% 40.0%
Georgia 40.0% 40.0% 40.0%
TABLE A10
Student growth indicators weighting

71 Center for American Progress | Making the Grade
StatePercentage of elementary
school ratingPercentage of middle
school ratingPercentage of high
school rating
Hawaii 34.1% 26.8% 14.6%
Idaho 75.0% 75.0% 50.0%
Illinois 35.0% 35.0% 23.3%
Indiana 50.0% 50.0% 13.3%
Iowa 28.6% 25.0% 22.2%
Kansas
Kentucky 25.7% 21.6% 15.4%
Louisiana
Maine 50.0% 50.0% --
Maryland 30.0% 30.0% --
Massachusetts 29.6% 29.6% 22.2%
Michigan
Minnesota 66.7% 66.7% 50.0%
Mississippi 57.1% 57.1% 40.0%
Missouri --
Montana
Nebraska
Nevada 60.0% 60.0% 10.0%
New Hampshire 60.0% 60.0% --
New Jersey
New Mexico 52.4% 52.4% 28.6%
New York
North Carolina 20.0% 20.0% 20.0%
North Dakota
Ohio
Oklahoma 45.5% 45.5% 45.5%
Oregon 75.0% 75.0% 30.0%
Pennsylvania 38.5% 38.5% 37.4%
Rhode Island 25.0% 25.0% --
South Carolina -- -- --
South Dakota 40.0% 40.0% --
Tennessee
Texas
Utah 50.0% 50.0% 33.3%
Vermont
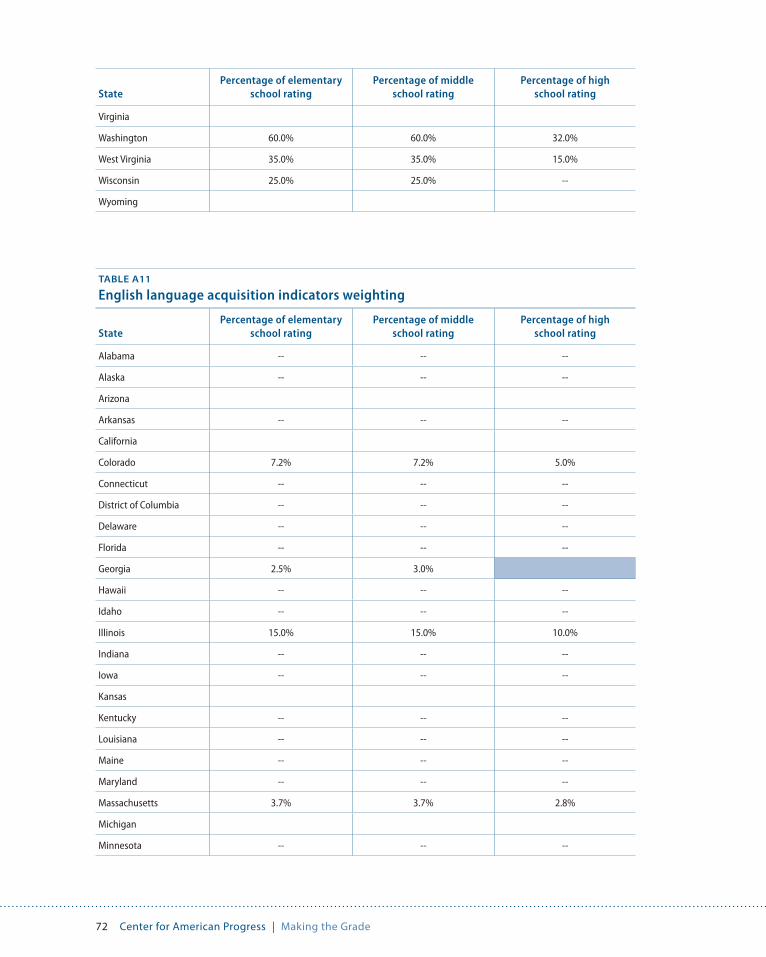
72 Center for American Progress | Making the Grade
StatePercentage of elementary
school ratingPercentage of middle
school ratingPercentage of high
school rating
Virginia
Washington 60.0% 60.0% 32.0%
West Virginia 35.0% 35.0% 15.0%
Wisconsin 25.0% 25.0% --
Wyoming
StatePercentage of elementary
school ratingPercentage of middle
school ratingPercentage of high
school rating
Alabama -- -- --
Alaska -- -- --
Arizona
Arkansas -- -- --
California
Colorado 7.2% 7.2% 5.0%
Connecticut -- -- --
District of Columbia -- -- --
Delaware -- -- --
Florida -- -- --
Georgia 2.5% 3.0%
Hawaii -- -- --
Idaho -- -- --
Illinois 15.0% 15.0% 10.0%
Indiana -- -- --
Iowa -- -- --
Kansas
Kentucky -- -- --
Louisiana -- -- --
Maine -- -- --
Maryland -- -- --
Massachusetts 3.7% 3.7% 2.8%
Michigan
Minnesota -- -- --
TABLE A11
English language acquisition indicators weighting

73 Center for American Progress | Making the Grade
StatePercentage of elementary
school ratingPercentage of middle
school ratingPercentage of high
school rating
Mississippi -- -- --
Missouri -- -- --
Montana
Nebraska
Nevada -- -- --
New Hampshire -- -- --
New Jersey
New Mexico -- -- --
New York
North Carolina -- -- --
North Dakota
Ohio
Oklahoma -- -- --
Oregon -- -- --
Pennsylvania -- -- --
Rhode Island -- -- --
South Carolina -- -- --
South Dakota -- -- --
Tennessee
Texas
Utah -- -- --
Vermont
Virginia
Washington -- -- --
West Virginia -- -- --
Wisconsin -- -- --
Wyoming
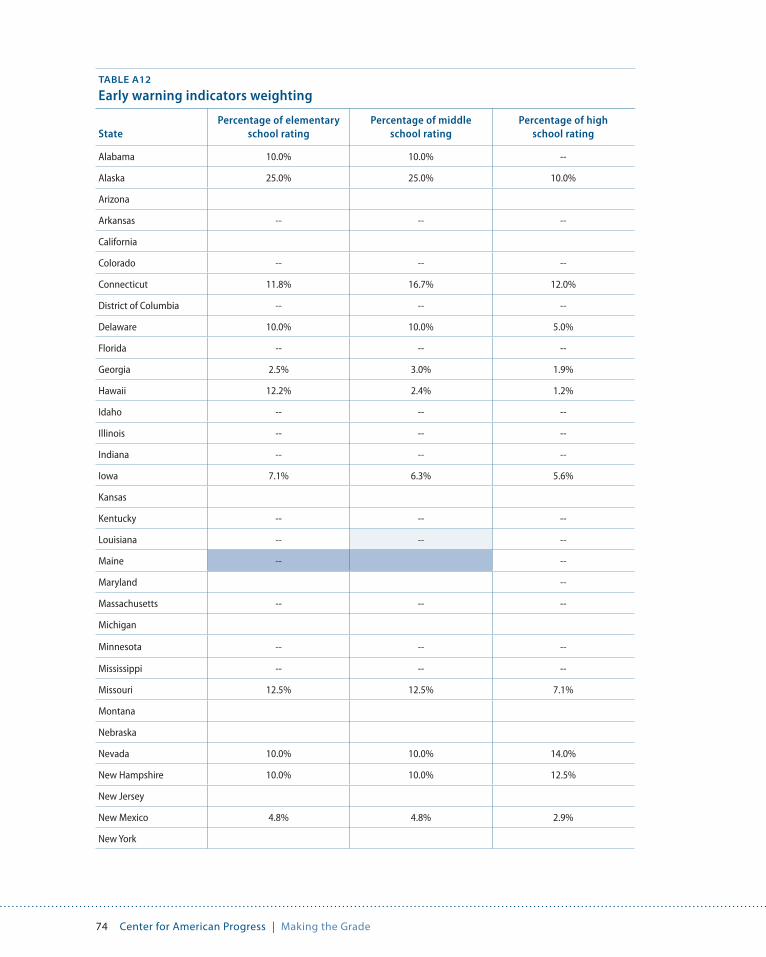
74 Center for American Progress | Making the Grade
TABLE A12
Early warning indicators weighting
StatePercentage of elementary
school ratingPercentage of middle
school ratingPercentage of high
school rating
Alabama 10.0% 10.0% --
Alaska 25.0% 25.0% 10.0%
Arizona
Arkansas -- -- --
California
Colorado -- -- --
Connecticut 11.8% 16.7% 12.0%
District of Columbia -- -- --
Delaware 10.0% 10.0% 5.0%
Florida -- -- --
Georgia 2.5% 3.0% 1.9%
Hawaii 12.2% 2.4% 1.2%
Idaho -- -- --
Illinois -- -- --
Indiana -- -- --
Iowa 7.1% 6.3% 5.6%
Kansas
Kentucky -- -- --
Louisiana -- -- --
Maine -- --
Maryland --
Massachusetts -- -- --
Michigan
Minnesota -- -- --
Mississippi -- -- --
Missouri 12.5% 12.5% 7.1%
Montana
Nebraska
Nevada 10.0% 10.0% 14.0%
New Hampshire 10.0% 10.0% 12.5%
New Jersey
New Mexico 4.8% 4.8% 2.9%
New York

75 Center for American Progress | Making the Grade
StatePercentage of elementary
school ratingPercentage of middle
school ratingPercentage of high
school rating
North Carolina -- -- --
North Dakota
Ohio
Oklahoma 9.1% 5.5% --
Oregon -- -- --
Pennsylvania 4.8% 4.8% 2.3%
Rhode Island -- -- --
South Carolina -- -- --
South Dakota 20.0% 20.0% --
Tennessee
Texas
Utah -- -- --
Vermont
Virginia
Washington -- -- --
West Virginia 5.0% 5.0% --
Wisconsin 20.0% 20.0%
Wyoming
StatePercentage of elementary
school ratingPercentage of middle
school ratingPercentage of high
school rating
Alabama -- -- 20.0%
Alaska -- -- 20.0%
Arizona
Arkansas -- -- 32.7%
California
Colorado -- -- 26.3%
Connecticut -- -- 16.0%
District of Columbia -- --
Delaware -- -- 15.0%
Florida -- -- 10.0%
Georgia -- -- 15.0%
TABLE A13
Persistence indicators weighting

76 Center for American Progress | Making the Grade
StatePercentage of elementary
school ratingPercentage of middle
school ratingPercentage of high
school rating
Hawaii 1.2% -- 26.8%
Idaho -- -- 15.0%
Illinois -- -- 33.3%
Indiana -- -- 30.0%
Iowa -- -- 11.1%
Kansas
Kentucky -- -- 15.4%
Louisiana -- 25.0%
Maine -- -- 20.0%
Maryland -- -- 28.0%
Massachusetts -- -- 25.0%
Michigan
Minnesota -- -- 25.0%
Mississippi -- -- 20.0%
Missouri -- -- 21.4%
Montana
Nebraska
Nevada -- -- 30.0%
New Hampshire -- -- 25.0%
New Jersey
New Mexico -- -- 16.2%
New York
North Carolina -- -- 11.4%
North Dakota
Ohio
Oklahoma -- 1.8% 5.5%
Oregon -- -- 50.0%
Pennsylvania 4.8% 4.8% 2.3%
Rhode Island -- -- 20.0%
South Carolina -- -- 30.0%
South Dakota -- -- 30.0%
Tennessee
Texas
Utah -- -- 16.7%

77 Center for American Progress | Making the Grade
StatePercentage of elementary
school ratingPercentage of middle
school ratingPercentage of high
school rating
Vermont
Virginia
Washington -- -- 32.0%
West Virginia -- -- 30.0%
Wisconsin -- -- 32.5%
Wyoming
TABLE A14
College- and career-ready indicators weighting
StatePercentage of
elementary school ratingPercentage of
middle school ratingPercentage of
high school rating
Alabama -- -- 30.0%
Alaska -- -- 10.0%
Arizona
Arkansas -- -- --
California
Colorado -- -- 8.8%
Connecticut -- -- 16.0%
District of Columbia -- -- --
Delaware -- -- 10.0%
Florida -- 11.1% 10.0%
Georgia -- -- 9.4%
Hawaii -- 24.4% 23.2%
Idaho -- -- 15.0%
Illinois -- -- 11.1%
Indiana -- -- 30.0%
Iowa -- -- --
Kansas
Kentucky -- 12.3% 15.4%
Louisiana -- 5.0% 25.0%
Maine -- -- --
Maryland -- -- 8.0%
Massachusetts -- -- --
Michigan

78 Center for American Progress | Making the Grade
StatePercentage of
elementary school ratingPercentage of
middle school ratingPercentage of
high school rating
Minnesota -- -- --
Mississippi -- -- 10.0%
Missouri 12.5% 12.5% 21.4%
Montana
Nebraska
Nevada -- -- 16.0%
New Hampshire -- -- --
New Jersey
New Mexico -- -- 14.3%
New York
North Carolina -- -- 22.9%
North Dakota
Ohio
Oklahoma -- 1.8% 2.7%
Oregon -- -- --
Pennsylvania -- -- 16.8%
Rhode Island -- -- --
South Carolina -- -- --
South Dakota -- -- 30.0%
Tennessee
Texas
Utah -- -- 16.7%
Vermont
Virginia
Washington -- -- 4.0%
West Virginia -- -- --
Wisconsin -- -- 5.0%
Wyoming

79 Center for American Progress | Making the Grade
TABLE A15
Other indicators weighting
StatePercentage of
elementary school ratingPercentage of
middle school ratingPercentage of
high school rating
Alabama 10.0% 10.0% 10.0%
Alaska -- -- --
Arizona
Arkansas -- -- --
California
Colorado
Connecticut 5.9% 5.6% 8.0%
District of Columbia
Delaware -- -- --
Florida -- -- --
Georgia 5.0% 6.0%
Hawaii -- -- --
Idaho
Illinois
Indiana -- -- --
Iowa 7.1% 6.3% 5.6%
Kansas
Kentucky 23.0% 23.0% 23.0%
Louisiana -- -- --
Maine
Maryland -- -- --
Massachusetts
Michigan
Minnesota -- -- --
Mississippi -- -- --
Missouri -- -- --
Montana
Nebraska
Nevada -- -- --
New Hampshire 10.0% 10.0% 12.5%
New Jersey
New Mexico 9.5% 9.5% 9.5%
New York

80 Center for American Progress | Making the Grade
StatePercentage of
elementary school ratingPercentage of
middle school ratingPercentage of
high school rating
North Carolina -- -- --
North Dakota
Ohio
Oklahoma
Oregon
Pennsylvania
Rhode Island
South Carolina 10.0% 10.0% 15.0%
South Dakota -- -- --
Tennessee
Texas
Utah
Vermont
Virginia
Washington -- -- --
West Virginia -- -- --
Wisconsin
Wyoming
81 Center for American Progress | Making the Grade
Appendix D: Sources
The authors reviewed the approved Elementary and Secondary Education Act flexibility plans of 42 states and the District of Columbia, as well as the approved state accountability plans for the eight states operating under No Child Left Behind. These documents are available here:
U.S. Department of Education, “ESEA Flexibility: State Requests and Related Documents,” available at http://www2.ed.gov/policy/elsec/guid/esea-flexibility/index.html (last accessed May 2016).
U.S. Department of Education, “Approved State Accountability Plans,” available at http://www2.ed.gov/admins/lead/account/stateplans03/index.html (last accessed May 2016).
The authors supplemented this research with information and materials from the following state departments of education.
Alabama:
Alabama State Department of Education, “Putting Together the Pieces of the Accountability PLAN 2020” (2016), available at http://www.alsde.edu/sec/acct/Resources%20Tabbed/Accountabil-ity%20Overview%20Board%20Work%20Session%20-%20February%202016.pdf.
Alabama State Board of Education, “PLAN 2020,” available at https://docs.alsde.edu/docu-ments/908/Attachment%201%20Plan%202020.pdf (last accessed April 2016).
Alaska:
Alaska Department of Education & Early Development, “Alaska School Accountability System” (2014), available at http://www.nsbsd.org/cms/lib01/AK01001879/Centricity/Domain/38/ASPI%20%20AMO%20one%20pager%20073014%20final.pdf.
Arizona:
Arizona Department of Education, “Arizona’s Transition to a New Accountability System for Public Schools and Districts” (2015), available at http://www.azed.gov/accountability/files/2015/05/2015-arizona%E2%80%99s-transition-to-a-new-accountability-system-for-public-schools-and-districts.pdf.

82 Center for American Progress | Making the Grade
Arizona Department of Education, “2014 A-F Letter Grade Accountability System: Technical Manu-al” (2014), available at http://www.azed.gov/accountability/files/2014/12/2014-a-f-technical-manual.pdf.
Arkansas:
Arkansas Department of Education, “Appendix ‘A’: Model for Calculation of Overall School Scores for Determination of School Letter Grades.” Received through personal communication from Renee Austin-Banks, public school program advisor, School Performance Office, Public School Accountability Division, Arkansas Department of Education, March 11, 2016.
California:
California Department of Education, “FAQs for 2015 Accountability,” available http://www.cde.ca.gov/ta/ac/ar/aprfaq15.asp (last accessed April 2016).
District of Columbia:
District of Columbia Office of the State Superintendent of Education, “Accountability Index Calculation and Status Determination,” available at http://osse.dc.gov/sites/default/files/dc/sites/osse/publication/attachments/Student%20Level%20Index%20Data%20Final_0.pdf (last accessed April 2016).
Delaware:
Delaware Department of Education, “Delaware School Success Framework Reference Guide (2015-16),” available at http://www.doe.k12.de.us/cms/lib09/DE01922744/Centricity/Domain/404/Delaware%20School%20Success%20Framework%20Reference%20Guide%202015-2016.pdf (last accessed April 2016).
Florida:
Florida Department of Education, “2014-15 Guide to Calculating Informational Baseline School and District Grades” (2016), available at http://schoolgrades.fldoe.org/pdf/1415/SchoolGrad-esCalcGuide15.pdf.
Florida Department of Education, “Accountability Update” (2014), available at http://www.fldoe.org/core/fileparse.php/7729/urlt/Accountability-Reporting_TechMeeting2015.pdf.
Florida Department of Education, “2015 Informational Baseline School Grades Overview” (2015), available at http://schoolgrades.fldoe.org/pdf/1415/SchoolGradesOverview15.pdf.

83 Center for American Progress | Making the Grade
Georgia:
Georgia Department of Education, “2016 CCRPI Indicators” (2015), available at http://www.gadoe.org/Curriculum-Instruction-and-Assessment/Accountability/Documents/Indicators%20and%20Targets/2016%20Indicators.pdf.
Georgia Department of Education, “2015 and 2016 CCRPI – Summary of Changes,” available at http://www.gadoe.org/Curriculum-Instruction-and-Assessment/Accountability/Documents/Indicators%20and%20Targets/SummaryofChanges.pdf (last accessed April 2016).
Georgia Department of Education, “Achievement Scoring Details 2015 CCRPI.” Received through personal communication from Allison Timberlake, director of accountability, Georgia Depart-ment of Education, March 10, 2016.
Hawaii:
Hawaii State Department of Education, “Strive HI Performance System: Changes to System,” avail-able at http://www.hawaiipublicschools.org/DOE%20Forms/StriveHI/StriveHI141516update.pdf (last accessed April 2016).
Idaho:
Idaho Department of Education, “Principle 2: State-Developed Differentiated Recognition, Ac-countability, and Support.” Received through personal communication from Karen Seay, director of federal programs, Idaho State Department of Education, March 17, 2016.
Illinois:
Shuwan Chiu, phone interview with authors, March 4, 2016.
Indiana:
Indiana Department of Education, “The New A-F Accountability System,” available at http://www.doe.in.gov/sites/default/files/accountability/accountability-presentationadvanced.pdf (last ac-cessed April 2016).
Iowa:
Iowa Department of Education, “Iowa School Report Card – Technical Guide, version 1.1” (2016), available at http://reports.educateiowa.gov/schoolreportcard//content/Technical%20Guilde-Iowa%20Report%20Card.pdf.
Kentucky:
Kentucky Department of Education, “Unbridled Learning Accountability Model (With Focus on the Next-Generation Learners Component)” (2012), available at http://education.ky.gov/comm/UL/Documents/WHITE%20PAPER%20062612%20final.pdf.

84 Center for American Progress | Making the Grade
Kentucky Board of Education, “Kentucky Board of Education Regular Meeting – Full Board Meet-ing: Summary Minutes” (2015), available at http://education.ky.gov/KBE/meet/Documents/August%206%202015%20summary%20minutes.pdf.
Louisiana:
Louisiana Department of Education, “School Performance Score,” available at https://www.louisia-nabelieves.com/accountability/school-performance-scores (last accessed April 2016).
Louisiana Board of Elementary and Secondary Education, “Title 28 Education: Part LXXXIII: Bul-letin 111—The Louisiana School, District and State Accountability System” (2016), available at https://www.google.com/url?sa=t&rct=j&q=&esrc=s&source=web&cd=2&ved=0ahUKEwjbpvvjlJHMAhWJLB4KHdGpA2gQFggjMAE&url=http%3A%2F%2Fwww.doa.la.gov%2Fosr%2Flac%2F28v83%2F28v83.doc&usg=AFQjCNH6KYnNali-VhKynee6PFEWrY36rg&sig2=ZIK6D-LPQ7s547LPt1BarA&cad=rja.
Maine:
Maine Department of Education, “Methodology,” available at http://maine.gov/doe/schoolreport-cards/resources/methodology.html (last accessed March 2016).
Maryland:
Maryland Classroom, “School Progress Index,” 18 (3) (2012), available at http://www.marylandpub-licschools.org/mdclassroom/Vol18_No3_122012.pdf.
Massachusetts:
Massachusetts Department of Elementary and Secondary Education, “Understanding Massachu-setts’ Accountability Measures” (2015), available at http://www.mass.gov/edu/docs/ese/ac-countability/annual-reports/lea-brochure.pdf.
Massachusetts Department of Elementary and Secondary Education, “School Leader’s Guide to the 2015 Accountability Determinations” (2015), available at http://www.mass.gov/edu/docs/ese/accountability/annual-reports/school-leaders-guide.pdf.
Michigan:
Michigan Department of Education, “Michigan School Accountability Scorecards” (2014), available at http://www.michigan.gov/documents/mde/Accountability_Scorecards_At-A-Glance_425302_7.pdf.
Michigan Department of Education, “Michigan School Accountability Scorecards Business Rules: 2014” (2014), available at https://www.michigan.gov/documents/mde/ScorecardBusiness-Rules_427122_7.pdf?20160505162237.
85 Center for American Progress | Making the Grade
Missouri:
Missouri Department of Elementary and Secondary Education, “Comprehensive Guide to the Mis-souri School Improvement Program” (2015), available at http://dese.mo.gov/sites/default/files/MSIP_5_2015_Comprehensive_Guide.pdf.
Nebraska:
AQuESTT for Nebraska, “AQuESTT Classification System” (2015), available at http://aquestt.com/wp-content/uploads/2015/12/AQuESTTFinalClassificationBusinessRulesSB2015.pdf.
AQuESTT for Nebraska, “AQuESTT Classification Process” (2015), available at http://aquestt.com/wp-content/uploads/2015/12/AQuESTTClassificationProcess.pdf.
Nevada:
Nevada Department of Education, “Nevada School Performance Framework,” available at http://nspf.doe.nv.gov/Home/AboutEle (last accessed April 2016).
New Hampshire:
New Hampshire Department of Education, “New Hampshire School Accountability System.” Re-ceived through personal communication from Keith Burke, consultant, Bureau of Accountability and Assessment, New Hampshire Department of Education, March 30, 2016.
New Jersey:
New Jersey Department of Education, “NJ School Performance Guides – Interpretive Guide” (2015), available at http://www.nj.gov/education/pr/1314/NJ%20School%20Performance%20Interpretive%20Guide%202015.pdf.
New Mexico:
New Mexico Public Education Department, “New Mexico School Grading Technical Guide: Calcu-lation and Business Rules, School Year 2014-2015” (2015), available at http://webapp2.ped.state.nm.us/SchoolData/docs/Technical_Guide_2015_V2.0.pdf.
New York:
New York State Department of Education, “AYP and PI Determinations 2015-16” (2016), available at http://www.p12.nysed.gov/irs/accountability/documents/AYPandPIDeterminations2015-16Data20160502.ppt.
New York State Department of Education, “Commissioner Identifies 365 High Achieving and High Progress Schools as Reward Schools,” Press release, August 19, 2015, available at http://www.nysed.gov/news/2015/commissioner-identifies-365-high-achieving-and-high-progress-schools-reward-schools.

86 Center for American Progress | Making the Grade
North Carolina:
North Carolina Department of Public Instruction, “School Performance Grades” (2015), available at http://www.dpi.state.nc.us/docs/accountability/reporting/schlprfrmbrf15.pdf.
Ohio:
Ohio Department of Education, “Ohio Guide to 2015 Ohio School Report Cards” (2015), available at http://education.ohio.gov/getattachment/Topics/Data/Report-Card-Resources/ReportCard-Guide.pdf.aspx.
Oklahoma:
Oklahoma Department of Education, “A to F Report Card Calculation Guide” (2015), available at http://sde.ok.gov/sde/sites/ok.gov.sde/files/documents/files/AtoFReportCardGuide.pdf.
Rhode Island:
Rhode Island Department of Elementary and Secondary Education, “Rhode Island School and District Accountability System ESEA Flexibility under NCLB: Technical Bulletin” (2012), avail-able at http://www.ride.ri.gov/Portals/0/Uploads/Documents/Students-and-Families-Great-Schools/RI-Public-Schools/RIAccountabilityTechnicalBulletin.pdf.
South Carolina:
South Carolina Department of Education, “ESEA Federal Accountability System Components” (2014), available at http://ed.sc.gov/assets/reportCards/federal-accountability/esea/2014/ESEA_2014_Brief_Technical_Document.pdf.
South Dakota:
South Dakota Department of Education, “Public School Accountability System” (2014), available at http://doe.sd.gov/secretary/documents/AccModSum.pdf.
Tennessee:
Tennessee Department of Education, “District Accountability: Frequently Asked Questions” (2015), available at https://www.tn.gov/assets/entities/education/attachments/acct_faq_2015.pdf.
Tennessee Department of Education, “School Accountability: Frequently Asked Questions” (2014), available at https://tn.gov/assets/entities/sbe/attachments/8-26-14%20II_A_State_Identi-fied_Reward_Priority_Focus_Schools_Attachment_1.pdf.
Tennessee Department of Education, “2015 District Accountability Overview” (2015), available at https://www.tn.gov/assets/entities/education/attachments/acct_overview_2015.pdf.

87 Center for American Progress | Making the Grade
Texas:
Department of Assessment and Accountability, Division of Performance Reporting, “Chapter 4 – Performance Index Indicators.” In Texas Education Agency, “2015 Accountability Manual” (2015), available at https://rptsvr1.tea.texas.gov/perfreport//account/2015/manual/Chap-ter%2004_Final.pdf.
Utah:
Utah State Office of Education, “2015 Utah Accountability Technical Manual” (2015), available at http://www.schools.utah.gov/assessment/Accountability/TechnicalManual.aspx.
Vermont:
Vermont Agency of Education, “FAQs,” available at http://education.vermont.gov/data/account-ability/faqs (last accessed April 2016).
Vermont Agency of Education, “Accountability Operations Manual” (2011), available at http://edu-cation.vermont.gov/documents/EDU-Accountability_Operations_Manual_March_2011.pdf.
Virginia:
Virginia Department of Education, “Accountability in Virginia Public Schools” (2015), available at http://www.doe.virginia.gov/statistics_reports/school_report_card/accountability_guide.pdf.
Virginia Department of Education, “Virginia Index of Performance (VIP) Program: 2015-2016 VIP Awards Criteria,” available at http://www.doe.virginia.gov/statistics_reports/va_index_perfor-mance_awards/criteria.shtml (last accessed April 2016).
Washington:
State of Washington Office of Superintendent of Public Instruction, “Methodology, business rules, and data components used in the April, 2016 implementation of the Washington State Achieve-ment Index” (2016), available at http://www.sbe.wa.gov/documents/AchievementIndex/Index-Methodology.pdf.
West Virginia:
West Virginia Department of Education, “Technical Fact Sheet: Understanding the West Virginia Accountability Index (WVAI),” available at http://wvde.state.wv.us/esea/support/Documents/Technical%20Fact%20Sheet_Understanding%20the%20WV%20Accountability%20Index.pdf (last accessed March 2016).

88 Center for American Progress | Making the Grade
Wisconsin:
Wisconsin Department of Public Instruction, “About Wisconsin Accountability,” available at http://dpi.wi.gov/accountability (last accessed April 2016).
Wisconsin Department of Public Instruction, “District & School Report Cards Interpretive Guide” (2014), available at http://dpi.wi.gov/sites/default/files/imce/accountability/pdf/Interpre-tive%20Guide%202014.pdf.
Wyoming:
Wyoming Department of Education, “Wyoming School Accountability: 2015 Wyoming School Per-formance Rating Model: Implementation Handbook” (2015), available at https://edu.wyoming.gov/downloads/accountability/2015/2015-school-performance-rating-model.pdf.

89 Center for American Progress | Making the Grade
Endnotes
1 Every Student Succeeds Act of 2015, Public Law 95, 114th Cong., 1st sess. (December 10, 2015).
2 Ibid.
3 David Figlio and Susanna Loeb, “School Accountabil-ity.” In Eric A. Hanushek, Stephen Machin, and Ludger Woessmann, eds., Economics of Education, Vol. 3 (Am-sterdam: Elsevier B.V., 2011), available at https://cepa.stanford.edu/sites/default/files/Accountability_Hand-book.pdf.
4 Ibid.
5 No Child Left Behind Act of 2001, Public Law 110, 107th Cong., 1st sess. (January 8, 2002).
6 Every Student Succeeds Act of 2015.
7 Janet Y. Thomas and Kevin P. Brady, “Chapter 3: The Elementary and Secondary Education Act at 50: Equity, Accountability, and the Evolving Federal Role in Public Education,” Review of Research in Education 29 (1) (2005): 51–67, available at http://isites.harvard.edu/fs/docs/icb.topic460284.files/ESEA%20at%2040.pdf.
8 Improving America’s Schools Act of 1994, Public Law 382, 103d Cong., 2d sess. (October 20, 1994).
9 David J. Deming and others, “When Does Accountabil-ity Work?”, Education Next 16 (1) (2016): 71–76, available at http://educationnext.org/when-does-accountability-work-texas-system/.
10 Ibid.
11 Massachusetts Department of Elementary and Second-ary Education, “Building on 20 Years of Massachusetts Education Reform” (2014), available at http://www.doe.mass.edu/commissioner/BuildingOnReform.pdf; Mas-sachusetts Department of Elementary and Secondary Education, “School and District Accountability System” (1999), available at http://www.doe.mass.edu/lawsregs/accountibility.pdf.
12 Massachusetts Department of Elementary and Second-ary Education, “School and District Accountability System.”
13 No Child Left Behind Act of 2001.
14 Ibid.
15 Ibid.
16 Alyson Klein, “No Child Left Behind: An Overview,” Education Week, April 10, 2015, available at http://www.edweek.org/ew/section/multimedia/no-child-left-behind-overview-definition-summary.html.
17 Sam Dillon, “Federal Researchers Find Lower Standards in Schools,” The New York Times, October 29, 2009, available at http://www.nytimes.com/2009/10/30/education/30educ.html?_r=0.
18 Ibid.
19 Education Week, “Adequate Yearly Progress,” July 18, 2011, available at http://www.edweek.org/ew/issues/adequate-yearly-progress/.
20 Klein, “No Child Left Behind: An Overview”; Dillon, “Federal Researchers Find Lower Standards in Schools”; Michele McNeil, “Are 82% of Schools ‘Failing’ Under NCLB, as Duncan Warned?”, Politics K-12, August 3, 2011, available at http://blogs.edweek.org/edweek/campaign-k-12/2011/08/are_82_of_schools_fail-ing_unde.html.
21 Education Week, “No Child Left Behind.”
22 U.S. Department of Education, ESEA Flexibility (2012), available at http://www2.ed.gov/policy/eseaflex/approved-requests/flexrequest.doc.
23 Ibid.
24 U.S. Department of Education, “ESEA Flexibility,” avail-able at http://www2.ed.gov/policy/elsec/guid/esea-flexibility/index.html (last accessed April 2016).
25 Note that the analysis of school accountability in South Carolina is based on the state’s 2014 federal account-ability system.
26 Based on authors’ analysis using data from Elementary and Secondary Education Act flexibility waivers, state accountability workbooks, and information and materi-als from state departments of education. See Appendix D for full source list.
27 Ibid.
28 West Virginia Department of Education, “Technical Fact Sheet: Understanding the West Virginia Accountability Index (WVAI),” available at http://wvde.state.wv.us/esea/support/Documents/Technical%20Fact%20Sheet_Understanding%20the%20WV%20Account-ability%20Index.pdf (last accessed March 2016); West Virginia Department of Education, “ESEA Flexibility Renewal Form” (2015), available at http://www2.ed.gov/policy/elsec/guid/esea-flexibility/flex-renewal/wvrenewalreq2015.pdf.
29 AQuESTT for Nebraska, “AQuESTT Classification System” (2015), available at http://aquestt.com/wp-content/uploads/2015/12/AQuESTTFinalClassificationBusiness-RulesSB2015.pdf.
30 Partnership for Assessment of Readiness for College and Careers, “States,” available at http://parcconline.org/about/states (last accessed March 2016); Smarter Balanced Assessment Consortium, “Members and Governance,” available at http://www.smarterbalanced.org/about/members/ (last accessed March 2016); Julie Rowland Woods, “State Summative Assessments: 2015-16 school year” (Denver: Education Commission of the States, 2015), available at http://www.ecs.org/ec-content/uploads/12141.pdf.
31 Woods, “State Summative Assessments: 2015-16 school year”; Kentucky Department of Education, “Kentucky ESEA Flexibility Request,” March 13, 2015, available at http://www2.ed.gov/policy/eseaflex/approved-requests/ky3req32015.doc; Texas Education Agency, “STAAR Resources,” http://tea.texas.gov/student.assess-ment/staar/ (last accessed March 2016).

90 Center for American Progress | Making the Grade
32 Wisconsin Department of Public Instruction, “Informa-tion for Families About Assessment in Wisconsin,” available at http://dpi.wi.gov/assessment/parent-info (last accessed March 2016); Wyoming Department of Education, “State Assessment System,” available at http://edu.wyoming.gov/educators/state-assessment/ (last accessed March 2016); Woods, “State Summative Assessments: 2015-16 school year.”
33 Maryland State Department of Education, “Maryland ESEA Flexibility Request” (2015), available at http://www2.ed.gov/policy/elsec/guid/esea-flexibility/flex-renewal/mdrenewalreq2015.pdf.
34 Institute of Education Sciences, “Technical Methods Re-port: Using State Tests in Education Experiments: Analy-sis of Scale, Proficiency Level, or Other Test Scores,” available at https://ies.ed.gov/ncee/pubs/2009013/section_3c.asp (last accessed April 2016).
35 State of South Carolina, “ESEA Flexibility Request” (2015), available at http://www2.ed.gov/policy/elsec/guid/esea-flexibility/flex-renewal/screnewalreq2015.pdf.
36 Institute of Education Sciences, “Technical Methods Report”; South Carolina Department of Education Of-fice of Assessment, “SCPASS Score Report User’s Guide” (2015), available at http://ed.sc.gov/tests/middle/scpass/scpass-score-report-user-s-guide/.
37 Based on authors’ analysis using data from ESEA flex-ibility waivers, state accountability workbooks, and information and materials from state departments of education. See Appendix D for full source list.
38 Ibid.
39 Maryland Classroom, “School Progress Index,” 18 (3) (2012), available at http://www.marylandpublicschools.org/mdclassroom/Vol18_No3_122012.pdf; Delaware Department of Education, “Delaware School Success Framework Reference Guide (2015-16),” available at http://www.doe.k12.de.us/cms/lib09/DE01922744/Centricity/Domain/404/Delaware%20School%20Suc-cess%20Framework%20Reference%20Guide%202015-2016.pdf (last accessed April 2016).
40 Oregon Department of Education, “ESEA Flexibility Re-quest” (2015), available at http://www2.ed.gov/policy/elsec/guid/esea-flexibility/flex-renewal/orrenewal-req2015.pdf; Minnesota Department of Education, “ESEA Flexibility Renewal,” March 31, 2015, available at http://www2.ed.gov/policy/eseaflex/approved-requests/mnreq32015.doc; Colorado Department of Education, “ESEA Flexibility Request” (2015), available at http://www2.ed.gov/policy/elsec/guid/esea-flexibility/flex-renewal/coflexrenewal11192015.pdf.
41 State of Washington Office of Superintendent of Public Instruction, “Assessment/Testing: Student Growth Percentiles: FAQ,” available at http://www.k12.wa.us/assessment/SGP/FAQ.aspx (last accessed March 2016).
42 Colorado Department of Education, “ESEA Flex-ibility Request”; Colorado Department of Education, “Adequate Growth Basics (TCAP/CSAP),” available at https://www.cde.state.co.us/sites/default/files/docu-ments/uip/downloads/dataanalysisi_trainingmaterials/adequategrowthbasics.pdf (last accessed March 2016).
43 Florida Department of Education, “2014-15 Guide to Calculating Informational Baseline School and District Grades” (2016), available at http://schoolgrades.fldoe.org/pdf/1415/SchoolGradesCalcGuide15.pdf.
44 Pennsylvania Department of Education, “ESEA Flexibil-ity Request from Pennsylvania”; Tennessee Department of Education, “Tennessee ESEA Flexibility Request” (2015), available at http://www2.ed.gov/policy/elsec/guid/esea-flexibility/flex-renewal/tnrenewalreq2015.pdf.
45 Kimberly O’Malley and others, “Making Sense of the Metrics: Student Growth, Value-added Models, and Teacher Effectiveness,” Pearson Assessments Bulletin (19) (2011): 1–4, available at http://researchnetwork.pearson.com/wp-content/uploads/F143689371.pdf.
46 Three additional states weight student growth, for a to-tal of 35 states, but the weighting is either captured by the weighting of the state’s achievement indicators or factored into the state’s accountability system through bonus points.
47 Based on authors’ analysis using data from ESEA flex-ibility waivers, state accountability workbooks, and information and materials from state departments of education. See Appendix D for full source list.
48 Ibid.
49 Ibid.
50 No Child Left Behind Act of 2001.
51 Based on authors’ analysis using data from ESEA flex-ibility waivers, state accountability workbooks, and information and materials from state departments of education. See Appendix D for full source list.
52 Arizona Department of Education, “Arizona’s Transition to a New Accountability System for Public Schools and Districts” (2015), available at http://www.azed.gov/ac-countability/files/2015/05/2015-arizona%E2%80%99s-transition-to-a-new-accountability-system-for-public-schools-and-districts.pdf.
53 Georgia Department of Education, “2016 CCRPI Indicators” (2015), available at http://www.gadoe.org/Curriculum-Instruction-and-Assessment/Accountabili-ty/Documents/Indicators%20and%20Targets/2016%20Indicators.pdf.
54 Illinois Department of Education, “ESEA Flexibility,” April 18, 2014, available at http://www2.ed.gov/policy/eseaf-lex/secretary-letters/ilrequest42014.doc.
55 Based on authors’ analysis using data from ESEA flex-ibility waivers, state accountability workbooks, and information and materials from state departments of education. See Appendix D for full source list.
56 Data Quality Campaign, “Using Early Warning Data to Keep Students on Track toward College and Careers: A Primer for State Policymakers” (2013), available at http://dataqualitycampaign.org/resource/using-early-warning-data-keep-students-track-toward-college-careers/.
57 Lindsay Pinkus, “Using Early-Warning Data to Improve Graduation Rates: Closing Cracks in the Education System” (Washington: Alliance for Excellent Education, 2008), available at http://beta.fresnounified.org/gradtf/Shared%20Documents/Using%20Early%20Warn-ing%20Data%20to%20Improve%20Graduation%20Rates,%20Closing%20Cracks%20in%20the%20Educa-tion%20System.pdf.
58 Data Quality Campaign, “Using Early Warning Data to Keep Students on Track toward College and Careers.”
91 Center for American Progress | Making the Grade
59 U.S. Department of Education, “Approved State Ac-countability Plans,” available at http://www2.ed.gov/admins/lead/account/stateplans03/index.html (last accessed April 2016).
60 Attendance Works, “What is Chronic Absence?” (2011), available at http://www.attendanceworks.org/word-press/wp-content/uploads/2011/06/What-is-Chronic-Absence.pdf.
61 Based on authors’ analysis using data from ESEA flex-ibility waivers, state accountability workbooks, and information and materials from state departments of education. See Appendix D for full source list.
62 Connecticut Department of Education, “Connecticut ESEA Flexibility Request” (2015), available at http://www2.ed.gov/policy/elsec/guid/esea-flexibility/flex-renewal/ctrenewalreq2015.pdf; Louisiana Department of Education, “School Performance Score,” available at https://www.louisianabelieves.com/accountability/school-performance-scores (last accessed April 2016).
63 Based on authors’ analysis using data from ESEA flex-ibility waivers, state accountability workbooks, and information and materials from state departments of education. See Appendix D for full source list.
64 Ibid.
65 Ibid.
66 Ibid.
67 Ibid.
68 Ibid.
69 Department of Assessment and Accountability, Division of Performance Reporting, “Chapter 4 – Performance Index Indicators.” In Texas Education Agency, “2015 Ac-countability Manual” (2015), available at https://rptsvr1.tea.texas.gov/perfreport//account/2015/manual/Chap-ter%2004_Final.pdf.
70 Virginia Department of Education, “Accountability in Virginia Public Schools” (2015), available at http://www.doe.virginia.gov/statistics_reports/school_report_card/accountability_guide.pdf.
71 South Dakota Department of Education, “ESEA Flex-ibility Renewal” (2015), available at http://www2.ed.gov/policy/elsec/guid/esea-flexibility/flex-renewal/sdrenewalreq2015.pdf.
72 Based on authors’ analysis using data from ESEA flex-ibility waivers, state accountability workbooks, and information and materials from state departments of education. See Appendix D for full source list.
73 Ibid.
74 Ibid.
75 Ibid.
76 Utah State Office of Education, “2015 Utah Account-ability Technical Manual” (2015), available at http://www.schools.utah.gov/assessment/Accountability/TechnicalManual.aspx; New Mexico Public Education Department, “New Mexico ESEA Flexibility Request” (2015), available at http://www2.ed.gov/policy/eseaflex/approved-requests/nmrequest12082015.pdf; Nevada Department of Education, “ESEA Flexibility Request” (2015), available at http://www2.ed.gov/policy/elsec/guid/esea-flexibility/flex-renewal/nvrenewalreq2015.pdf.
77 Based on authors’ analysis using data from ESEA flex-ibility waivers, state accountability workbooks, and information and materials from state departments of education. See Appendix D for full source list.
78 Ibid.
79 Ibid.
80 Ibid.
81 Virginia Department of Education, “Virginia Index of Performance (VIP) Program: 2015-2016 VIP Awards Criteria,” available at http://doe.virginia.gov/statistics_reports/va_index_performance_awards/criteria.shtml (last accessed April 2016).
82 Ohio Department of Education, “ESEA Flexibility Re-quest” (2015), available at http://www2.ed.gov/policy/elsec/guid/esea-flexibility/flex-renewal/ohrenewal-req2015.pdf.
83 Georgia Department of Education, “2016 CCRPI Indica-tors.”
84 Iowa Department of Education, “Iowa School Report Card – Technical Guide, version 1.1” (2016), available at http://reports.educateiowa.gov/schoolreportcard//content/Technical%20Guilde-Iowa%20Report%20Card.pdf.
85 Illinois Department of Education, “ESEA Flexibility.”
86 New Mexico Public Education Department, “New Mexico School Grading Technical Guide: Calculation and Business Rules, School Year 2014-2015” (2015), available at http://webapp2.ped.state.nm.us/School-Data/docs/Technical_Guide_2015_V2.0.pdf.
87 Georgia Department of Education, “2016 CCRPI Indica-tors.”
88 CORE Districts, “About Us,” available at http://core-districts.org/why-is-core-needed/ (last accessed May 2016).
89 CORE Districts, “A Technical Guide to the CORE School Quality Improvement Index: SY 2014-15” (2015), available at http://coredistricts.org/wp-content/uploads/2016/02/CORE-Index-Technical-Guide-SY-2014-15-updated-2.1.16.pdf.
90 Ibid.
91 No Child Left Behind Act of 2001.
92 Oklahoma Department of Education, “A to F Report Card Calculation Guide” (2015), available at http://sde.ok.gov/sde/sites/ok.gov.sde/files/documents/files/AtoFReportCardGuide.pdf.
93 Rhode Island Department of Elementary and Second-ary Education, “Rhode Island School and District Accountability System ESEA Flexibility under NCLB: Technical Bulletin” (2012), available at http://www.ride.ri.gov/Portals/0/Uploads/Documents/Students-and-Families-Great-Schools/RI-Public-Schools/RIAccount-abilityTechnicalBulletin.pdf.
94 South Carolina Department of Education, “ESEA Federal Accountability System Components” (2014), available at http://ed.sc.gov/assets/reportCards/federal-account-ability/esea/2014/ESEA_2014_Brief_Technical_Docu-ment.pdf.
92 Center for American Progress | Making the Grade
95 Every Student Succeeds Act of 2015; Education Week, “The Every Student Succeeds Act: Explained,” De-cember 8, 2015, available at www.edweek.org/ew/articles/2015/12/07/the-every-student-succeeds-act-explained.html.
96 Based on authors’ analysis using data from ESEA flex-ibility waivers, state accountability workbooks, and information and materials from state departments of education. See Appendix D for full source list.
97 CORE Districts and San Francisco Public Schools, “School Quality Improvement Index: Committee of the Whole” (2015), available at http://www.sfusd.edu/en/assets/sfusd-staff/about-SFUSD/files/board-presentations/COW%20Presentation%20School%20Reports%20and%20Surveys_FINAL%20111715.pdf.
98 Every Student Succeeds Act of 2015.
99 Massachusetts Department of Elementary and Second-ary Education, “Understanding Massachusetts’ Account-ability Measures” (2015), available at http://www.mass.gov/edu/docs/ese/accountability/annual-reports/lea-brochure.pdf; Georgia Department of Education, “2016 CCRPI Indicators”; Every Student Succeeds Act of 2015.
100 Every Student Succeeds Act of 2015.
101 Based on authors’ analysis using data from ESEA flex-ibility waivers, state accountability workbooks, and information and materials from state departments of education. See Appendix D for full source list.
102 Ibid.
103 Every Student Succeeds Act of 2015.
104 Based on authors’ analysis using data from ESEA flex-ibility waivers, state accountability workbooks, and information and materials from state departments of education. See Appendix D for full source list.
105 No Child Left Behind Act of 2001.
106 Every Student Succeeds Act of 2015.
107 Ibid.

1333 H STREET, NW, 10TH FLOOR, WASHINGTON, DC 20005 • TEL: 202-682-1611 • FAX: 202-682-1867 • WWW.AMERICANPROGRESS.ORG
Our Mission
The Center for American Progress is an independent, nonpartisan policy institute that is dedicated to improving the lives of all Americans, through bold, progressive ideas, as well as strong leadership and concerted action. Our aim is not just to change the conversation, but to change the country.
Our Values
As progressives, we believe America should be a land of boundless opportunity, where people can climb the ladder of economic mobility. We believe we owe it to future generations to protect the planet and promote peace and shared global prosperity.
And we believe an effective government can earn the trust of the American people, champion the common good over narrow self-interest, and harness the strength of our diversity.
Our Approach
We develop new policy ideas, challenge the media to cover the issues that truly matter, and shape the national debate. With policy teams in major issue areas, American Progress can think creatively at the cross-section of traditional boundaries to develop ideas for policymakers that lead to real change. By employing an extensive communications and outreach effort that we adapt to a rapidly changing media landscape, we move our ideas aggressively in the national policy debate.