making the performance of buildings transparent
TRANSCRIPT

Making the performance of buildings transparent
A low hanging policy option to save energy and carbon
Report to New Zealand Green Building Council
12 October 2021

MAKING T HE PER FOR MANCE O F B UILDINGS TRANSPAR ENT A L OW H ANGING POLIC Y OPTI ON TO SAVE E NERGY
AND CARBON
1
Executive Summary Context
Reducing energy consumption is a critical component of decarbonisation. Energy savings in
the commercial building sector represent a cost-effective quick win for carbon reduction.
Evidence supports the use of a mandatory disclosure regimes for building energy efficiency.
This option corrects a set of market failures to achieve lower energy consumption at a
considerable benefit to the market.
This is readily implementable, at a lower cost and complexity than minimum standards. Over
time, minimum standards may be necessary from a practical perspective to shore up the
incentive structure, but this should come after a mandatory scheme is well embedded.
Mandatory disclosure works
A mandatory disclosure scheme applied to a buildings base energy performance could
represent present value benefits between $117.5m and $181.3m over a 10-year period at a
cost of $60m - $70m. Mandatory disclosure delivers considerable energy savings for those
buildings covered by the scheme.
Such a policy could abate between 113,200 and 174,900 tonnes of CO2 eq over a 10-year
period at a net benefit of $597/tonne.
Recommendations
• Adopt a mandatory energy efficiency disclosure regime for large commercial buildings
using the NABERSNZ framework – similar to Australia and consistent with advice from
the Climate Change Commission.
• Begin applying the mandatory requirement to buildings over 2000m2. Larger
buildings are more energy intensive, are better able to achieve economies of scale,
and their owners are generally better capitalised. This will facilitate implementation
and results.
• Over time, the policy should be extended to buildings above 1000m2. This will work to
maximise energy savings. The policy should not be extended to buildings below
1000m2. Poor economies of scale, and their generally lower energy intensity mean
energy savings are likely to be minimal and net benefits negative.
• Over time, the policy should be extended to other building typologies, such as hotels,
public hospitals and retail buildings.
$597.46
Net benefit per T CO₂ eq.
abated
113,000 – 175,000
T CO₂ eq. abated.

MAKING T HE PER FOR MANCE O F B UILDINGS TRANSPAR ENT A L OW H ANGING POLIC Y OPTI ON TO SAVE E NERGY
AND CARBON
2
Contents
Executive Summary ................................................................................................. 1
Context ................................................................................................................ 1
Mandatory disclosure works ............................................................................... 1
Recommendations .............................................................................................. 1
Context .................................................................................................................... 3
Decarbonisation will need more electricity supply ............................................ 3
Efficiency gains will reduce demand ................................................................... 3
The problem ............................................................................................................ 6
Two types of market failures .............................................................................. 6
Lease types matter .......................................................................................... 7
A range of solutions ................................................................................................ 8
Dealing with information asymmetries and salience bias .............................. 8
Dealing with emissions externalities ............................................................... 9
The government operates across a policy spectrum ...................................... 9
NABERSNZ CBA and refresh .......................................................................... 11
Voluntary versus mandatory disclosure ....................................................... 13
Market – Policy Interaction ........................................................................... 15
Conclusion ............................................................................................................. 17
Recommendation .............................................................................................. 17

MAKING T HE PER FOR MANCE O F B UILDINGS TRANSPAR ENT A L OW H ANGING POLIC Y OPTI ON TO SAVE E NERGY
AND CARBON
3
Context The New Zealand Green Building Council asked Sense Partners to explore policy options to
improve energy efficiency of existing commercial buildings, consistent with the Climate
Change Commission’s recommendation to implemented measures to improve the energy
performance and reporting of energy intensity of existing buildings by 31 December 2022. The
policy framework should be a “progressive realisation and constructive accountability” to
reduce emissions from buildings.
Decarbonisation will need more electricity supply
Moderating the global average temperature increases of climate change requires deep and
broad decarbonisation of the global economy. Though small in a global context, as a high per-
capita emitter New Zealand has a leadership role to play in decarbonisation.
One side of decarbonisation is the move toward sustainable and renewable sources of energy.
To do this through the supply side alone is an enormous task, if we do not fast-track
emergency efficiency in all parts of the economy.
Reducing emissions in transport and process heat will result in a surge in electricity
consumption, as cars switch over from petroleum and as process heat is electrified. This may
increase electricity demand by 68% by 20501. With around 80%2 of New Zealand’s electricity
generation coming from renewable sources, there is a need to decarbonise both the current
supply and to meet future demand with significant expansion of renewable generation.
Figure 1: Total Electricity Demand – Expected Increase to 2050.
Source: Transpower, Sense Partners
It will be immensely costly and challenging to decarbonise electricity solely through supply
side policies. There are several policy options to encourage energy efficiency, reducing the
amount of additional new electricity required. A mix of supply and demand initiatives will
make a greener economy that is also more cost effective.
Efficiency gains will reduce demand
International experience, in particular Australia, shows relatively easy energy savings in the
existing building stock. Small nudges that fast track building upgrades can significantly reduce
energy consumption. The Commercial Building Disclosure (CBD) Program is a regulatory
1 Transpower. 2020. Whakamana I Te Mauri Hiko: Empowering our Energy Future
70 TWh
2050
42 TWh
2020

MAKING T HE PER FOR MANCE O F B UILDINGS TRANSPAR ENT A L OW H ANGING POLIC Y OPTI ON TO SAVE E NERGY
AND CARBON
4
program that requires energy efficiency information to be provided in most cases when
commercial office space of 1000 square metres or more is offered for sale or lease.
A production-oriented view of emissions, the typical approach, shows that emissions from the
building stock are between 4.2% and 6.7%2 of total GHGs (2019). However, taking a
consumption-oriented view of emissions, which more accurately reflects the carbon intensity
of our lifestyles, can yield an estimate closer to 20% of GHGs3. This is comparable to
international figures, as it accounts for the distortion created by the high exports of the
agriculture sector. Our existing buildings are clearly large emitters.
The Climate Change Commission’s Advice to the New Zealand Government on its first three
emissions budgets and direction for its emissions reduction plan 2022 – 2025 recommended
“developing a plan to transform buildings to be low emissions and climate resilient.”4
Recommendation 22 specifically noted [emphasis added]:
1. Government to have, by 31 December 2022, implemented measures to improve the
energy performance of existing buildings, such as mandating participation in
energy performance programmes.
2. Government to have, by 30 June 2022, scaled up energy efficiency assistance to low-
income households.
3. Government to report annually, from 31 December 2022, on a suite of indicators,
including residential and commercial energy intensity.
The Climate Change Commission is recommending progressive realisation and constructive
accountability to reduce emissions from buildings. This is an important framework to
consider our policy options.
The residential sector, our homes, consume just under a third (32%5) of New Zealand’s
electricity, while the commercial office sector consumes just under a quarter (23.7%1). Though
lower than residential, energy consumption within the commercial sector is relatively
concentrated in larger, more energy intensive buildings. This concentration and economies of
scale for relative will make a targeted response more achievable and will enable energy
savings to be achieved in a shorter time span.
Commercial sector energy consumption has flattened in the last decade, mainly due to energy
efficiency gains.6 Despite this flatlining, more is required to offset increasing energy demand
from other sectors. We believe there are market failures when it comes to energy efficiency
improvements for existing buildings, which current policies do not remedy. Further policy
action is needed.
2 Calculated using emissions data from MfE (see above) and electricity consumption data from MBIE (see 4 below). 3 Thinkstep Australasia. 2018. The carbon footprint of New Zealand’s built environment: hotspot or not? 4 Climate Change Commission. 2021. Recommendations from Ināia tonu nei: a low-emissions future for Aotearoa 5 Ministry of Business, Innovation, and Employment. 2021. Quarterly Electricity Generation and Consumption Data
Updates 6 Calculated using data from Valocity and MBIE.

MAKING T HE PER FOR MANCE O F B UILDINGS TRANSPAR ENT A L OW H ANGING POLIC Y OPTI ON TO SAVE E NERGY
AND CARBON
5
Figure 2: Energy Use Intensity (EUI) Concentration.
Source: Valocity, MBIE, Sense Partners
Figure 3: Energy use has stabilised in recent years due mainly to efficiency gains
Source: MBIE, Sense Partners
Figure 4: Energy Use Intensity (EUI) Reduction 2016 – 2021.
Source: Valocity, MBIE, Sense Partners
-
1
2
3
4
5
6
7
8
9
10
10
15
20
25
30
35
40
45
1974 1979 1984 1989 1994 1999 2004 2009 2014 2019
GW
H, 0
00
s
GW
H, 0
00
s
New Zealand Energy Consumption
Consumption (Left Axis) Commercial (Right Axis)
1,482 GWh Electricity
Consumed Annually
2,858 Buildings
Above 1,000m² Net Leasable Area
9,140,000m²
Total Floor Area
1,946 GWh Electricity
Consumed Annually
10,979 Buildings
Commercial Offices
6,960,000m²
76.1% of Total Floor Area
Energy Consumption is Concentrated in Larger Buildings
214.2 kWh/m²
2021
230.7 kWh/m²
2016

MAKING T HE PER FOR MANCE O F B UILDINGS TRANSPAR ENT A L OW H ANGING POLIC Y OPTI ON TO SAVE E NERGY
AND CARBON
6
Some policy interventions are already in place, and more are being developed, to improve
energy efficiency in the commercial building sector. This includes the Ministry of Business,
Innovation, and Employment’s (MBIE) contribution to the Emissions Reduction Plan, which
places caps on Energy Use Intensity (EUI) in new commercial buildings. But we need to also
improve the existing stock.
Other policies also help. The New Zealand Emissions Trading Scheme (NZ ETS), which includes
electricity generation, aims to use market mechanisms (prices) to induce greater energy
efficiency. A higher carbon price could send the price signal toward more energy efficiency.
There are multiple policy avenues and they all need to work in concert and in coordination.
The problem Two types of market failures
We observe two types of market failures when it comes to emissions from commercial
buildings. The first is from mispricing of externalities (or the environmental and social cost)
from emissions. The second is from information asymmetries and misalignment of incentives.
Both of these market failures lead to lower energy efficiency than is socially optimal, or
technically feasible.
When emissions aren’t accurately priced it is worthwhile for private owners to emit more. The
NZ ETS aims to remedy this market failure.
Figure 5: Stylised benefits of energy efficiency gains and related market failures
MAKI NG T HE PER FOR MANCE O F B UILDINGS TRANSPAR ENT A L OW H ANGING POLIC Y OPTI ON TO SAVE E NERGY
AND CARBON
7
The literature7 also identifies a second set of market failures, showing that the market is not
well-functioning. These include:
• Misaligned Incentives: The costs of achieving energy efficiency lie with the property
owner, yet the benefits of lower power bills typically lie with the tenant.
• Information Asymmetries: Prospective tenants typically do not have the same level of
information on the energy efficiency of buildings as the building owner has. The
building owner may also have less than perfect information.
• Salience Bias: The cost of rent, and the capital cost of efficiency improvements, are
more certain and upfront. In contrast, the payoff of energy efficiency is uncertain and
in the future. This difference in the salience of costs can impact decision making.
The first identified market failure, misaligned incentives, is a common feature of markets but is
corrected through the price mechanism. In a well-functioning market, we would expect the
price signal to align incentives, meaning a higher potential rent would incentivise building
owners to invest in efficiency.
It is the presence of the second set of market failures which prevents the alignment of
incentives through the price mechanism. A policy response which successfully mitigates the
impact of information asymmetries and salience biases will likely lead, by extension, to a more
accurate alignment of incentives.
Lease types matter
Lease types can affect the second set of market failures identified above. Leases for office
space may be gross or net8. In the former, the tenant pays a fixed amount per period which
includes both rent and expenses such as power. In the latter, the tenant will pay a fixed rent
with variable costs added on top of that.
For a gross lease, the issue of incentive alignment, information asymmetries, and salience bias
is largely corrected as the direct costs and benefits of energy efficiency lie completely with the
building owner. It is only in the case of a net lease, where variable energy costs are passed on
to the tenant, that the identified market failures are expected to occur. In New Zealand, net
leases are more common and hence misalignment of incentives and information asymmetries
are more prevalent.
7 See, for example: Centre for International Economics. 2019. Independent Review of the Commercial Building Disclosure
Program. pp.22 - 24 8 Energy Action. 2018. Mandatory Disclosure of NABERSNZ Rating for Office Buildings

MAKING T HE PER FOR MANCE O F B UILDINGS TRANSPAR ENT A L OW H ANGING POLIC Y OPTI ON TO SAVE E NERGY
AND CARBON
8
A range of solutions Literature and experience show that socially optimal and technically feasible energy efficiency
investments are not always put in place due to two broad sources of market failures. There
are a range of policy options to remedy these problems. It may not always be optimal or
feasible to implement potential (ultimate) solutions immediately, rather progressive realisation
and constructive accountability is a more sustainable and less disruptive approach.
Figure 6: Potential policy responses to known market failures
Dealing with information asymmetries and salience bias
For information asymmetry, a common policy response is mandatory information disclosure.
This can be seen in food labelling standards, whiteware energy efficiency standards9, and
more pertinent to this case, building energy efficiency standards (for example in Australia).
For Salience bias, the policy response is mandatory disclosure, but often extends to detailed
design of communicating that information through the visual design of labels (star, etc)10.
Information disclosure is at its core a low touch regulatory approach. It requires the
information to be disclosed, and leaves it to market participants to make their decisions. The
desired outcome is delivered through market forces. As part of their advice to Government,
9 See, for example: Delmas, M.; Fischlein, M. & Asensio O. 2013. “Information strategies and energy conservation
behaviour: A meta-analysis of experimental studies from 1975 to 2012.” Energy Policy. 61. pp.729-739. 10 London Economics. 2014. Study on the impact of the energy label – and potential changes to it – on consumer
understanding and on purchase decisions

MAKING T HE PER FOR MANCE O F B UILDINGS TRANSPAR ENT A L OW H ANGING POLIC Y OPTI ON TO SAVE E NERGY
AND CARBON
9
the Climate Change Commission has recommended11 that a mandatory building labelling
scheme be introduced to accelerate energy efficiency improvements in the existing
commercial building stock. We agree. Information disclosure is a relatively low cost and low
intervention policy.
A more interventionist approach is to mandate minimum standards of energy efficiency. This
requires all building owners to meet the minimum requirements, but does not necessarily
promote greater efficiency gains. This requires a greater regulatory intervention, monitoring
and enforcement.
The New Zealand Building Code is a good example, which sets the regulatory minimum for
building quality. While much higher standards are possible, the regulatory minimum becomes
the de facto target (rather than the minimum) for home builders.
Minimum standards are good for setting a floor on energy efficiency, but other policies are
needed to achieve higher efficiency gains.
Dealing with emissions externalities
For emissions, the simplest mechanism in theory is to price emissions and allow market forces
to take care of the details. This is what the NZ ETS aims to achieve by pricing the externality.
The NZ ETS includes electricity generation and industrial heating12. This means that a policy
framework, in the form of emissions pricing, is already in place. Assuming that the emissions
are properly priced, the externality has already been priced into the cost of energy and thus
does not require a further policy response.
If the true cost of emissions has not been fully priced in, then the simplest policy option is to
increase the price of emissions within the existing policy framework.
We could also introduce minimum required standards. This would create additional policy
structures, including additional enforcement and monitoring costs. Minimum standards can
impose a floor, but does not necessarily promote greater efficiency gains. The additional cost
and complexity, and foregone efficiency gains are unlikely to yield benefits beyond that of a
properly priced ETS.
The government operates across a policy spectrum
When we look at policy responses to market failures, we consider it in a spectrum across
intensity of intervention (which reflects the level of effort required by policy makers to achieve
desired outcomes) and associated costs and benefits.
Some low touch interventions aim to modify existing market forces to achieve objectives,
relying on market mechanisms to do the heavy lifting. Mandatory information disclosure could
be considered a light touch approach – where the government requires building owners to
11 He Pou a Rangi Climate Change Commissions. 2021. Ināia tonu nei: a low emissions future for Aotearoa 12 Ministry for the Environment. 2021. Coverage of the New Zealand Emissions Trading Scheme

MAKING T HE PER FOR MANCE O F B UILDINGS TRANSPAR ENT A L OW H ANGING POLIC Y OPTI ON TO SAVE E NERGY
AND CARBON
10
disclose energy efficiency information in a consistent manner at the time of sale or lease (as
required in Australia for commercial buildings above 1,000m2).
Toward the other end of the spectrum are policy options which involve a greater degree of
government intervention. These interventions may still seek to use market forces, though they
may also seek alternatives to market forces to achieve the desired outcome. Minimum energy
efficiency standards could fall in this category – where all buildings are required to lift energy
efficiency to a particular level, which would need to be monitored and enforced.
Figure 7: Policy interventions can go from light touch to heavy handed
Minimum standards could be used in response to both the information asymmetries and
emissions externalities market. However, there are some known risks. Implementation costs
may be higher, as a policy deadline may lead to a bottleneck of activity before the cut-off date,
driving up costs. It could lead to premature retirement of older buildings prior to end of life,
reducing supply of commercial space and potentially driving up rents. Those meeting
minimum standards may choose not to implement greater efficiency standards, since they
aren’t ‘required’.
Mandatory disclosure would harness market forces to achieve increased energy efficiency. The
cost of implementation is likely to be much lower, as a mandatory disclosure does not impose
upgrade costs, but may create incentives for building owners to invest in energy efficiency
upgrades to attract tenants and premium rents over time.13 This is a much more efficient
13 Centre for International Economics. 2019. Independent Review of the Commercial Building Disclosure Program.
Co
st/B
en
efi
t
Scope of Intervention
Cost of
Implementation
Policy Benefit
Laissez Faire Central Planning
Govt. Led
Mixed
Market Based
The Policy Spectrum – Cost and Benefit Trade-off
Scale is indicative, for illustrative purposes only

MAKING T HE PER FOR MANCE O F B UILDINGS TRANSPAR ENT A L OW H ANGING POLIC Y OPTI ON TO SAVE E NERGY
AND CARBON
11
approach from an asset management perspective, though would mean energy efficiencies are
potentially realised over a longer period.
NABERSNZ CBA and refresh
Energy Action14 conducted a Cost Benefit Analysis of building energy efficiency options on
behalf of EECA. A range of policy responses were assessed, including the mandatory
disclosure, and minimum standards for buildings housing public sector agencies. The policies
tested for various building sizes, with options for all buildings over 2000m2 and 1000m2 in net
rentable area.
The findings of this CBA, using the 1000m2 threshold, are summarised in reduced format in
Table 1 below. Mandatory disclosure delivers substantial energy savings and accompanying
financial benefits. This does not include any estimate of potential property value uplift, which
the literature indicates are likely15. The costs of $77.7m are small in the context of the overall
value of the property portfolio, an estimated $31.5b for all commercial offices16. Given that
these costs represent investments in each asset which will be reflected in its overall value,
rather than a sunk cost, it is reasonable to conclude that they are manageable.
Table 1: Reported Costs, benefits, and Energy Savings. Dollar values are discounted to 2018.
Option Cost ($M) Benefit ($M) Energy Savings (GWh)
Mandatory Disclosure 77.7 124.9 822
Minimum standard
public commercial
buildings
28.2 60.1 414
Both 82.5 141.4 949
We updated the 2018 CBA to 2021, applying the growth scenario seen in Australia17 to data
obtained from MBIE, MfE, and Valocity. We established two scenarios of building base energy
use intensity (EUI). The first is the EUI measured in Australia. Whether this is an accurate
reflection of New Zealand buildings is ambiguous, as while buildings in Australia will likely
require relatively more cooling, buildings in New Zealand will require relatively more heating.
The second scenario uses the EUI estimate used in the 2018 NABERS CBA.
14 Energy Action. 2018. Mandatory Disclosure of NABERSNZ Rating for Office Buildings. 15 See, for example: Leskinen, N.; Vimpari, J. & Junnila S. 2020. “A Review of the Impact of Green Building Certification on
the Cash Flows and Values of Commercial Properties.” Sustainability. 12(7)
And: Das, P. & Wiley, J. 2013. “Determinants of premia for energy efficient design in the office market.” Journal of Property
Research. 31(1), pp. 64 - 86 16 Data supplied by Valocity 17 Centre for International Economics. 2019. Independent Review of the Commercial Building Disclosure Program.
MAKING T HE PER FOR MANCE O F B UILDINGS TRAN SPAR ENT A L OW H ANGING POLIC Y OPTI ON TO SAVE E NERGY
AND CARBON
12
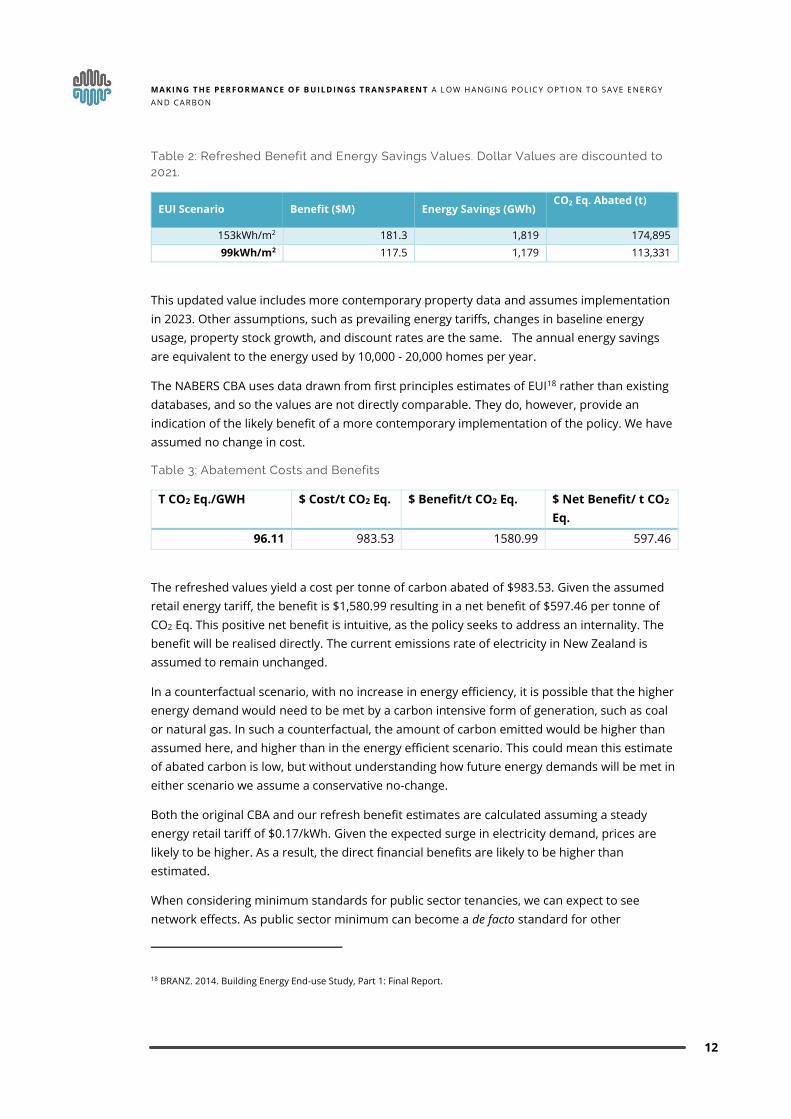
Table 2: Refreshed Benefit and Energy Savings Values. Dollar Values are discounted to 2021.
EUI Scenario Benefit ($M) Energy Savings (GWh) CO2 Eq. Abated (t)
153kWh/m2 181.3 1,819 174,895
99kWh/m2 117.5 1,179 113,331
This updated value includes more contemporary property data and assumes implementation
in 2023. Other assumptions, such as prevailing energy tariffs, changes in baseline energy
usage, property stock growth, and discount rates are the same. The annual energy savings
are equivalent to the energy used by 10,000 - 20,000 homes per year.
The NABERS CBA uses data drawn from first principles estimates of EUI18 rather than existing
databases, and so the values are not directly comparable. They do, however, provide an
indication of the likely benefit of a more contemporary implementation of the policy. We have
assumed no change in cost.
Table 3: Abatement Costs and Benefits
T CO2 Eq./GWH $ Cost/t CO2 Eq. $ Benefit/t CO2 Eq. $ Net Benefit/ t CO2
Eq.
96.11 983.53 1580.99 597.46
The refreshed values yield a cost per tonne of carbon abated of $983.53. Given the assumed
retail energy tariff, the benefit is $1,580.99 resulting in a net benefit of $597.46 per tonne of
CO2 Eq. This positive net benefit is intuitive, as the policy seeks to address an internality. The
benefit will be realised directly. The current emissions rate of electricity in New Zealand is
assumed to remain unchanged.
In a counterfactual scenario, with no increase in energy efficiency, it is possible that the higher
energy demand would need to be met by a carbon intensive form of generation, such as coal
or natural gas. In such a counterfactual, the amount of carbon emitted would be higher than
assumed here, and higher than in the energy efficient scenario. This could mean this estimate
of abated carbon is low, but without understanding how future energy demands will be met in
either scenario we assume a conservative no-change.
Both the original CBA and our refresh benefit estimates are calculated assuming a steady
energy retail tariff of $0.17/kWh. Given the expected surge in electricity demand, prices are
likely to be higher. As a result, the direct financial benefits are likely to be higher than
estimated.
When considering minimum standards for public sector tenancies, we can expect to see
network effects. As public sector minimum can become a de facto standard for other
18 BRANZ. 2014. Building Energy End-use Study, Part 1: Final Report.

MAKING T HE PER FOR MANCE O F B UILDINGS TRANSPAR ENT A L OW H ANGING POLIC Y OPTI ON TO SAVE E NERGY
AND CARBON
13
commercial tenants. These should lead to other buildings improving their energy efficiency in
anticipation of being able to compete for public sector tenants. This is justified, as restricting
public sector agencies to the smaller portion of buildings which meet the rating may, in effect,
constitute a restriction of supply. Those building owners may subsequently have the ability to
demand a higher price, an opportunity other building owners are likely to be tempted by.
Mandatory disclosure and minimum standards are expected to have a broadly similar impact
on energy efficiency over time. The difference is that a minimum standard would require that
those benefits occur sooner than they would under a mandatory disclosure policy. The
assessment period of this CBA is 10 years, which largely explains the higher energy savings of
a combination of these policies compared to mandatory disclosure alone. The reason the
benefits are expected to be largely the same comes down to the market dynamics at play.
As we show below, all scenarios impose costs but all return net benefits.
Figure 8: Benefit-Cost Scatter Plot. CBA Reported Values.
Table 4: Reported Net Benefits, BCRs, and Energy Savings. Dollar values are discounted to 2018.
Option Net Benefits ($M) BCR Energy Savings
($M/GWh)
Mandatory Disc. 47.2 1.61 0.095
Min. Std. - Publ. 31.9 2.13 0.068
Both 58.9 1.71 0.087
Voluntary versus mandatory disclosure
0
20
40
60
80
100
120
140
160
0 20 40 60 80 100 120 140 160
Be
ne
fit
($M
)
Cost ($M)
Benefit - Cost
Govt. CBD (1000m2) Govt. CBD (2000m2) CBD (1000m2) CBD (2000m2)
Min St Pb (1000m2) Min St Pb (2000m2) Both (1000m2) Both (2000m2)

MAKING T HE PER FOR MANCE O F B UILDINGS TRANSPAR ENT A L OW H ANGING POLIC Y OPTI ON TO SAVE E NERGY
AND CARBON
14
The CBA shows that benefits outweigh costs. Also that light touch interventions impose less
immediate costs, although lead to similar energy savings over time.
New Zealand currently has a voluntary disclosure regime for NABERSNZ. Some buildings get it,
but it is not universal and does not deliver the benefit of mandatory disclosure, which is easy
comparability of all rated buildings.
Voluntary schemes help, but do not solve information asymmetry
In a voluntary scheme, obtaining a certification generally forms part of a wider strategy of
asset renewal targeting the prime property market. That is, it can be a signalling tool for
quality. Studies19 indicate that participation is dominated by the prime property market,
particularly larger commercial buildings. The certification itself was primarily a market
signalling device20, with the intention being to signal differentiation from other alternatives.
Many studies, most using hedonic regression models21, found positive correlations between
certification and rent premium, occupancy rates, and property value as well as, crucially,
substantially lower energy consumption22 and thus costs. Because the certification is most
often associated with a broader premium strategy, certification is closely linked to other
drivers of property value23. For example, aesthetic building design, location, proximity to
amenities, and so forth. Some studies have noted this when reporting no evidence of value
uplift24.
Despite the clear financial incentive in terms of energy savings, the market dynamics are such
that the main purpose of voluntarily obtaining a certification remains to signal quality.
Evidence from the UK25 indicates that in a highly competitive market, voluntary schemes can
become market mandatory. Those buildings without these signals of quality are reported
through interviews to be much harder to sell or lease, and it is commonly perceived that these
voluntary certifications are an essential component of a property strategy.
19 Asensio, O. & Delmas, M. 2017. “The Effectiveness of US Energy Efficiency Building Labels.” Nature Energy. 2. 20 German Sustainable Building Council. 2019. Added value of certified buildings. 21 See again, for best example: Leskinen, N.; Vimpari, J. & Junnila S. 2020. “A Review of the Impact of Green Building
Certification on the Cash Flows and Values of Commercial Properties.” Sustainability. 12(7).
Also: Fuerst, F. & McAllister, P. 2009. “An Investigation of the Effect of Eco-Labeling [sic] on Office Occupancy Rates.”
Journal of Sustainable Real Estate. 1. pp. 49-64
For an example on residential buildings: Pommeranz, C. & Steininger, B. 2021. “What Drives the Premium for Energy-
Efficient Apartments – Green Awareness of Purchasing Power?” Journal of Real Estate Finance and Economics. 62. pp. 220-
241. 22 See again: Asensio and Delmas. 2010. above.
Also: Hicks, T. & Neida, B. 2003. U.S. National Energy Performance Rating System and ENERGY STAR Building Certification
Program. 23 See, for example: Cass, N. 2020. “Energy and Sustainability Labels in the Commercial Office Market in the UK” in
Labelling the Economy, edited by Laurent, B. & Mallard, A. Palgrave Macmillan, Singapore.
And: Brocklehurst, F. 2017. “What will you pay for an “A”? – a review of the impact of building energy efficiency labelling on
building value.” ECEEE Summer Study Proceedings. pp.1259-1269 24 See commentary in Asensio & Delmas 2017. above. 25 See again: Cass, N. 2020. above.

MAKING T HE PER FOR MANCE O F B UILDINGS TRANSPAR ENT A L OW H ANGIN G POLIC Y OPTI ON TO SAVE E NERGY
AND CARBON
15
Mandatory schemes are a policy tool
In the case of a mandatory scheme, certification becomes a necessity and level of energy
efficiency becomes the point of differentiation, rather than the certification itself26.
In terms of the physical implementation, voluntary certification tends to coincide with end-of-
life asset renewal or new builds. That is voluntary schemes are an add-on to planned
upgrades. With a mandatory scheme, low-cost actions may be taken swiftly, but capital-
intensive renovations are typically left to end of life renewal.27. This suggests a mandatory
schemes fast-tracks low cost efficiency gains, but larger upgrades and benefits are spread over
time (making the upgrade cycle manageable and cost effective).
Ratings need to balance incentives for immediate and long term efficiency gains
Most schemes typically leave it up to individual developers and building owners to decide what
energy efficiency investments they will make. Building managers will readily take low-cost
actions first, but leave larger, capital intensive changes until end-of-life renewal28.
The certification regime needs to carefully balance the relationship between actions and the
ratings they can earn. If low cost, low impact actions are given too high weighting, then
building managers will game the system to achieve a higher rating, at minimal cost, and with
little realised energy saving benefit.
The initial rating schemes in the UK set a reasonably low standard, but improvements over
time have led to those certifications setting quite a high bar.29
Ratings on one building type can go on to cover other buildings. NABERS in Australia now
covers retail, data centres, hospitals, warehouses, aged care, hotels and retirement living.
Market – Policy Interaction
In New Zealand, voluntary certification is not yet widespread. Unlike the UK, the voluntary
scheme has not become a de facto minimum standard for the market. It may be that there is
insufficient brand awareness of what a certification constitutes, and subsequently prospective
tenants are not fully aware of the information asymmetry they face. A mandatory scheme
would reduce information asymmetry in the commercial property market.
The Ministry of Business, Innovation, and Employment (MBIE) is proposing a policy designed to
place caps on energy use intensity (EUI) for all new builds. In other words, this would impose a
minimum energy efficiency standard for new commercial buildings30. This will be implemented
as part of the Governments Emissions Reduction Plan. Should this go ahead, it will mean that
all new builds will perform to a higher energy efficiency standard.
26 See again Cass, N. 2020. above. 27 Centre for International Economics. 2019. Independent Review of the Commercial Building Disclosure Program. pp. 22-
24 28 See again, Centre for International Economics. 2019. above. 29 See again Cass, N. 2020. Above. 30 Ministry of Business, Innovation, and Employment. 2020. Transforming Operational Efficiency

MAKING T HE PER FOR MANCE O F B UILDINGS TRANSPAR ENT A L OW H ANGING POLIC Y OPTI ON TO SAVE E NERGY
AND CARBON
16
A minimum standard for new builds will have a network effect to existing buildings. This will
likely create additional competitive pressure among owners of existing buildings to improve
their own energy efficiency. If combined with a mandatory disclosure regime, it would provide
transparent and consistent information for all buyers and lessees to create further incentives
for existing buildings to invest in energy efficiency upgrades.

MAKING T HE PER FOR MANCE O F B UILDINGS TRANSPAR ENT A L OW H ANGING POLIC Y OPTI ON TO SAVE E NERGY
AND CARBON
17
Conclusion There are significant potential energy savings to be made in the built environment, and
particularly commercial offices using mandatory disclosure regime such as NABERSNZ.
There are a set of market failures which are preventing an efficient market outcome. Existing
policies, such as the NZ ETS, do not correct for these failures. Minimum standards being
designed and implemented by MBIE will apply only to new builds.
The literature provides ample evidence that disclosure correct the information asymmetries
which are the primary market failure. Mandatory disclosure brings forward benefits while still
leaving it to owner discretion on when and how to incur upgrade costs. This can help to
reduce the cost of implementation and avoid deadline bottlenecks in upgrading resources,
that can lead to capacity constraints, cost inflation, and reduction in work quality. Mandatory
disclosure also creates a framework for data gathering and other regulatory interventions.
Minimum standards for existing buildings may be needed in due course, but it is likely better
to focus on implementing mandatory disclosure as a first step before committing to minimum
standards. Minimum standards for public sector tenancies are in use elsewhere and may be
an appropriate next step once mandatory disclosure has been implemented.
Recommendation
• Adopt a mandatory energy efficiency disclosure regime using the NABERSNZ
framework. This corresponds to Option C of the NABERS Cost Benefit Analysis.
• Begin applying the mandatory requirement to buildings over 2000m2. Larger
buildings are more energy intensive, are better able to achieve economies of scale,
and their owners are generally better capitalised. This will facilitate implementation
and results.
o Over time, the policy should be extended to buildings above 1000m2. This will
work to maximise energy savings.
1179 – 1822 GWh
Potential Energy Savings to
2030
$597.46
Net Benefit per T CO₂ eq.
Abated
113,000 – 175,000
T CO₂ eq. Abated.

MAKING T HE PER FOR MANCE O F B UILDINGS TRANSPAR ENT A L OW H ANGING POLIC Y OPTI ON TO SAVE E NERGY
AND CARBON
18
o The policy should not be extended to buildings below 1000m2. Poor
economies of scale, and their generally lower energy intensity mean energy
savings are likely to be minimal and net benefits negative.
