making time for instructional leadership - … instructional leadership may be necessary but likely...
TRANSCRIPT

VOLUME 1: EXECUTIVE SUMMARY
Ellen Goldring, Jason A. Grissom, Christine M. Neumerski
Joseph Murphy, Richard Blissett V A N D E R B I L T U N I V E R S I T Y
Andy Porter U N I V E R S I T Y O F P E N N S Y L V A N I A
Making Time for Instructional Leadership

Volume 1: Executive Summary This report describes the ongoing development and implementation of the SAM® process, which has the goal of increasing the capacity of principals to use time in instructionally focused ways while decreasing time on management tasks. We summarize the key findings regarding current implementation, changes over time, lessons learned from the literature, and future developments.
Current Implementation
The study data suggest strong fidelity of implementation of the SAM process in schools. NSIP encourages fidelity around four non-negotiables in the SAM process: 1) commitment to the SAM process, 2) participation in baseline data collection using the Time/Task Analysis and protocol, 3) use of the TimeTrack Calendar and SAM Daily Meeting, and 4) ongoing coaching. Principals and SAMs generally report high levels of engagement with these main components. Consistency of implementation in schools likely flows in part from the consistency with which supports for implementation are provided by NSIP; the majority of schools received SAM training before implementation, and most found Implementation Specialists and Time Change Coaches to be quite helpful. Simultaneously, NSIP allows for some flexibility and adaptation to meet the needs of districts and individual schools, and we saw evidence of adaptation, including how many SAM team members a school utilized and how these team members worked with the principal to change time use.
Although not conclusive, our data also show evidence of the efficacy of the SAM process in changing behaviors or outcomes consistent with its theory of action, including increases in instructional time use. Results from our analysis of survey responses, TimeTrack Calendar data, and Time/Task Analysis data, as well as what we heard in interviews in the case study districts, are consistent with the idea that the SAM process helps principals focus on and find ways to increase the time they engage with the school’s instructional program.
This evidence also is consistent with the reasons principals and districts gave for participating in the SAM process. For principals, the main motivations were to improve their capacity as instructional leaders, to spend more time on instruction, and to gain better work/life balance. For districts, the main reasons for adoption were to improve principals’ ability to be instructional leaders and to increase student achievement.
Principals and districts found an increase in principal instructional time to be the greatest benefit to the SAM process, followed by improving their time management and work/life balance. Principals also reported that the process increased their focus on teaching and learning. The primary benefits identified by Time Change Coaches were increasing both the time principals spend on instruction and the quality of that time. They also considered shared leadership beneficial to schools.
Changes in the SAM Process
The SAM process has developed over time in several ways that likely have improved its consistency of implementation and efficacy. Coaching has become more formalized and includes
the use of a protocol. The Implementation Specialist position was added in 2010, and the First Responder system was developed as well. In addition, professional development has been expanded and the TimeTrack Calendar has been improved in response to feedback from the field. A new model of the SAM process was developed to allow an existing school staff person to become a SAM, rather than someone hired externally, and SAM teams (rather than only individual SAMs) have emerged. Lastly, there is an emphasis not only on increasing time spent on instruction, but on developing the quality of that time as well.
The Literature and the SAM Process
The literature strongly supports the rationale behind the SAM process. Principals are expected to be instructional leaders, but multiple studies conclude that principals actually spend little time on instruction. Many challenges exist around principals increasing their time on instruction: organizational norms push principals away from instructional leadership; the many demands on principals’ time make it hard to focus on instruction; and they may lack skills and knowledge about instruction; and Aside from the SAM process, no large-scale interventions have attempted to focus on specifically changing principal time allocation.
Future Developments
We note three areas for continued development of the SAM process. First, increasing time spent on instructional leadership may be necessary but likely is not sufficient to improve teaching and learning in SAM schools. Principals must increase the quality of instructional time as well. Few schools are making the shift from a focus on increased instructional time to a focus on the quality of that time use. Unfortunately, the research literature in this area is limited, providing few firm conclusions regarding what kinds of instructional activities are most valuable.
Second, related to the prior point, some principals lack knowledge of instruction, teaching, and learning. Asking principals to increase their time on instructional leadership, including teaching and learning, presupposes principals have the knowledge to improve their teachers’ skills. Administrative support personnel as SAMs may not be in a strong position to help principals improve this capacity. Increased professional development has begun to address this need.
Lastly, there are possible differences between elementary and high schools’ experiences with the SAM process. This distinction could warrant further exploration and development as those differences become better understood.

ABOUT THE WALLACE FOUNDATIONThe Wallace Foundation is a national philanthropy that seeks to improve education and enrichment for disadvantaged children and foster the vitality of the arts for everyone. The foundation works with partners to develop credible, practical insights that can help solve important, public problems.
Wallace has five major initiatives under way:
School leadership: Strengthening education leadership to improve student achievement.
After-school: Helping cities make good after-school programs available to many more children, including strengthening the financial management capacity of after-school providers.
Building audiences for the arts: Developing effective approaches for expanding audiences so that many more people might enjoy the benefits of the arts.
Arts education: Expanding arts learning opportunities for children and teens. Summer and expanded learning time: Better understanding the impact of high-quality summer learning programs on disadvantaged children, and how to enrich and expand the school day.
Summer and expanded learning time: Better understanding the impact of high-quality summer learning programs on disadvantaged children, and how to enrich and expand the school day.

VOLUME 1: THE EVOLUTION OF THE SAM PROCESS
Ellen Goldring, Jason A. Grissom, Christine M. Neumerski
Joseph Murphy, Richard Blissett V A N D E R B I L T U N I V E R S I T Y
Andy Porter U N I V E R S I T Y O F P E N N S Y L V A N I A
Making Time for Instructional Leadership
Copyright © 2015 Published by The Wallace Foundation All rights reserved
This study was commissioned by The Wallace Foundation. It was conducted by researchers at Vanderbilt University and the University of Pennsylvania. The contents expressed in this report are those of the authors and do not necessarily represent the views of the sponsor.
Cover photo: vgajic Front and back cover design: José Moreno
Acknowledgement
The support and valuable contributions of several individuals and organizations were essential to this study. We thank Mark Shellinger, Director, National SAM Innovation Project, for his ongoing engagement and valuable feedback throughout this project. Jim Mercer at NSIP assisted us with survey implementation and was consistently helpful with our numerous data questions. Other staff from NSIP gave generously of their time and provided crucial insights. We thank the participants in this study who welcomed the researchers into their schools and districts, and shared their experiences and expertise through interviews and surveys. Mollie Rubin and Laura Rogers provided valuable research support.

1
MAKING TIME FOR INSTRUCTIONAL LEADERSHIP VOLUME 1: THE EVOLUTION OF THE SAM PROCESS
Ellen Goldring Jason A. Grissom
Christine M. Neumerski Joseph Murphy Richard Blissett
Vanderbilt University
Andy Porter University of Pennsylvania

2
Table of Contents
I. Introduction ................................................................................................................................. 3 Purpose of this Report and the Approach ................................................................................... 3 The Study Methodology .............................................................................................................. 4
II. The Design and Theory of Action of the SAM Process ............................................................. 6 Overview of the Essential Components of the SAM Process ..................................................... 6 The SAM Process ...................................................................................................................... 11 Fidelity Versus Adaptation of the SAM Process ...................................................................... 14 Changes in the SAM Process over Time ................................................................................... 15
III. The SAM Process and the Literature ...................................................................................... 18 Principal Instructional Leadership ............................................................................................ 18 Previous Evaluation Reports of the SAM Process .................................................................... 24
IV. The Actual: SAM Process Implementation in the Field ......................................................... 26 Spread of Current Implementation ............................................................................................ 26 Goals for Adopting the SAM Process ....................................................................................... 28 Benefits of the SAM Process .................................................................................................... 31 Fidelity, Adaptation, and Challenges of the SAM Process Implementation ............................. 36
V. Summary .................................................................................................................................. 54
References ..................................................................................................................................... 56
3
I. Introduction
Purpose of This Report and the Approach
In July 2013, the Wallace Foundation awarded Vanderbilt University a research grant to “investigate the status of the SAM or School Administration Manager process,” including “the extent to which the current process has changed since [the Wallace Foundation’s] last commissioned evaluation and whether it makes sense to pursue a Randomized Controlled Trial or RCT.” This report presents the research findings, while the recommendations regarding a RCT are shared in Volume 2.
The SAM® process was formed to address a key dilemma in the domain of school leadership. On one hand, the importance of principal instructional leadership is a cardinal theme in the school administration and school improvement literature. On the other hand, research over the past 35 years consistently reveals that principals spend minimal amounts of time on instructional leadership activities (see Murphy, 1990; Horng, Klasik, & Loeb, 2010; May & Supovitz, 2011; May, Huff, & Goldring, 2012). The SAM process was originally developed and implemented to address this challenge: to increase principals’ time allocation in the domains and task of instructional leadership.1
The SAM is a school staff member who works with the principal to assist him or her in spending time on instructional leadership; many schools employ SAM teams comprised of multiple SAMs. Research to date reveals that the SAM process has been successful, perhaps uniquely so, in moving the needle on the allocation of instructional time by principals (Turnbull et al., 2009). At the same time, a variety of issues have surfaced to suggest that additional study of the SAM process is needed. These include the growing complexity of the intervention itself, specifically that the model has developed and changed; the importance of context in the implementation of the SAM process (e.g., elementary versus secondary schools); the shifting policy context of the principal’s role (e.g., principal requirements in new teacher evaluation systems); and the need for a more nuanced understanding of principal time (e.g., quality of use). We also know that initial findings need to be tested using more robust scientific methods to make causal inferences.
We organize this report in three main sections: (1) the SAM process design approach and theory of action, (2) the SAM process and the literature, and (3) current SAM process implementation in the field. We end with a brief summary.
The first section addresses the overall SAM process and the theory of action behind the approach. We ask, “What is the current SAM process and theory of action? How has the SAM process changed since the last major evaluations?”
The second section reviews the literature as it informs the SAM process theory of action and the importance of the focus on time allocated to instructional leadership. We ask, “How does the literature inform us about the SAM process theory of action and principal instructional time use? And what do prior evaluations of the SAM process suggest as it relates to the literature?”
1 We use the phrase “SAM process” to distinguish the overall program from a person who fulfills a SAM role in a school. “SAM process” is also used by the National SAM Innovation Project.
4
The third section addresses current implementation of the SAM process in the field. We ask, “Who is currently implementing the SAM process? To what extent are program components implemented with fidelity? What proportion of time is spent on instructional leadership tasks and domains? Why have schools and districts implemented the SAM process, and what benefits do they see? What are challenges?”
The Study Methodology
We used multiple methodologies to study the SAM process, including case studies, document and literature reviews, individual interviews, analysis of calendar and shadowing databases from principals currently participating in the SAM process, and surveys of principals SAMs®2. Specifically, early on in the project, we conducted face-to-face interviews with key leaders at the headquarters of the National SAM Innovation Project (NSIP), including Mark Shellinger, director of NSIP and creator of the SAM process.
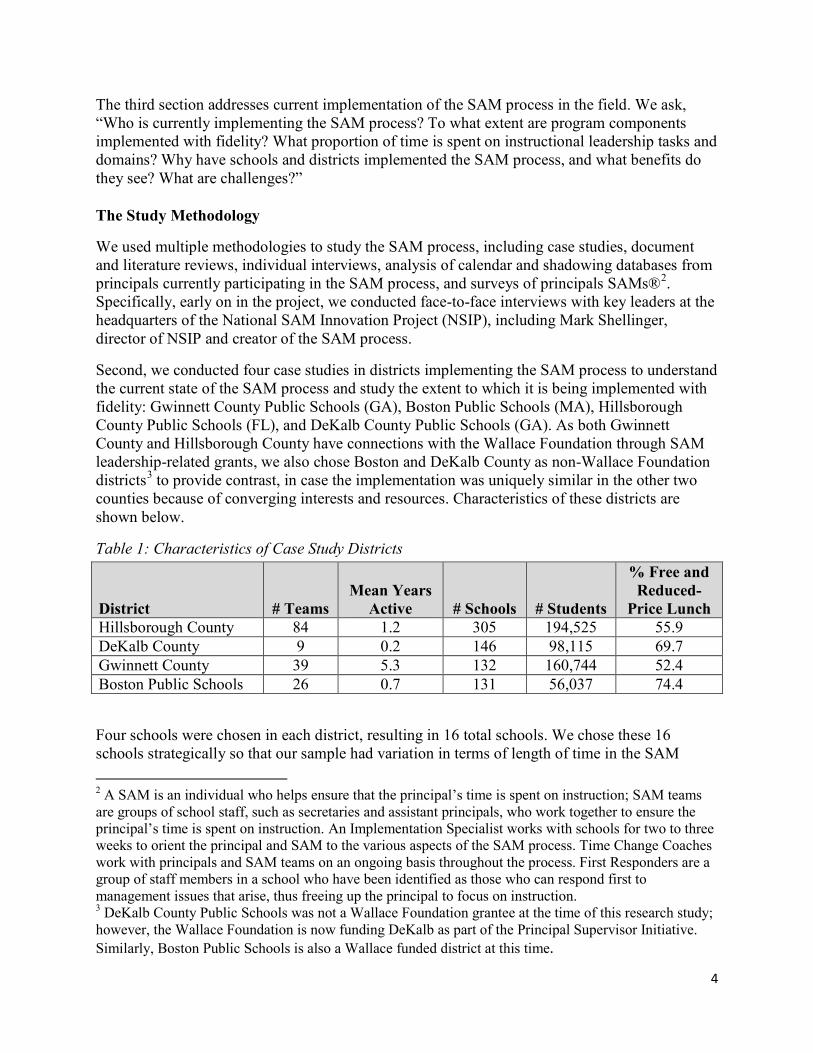
Second, we conducted four case studies in districts implementing the SAM process to understand the current state of the SAM process and study the extent to which it is being implemented with fidelity: Gwinnett County Public Schools (GA), Boston Public Schools (MA), Hillsborough County Public Schools (FL), and DeKalb County Public Schools (GA). As both Gwinnett County and Hillsborough County have connections with the Wallace Foundation through SAM leadership-related grants, we also chose Boston and DeKalb County as non-Wallace Foundation districts3 to provide contrast, in case the implementation was uniquely similar in the other two counties because of converging interests and resources. Characteristics of these districts are shown below.
Table 1: Characteristics of Case Study Districts
District # Teams Mean Years
Active # Schools # Students
% Free and Reduced-
Price Lunch Hillsborough County 84 1.2 305 194,525 55.9 DeKalb County 9 0.2 146 98,115 69.7 Gwinnett County 39 5.3 132 160,744 52.4 Boston Public Schools 26 0.7 131 56,037 74.4
Four schools were chosen in each district, resulting in 16 total schools. We chose these 16 schools strategically so that our sample had variation in terms of length of time in the SAM 2 A SAM is an individual who helps ensure that the principal’s time is spent on instruction; SAM teams are groups of school staff, such as secretaries and assistant principals, who work together to ensure the principal’s time is spent on instruction. An Implementation Specialist works with schools for two to three weeks to orient the principal and SAM to the various aspects of the SAM process. Time Change Coaches work with principals and SAM teams on an ongoing basis throughout the process. First Responders are a group of staff members in a school who have been identified as those who can respond first to management issues that arise, thus freeing up the principal to focus on instruction. 3 DeKalb County Public Schools was not a Wallace Foundation grantee at the time of this research study; however, the Wallace Foundation is now funding DeKalb as part of the Principal Supervisor Initiative. Similarly, Boston Public Schools is also a Wallace funded district at this time.
5
process, student enrollment, school level, percent students identified as minority, and percent of students participating in the free and reduced-price lunch program (see each case for details). Within each school, we conducted semi-structured interviews with the principal, at least one SAM, and at least one First Responder, if available; and, at the district level, we interviewed district office personnel familiar with the SAM process and/or Time Change Coaches.
Third, during the winter of 2014, two researchers interviewed Time Change Coaches and Implementation Specialists at the annual national SAM Conference.
Fourth, we analyzed Time/Task Analysis and TimeTrack calendar data (a proprietary NSIP software calendar program designed to determine the amount of time a principal devotes to instructional leadership), provided by NSIP. TimeTrack calendar data covered the dates from August 1, 2013, to June 15, 2014, for consenting principals.
Fifth, online surveys were administered to all current principals and SAMs participating in the SAM process in fall 2014 over a three-week period in late November and early December 2014. The Vanderbilt team developed survey instruments for principals and SAMs. The survey was conducted anonymously using SurveyMonkey, with links distributed to principals and SAMs directly by NSIP. Among the 720 principals contacted who are actively participating in the SAM process, survey responses were received from 388, for a response rate of 54%. The response rate from SAMs was lower, with 382 of a possible 982 SAMs responding, or 39%.
Sixth, a member of our research team interviewed key researchers from Policy Studies Associates (PSA) who were directly involved in previous evaluations of the SAM process.
Seventh, we carefully reviewed documents and reports specifically related to the SAM process, including the earlier PSA evaluation reports.
Finally, we reviewed the literature on the importance of principals’ instructional leadership roles for school effectiveness and the prevailing explanation for why it has been so difficult to move principals toward instructional leadership.
Our approach is to integrate the findings across all sources of data in this summary report. It is important to note that all data collection was coordinated through NSIP and required that potential subjects consent to NSIP releasing their individual data (e.g., TimeTrack calendar data) and to being contacted for research purposes (e.g., for an interview).
6
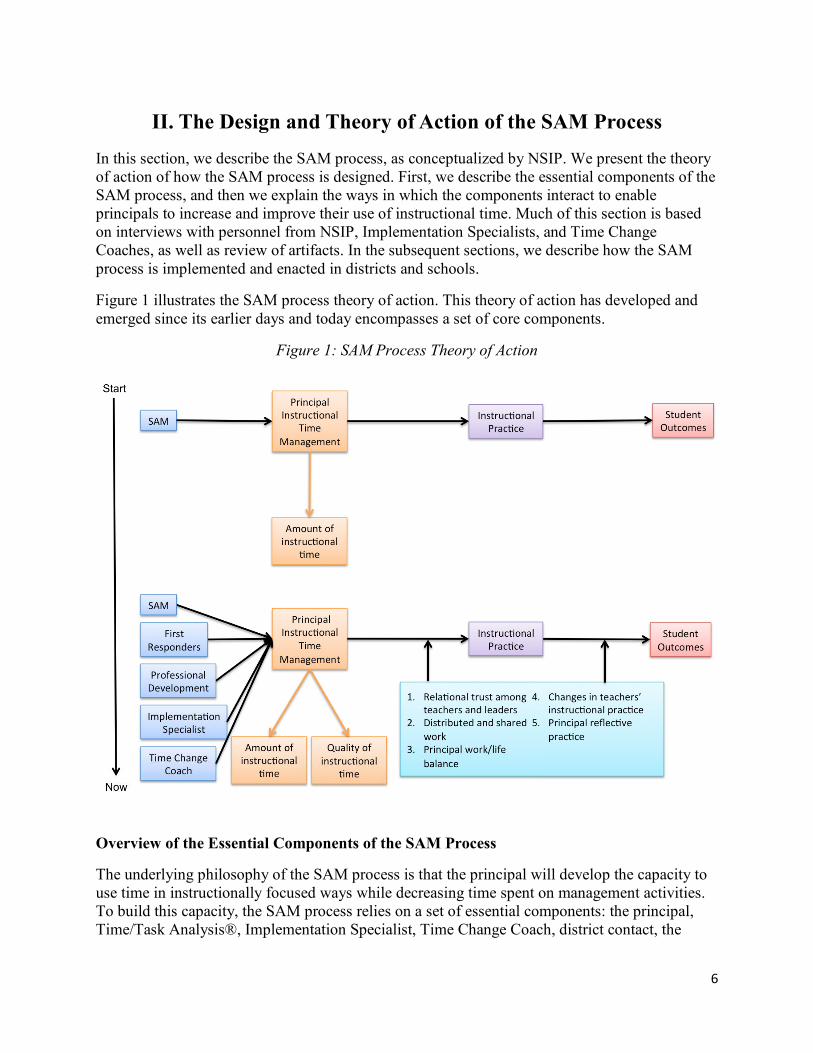
II. The Design and Theory of Action of the SAM Process In this section, we describe the SAM process, as conceptualized by NSIP. We present the theory of action of how the SAM process is designed. First, we describe the essential components of the SAM process, and then we explain the ways in which the components interact to enable principals to increase and improve their use of instructional time. Much of this section is based on interviews with personnel from NSIP, Implementation Specialists, and Time Change Coaches, as well as review of artifacts. In the subsequent sections, we describe how the SAM process is implemented and enacted in districts and schools.
Figure 1 illustrates the SAM process theory of action. This theory of action has developed and emerged since its earlier days and today encompasses a set of core components.
Figure 1: SAM Process Theory of Action
Overview of the Essential Components of the SAM Process
The underlying philosophy of the SAM process is that the principal will develop the capacity to use time in instructionally focused ways while decreasing time spent on management activities. To build this capacity, the SAM process relies on a set of essential components: the principal, Time/Task Analysis®, Implementation Specialist, Time Change Coach, district contact, the
7
SAM(s), TimeTrack calendar, Daily Meeting, First Responders, and professional development (PD). An overview of each of these components is outlined below.
The Principal
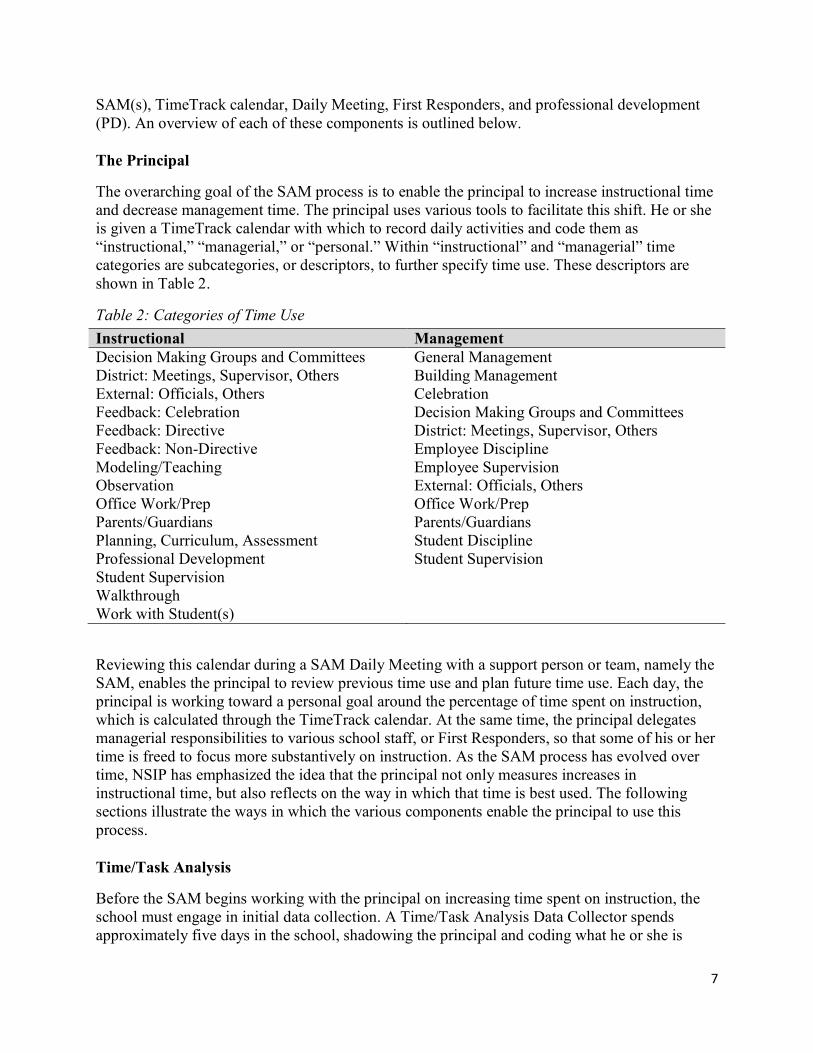
The overarching goal of the SAM process is to enable the principal to increase instructional time and decrease management time. The principal uses various tools to facilitate this shift. He or she is given a TimeTrack calendar with which to record daily activities and code them as “instructional,” “managerial,” or “personal.” Within “instructional” and “managerial” time categories are subcategories, or descriptors, to further specify time use. These descriptors are shown in Table 2.
Table 2: Categories of Time Use Instructional Management Decision Making Groups and Committees District: Meetings, Supervisor, Others External: Officials, Others Feedback: Celebration Feedback: Directive Feedback: Non-Directive Modeling/Teaching Observation Office Work/Prep Parents/Guardians Planning, Curriculum, Assessment Professional Development Student Supervision Walkthrough Work with Student(s)
General Management Building Management Celebration Decision Making Groups and Committees District: Meetings, Supervisor, Others Employee Discipline Employee Supervision External: Officials, Others Office Work/Prep Parents/Guardians Student Discipline Student Supervision
Reviewing this calendar during a SAM Daily Meeting with a support person or team, namely the SAM, enables the principal to review previous time use and plan future time use. Each day, the principal is working toward a personal goal around the percentage of time spent on instruction, which is calculated through the TimeTrack calendar. At the same time, the principal delegates managerial responsibilities to various school staff, or First Responders, so that some of his or her time is freed to focus more substantively on instruction. As the SAM process has evolved over time, NSIP has emphasized the idea that the principal not only measures increases in instructional time, but also reflects on the way in which that time is best used. The following sections illustrate the ways in which the various components enable the principal to use this process.
Time/Task Analysis
Before the SAM begins working with the principal on increasing time spent on instruction, the school must engage in initial data collection. A Time/Task Analysis Data Collector spends approximately five days in the school, shadowing the principal and coding what he or she is
8
doing every five minutes. These Data Collectors are trained by NSIP to use a structured, formal protocol to collect the data as a baseline for the principal. These baseline data are then presented to the principal so that he or she might develop a personal goal around increasing instructional time. For example, if the baseline data show that the principal spends only 25% of his or her time on instruction and 75% on management, the goal might be to increase instructional time to 35%. The Time/Task Analysis shadowing is repeated annually to check on progress and reevaluate goals.
Implementation Specialist
To orient the principal and SAM to the various aspects of the process, an Implementation Specialist works with schools for two to three weeks as they begin implementing the basic SAM process components. The Implementation Specialist is an employee of NSIP from outside the school who trains the principals and SAMs to use the TimeTrack calendar, Daily Meeting, and First Responder system. They help the school get the basic components of the process up and running. In some cases, the Implementation Specialist works in the district and combines this with other district/central office roles.
As one NSIP staff member explained, the “implementation specialists begin their relationship with a school at the meeting where [NSIP] presents the data to the principal SAM team. [The director] comes in and says, ‘Okay, you’ve been shadowed, here it is … here’s all the data.’ They get it in a hard copy and of course it’s online. And then he shows them TimeTrack, which they’ve seen before, but now it’s personal and he guides them through .…“Each team member gets the data on a laptop with instructions to program in time-use goals for the next day, each month, and the year before the meeting concludes.” During that initial meeting, the Implementation Specialist is present and assisting with the process: “At that meeting, we say hello, we say I’m going to be working with you, I’m going to help you, support you, encourage you, be a cheerleader for getting this to actually be in practical application.”
The Implementation Specialist then begins working directly with the school, reviewing the baseline data with the team, discussing the principal’s goals for improvement. NSIP has developed a Team Performance Rubric by which the Implementation Specialist measures whether the team is functioning at a sufficient level to begin implementing the process on its own and start working with a Time Change Coach. As the NSIP director explained, “An Implementation Specialist has a specific list of objectives they have to complete before they can turn the team over to coaching … about 35 items.” Once a school has reached a 3 on each component of the 4-point scale rubric, the team is considered ready for the Implementation Specialist to transition them to the Time Change Coach.
Time Change Coach
At the end of a successful implementation phase, according to NSIP’s director, the final tasks of the Implementation Specialist are to review the SAM team’s progress with them, discuss next steps, and introduce the Time Change Coach.
Time Change Coaches work with principals and SAM teams on an ongoing basis throughout the year, working in the schools one day per month and remaining in email contact weekly. The NSIP director noted that coaches follow a protocol when in schools that “includes meeting with
9
each SAM privately and having a non-directive conversation about how things are going and then also figuring out what else a SAM needs to be effective. Then meeting with the principal privately, doing the same thing. Then observing a Daily Meeting and giving feedback.” Once a week, coaches review TimeTrack data electronically and give feedback via email or by phone to the SAM and the principal. Through an electronic system, the coach is automatically alerted if the SAM team has not been at or above goal in the prior week; at that point, the coach contacts the principal and SAM to determine whether they are struggling and need additional support. If the team does not meet its goal for a second consecutive week, the system generates a message to the state coordinator or district contact.
Time Change Coaches can be district employees who coach part-time or affiliates of NSIP. As the director of NSIP explained, “We will ask the district for recommendations. Often times, districts have coaches they’re currently using, and we will look at that. We always ask the principal, ‘Who do you want, who would you recommend?’” NSIP provides training for the Time Change Coaches and has a number of affiliates who are deployed across the country as the coaches.
Before starting to work with the coaches, principals are given an opportunity to review the coaching protocol, as well as an ethics agreement created by NSIP, which establishes that the relationship is always between the coach and the SAM and the principal, not the district. “We’re careful with that,” said the NSIP director. “Even in places where the district provides the coaches, we have an ethics agreement that the SAM, the principal and the coach all sign … because you want to protect that environment.” This step promotes trust between the coach and school staff.
SAM
The role of the SAM is to help the principal increase instructional time and reflect on its impact. The SAM meets with the principal each day during a SAM Daily Meeting to hold him or her accountable for recording, reconciling, and analyzing the amount of time spent on instruction and management using the TimeTrack calendar. The SAM is sometimes a single school employee, such as the secretary, but NSIP, as noted by the director, encourages the principal to choose two or more individuals to create a SAM team for several reasons, including that “probably it’s harder for the principal to brush off two people” when they arrive for the SAM Daily Meeting. As the director of NSIP explained, that team may be composed of a vice principal, a teacher leader, a counselor, a secretary, or a bookkeeper, and SAM team membership is determined by the principal. The NSIP Director emphasized the importance of the principal choosing a SAM who is comfortable pushing his or her boss on time use and asking reflective practice questions.
TimeTrack Calendar
The TimeTrack calendar system allows principals and SAMs to track and manage how the principals’ time is spent during each day and to compare that data with the time-use goals set by the team. The principal and/or SAM(s) fills out the TimeTrack calendar for each day with plans for how they expect to use their time that are mindful and intentional. The calendar is then reconciled (changed) during the Daily Meeting with the SAM if the principal’s actual time use differs from the plan. This reconciliation provides an opportunity for the principal and SAM to

10
discuss why the principal did not follow his or her plan. More recently, the TimeTrack calendar has incorporated features that can report analysis and more refined disaggregation of data, such as providing a breakdown on the time spent with specific teachers.
SAM Daily Meeting
Beyond increasing the percentage of time spent on instruction, the SAM process is also meant to help the principal reflect on time use. The Daily Meeting between the SAM and principal provides an opportunity for the principal reflect on how he or she has used time on instruction and plan future time use. During this meeting, the SAM asks the principal “non-directive” questions that promote reflection and goal-setting around instructional time and explore why the principal may not have followed his or her calendar. More recently, the meetings have come to include data analysis and discussion to probe deeper into patterns of time use, such as the extent to which principals are spending time with teachers who might need support.
First Responders
The First Responders are a group of staff members in a school who have been identified as those who can respond first to management issues that arise, thus freeing up the principal to focus on instruction. For example, a janitor may become a First Responder for the school’s maintenance issues; an administrative assistant may become a First Responder for school bus concerns. The First Responders are identified and their specific domains of responsibility are determined as part of work with the Implementation Specialist, whose job includes verifying responders’ willingness to serve and provide training to use a particular protocol when responding to management issues. For example, when a parent calls wanting to speak with the principal, the secretary may put a trained First Responder on the phone to assure the parent that the issue is important and will be addressed. This enables the principal to spend more time on teaching and learning, rather than on managerial issues.
District and State Roles
NSIP establishes a district contact, and when possible, a state coordinator, for the SAM process. The NSIP director describes the district contact as “the person that [NSIP] connects with on any contract issue to talk about how we integrate SAMs at a district level.” NSIP may work with this person to determine needed PD for principals and SAMs, as well as to build a long-term sustainability plan for the process in the district. The NSIP director explained the importance of this role: “One of the things we’re interested in is developing capacity within a district so they can do most of this work themselves, because that brings the cost down,” increasing the likelihood the SAM process can be sustained. He also indicated that NSIP is very interested in how the SAM process integrates with other district initiatives, goals, and leadership development efforts.
Professional Development
NSIP provides PD to participating schools through workshops and state and national conferences. Additionally, it works with districts to provide tailored PD that addresses context-specific needs. Through the Implementation Specialist, Time Change Coaches, and national and local PD, schools receive ongoing training and support for the SAM process.

11
The SAM Process
NSIP intends that the aforementioned elements interact so that increased principal instructional time enables reflection and change in time use. More specifically, “the theory of action is [that] as the principal increases their instructional time, they’re then able to have a data set where they can be more reflective on whether that time spent makes a difference in terms of teacher practice, student and parent engagement—and that during the Daily Meeting, conversation occurs about the principal’s use of time,” the director of NSIP said. NSIP encourages principals to think about the SAM process as “a series of actions you take,” rather than a “magic recipe” or specific formula that must be followed.
While some principals initially believe they have achieved success once they have increased their instructional time, this is only the first step in the SAM process. “The next step is, can you make a reasonable case that [increased instructional time is] making a positive difference?” NSIP’s director said. The increase in instructional time enables the second step: reflection on TimeTrack data to determine whether more time spent on instruction is making a positive difference in teacher practice, student engagement, and parent engagement. The third step is making necessary changes in the principals’ use of time based on that reflection. These three steps form an ongoing process, in which data collection on principal’s instructional time leads to reflection on whether and how time is making a difference. Based on that reflection, principals alter their time use and then reflect further on how that time use impacts teacher, student, and parent outcomes.
Throughout this report, we highlight this difference between increased instructional time and quality of time use. In sum, NSIP believes that an increase in principals’ time spent on instruction is an important first step in the SAM process. Reflection on how time is spent leads to a potential improvement in the quality of time use, which can be defined as principal time spent on instruction that leads to positive changes in teacher, student, and parent outcomes.
This process is illustrated in Figure 2.

12
Figure 2: SAM Process Implementation
How do the essential elements interact to facilitate this process?
The essential components are used to facilitate this three-step process, both by protecting the principal’s instructional time and enabling him or her to reflect on instructional time use. The following provides an overview of how those components are intended to work in this process.
Step 1: Increased Principal Instructional Time
First Responders are trained to take over many of the principal’s management tasks to allow him or her to have more time for instruction. This system is designed to ensure that the principal is not the first person pulled away for every management issue but can instead increase his or her time spent on instruction. According to the NSIP director, Implementation Specialists “will teach the communications protocol, for example, to the front office staff, so when somebody calls up and says, ‘My child had a problem on the bus and I want to talk to the principal right now,’ … [rather than] ‘Principal’s not available’ or ‘I’ll take a message,’ … we train people to validate the caller. ‘I’m so sorry to hear that, is your child okay? I know my principal’s going to be concerned.’ Very different response …. Then the next piece is tell the person what you can do, not what you can’t. ‘A First Responder, vice principal, will talk to you right now. The principal wouldn’t want you to wait.’” When the First Responder system is implemented successfully, school leadership becomes more distributed, enabling the principal to spend more time focused on teaching and learning, rather than being the sole resource for every issue that occurs in the school.
In addition to the First Responder system, the use of the TimeTrack calendar also allows the principal to increase instructional time. The process requires that principals be very diligent
13
about planning their day in advance, through daily coding of their time spent on instruction and management. By recording daily time data, the principal and SAM are then able to analyze the principal’s actual time spent on instruction relative to the principal’s goal and to make changes accordingly.
Step 2: Reflection
Since the crux of the SAM process is that reflection on time use is as important as increasing instructional time the role of the SAM is critical. The SAM is trained by the Time Change Coach to help the principal reflect by asking non-directive questions about his or her time use, why he or she has used it that way, how it is helping to bring improvements, and what plans he or she has for time use in the future. As the NSIP director explained, “So you want to make sure that the SAM team, the people doing the work with the principal every day, can ask those kind of questions. We tell the principal that you have to give your SAM team permission to irritate you a little bit every day because if you’re not feeling a little irritated, you’re probably not getting the benefit …. The truth is it’s hard and a lot of principals will push away at first. I’ve had SAMs—and we do teach SAMs to say this—turn to the principal and say, ‘Talk to me about why you’re pushing away, why you’re not having your meeting. I thought you wanted to improve your practice. How will you be any better if you don’t do this?’ ”
This daily interaction between the principal and SAM involves analyzing and reflecting on the TimeTrack data, as well as discussing how the principal’s instructional time is being used. The SAM and principal consider whether the principal’s time allocations are helping to change the school culture, building trust among the staff, and changing the teachers’ instruction in positive ways. They reflect on whether time use also is improving student and parent engagement in the school. Based on the answers to these questions, the principal can then determine how to change his or her time use to further improve these outcomes.
Annual Time/Task Analysis shadowing is used to provide outside validation of the overall change in time spent on instruction. This offers a new baseline each year by which the principal and SAM can reflect on and plan future time use.
Step 3: Principal Time Use
The reflection on the TimeTrack data then allows the principal to think through how to improve the use of his or her time on instruction. The NSIP director explained, “That’s why we train a SAM during the Daily Meeting to ask questions. ‘Here’s the time that you spent with Jason so far this year. Talk to me about what it is you’re hoping to see in terms of change in Jason.’ ” Tying this reflection to action is an ongoing process. Once the principal attempts to improve the use of his or her time, he or she returns to reflecting with the SAM on whether or how that is working; from there, additional changes in time use can be made. “And so our theory … is that if you increase your instructional time and then if you’re reflective and willing to involve other people in improving practice as a whole, so you don’t feel like you need to know all the answers, that you can then use this system, this process to change what occurs,” NSIP’s director said.
14
Training and Support as Part of the SAM Process Theory of Action
The training and support provided to principals and SAMs are a major element in facilitating the success of the SAM process. The Implementation Specialist ensures that the school staff is trained on using the basic components of the program, or the “mechanical” aspects of the SAM process. The ongoing support and training by the Time Change Coach helps the SAM to learn how to best “push” the principal in his or her thinking around time use. In addition, NSIP offers various PD opportunities for principals and SAMs to better understand the SAM process. This includes an annual conference, as well as district specific PD days with sessions aligned to the SAM process, covering topics such as how to have difficult feedback conversations with teachers. These various learning opportunities occur continuously for schools participating in the SAM process, so they can deepen their understanding of the way in which the components interact, as well as deepen their understanding of the reflective aspect of the process.
Fidelity versus Adaptation of the SAM Process
NSIP encourages fidelity in the use of a series of “non-negotiables,” but it also allows a certain amount of adaptation on the ground. The NSIP director listed four non-negotiables: (1) commitment and desire to adopt the SAM process, demonstrated in part by attending a readiness and orientation session; (2) participation in baseline data collection using the NSIP Time/Task Analysis and protocol; (3) the use of the TimeTrack calendar and Daily Meeting; and (4) ongoing coaching to support the work.
From the perspective of NSIP, these basic elements combine to make the process work. Yet, as the NSIP director explained, NSIP also left “quite a bit of freedom at the school level. It couldn’t become lockstep because you would destroy the creativity and the evolution of the SAM process, but we knew we had to set some non-negotiables.”
The director of NSIP also explained that “real success for us is when they don’t say we’re a SAM school but instead, SAM is just a process they’re using in their school or their district and it becomes integrated.” This line of thought discourages viewing the process as a formulaic program without flexibility. Once the non-negotiables are met, schools should determine how to use the process to best meet their needs.
This combination of fidelity to the basic, non-negotiable components and encouragement to adapt the process to the needs of the individual school was also evident in interviews with Time Change Coaches and Implementation Specialists. For example, coaches emphasized that they pose reflective questions to principals, rather than “tell them what to do.” Thus, as one explained, once the basic components are in place, the coach individualizes training for each school and each staff member:
“I try to individualize my coaching to each building because they are all unique…. New teams tend to need a lot more support in the technical aspects of the program like the TimeTrack software and … how do we get our Daily Meeting in, how do we get that scheduled, what should we be doing in our Daily Meeting? And then as we move forward with teams, after they’ve been in for a while, what I focus on is if you’re the principal, you have time now to be in the

15
classroom, so how do you spend that time and what’s the impact of how you’re spending your time?”
Another coach reinforced the idea that the SAM process is “really not a canned program and that there’s no right or wrong … that it really truly is individualized, and that’s what gives it its power… that the individual determines what it’s going to do for them and what they need.” She further explained that the idea is that the SAM process provides “the system or a structure, a vehicle, a process, whatever word you want to use, so that the principal can meet with other people daily in order to plan and follow through on how their time is spent in a way that increases instructional—a focus on more instructional time. That’s the whole purpose of the process, to increase the way a principal spends his or her time so that it’s more systematically on instructional areas.” The nuances of how that plays out beyond the essential components can vary by school, depending on individual needs and context.
Changes in the SAM Process over Time
There are a number of areas in which the SAM process has changed and evolved over time. Some of the changes are in response to prior findings in the PSA evaluation, and others are in response to reflection on the process by those involved, as well as feedback and engagement with the field. In this section, we detail those changes based on interviews with NSIP, Time Change Coaches, Implementation Specialists, and PSA evaluators.
Time Change Coaches and Implementation Specialists
Although time change coaching has been a part of the SAM process since its inception, the role of the coach has become more formalized over time. As the NSIP director explained, “We have a very strict protocol in terms of how we train coaches and we do ongoing coaching training throughout the year electronically … [and] in person because we think that’s really important.” He also noted that increasing NSIP’s work to train and support coaches “was something we learned from PSA …. [T]hey pushed us really hard on improving coaching and professional development and TimeTrack. At the time, we weren’t doing PD at all, or much” beyond the annual conference.
Coaches now follow a protocol when they are in schools, meeting with each SAM and principal privately. During these meetings, the coaches facilitate “non-directive conversations” to understand what additional support the SAM and principal need to be effective. They also observe the Daily Meetings and provide feedback.
In addition to formalizing the coaching process, NSIP also added an Implementation Specialist position in 2010, relieving the NSIP director of that task. He explained, “Three years ago, I was the implementation specialist. I would go back and forth between districts,” noting that he could not give nearly the amount of time the SAM teams needed. To address this issue, NSIP built a cadre of Implementation Specialists to support schools. According to interviews with Time Change Coaches and Implementation Specialists, this new position helps schools with the technical aspects of the SAM process, such as the TimeTrack calendar and Daily Meeting. The Implementation Specialist typically spends two to three weeks in a school to ensure that the basic mechanics of the SAM process are implemented. The SAM Team Implementation Chart and the 4-point SAM/Principal Team Performance Rubric helps the Implementation Specialist identify

16
which level of the process the SAM and principal have reached: beginning (1), developing (2), accomplished (3), or exemplary (4). Implementation Specialists work with schools until they reach a 3 on each component of the rubric, which indicates successful implementation of the program’s basic components. Accordingly, most Implementation Specialists in our sample mentioned the importance of using the rubric to determine when the school was ready to transition to the support of the coach. One offered, “We work with a rubric …. So when we get them to, say, level three of that rubric, we then begin to transition them over to a Time Change Coach. That individual will continue ongoing support. But our role is really like almost turning the key over and starting the car and letting it run very smoothly. And then once it’s running, you put the Time Change Coach in there, and they’re driving it.” Interviewees perceived the recent development of the Implementation Specialist role as helping to improve the quality, pace, consistency, and fidelity of implementation.
Professional Development
According to NSIP, the only PD that was initially provided was the annual national SAM conference. That PD was expanded to include targeted, district-specific learning opportunities for principals and SAMs. These PD opportunities are currently offered to schools approximately twice per year. The director explained the genesis of contracting with external providers to develop appropriate PD: “PSA’s report pushed us that we should be more involved in PD …. We began a process of talking with districts to see what they needed and what we found out is there were some commonalities, particularly with SAMs, mostly about communication, questioning structures, and coaching people.” After realizing that additional PD was needed, NSIP began working with a variety of external groups, including Rutherford Learning Group; Fierce, Inc.; Dale Carnegie Training; and Top 20 Training. With these groups, NSIP developed day-long workshops that are SAM-specific.
TimeTrack Calendar
The TimeTrack calendar, although in existence since the start of the SAM process, has been expanded and improved over time. PSA suggested that at the time of their evaluation, the calendar was “cumbersome” and only allowed principals to record their time working in school, which left some principals unable to accurately record instructional or managerial time that was completed after school hours. The newer version includes a variety of graphs and features to track and analyze time use. It also allows principals to record time use during any working hours. The calendar now has features to disaggregate data, to help probe much more deeply into principals’ time use. For example, the calendar can be used to analyze how much time principals spend in particular teachers’ classrooms (i.e., are they avoiding teachers who need support the most?). TimeTrack data can be exported to other calendar programs, such as Outlook. NSIP continually updates TimeTrack based on user feedback.
In some schools, assistant or vice principals or others also use the TimeTrack calendar and meeting with a SAM for their own development. Multiple people within some schools can also access and view the principal’s calendar.

17
Emergence of Model 3
The original approach to the SAM process (Model 1), still used by approximately 10% of SAM teams, was to hire a new staff person specifically to be the SAM. Model 2 designated an existing staff person as SAM as part of his or her job and provided the SAM with a stipend; only a few schools currently use this model. Most schools now use an existing staff person or persons to take on the SAM role in conjunction with their other job roles, without a stipend (Model 3). Schools fund the SAM process from various sources, including private grants, general funds, and state and federal categorical funds, such as money from School Improvement Grants or Race to the Top. Services for the SAM process cost, on average, $12,900 per school, with costs dropping each year the process stays in place.
First Responder System
The First Responder system emerged as part of the general move from Model 1 to Model 3, with schools usually no longer having staff whose sole role was to be the SAM. The First Responder system is the process of training staff members to take on non-instructional leadership tasks in a clear and routine manner. The principal distributes leadership tasks, especially non-instructional leadership tasks, such as parent questions, bus monitoring, and facility management to specific members of the school staff to free up principal time to focus on instruction. NSIP provides specific training for First Responders as part of the role of the Implementation Specialist.
Change in Philosophy and Theory of Action
According to interviews with Time Change Coaches and Implementation Specialists, “SAM” originally referred to individuals. Now, SAM is considered a process, rather than a person, with a greater emphasis on distributed leadership. One Time Change Coach explained, “We have got to stop thinking about this as a person. It’s not. SAM is a process. And once you get that, that it’s a process, then you really can work …. So we stopped looking at it as a person. SAM is not a person. It’s a process. That was critical.”
Another coach indicated that NSIP now encourages schools to use a team, rather than an individual approach, to the SAM. They believe that SAM teams are better able to ask non-directive questions of the principal and to push his or her thinking around use of instructional time. The NSIP director also stated that the organization encourages schools to use SAM teams.
While the SAM process began as a way to help principals increase instructional time, it has developed into more. Time Change Coaches and Implementation Specialists described how principals are now also encouraged to think about how they use their time on instruction. This has been a major shift in the theory of action. One coach explained this shift: “What began maybe several years ago as a way to help protect the principal’s time has now leaped ahead into much more than that, because what we see we’re actually doing by helping principals identify and provide training support for First Responders is they are building a culture that is way different in their building -- one of distributed leadership, one of problem- solvers, independent thinkers, people that can take a look at issues and say, ‘I can take care of this, I don’t need someone else to tell me what to do.’ But, that takes place over a long period of time.” Time Change Coaches view the process as intended to impact the school at a deeper level, beyond just the implementation of the basic components of the SAM process. “So the process has evolved

18
beyond just this setting up a calendar, managing your time, asking these kind of questions now to we’re getting steps beyond that to say okay, this is what we do when we have that time to get in the class ….” This shift has allowed for more of a focus on ongoing reflection and changing principal actions accordingly. It also has allowed for a movement from a focus on increased instructional time as the primary outcome of the SAM process to the ability for schools to concentrate on other outcomes: how principal time should be used, the way in which teacher practice can improve based on that time use, school culture, parent and student engagement, and student achievement.
III. The SAM Process and the Literature In this section of the report we address the following question: How does the literature inform us about the SAM process theory of action and principal instructional time use? At the end of this review we address the following question: What do prior evaluations of the SAM process suggest as it relates to the literature?
Principal Instructional Leadership
As noted, the SAM process theory of action is deeply rooted in the ideas that instructional leadership is at the center of effective schools and that increasing the time principals spend on instruction will improve the quality of instructional leadership, teaching, and, ultimately, student outcomes. These ideas are supported by a large research base that links principal instructional leadership to positive school outcomes, including improved teacher practices and higher student achievement, across a variety of organizational (e.g., elementary, middle, and high schools; public, private, and public charter), spatial (e.g., urban/suburban), and temporal (1980 through present) contexts (e.g., Day et al., 2009; Heck & Hallinger, 2009; Heck & Hallinger, 2010; Goddard, Neumerski, Goddard, Salloum & Berebitsky, 2010; Leithwood & Jantzi, 2006; May & Supovitz, 2011; Nettles & Harrington, 2007; Quinn, 2002; Robinson, Lloyd, & Rowe, 2008; Sammons, Gu, Day, & Ko2010; Supovitz, Sirinides, & May, 2010). Recent measures of instructional leadership, such as the Vanderbilt Assessment of Leadership in Education (VAL-ED) can distinguish between higher and lower levels of instructional leadership effectiveness (Covay Minor et al., 2014). In short, a program or intervention that encourages increases in principals’ investments in instructional leadership seems a clear step in the right direction to improving school performance.
This conclusion, however, is less clear in the context of the struggle in this literature to settle on a definition of what instructional leadership includes. According to Leithwood, Louis, Anderson, and Wahlstrom (2004), “the term is often more a slogan than a well-defined set of leadership practices” (p. 6). Instructional leaders are often described as leaders who maintain a focus on improving teaching and learning in daily decision making, but there is limited specificity as to what matters for whether instructional leadership leads to school improvement. At a more macro level, the literature provides markers for what this specificity should be, espousing that strong instructional leaders establish a school vision (Murphy & Hallinger,1992), build a school culture (Heck & Hallinger, 2014), create a positive instructional climate (May & Supovitz, 2011; Supovitz et al., 2010), and engage with curriculum and instruction issues with teachers (Horng & Loeb, 2010), among others.

19
At the more micro level of how a principal should conduct his or her day-to-day work, however, the literature provides much less guidance. If the goal is school improvement, simply increasing one’s time on instructional matters may not be sufficient unless that increase is part of a strategy that improves the school’s instructional climate or advances the other broad goals of instructional leadership. Indeed, recent empirical evidence demonstrates that principals who spend more time on instruction-related tasks, broadly defined, achieve no better school growth than principals who spend less (Goldring, Huff, May, & Camburn, 2008; Grissom, Loeb, & Master, 2013). Moreover, instructional investments cannot be undertaken without attention to maintaining a high level of organizational management in the school, which multiple studies have linked to positive school outcomes (Grissom & Loeb, 2011; Horng et al., 2010).
In sum, there is broad research consensus that instructional leadership matters, but there are many open questions as to what the day-to-day, behavioral level of leadership practice should entail to improve school and student outcomes, the level at which the SAM process operates.
The remainder of this review of the literature informs those questions. Specifically, we address four areas germane to the SAM process. First, how much time do principals spend on instructional leadership? Second, beyond time allocation, what do we know about the quality of instructional leadership behaviors? Third, why is it so difficult to change the amount of time principals spend on instructional leadership? Moreover, fourth, what interventions have been studied to date regarding instructional leadership and time use?
Principal Time Allocation on Instructional Leadership
Researchers have been interested in how principals allocate their time across leadership and management tasks for four decades. In early studies, principals devoted little time to instructional matters; instead, principals’ work was characterized by an array of short, fragmented activities often conducted through brief, unplanned personal interactions dominated by managerial issues and unrelated to teaching and learning (Wolcott, 1973; Peterson, 1977). Other research characterized principals’ work as consisting of few self-initiated tasks, many activities of short duration, and an unpredictable flow of work with an emphasis on specific, concrete, and immediately pressing priorities (Pitner, 1982).
Principals in early studies rarely displayed instructional leadership behaviors (e.g., Little & Bird, 1984). One study of secondary school principals found that only 17% of principals’ time and only 8% of the tasks on which they worked dealt with academic matters (Martin & Willower, 1981). Similar conclusions were established in another study on students’ course-taking patterns in high schools (California State Department of Education, 1984), in which the investigators found that principals had little direct involvement with the school curriculum and almost all important decisions in this area (e.g., determining course content, assigning staff, aligning curricula, establishing criteria for student placement) were made by departments and department chairpersons. In their comprehensive ethnographic study, Morris, Crowson, Porter-Gehrie, and Hurwitz (1984) concluded that secondary school principals are “conspicuous by their relative absence from the site of teaching and learning” (p. 57), spending, on average, 7% of their time in classrooms. In a similar study, Willis (1980) reported that the secondary principals observed spent only 2% of their time visiting classrooms. In yet another study (which included elementary schools), Hanson (1981) found that almost all important decisions in the areas of curriculum and instruction were made by teachers.

20
Other early research on the instructional leadership role of elementary school principals reinforces these findings from secondary schools. Morris and his colleagues (1984) reported that the elementary principals they observed devoted 9% of their time to visiting classrooms. Peterson (1977) found that elementary principals spent less than 5% of their time in classrooms. A third study reported that elementary principals spent less than 2% of their total time acting as instructional leaders (Howell, 1981).
A small handful of more recent research has implemented more systematic data collection techniques to measure and understand principals’ time use during the typical school day, such as end-of-day logs and full-day shadowing (see Appendix D for annotated bibliography). For example, Martinko and Gardner’s (1990) structured observations showed that principals’ time was consumed most frequently by unscheduled meetings—they reported that “almost 40 percent were initiated by other people and less than 4 percent were scheduled. Thus, large amounts of both time and events were apparently spontaneous” (Martinko & Gardner, 1990, p. 344). Horng et al., (2010) and Grissom et al. (2013) found that on average, principals spent less than 13% of their time on instruction-related activities; principals’ days were instead dominated by administrative and managerial activities. The latter study showed that brief classroom walkthroughs were the most common of those instructional activities, comprising about half that time. Coaching, in which principals discuss with teachers how they can improve their practice, proved a very rare occurrence. Similarly, May and Supovitz (2011) found that principals spent a small portion of time on instruction, only 8% overall, while Goldring and colleagues (2008) found 20% of the principal’s typical day is spent on instructional matters.
In summary, while principals perhaps spend more of their time on instructional activities today than they did in the 1970s and 1980s, time devoted to purposeful engagement with instruction remains below one-fifth of the typical school day. These meager numbers coupled with the literature relating principal instructional leaders to school improvement and student outcomes suggest that there is substantial merit for an intervention aimed at increasing principals’ time allocation to instructional domains, such as the SAM process.
Beyond Time Allocation: Specificity and Quality of Instructional Leadership
While the spotlight is on principals’ time allocation to instructional leadership roles, there are other aspects of instructional leadership beyond how time is organized that must be considered simultaneously to realize the goal of improving instructional leadership. These include both specificity and quality of instructional leadership behaviors. Unfortunately, the research in this area is thin, and we suggest that research on the SAM process can inform this important gap in our understanding of school leadership.
There is limited consensus regarding which specific behaviors constitute instructional leadership roles and whether some behaviors are of higher value than others for improving instruction, student achievement, and other outcomes (Grissom et al., 2013; Neumerski, 2013; Robinson et al., 2008; Supovitz, Sirinides, & May, 2009). In general, studies define principal instructional leadership in broad actions, such as having a visible presence, setting goals for the school, visiting classrooms, supervising instruction, providing feedback to teachers, and coordinating curriculum (Hallinger & Murphy, 1985; Hallinger, 2005; Horng & Loeb, 2010). Empirical studies of these broad domains typically have relied on judgments of principals (by themselves or teachers) from surveys of how frequently or effectively principals engage in these areas. More

21
recent empirical work aiming to document principal time via end-of-day logs or in-person observations have further defined tasks such as monitoring/observing instruction, supporting teachers’ PD, analyzing student data or work, modeling instructional practices, and teaching a class as the domains of instruction leadership (Goldring et al., 2008; Grissom et al., 2013).
Moreover, as teacher evaluation systems have become more central to the policy landscape, tasks such as conducting structured classroom observations, providing teachers with feedback, having “courageous conversations” with teachers about performance, placing teachers on improvement plans, monitoring teacher progress via data systems, and removing consistently low-performing teachers are increasingly recognized as key components of the instructional leadership role (Goldring et al., 2015). These emerging roles highlight the importance of greater specificity in defining for principals what effective instructional leadership is in response to policy changes.
Thus, the literature suggests that allocation of time alone does not address the quality of the leadership behaviors. Quality of practices can be on a continuum from effective to poor. Practices also vary in frequency, from routinely performed to rarely undertaken. Scope, a characteristic that first surfaced empirically in work by May and Supovitz (2011), addresses the number (or percent) of people touched by a leader’s practice, from one to all. Intensity is an important element of practice as well, ranging from high to low. Range addresses the coverage of behaviors from few to many. Integration refers to the extent to which practices are aligned and coherent (see Murphy, Neumerski, Goldring, Grissom, & Porter, 2014).
Therefore, the extent to which a change in time allocation to instructional leadership alone, versus a change in allocation to specific sets of both behaviors and practices, as well as the quality of those practices, is related to school improvement and is an important area for empirical research. A study of the SAM process could provide important insights to the field regarding the relationships among the allocation of instructional leadership time, the quality of specific instructional leadership behaviors, and school outcomes.
Challenges to Increasing Principal Instructional Leadership
Rhetoric, policy, and the literature all appear to support the need for principals to devote time to instructional leadership, but little change in time devoted to this aspect of principal leadership has been documented over decades. Why? The analysis in the literature establishes three reasons for the quite limited progress in changing principal attention to instructional issues in their schools: (1) organizational norms push them away from instructional leadership (Murphy, Hallinger, & Heck, 2013); (2) principals lack skills and knowledge about learning, teaching, and related domains required to undertake instructional leadership work; and (3) principals lack sufficient time to do the work, largely because of the press of other responsibilities. The SAM process intervenes to address these challenges.
Organizational Norms away from Instructional Leadership
One aspect of the gap between teaching and school administration is what organizational scholars refer to as the norm of legitimacy, what counts as appropriate work for teachers and principals (Little, 1988). In short, the job of teachers is to teach and the task of principals is to manage (Doyle, 2000). At the heart of this norm is the understanding that learning and teaching and the places where they occur are the rightful and often inviolate domain of teachers (Barth,
22
2001). Relatedly, the definition of teacher professionalism has formed over time to include a strong pattern of autonomy (Griffin, 1995; Smylie & Hart, 1999). Thus, historically, principals have been reluctant to interfere or question teaching practices.
Principals traditionally were not held accountable for teaching, learning, and outcomes for students. Evaluations of principals tended to rest on their ability to maintain a non-conflictive school environment; that is, to keep order among students and calm between teachers and administrators and between the school and the larger community. The formal and informal expectations of many districts thus actively pushed principals away from instructional leadership functions and toward those building and political management activities that determine whether they survive and flourish professionally (Murphy, 2013; Callahan & Button, 1964).
Lack of Skills and Knowledge about Learning, Teaching, and Related Domains
Traditionally, the principalship has been a management role rather than an educational one (Murphy, 1992), with principal preparation programs rooted in management fields and largely ignoring matters of teaching and learning, pedagogy, and curriculum (Greenfield, 1988; Hills, 1975; Norton & Levan, 1987). With the accountability era came expectations that principals would drive the improvement of teaching in struggling schools, but many principals remained unprepared to meet these demands and were offered few tools or development opportunities to help them learn to lead for improvement. Volumes have been written about the shortcomings of preparation programs and PD opportunities (Young, Crow, Murphy, & Ogawa, 2009; Grissom & Harrington, 2010).
The introduction of federally funded Race to the Top has added further pressure to the idea that the principal should be an instructional leader, but it remains unclear how principals will develop the skills and knowledge to undertake these new responsibilities. By and large, much of the PD for principals is inadequate and insufficient to change principal behavior and practices.
Lack of Sufficient Time to Do Instructional Leadership Work
Principals are expected to fulfill a large variety of disparate roles with competing expectations and demands from teachers, parents, central office staff, and others. As already noted, the average workday of principals is characterized by attention to a variety of tasks, fragmentation of activities, brevity of attention to issues, and lack of control over how they spend their time. Some instructional leadership domains, however, demand uninterrupted blocks of time for activities such as planning, writing, conferencing and observing, analyzing curriculum, and developing professional growth activities for staff. The result is that much important work on instructional matters is lost to the day-to-day operation of the typical school (Murphy, Hallinger, Lotto, & Miller, 1987).
Many principals are unequipped with the time management skills necessary to prioritize these instructional functions (Grissom, Loeb, & Mitani, in press). The introduction of new teacher evaluation systems with their new emphasis on teacher observation and feedback may prove to increase principals’ time on instruction, but potentially only in specific areas of instructional leadership. Furthermore, these new responsibilities continue to compete with principals’ responsibilities for managing and running the day-to-day functions of the school. In short, increased accountability expectations have done little to change the structure of principals’ daily
23
work routines to allow them the time to focus on instruction; demands to manage the school facilities and budgets have continued, despite the increased pressure to add instructional leadership to the mix (Murphy & Beck, 1994; Murphy & Meyers, 2008; Neumerski et al., 2014).
Past Interventions to Increase Principal Time Use
Despite the consensus regarding the centrality of instructional leadership for school improvement, there have been no large-scale interventions that we know of that have attempted to specifically focus on changing principal time allocation beyond the SAM process. Furthermore, there have been very few randomized controlled trials (RCTs) aimed at principal development overall (see Camburn, Goldring, Sebastian, May, & Huff, in press). In contrast, an array of public and private organizations has devoted money and programmatic activity to increasing and improving principal instructional leadership. The U.S. Department of Education has sponsored the School Leadership Development Grant program “to support the development, enhancement, or expansion of innovative programs to recruit, train, and mentor principals (including assistant principals) for high-need [local education agencies].” In 2013, 20 individual awards were made for more than $13 million. Similarly, districts, states, professional organizations, nonprofits, think tanks, and for-profit organizations all offer preparation and PD, many, if not most, stressing increased quality and quantity of instructional leadership.
Despite the optimism that some researchers, policymakers, and practitioners have about the potential benefits of principal development programs, evidence of the efficacy of principal PD is scarce, with little of that evidence coming from studies that permit strong causal inferences about whether and how PD influences principals or other important outcomes (LaPointe, Meyerson, & Darling-Hammond, 2006).
While advocacy has increased for experiments in education research, few have been conducted in the field of educational leadership. Camburn and colleagues (in press) assessed the availability of such evidence through a search of the Campbell Collaboration Social, Psychological, Educational & Criminological Trials Register (C2-SPECTR) and the What Works Clearinghouse. C2-SPECTR contains abstracts of more than 10,000 randomized trials in the fields of sociology, psychology, education, and criminology. The authors searched C2-SPECTR using the terms “principal” and “leadership” and keywords “educational administration” and “educational supervision.” These searches identified a total of 18 articles. Of these, only three involved studies in which principals participated as subjects in a randomized experiment. One of these studies assessed principals’ decision making in the teacher hiring process (Young, 1997). The remaining two randomized trials tested the effect of principals’ participation in PD on their practice. In an experiment reported by Thomas (1970), 28 principals were randomly assigned to participate in five days of training designed to improve their relationships with staff members. The study found “more positive change by principals in the experimental group than by those in the control group, and showed that laboratory training in interpersonal relations positively affected the administrator’s behavior with his staff” (Thomas, 1970). In the third randomized experiment, principals were randomly assigned to one of four conditions: (1) principals but not their teachers participated in a classroom management and a supervision workshop; (2) both teachers and principals participated in a classroom management workshop; (3) teachers participated in a classroom management workshop, but principals did not; and (4) neither teachers nor principals participated in the workshop (Grimmet & Crehan, 1987). The results

24
indicated that supervision behavior was more effective when both teachers and principals participated in the workshop training.
We note that a second major repository of experimental evidence on educational interventions, the What Works Clearinghouse, systematically excludes studies that do not examine student outcomes and thus, by design, is unlikely to include studies of the effects of PD programs on principals.
A limited number of relatively new randomized experiments involving principals are currently emerging from the field. In one such study, for example, the School Leadership Improvement Study, principals were randomly assigned to either receive or not receive the Balanced Leadership program (Jacob, Goddard, Kim, Miller, & Goddard, 2014). More recently, the U.S. Department of Education has embarked on a rigorous, large RCT of one principal PD program. The results of that study will not be available for years.
We conclude from this literature search that experimental evidence on principals, their practice, and the effect of principal development programs (either PD or pre-service) is limited. We know of no studies that have examined the outcome of an intervention on principal time use. The extant published empirical work on leadership effects is primarily (a) correlational, (b) cross-sectional, and (c) non-interventional. Positive findings from correlational and quasi-experimental studies provide a persuasive promise, while the lack of rigorous causal leadership studies provides a compelling need for rigorous evaluations, including of the SAM process.
Conclusion
Given prevailing forces that continue to push against principals spending time on instructional leadership behaviors, targeted and specific strategies to help principals undertake this uphill struggle to become instructionally oriented leaders and reshape their work are required. The SAM process is the only process we are aware of that squarely intervenes on principal time use to increase instructional leadership.
The SAM process is designed to help principals become more focused and deliberate around the domains of instructional leadership, and it addresses the problems noted in this section that have made increasing energy and time to the instructional dimensions of schools so problematic. Therefore, we conclude from the literature review that the SAM process needs to be studied with seriousness and rigor.
In addition, the literature review surfaces four important questions that should be investigated in a study of the SAM process beyond the main question of whether it works: (1) If the process is found to change instructional leadership behaviors and practices, why does the change occur? (2) What specific domains of instructional leadership impact school leadership? (3) How does the quality of the instructional leadership impact school outcomes? And (4) What types of effects does the SAM process have on schools, teachers, and students?
Previous Evaluation Reports of the SAM Process
25
Given that there are no similar evaluations of principal time use, the PSA evaluations and an unpublished manuscript of the SAM process in Davenport, Iowa (Kilmer, Shen, Wolff, & Yager, 2014) are the primary source of direct study of the SAM process. The SAM evaluation by PSA for the Wallace Foundation, and reviewed by the Vanderbilt research team, indicate that the theory of action of the SAM process initiative at the time was that increasing principal time on instructional leadership work would lead to better outcomes for the school—envisioned in terms of student learning. Our most direct evidence of the latter linkage is that student achievement gains were assessed in the PSA evaluation. The operational model was that ratcheting up principal time devoted to instruction, as defined by the indicators in the baseline data collection tool, was the key to school improvement. Surrounding the logic was the belief that the SAM role, time tracking and the SAM Daily Meeting, coaches for principals, and the yearly PD experience would make the model work.
According to our review of the PSA reports, the model did what it was intended to do: It increased the percent of time principals spent on instructional tasks (Turnbull, White, & Arcaira, 2010) (Turnbull, White, & Sinclair, 2011) (Turnbull, Haslam, Arcaira et al., 2011). But the PSA evaluation does not find consistent evidence that implementing the SAM process produces increases in student achievement. We note that the PSA achievement analysis, described in the report as “preliminary,” faces a number of statistical and data limitations that preclude strong conclusions from being drawn from it. Thus, we believe more research is warranted in a rigorous causal design.
A topic that was not addressed in the PSA studies is the quality of instructional time usage. While the SAM data collection process is exceptionally powerful in providing information on the what, when, and where of principal time usage, it is silent on the why and how issues. That is, there are no data on the quality of time usage, an issue highlighted in the literature review. Thus, we are left with a bit of a new black box that needs to be explored.
A second issue that merits attention is time for impacts to materialize. Research to date shows us that the effects of principals are indirect, that principal action is mediated by the instructional program and school culture. Considerable research tells us that changes in these two domains take significant time to unfold. Thus, an important note is that more than two years may be necessary for effects in student learning to appear. Furthermore, as will be noted in the section of this report on implementation, some aspects of the SAM process are more difficult to implement well than others and may take more time.
In addition, a study of the SAM process must examine mediating factors more closely related to principal leadership, such as changes in the instruction, quality of feedback to teachers, culture, and reciprocal trust.
Furthermore, there have been notable changes to the SAM process since the earlier PSA evaluations: implementation specialists, a more sophisticated TimeTrack calendar allowing for data disaggregation and deeper analyses, and enhanced PD, to name a few. It is plausible that the enhancements of the SAM process, such as Implementation Specialists and more PD, address the need to increase the knowledge, dispositions, and skill sets of principals that might have been insufficient in the original SAM process logic model. Although some developmental activities were built into the earlier SAM model (i.e., the yearly conference and the coaching strategy), they were likely not enough to address these needs. The law of school improvement here is that it
26
is very difficult to lead what one does not know. It may be that insufficient attention was provided to these input variables in the earlier SAM process. At best, there was an implicit sense that these inputs were malleable and that they would grow during the process. In the current theory of action, much more direct attention is provided. Given changes to the SAM process, new evaluation is highly warranted.
IV. The Actual: SAM Process Implementation in the Field In this section, we address the current implementation of the SAM process in the field. We provide an overview of who is currently implementing the SAM process and which models are being implemented. We report the goals and motivations behind the adoption of the SAM process, as well as the benefits and challenges schools experience in implementing the process. We also highlight the ways in which schools implement the essential components of the SAM process with fidelity and the ways in which they adapt the process to their specific needs. We conclude with suggestions for improvement.
We draw on a variety of data to address these issues, namely interviews with key leaders at the NSIP; interviews with PSA staff members; interviews with principals, SAMs, First Responders, and district officials in four case study districts; interviews with Time Change Coaches and Implementation Specialists; Time/Task Analysis and TimeTrack calendar data; results of the principal and SAM surveys; and NSIP documents and artifacts.
Spread of Current Implementation
In this section, we report on the implementation of the SAM process, including the locales of SAM implementation across the United States, years of experience in the program, and the specific models being implemented.
As of January 9, 2013, based on data from NSIP, 63 districts were participating in the SAM process, with the greatest numbers in Iowa, Delaware, and Illinois. These districts had anywhere from one (e.g., Caruthersville Public Schools [MO]) to 84 (Hillsborough County Public Schools [FL]) active SAM schools. In total, there were 481 active SAM schools (or teams), distributed across the nation as shown in Figure 3, with Iowa, North Carolina, and Florida having the most teams.

27
Figure 3: Distribution of SAM Teams as of January 30, 2013
Not all schools in a district participate in the SAM process. This is not surprising in that, largely, the process is voluntary. In the 13 districts for which we were provided information on percent participation, the level ranged from 21% (Boston Public Schools [MA]) to 88% (Council Bluffs Community School District [IA]). On average, 43% of district schools participated.
Length of participation ranged from one-tenth of one year (e.g., Manchester School District, NH) to 9.4 years (Jefferson County Public Schools, KY), with an average of 2.7 years.
Of the 481 schools, 77 (16%) were implementing Model 1 (a newly hired SAM), 3 (less than 1%) were implementing Model 2 (in which a current staff member took on the role of a full-time SAM), and 401 (83%) were implementing Model 3 (adding the SAM responsibilities to existingschool personnel).
From the survey data, we learned that SAMs held various positions in the school. According to principals who responded to this question (N = 302), those positions were:
• 189 (63%) secretaries, • 74 (25%) assistant principal, • 12 (4%) school business manager/bookkeepers, • 36 (12%) teachers, and • 107 (35%) other positions, including school counselors, parent coordinators, and
deans, plus a small number of Model 1 SAMs.
Note that some schools have more than SAM, some of whom are in different roles, so the percentages sum to more than 100%. Of those reporting more than one position, many (12% of the full sample) had a secretary and assistant principal combination. Five percent of principals reported having a staff person dedicated exclusively to the SAM position. Twenty-seven percent of the principals had their SAMs change at some point, excluding those changes that occurred because the principals changed schools or their SAM left the school.
In January 2015, we received follow-up information regarding the distribution of SAM teams. At this time, NSIP reported 1,042 TimeTrack calendar users (including assistant principals, principal supervisors, and other district officials) and 714 SAM teams. Among the 714 SAM teams, 46% were in their first year, and 32% were in their second year. Sixty-four percent were

28
elementary teams, 16% were middle school teams, 17% were high school teams, and 4% were other, including principal supervisors or principals in schools with non-traditional structures. The average school enrollment for schools participating in the SAM process was 684 students, 66% of whom were eligible for free and reduced-price lunch.
Goals for Adopting the SAM Process
Principals largely reported that participation in the SAM process was voluntary. Overall, they were motivated to adopt the SAM process to improve their capacity as instructional leaders and to spend more time on instruction. Many were also interested in using the process to gain a better work/life balance.
Principals’ Perspectives
We surveyed principals to better understand their motivations for adopting the SAM process. Principals were asked to rate the importance of various factors in their decision to participate in the SAM process. Ninety-four percent of surveyed principals rated both “I wanted to spend more time on instructional tasks” and “I wanted to improve my skills as an instructional leader” as “very important” or “extremely important” in their decision. Seventy-four percent rated wanting “to achieve a better work/life balance” as very or extremely important. Interestingly, 46% also noted that superintendent or other central office administrator encouragement was very or extremely important; 50% wanted help with administrative tasks.
Figure 4: Principal Motivations for Participating in the SAM Process
Interview data from the four case study schools largely supported these findings. The large majority of principals described joining the SAM process to improve instructional leadership, and to a lesser extent, they specifically mentioned student achievement. While a few new principals hoped the process would teach them to become instructional leaders, most principals already considered themselves instructional leaders and hoped the SAM process would help them improve. They noted that the process would enable them to “be more organized” or

29
“manage their day” in ways that would allow for a deeper focus on instruction. As one principal explained, “I don’t need the instructional leadership training. I need something that’s more logistical and operational to help structure my time more so I can use my strengths in the instructional area to their maximum, and so when this came along, I immediately wanted to do it.” A Time Change Coach made a similar comment about why principals adopt the SAM process: “Number one …, they really do want to impact teaching and learning in their buildings. They want to impact teacher practice. They want to understand more deeply what’s happening in classrooms. Some of them do it, because they, as leaders, have a need to … it’s really from the professional development end for themselves as leaders. Others feel very strongly that they have the skills to be that instructional leader, but they have never been able to figure out how to spend the time doing it. Or how to set goals around how they should spend their time.”
These results reflect NSIP’s perspective that improving instructional leadership is the primary motivation for principals to participate. The NSIP director explained: “Most principals didn’t sign up to be a principal to be a manager, and so the idea … of being able to get a better handle on what that life would be and be able then to focus more energy and time on instructional leadership work is really appealing to most principals.”
Many principals sought work/life balance through the adoption of the SAM process. A principal, who already felt competent at instructional leadership recognized that he was “really struggling with time management and really the balance between instruction, management, and the balance between work and personal life …. So when this was offered up, [he] jumped at the opportunity.”
A few principals explicitly hoped the process would improve student achievement. For example, one veteran principal expressed: “No matter what I was doing as far as the students and what I thought was the best, I still wasn’t getting what I wanted. In the end, I wasn’t getting the scores that I wanted …. My hope was that [SAM] would impact student learning.” She contrasted her motivation for adopting the SAM process with that of many of her peer principals, who, she believed, mainly sought to improve their time management and work/life balance, not to increase student learning: “I do have 20 years in, so I’m way past the days of spending until 10:00 here … so I wasn’t really one of those people that was hoping to find a way to still get your job done within a reasonable amount of time …. But I did want to be able to use the time at school more wisely.”
Although NSIP described the importance of principals reflecting on the quality of their instructional time, only a handful of principals across districts identified this as a motivating factor for adopting the SAM process. The reason for this disparity is unclear. It may be that reflection develops later in implementation, rather than as a motivating factor at the outset.
Only two principals of the 16 we interviewed felt pressured by district administrators to adopt the SAM process. One principal believed he had been “voluntold” to implement the process, and for this reason, he was largely unmotivated to take part in it. Another principal felt her district nudged her to consider it, explaining, “The percentage of time spent on instruction versus management is certainly something that the district wants us to look at.”

30
SAMs’ Perspectives
In general, most SAMs were aware of their principals’ goals for joining the process and largely echoed their sentiments around the need to focus more intensely on instruction. However, some SAMs were not able to articulate these goals as fully or deeply as the principals. For example, one SAM talked about the goal as “seeing how much curriculum and instruction and how much management the principal has on [the TimeTrack calendar] charts.” While some SAMs could explain their principals’ reasoning for adopting the process, overall they seemed to have less of an understanding of its long-term goals. One possible reason is that some of the SAMs were still relatively new to the process when we interviewed them and were still trying to fully understand it. However, this does suggest that some SAMs may need additional coaching around the goals and potential benefits of the process. Another possible explanation is that many SAMs are secretaries or assistants, and they may not be in a position to know enough about educational leadership.
District Perspective
Interviews suggest that the most prevalent reason for adopting the SAM process at the district-level is to improve principals’ instructional leadership and to increase student achievement. In fact, district staff were more likely than principals to note student achievement as a motivating factor for adopting the process, often as a result of improved instructional leadership.
Said one district official: “We’re not performing as well as we could be as a district, so it’s been very difficult for us to really impact leadership performance at a broad scale, and so when we began to do the research for SAM, we saw the value of, look, here is what you’re able to do as a SAM principal, which is find this additional time from your current time. That really helps you devote time on instructional leadership.” That focus is now shifting to increasing the quality of time spent on instruction. “Now the key piece is—so now sometimes even though you have that additional time, it’s what are we actually doing with that time. That’s the next level of the conversation.”
Time Change Coaches and Implementation Specialists echoed the idea that districts are largely motivated to adopt the SAM process to increase the instructional leadership of principals in ways that positively impact student achievement. As one coach explained, districts are interested in the process to “help [principals] to manage it all in an effective, clear fashion so that instead of spending all their time on the management things that don’t touch student achievement … helping that principal to build a team so that they can really take care of the priorities of teaching and learning.”
A district official explained the way in which the SAM process might help principals to focus more closely on teaching and learning: “The job of the principal is so cumbersome and it’s virtually impossible to do as one person, so you have to figure out as a system, ‘How do you create—with all the demands on principals—how do you help them organize their time to pay close attention to what’s happening in classrooms?’ And this is a low cost way to do that.”
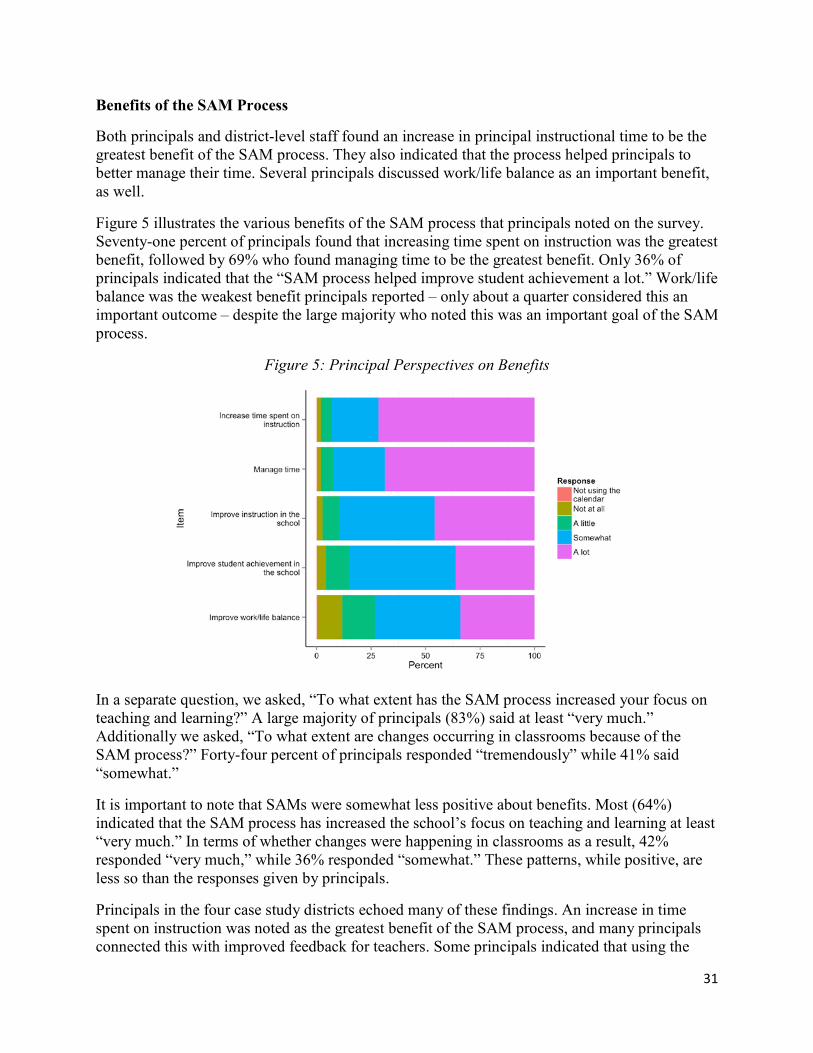
31
Benefits of the SAM Process
Both principals and district-level staff found an increase in principal instructional time to be the greatest benefit of the SAM process. They also indicated that the process helped principals to better manage their time. Several principals discussed work/life balance as an important benefit, as well.
Figure 5 illustrates the various benefits of the SAM process that principals noted on the survey. Seventy-one percent of principals found that increasing time spent on instruction was the greatest benefit, followed by 69% who found managing time to be the greatest benefit. Only 36% of principals indicated that the “SAM process helped improve student achievement a lot.” Work/life balance was the weakest benefit principals reported – only about a quarter considered this an important outcome – despite the large majority who noted this was an important goal of the SAM process.
Figure 5: Principal Perspectives on Benefits
In a separate question, we asked, “To what extent has the SAM process increased your focus on teaching and learning?” A large majority of principals (83%) said at least “very much.” Additionally we asked, “To what extent are changes occurring in classrooms because of the SAM process?” Forty-four percent of principals responded “tremendously” while 41% said “somewhat.”
It is important to note that SAMs were somewhat less positive about benefits. Most (64%) indicated that the SAM process has increased the school’s focus on teaching and learning at least “very much.” In terms of whether changes were happening in classrooms as a result, 42% responded “very much,” while 36% responded “somewhat.” These patterns, while positive, are less so than the responses given by principals.
Principals in the four case study districts echoed many of these findings. An increase in time spent on instruction was noted as the greatest benefit of the SAM process, and many principals connected this with improved feedback for teachers. Some principals indicated that using the
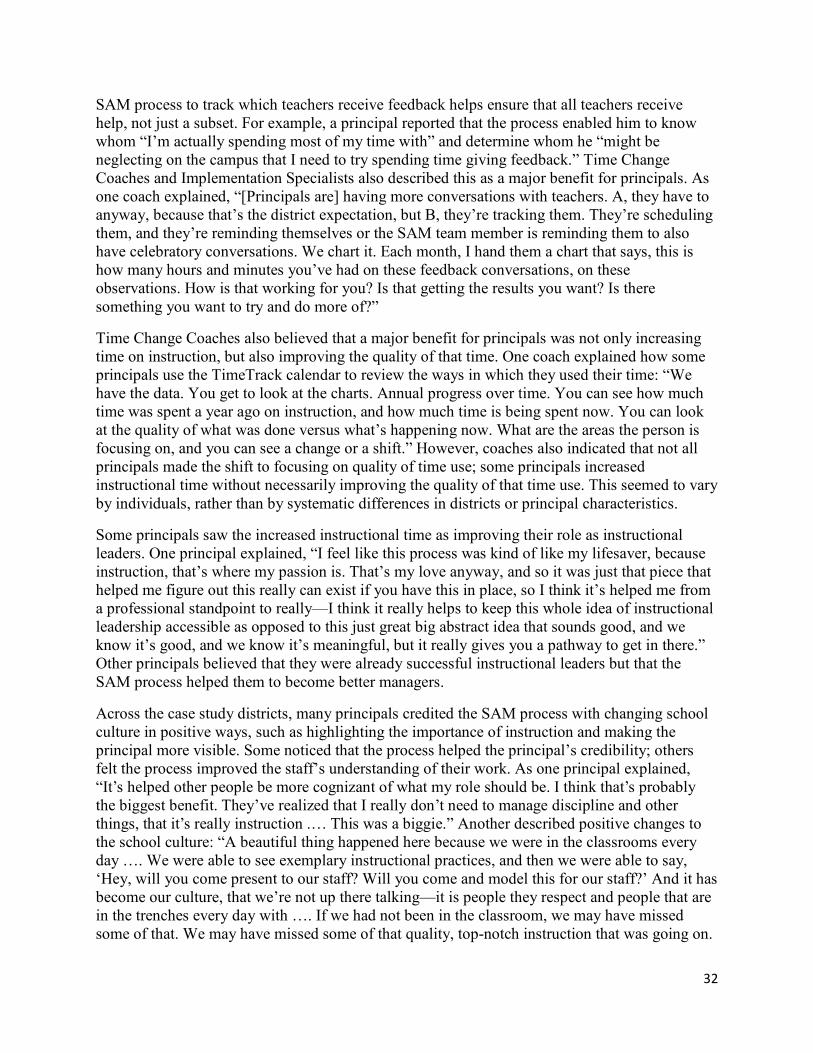
32
SAM process to track which teachers receive feedback helps ensure that all teachers receive help, not just a subset. For example, a principal reported that the process enabled him to know whom “I’m actually spending most of my time with” and determine whom he “might be neglecting on the campus that I need to try spending time giving feedback.” Time Change Coaches and Implementation Specialists also described this as a major benefit for principals. As one coach explained, “[Principals are] having more conversations with teachers. A, they have to anyway, because that’s the district expectation, but B, they’re tracking them. They’re scheduling them, and they’re reminding themselves or the SAM team member is reminding them to also have celebratory conversations. We chart it. Each month, I hand them a chart that says, this is how many hours and minutes you’ve had on these feedback conversations, on these observations. How is that working for you? Is that getting the results you want? Is there something you want to try and do more of?”
Time Change Coaches also believed that a major benefit for principals was not only increasing time on instruction, but also improving the quality of that time. One coach explained how some principals use the TimeTrack calendar to review the ways in which they used their time: “We have the data. You get to look at the charts. Annual progress over time. You can see how much time was spent a year ago on instruction, and how much time is being spent now. You can look at the quality of what was done versus what’s happening now. What are the areas the person is focusing on, and you can see a change or a shift.” However, coaches also indicated that not all principals made the shift to focusing on quality of time use; some principals increased instructional time without necessarily improving the quality of that time use. This seemed to vary by individuals, rather than by systematic differences in districts or principal characteristics.
Some principals saw the increased instructional time as improving their role as instructional leaders. One principal explained, “I feel like this process was kind of like my lifesaver, because instruction, that’s where my passion is. That’s my love anyway, and so it was just that piece that helped me figure out this really can exist if you have this in place, so I think it’s helped me from a professional standpoint to really—I think it really helps to keep this whole idea of instructional leadership accessible as opposed to this just great big abstract idea that sounds good, and we know it’s good, and we know it’s meaningful, but it really gives you a pathway to get in there.” Other principals believed that they were already successful instructional leaders but that the SAM process helped them to become better managers.
Across the case study districts, many principals credited the SAM process with changing school culture in positive ways, such as highlighting the importance of instruction and making the principal more visible. Some noticed that the process helped the principal’s credibility; others felt the process improved the staff’s understanding of their work. As one principal explained, “It’s helped other people be more cognizant of what my role should be. I think that’s probably the biggest benefit. They’ve realized that I really don’t need to manage discipline and other things, that it’s really instruction .… This was a biggie.” Another described positive changes to the school culture: “A beautiful thing happened here because we were in the classrooms every day …. We were able to see exemplary instructional practices, and then we were able to say, ‘Hey, will you come present to our staff? Will you come and model this for our staff?’ And it has become our culture, that we’re not up there talking—it is people they respect and people that are in the trenches every day with …. If we had not been in the classroom, we may have missed some of that. We may have missed some of that quality, top-notch instruction that was going on.
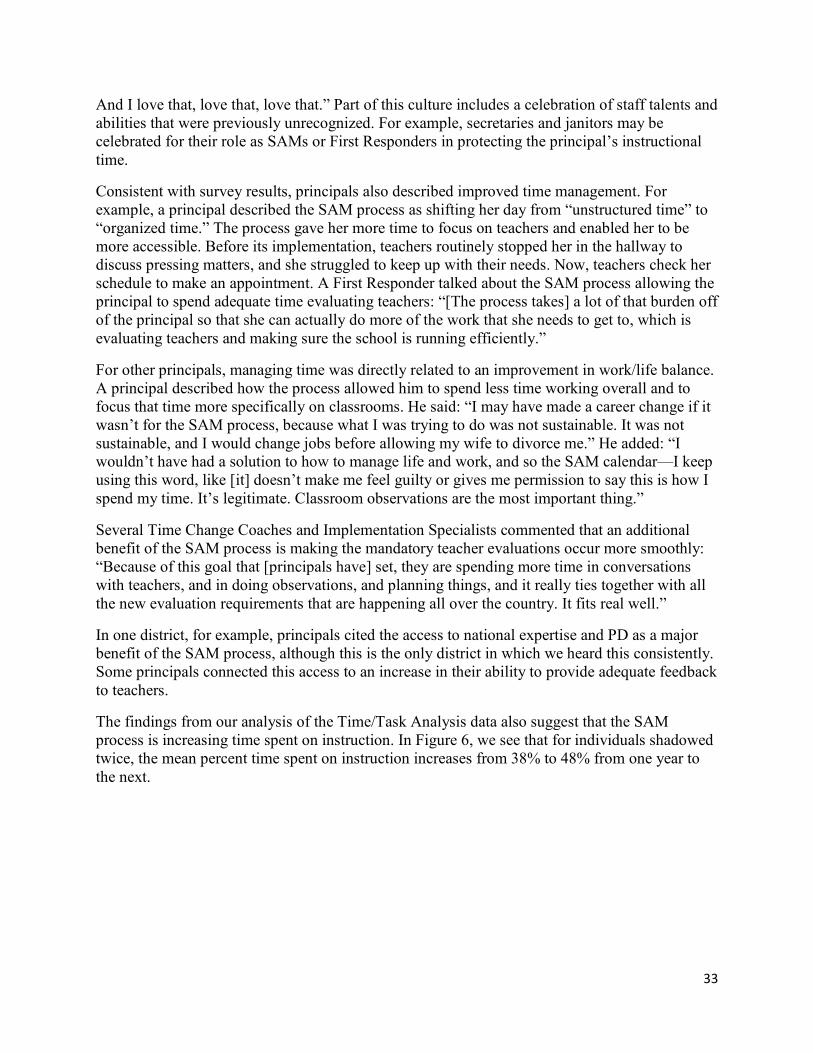
33
And I love that, love that, love that.” Part of this culture includes a celebration of staff talents and abilities that were previously unrecognized. For example, secretaries and janitors may be celebrated for their role as SAMs or First Responders in protecting the principal’s instructional time.
Consistent with survey results, principals also described improved time management. For example, a principal described the SAM process as shifting her day from “unstructured time” to “organized time.” The process gave her more time to focus on teachers and enabled her to be more accessible. Before its implementation, teachers routinely stopped her in the hallway to discuss pressing matters, and she struggled to keep up with their needs. Now, teachers check her schedule to make an appointment. A First Responder talked about the SAM process allowing the principal to spend adequate time evaluating teachers: “[The process takes] a lot of that burden off of the principal so that she can actually do more of the work that she needs to get to, which is evaluating teachers and making sure the school is running efficiently.”
For other principals, managing time was directly related to an improvement in work/life balance. A principal described how the process allowed him to spend less time working overall and to focus that time more specifically on classrooms. He said: “I may have made a career change if it wasn’t for the SAM process, because what I was trying to do was not sustainable. It was not sustainable, and I would change jobs before allowing my wife to divorce me.” He added: “I wouldn’t have had a solution to how to manage life and work, and so the SAM calendar—I keep using this word, like [it] doesn’t make me feel guilty or gives me permission to say this is how I spend my time. It’s legitimate. Classroom observations are the most important thing.”
Several Time Change Coaches and Implementation Specialists commented that an additional benefit of the SAM process is making the mandatory teacher evaluations occur more smoothly: “Because of this goal that [principals have] set, they are spending more time in conversations with teachers, and in doing observations, and planning things, and it really ties together with all the new evaluation requirements that are happening all over the country. It fits real well.”
In one district, for example, principals cited the access to national expertise and PD as a major benefit of the SAM process, although this is the only district in which we heard this consistently. Some principals connected this access to an increase in their ability to provide adequate feedback to teachers.
The findings from our analysis of the Time/Task Analysis data also suggest that the SAM process is increasing time spent on instruction. In Figure 6, we see that for individuals shadowed twice, the mean percent time spent on instruction increases from 38% to 48% from one year to the next.

34
Figure 6: Change in Instructional Time for Individuals Shadowed Twice
Concomitantly, time spent on management decreases from one year to the next.
Figure 7: Change in Management Time for Individuals Shadowed Twice
We also have evidence of the impact of the SAM process in the TimeTrack calendar data. We might consider the second-year participants, for a moment, to be representative of what the first-year participants will look like in the next year. With this consideration, it appears that most of the growth in time spent on instruction occurs in the first year; after that, the time principals spent on instruction follows a more seasonal, regular pattern that is always greater than what was recorded during in their first year. This change with years of participation is evidence that the SAM process may indeed be having some impact on instructional time use, as we would otherwise expect trajectories to be consistent across amounts of experience.
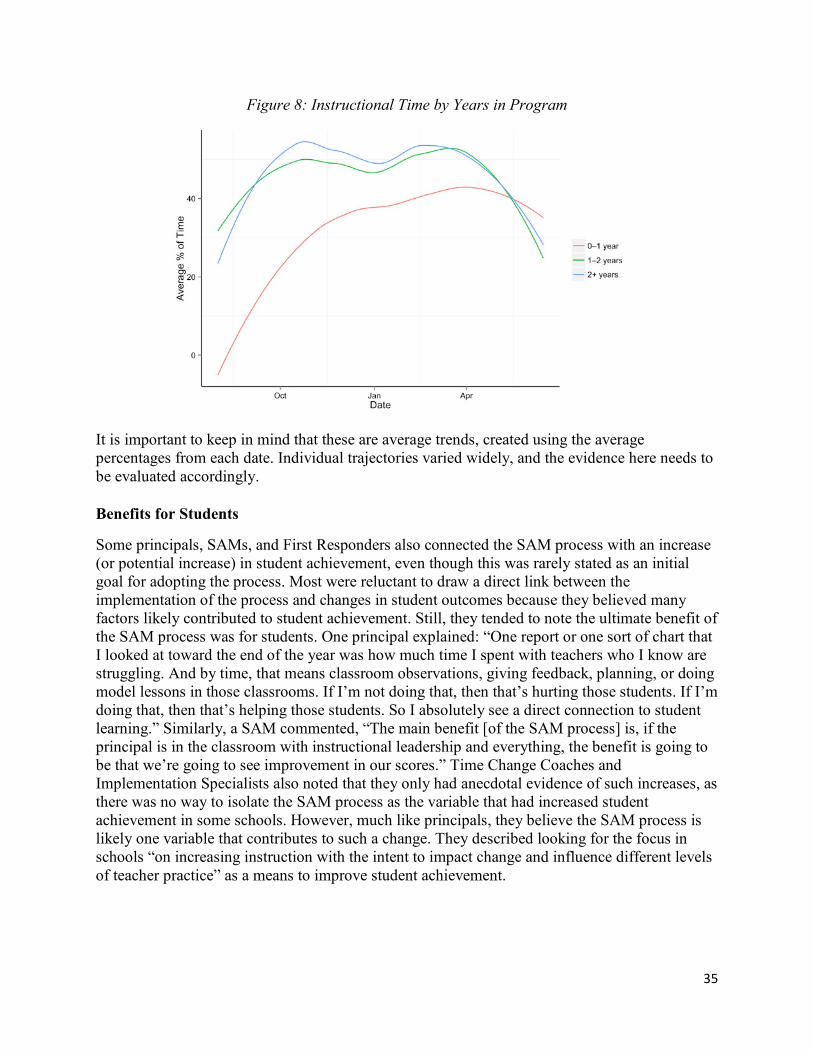
35
Figure 8: Instructional Time by Years in Program
It is important to keep in mind that these are average trends, created using the average percentages from each date. Individual trajectories varied widely, and the evidence here needs to be evaluated accordingly.
Benefits for Students
Some principals, SAMs, and First Responders also connected the SAM process with an increase (or potential increase) in student achievement, even though this was rarely stated as an initial goal for adopting the process. Most were reluctant to draw a direct link between the implementation of the process and changes in student outcomes because they believed many factors likely contributed to student achievement. Still, they tended to note the ultimate benefit of the SAM process was for students. One principal explained: “One report or one sort of chart that I looked at toward the end of the year was how much time I spent with teachers who I know are struggling. And by time, that means classroom observations, giving feedback, planning, or doing model lessons in those classrooms. If I’m not doing that, then that’s hurting those students. If I’m doing that, then that’s helping those students. So I absolutely see a direct connection to student learning.” Similarly, a SAM commented, “The main benefit [of the SAM process] is, if the principal is in the classroom with instructional leadership and everything, the benefit is going to be that we’re going to see improvement in our scores.” Time Change Coaches and Implementation Specialists also noted that they only had anecdotal evidence of such increases, as there was no way to isolate the SAM process as the variable that had increased student achievement in some schools. However, much like principals, they believe the SAM process is likely one variable that contributes to such a change. They described looking for the focus in schools “on increasing instruction with the intent to impact change and influence different levels of teacher practice” as a means to improve student achievement.

36
Benefits for Staff
Overall, principals reported that their staff felt more valued because of the SAM process. In particular, SAMs and First Responders were given additional responsibilities, and the importance of their role was shared with the school. Principals believed that other school leaders, such as assistant principals, also benefited from the process, sometimes adopting TimeTrack calendars for themselves and shifting their own focus more heavily on instruction.
Time Change Coaches indicated that another benefit is when the leadership in a SAM school shifts from being that of the solitary principal to a shared approach. Specifically, the First Responder system invites school staff to take on new responsibilities, which protects the principal’s instructional time while building a sense of distributed leadership throughout the school. One coach explained: “The leadership really does become a much more distributed model. It has to. If the principal is going to spend a greater amount of time with teachers, and that’s not always just in the classroom … you have to have other people in your building that you rely on to be leaders in a variety of areas, whether it’s content areas or whether it’s in office things, management things. So it really does lead to a much more distributed model when principals are truly and fully implementing the process.” This shift in leadership was a major benefit noted by Time Change Coaches.
Several SAMs described direct benefits for themselves. For example, one SAM believed the greatest outcome of the SAM process was that she could better manage the principal’s schedule and was able to spend more time with him with fewer interruptions. Although she saw this as a benefit for the teachers, as well, she did not draw the connection to instructional leadership explicitly. Similarly, some SAMs described an increase in their direct communication with the principal. One noted: “The best part of the whole SAM initiative, for me, is the fact that it makes the principal and I communicate, because it’s very hard to really have time with your principal …. When we do meet, we find out that we are able to communicate about a lot of things …. I’m going to look at it now as a tool for me as well, just to be able to voice my concerns.” It was unclear whether this SAM believed the increased communication improved the principal’s job performance or whether this was simply an added benefit of the process. Although improved communication is not an explicit goal of the SAM process, several SAMs commented that they enjoyed having a new level of conversation with the principal, as well as increased access to him or her. And while this was not described by every SAM we interviewed, it was a consistent enough response to warrant reporting.
Fidelity, Adaptation, and Challenges of the SAM Process Implementation
NSIP designed the SAM process to include a set of essential components that are to be implemented with fidelity in schools, while allowing for adaptation to the local school context. NSIP does not intend for the SAM process to be a “canned program” or lock-step process with scripted instructions on exactly how principals should increase and improve instructional time use. Instead, once the basic components are implemented, schools are to engage in self-reflection, work with their Time Change Coaches, and attend PD to determine the best ways to adapt the process to their own needs.
Across case study districts and in survey data, we found evidence of this combination of fidelity and adaptation. Most schools were largely committed to the process, had participated in baseline
37
data collection, implemented the essential components with moderate to strong fidelity, and had ongoing coaching. This is unsurprising, as Implementation Specialists work with schools until they reach a 3 on the rubric, indicating that they have successfully implemented the Daily Meeting, the TimeTrack calendar, and the First Responder system. This consistency may also be a relatively recent improvement, as PSA interviewees found considerable variability in the definition and implementation of the SAM process across sites at the time of their evaluation. In contrast, we observed only minor variation in the implementation and use of the process. Furthermore, the adaptation of these components was a way of tailoring the process to the school’s unique needs, not a radical deviation from the use of the components as NSIP intended. Put differently, the quality of implementation and use of the components varied somewhat, but schools adopted the components consistently across districts. Nonetheless, there were some challenges that participants faced in implementing and sustaining parts of the SAM process.
In the following sections, we describe the ways in which various aspects of the SAM process were implemented with fidelity, the ways in which they were adapted to local needs, and challenges that arose. We conclude with cross-cutting issues that impacted implementation across components, as well as recommendations for improvement based on our findings.
The SAM Daily Meeting
Across case study schools, participants indicated that they engaged in the SAM Daily Meeting routinely and as expected by NSIP. There was some minor variation in how frequently participants engaged in the Daily Meeting and the typical length of those meetings. For example, some principals and SAMs met every day, while others met a few times per week. Specifically, 72% of surveyed principals met with their SAM at least once a day; 23% met with the SAM two to three times per week. In a handful of case study schools, principals and SAMs struggled to conduct the meetings consistently, but these deviations were exceptions. There was also some variation in the content of the Daily Meetings. While the majority of principals and SAMs we interviewed indicated that they discussed the principal’s schedule during the meetings, a smaller subset also had conversations that related to instructional practice and the implications of principals’ time use. Finally, we did find several challenges that emerged around implementing and sustaining the Daily Meeting, namely finding time, asking the principal hard questions, and choosing the “right” SAM.
Finding Time
Although we found that principals and SAMs typically met routinely, finding time to fully participate in the Daily Meeting was a challenge in some case study schools. An assistant principal who served on a SAM team explained the difficulty of juggling her other responsibilities with the need to meet daily with the principal: “We don’t know what our day holds when we arrive, so it’s a matter of being available at the time and trying to remember to be available. It’s like I have to decide, am I going to go into a classroom? And I know that this class is giving this teacher a particularly hard time, so it would be good for me to be in that room and sit in the back and show my presence; at the same time, we need to be down here talking about things. So it’s like, what do I choose and how, and maybe it’s good that there’s four [SAMs] assigned to him.” We hear this concern around lack of time among SAMs in various jobs, be
38
they secretaries, curriculum specialists, or assistant principals. A few principals also felt this challenge was exacerbated by working in fast-paced, high-needs schools.
Asking the Hard Questions
The majority of SAMs we surveyed (86%) reported being at least “very comfortable” with questioning their principal about time use. Seventy-two percent indicated they were at least “very comfortable” with having difficult conversations about their principal’s time use. Nonetheless, this was an ongoing stress for several of the SAMs in our case study districts. Across all four districts, some SAMs indicated that it was difficult to ask their principals hard questions related to time use or “push” their boss around instructional use. One SAM explained: “I’m only going to push him as much as I’m comfortable pushing him, because he’s my boss, so if he doesn’t want to go into a classroom and do an observations, I can only ask him so many times. I can’t make him do it. So I think there’s that strange power dynamic … sometimes it’s awkward saying to your boss like, you know, ‘From 9:00 to 10:00 today, what were you doing?’ … sometimes I feel like—I don’t want to harass this man and ask him where he’s been every second of the day. Like maybe he went to the bathroom, I don’t know. So [the coach] wants every single space filled in, and I kind of feel like if he had done something really important and instructionally related, he would have told me to add it.”
PSA also noted that, at the time of their evaluation, some SAMs didn’t seem comfortable in the role of “nudge the principal,” suggesting this has been an ongoing challenge. Despite the positive survey results, the case study findings suggest that this is an area that may need to be investigated more deeply to determine how widespread the discomfort around difficult conversations may be. At the very least, it appears to be an area in which some SAMs need additional support.
We did see that some SAMs learned to address this challenge through the coaching and training they received. For example, a clerical SAM found cards provided to her during training helpful in overcoming this challenge: “The SAM also has … a list of questions. We’ve got our little flip charts that kind of help us, you know, when we’re sitting there just trying to pull something out of thin air.” Eventually, the questions were internalized, and she relied less and less upon the guiding questions.
Choosing the “Right” SAM
From the principals’ perspective, the flip side of this challenge is choosing the “right” SAM, who is comfortable questioning the principal around time use and asking reflective questions. Principals who do not target those qualities tend to struggle. An NSIP staff member explained that sometimes principals change their mind about a proposed SAM to address this: “Once they get it, about the reflective part, some people come right up to us at that meeting and say, ‘Um, I may have put the wrong name down, you know, now that I see this, I want to do it this way or I want to add this person.’” However, some principals do not believe they have anyone in their school who can appropriately take on the SAM role. A principal commented on this difficulty: “I think the biggest challenge is that I don’t have a logical SAM here. I think [my SAM] is a very, very busy secretary, and she actually shares some of my weaknesses in terms of her own structure, and so I actually think we’re blind leading the blind here a little bit, and I don’t think that’s working.” Several principals noted that this was a difficult problem, and recognized that

39
poor choices impeded success. Time Change Coaches reiterated that this was a critical issue: Principals needed to choose SAMs who were comfortable asking the principal reflective questions; SAMs needed to learn to be comfortable pushing their principals about time use. Despite the ongoing training they provided, coaches still identified assertiveness as a challenge for some SAMs.
TimeTrack Calendar
Most participants used the TimeTrack calendar routinely and as intended by NSIP. The vast majority of entries into the TimeTrack calendar system are made during the normal work week (Monday through Friday). Still, there were varying numbers of missing days. It is difficult to determine how often participants were not using the calendar (as opposed to just not working) because calendars differ across schools and districts, but the plots below provide some insight.
Figure 9: Days of Missing Calendar Data, by Month
As might be expected, there were greater numbers of missing days in December, presumably due to holidays. Note that because we had access to TimeTrack data only from August 1, 2013, to June 15, 2014, there are no data for July, and June’s data are truncated.4 There are also somewhat higher numbers of missing days during months associated with breaks from school (e.g., Thanksgiving, spring break). Overall, it does not seem that there is any significant trend in missing days across the school year. In addition, there does not seem to be any significant difference in missing data between groups of participants with different years of experience in the program.
4 Counts of missing days were calculated for each month by subtracting each person’s number of entries for each month from the number of days available in that month (i.e., June’s entries are subtracted from 15). Resulting differences will be inflated because of weekends, but should be, for the most part, equally inflated across months, so the plots here are still useful for comparison.

40
We asked principal survey respondents the extent to which they implemented the calendar in different ways, the results of which are shown in Figure 10.
Figure 10: Use of the TimeTrack Calendar
According to principals, SAM teams frequently used the calendar to create the principal’s schedule and reconcile the calendar with what actually happened in the day. Principals used the calendar data to look at specific task items relating to specific people (e.g., teachers, others) and determine how much time was being spent with specific people less often. Principals in larger schools used the calendar more often to create their schedules.
There were minor variations across principals in how the calendar was used. For example, some principals used the tool faithfully and throughout the day, updating and reconciling it on their phone or on paper. Others reconciled once a day or every other day. Still other principals had their SAMs monitor and update the calendar for them. Those who noted challenges with using the calendar discussed a lack of time, pressure to meet instructional goals, the use of multiple calendars (i.e., maintaining another working calendar in addition to the TimeTrack calendar), and difficulty coding.
Time
Some principals and SAMs found it difficult to have enough time to complete the TimeTrack calendar. One principal said that the tracking on the calendar is “time consuming. It means [the SAM’s] not doing something else, or she’s staying late or something, yeah, that’s the cost.” Another principal explained: “You’re always having to go back track what you did …, so it’s just a time factor.” However, other principals spoke about the ease with which they had incorporated the TimeTrack calendar into their daily routines, updating it throughout the day and without difficulty.

41
Concerns about Pressure to Meet Goals
One principal felt strongly that “there’s tremendous pressure to meet your [SAM] target” on the calendar. He suspected that NSIP wanted principals marking time as instruction “for their research reasons. I think they want to be able to say that principals are meeting their targets, and I don’t like that. Again, like I said, I’m not a grade inflation person …. Like should I mark this as instructional time? I don’t think so. It’s not. There’s nothing wrong with this time, but this is not instructional. But they want me to like say, well, it relates to instruction because in a secondary—well, so does cleaning the bathroom in some way. So I feel pressure to misrepresent my time, and I don’t want to feel that …. We were always fudging stuff …. We all want to claim success for things that actually we might not be successful at, and I just fear that a little bit. Like I don’t think I’m failing, because I’m not hitting my percentages. I just think that I’m still struggling to figure out how to adjust my time. I don’t want to meet it by recoding time that I’m already using in one way or another.” Although we did not hear this from many principals, it was a serious enough concern to warrant identifying in this report.
Multiple Calendars
Both Time Change Coaches and principals described the challenge of using the TimeTrack calendar for those who already used a different electronic calendar. Some principals were reluctant to give up their familiar calendars, and, as a result, used multiple calendars. However, other principals kept an alternate calendar because of district policy and found managing multiple calendars burdensome. One Time Change Coach saw this as one of the largest challenges of the SAM process: “Many schools are using multiple calendars. They’re using Google Doc or they’re using Microsoft Outlook or what else, and so the SAM calendar is another calendar that’s thrown into the principal’s world, and so the challenge becomes keeping track of things that might be in the Microsoft Outlook or the Google Doc calendar and can then get recorded into the SAM calendar.” One principal faulted the TimeTrack calendar for its inability to sync with the district calendar software: “We have to do dual calendars. I don’t like that at all.” This suggests that some principals may need additional training around using the TimeTrack calendar exclusively or in conjunction with other work calendars. Without such training, some principals may not implement the process fully.
Coding
Some principals found the coding in the TimeTrack calendar challenging. As one principal explained, “And then there’s some real dilemmas, like hiring people for next year, interviewing someone who I end up not hiring; is that instructional, is it management, or is it some other category? I don’t know. So the breakdown of the time is not logical to me, and I’m the kind of person that if I don’t have comfort with something, I don’t like to use it …. It relates to instruction. It’s incredibly important, but if I interview 10 people for five hours, nine of them—I don’t know, is that completely instructional? I really don’t know.” Another principal believed he simply needed to spend more time working with his SAM to understand “what each one of those categories means … to make sure we’re coding things correctly.”
This was also a challenge highlighted by PSA interviewees, as they thought that there might be difficulties in shared understandings on what the various codes were across principals/SAMs. However, PSA also indicated that once a principal/SAM team got into it, there was consistency
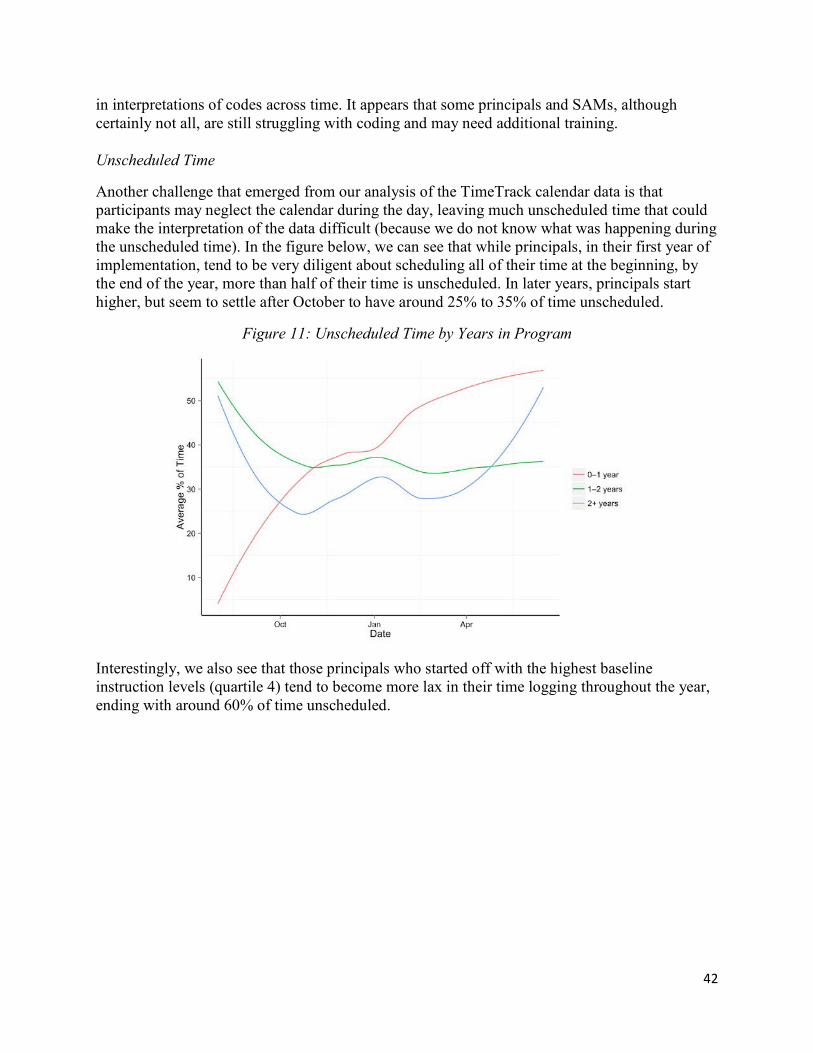
42
in interpretations of codes across time. It appears that some principals and SAMs, although certainly not all, are still struggling with coding and may need additional training.
Unscheduled Time
Another challenge that emerged from our analysis of the TimeTrack calendar data is that participants may neglect the calendar during the day, leaving much unscheduled time that could make the interpretation of the data difficult (because we do not know what was happening during the unscheduled time). In the figure below, we can see that while principals, in their first year of implementation, tend to be very diligent about scheduling all of their time at the beginning, by the end of the year, more than half of their time is unscheduled. In later years, principals start higher, but seem to settle after October to have around 25% to 35% of time unscheduled.
Figure 11: Unscheduled Time by Years in Program
Interestingly, we also see that those principals who started off with the highest baseline instruction levels (quartile 4) tend to become more lax in their time logging throughout the year, ending with around 60% of time unscheduled.
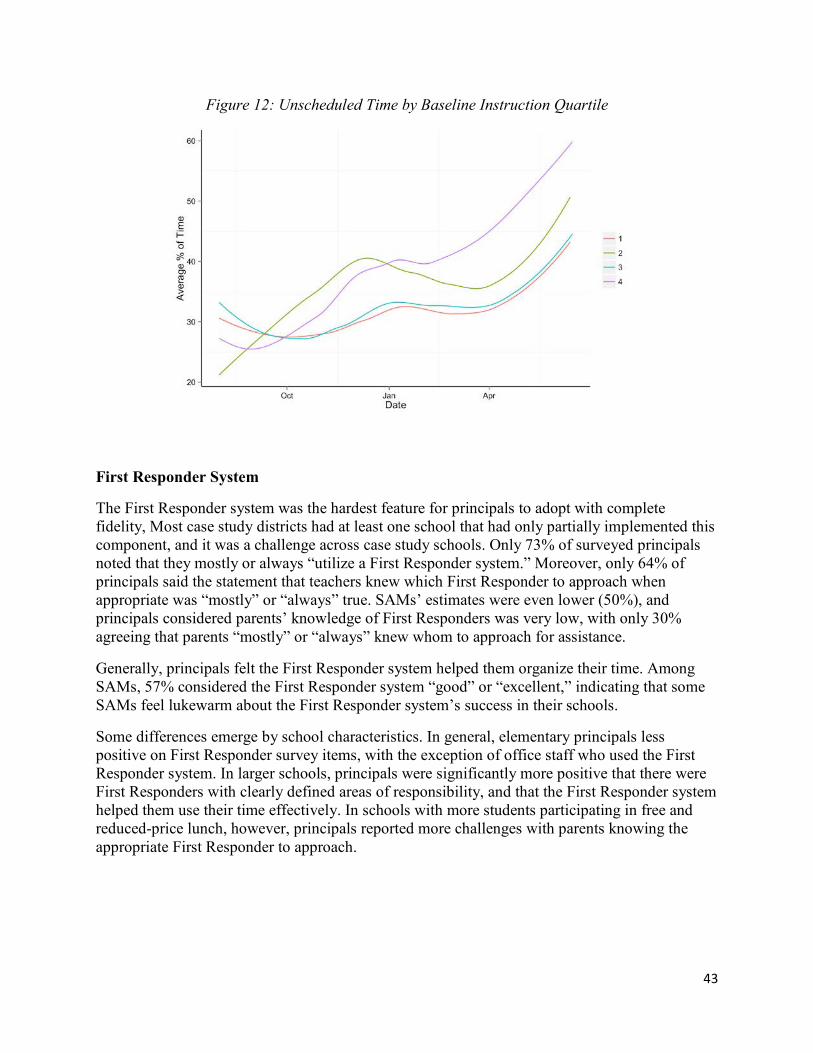
43
Figure 12: Unscheduled Time by Baseline Instruction Quartile
First Responder System
The First Responder system was the hardest feature for principals to adopt with complete fidelity, Most case study districts had at least one school that had only partially implemented this component, and it was a challenge across case study schools. Only 73% of surveyed principals noted that they mostly or always “utilize a First Responder system.” Moreover, only 64% of principals said the statement that teachers knew which First Responder to approach when appropriate was “mostly” or “always” true. SAMs’ estimates were even lower (50%), and principals considered parents’ knowledge of First Responders was very low, with only 30% agreeing that parents “mostly” or “always” knew whom to approach for assistance.
Generally, principals felt the First Responder system helped them organize their time. Among SAMs, 57% considered the First Responder system “good” or “excellent,” indicating that some SAMs feel lukewarm about the First Responder system’s success in their schools.
Some differences emerge by school characteristics. In general, elementary principals less positive on First Responder survey items, with the exception of office staff who used the First Responder system. In larger schools, principals were significantly more positive that there were First Responders with clearly defined areas of responsibility, and that the First Responder system helped them use their time effectively. In schools with more students participating in free and reduced-price lunch, however, principals reported more challenges with parents knowing the appropriate First Responder to approach.

44
Figure 13: Principal Perspectives on First Responders
Many case study principals were relatively new to the SAM process (i.e., first- or second-year participants), making it difficult to know whether this challenge is a manifestation of early stage of implementation.
Teachers, Parents, and Staff
One difficulty with the First Responder system was cultural: helping teachers, parents, and staff understand that they should turn to a particular list of people when they needed assistance, rather than turn to the principal or secretary. For example, a principal explained, “I think now the secretary is the first person everyone goes to. It isn’t that they’re going to a First Responder list first. So we talked about this recently with our coach—and she had some great strategies, like make sure the First Responder list is hanging up in all staff bathrooms, and in the teachers’ lounge. Maybe have 20 copies next to the secretary, so when somebody comes, she can just hand them the list of First Responders.” A SAM added that the most challenging piece for her is the rare occasion during which angry parents demand to see the principal instead of a First Responder. A principal similarly noted, “The communication piece and getting the staff, getting my PTA, my school council, getting those people aware of what was going on so that … they would know, ‘Oh, wow, I have to interact with him differently now.’ Because before that, my school council president, my PTA, they had my direct line, and my office, even had my cell phone, and weren’t afraid to use it.”
Another SAM described the difficulty that teachers had with the shift to the First Responder system: “Some of the teachers are old school, and it’s just taken some getting used to for them. They’re working on it. They’re getting there, but it’s a real big adjustment for them …. The move has made it seem to them like [the principal is] inaccessible, because they have to come through me anyway.... He has a schedule that he follows, but he’s not inaccessible. He’s just doing something else, and it’s not convenient for them.”

45
However, two high school principals pointed out that they already had a system in place similar to First Responders because of the nature of secondary schools. In these schools, it seems that parents and teachers are used to contacting various staff members, rather than the principal, for different issues.
Principals
The First Responder system also presented significant challenges for principals themselves, as many found it difficult to relinquish their responsibilities. For example, a principal commented: “One thing that I do worst is I never say no to anybody, so when a parent comes in and they’re upset, I always just say, ‘Come on in. We’ll solve it. We’ll fix it.’ It’s one of the things that [the SAM] always says, ‘You can’t do that. You’ve got to stay true to those First Responders ….’ I really feel like especially on site, folks do follow it, and I enable them not to follow it when they’re upset. I don’t want anyone to walk around upset thinking that they have to wait until 1:30 to see me and it’s 9:00 in the morning type of thing. There are times if the system doesn’t work, I flex the system to meet the needs of those individual folks.”
Several SAMs commented that it would be important for their schools to fully commit to the First Responder system and for their principals to more fully embrace delegating responsibilities. For example, one SAM believed that if the principal had used the First Responders, she would have been more successful at completing teacher evaluations: “We had evaluations that had to get done, and she said, ‘I’m still doing evaluations,’ and I think that if she had relinquished some of those, just to be frank, if she relinquished some of those things to the First Responders that we had designed, I think she would have had more time to do some of those things we’re talking about. But often times the district—a parent will call and complain, or it gets to a level where that person feels like she has to—you have to respond to it. So it’s a catch 22.” Time Change Coaches and Implementation Specialists also echoed this concern. One explained: “That’s a hard, hard, hard part of this, for principals to do. Because, they come into their role believing … that they are to have all of the answers. And of course the buck does stop with them, so giving up pieces of their responsibility is really hard. Harder for some than for others.”
Because this challenge was so prevalent across case study schools, it may be an area in which principals and staffs need additional training and support to be successful. An NSIP staff member explained plans to help schools better understand and use this system: “We have beefed up our content regarding First Responders beyond just ‘Gee, who could be the delegate to hand out supplies?’ or something. How can we have a real net within the school culture to not only do a better job, have more people engaged, but give the principal more instructional time? So we now have a new document coming out, it’s called a flip book, that is all about First Responders. We will be working with them on that. We’ll be talking to them about what categories do you see yourself developing, and when do you see yourself putting this together, and have you thought about how you might train these people or what’s involved.” Training will use a question and answer format, so that it can be tailored to the specific needs of a school staff.
NSIP Training, Implementation Specialists, and Time Change Coaches
Survey results indicate that 92% of principal respondents had participated in some sort of training run by the SAM process. Eighty-nine percent reported working with Implementation Specialists, and 90% reported working with a Time Change Coach. It is unclear why there are

46
some participants who reported that they have not had the standard, planned training and coach support.
We asked principal survey respondents the extent to which their Implementation Specialists assisted with various items. Results are shown in Figure 14.
Figure 14: Principal Perspectives on Implementation Specialists
Largely, principal respondents indicated that the Implementation Specialists greatly assisted with most initial training needs for the principal and SAM. However, respondents did not feel that the Implementation Specialists helped as much with setting up the First Responder system, choosing a SAM, or choosing First Responders. Implementation Specialists did not seem to work as much with elementary school principals on modeling the SAM Daily Meeting or giving feedback on interaction with the SAM, as compared to other school levels.
We also asked principals about the work with their Time Change Coaches; results are shown in Figure 15.
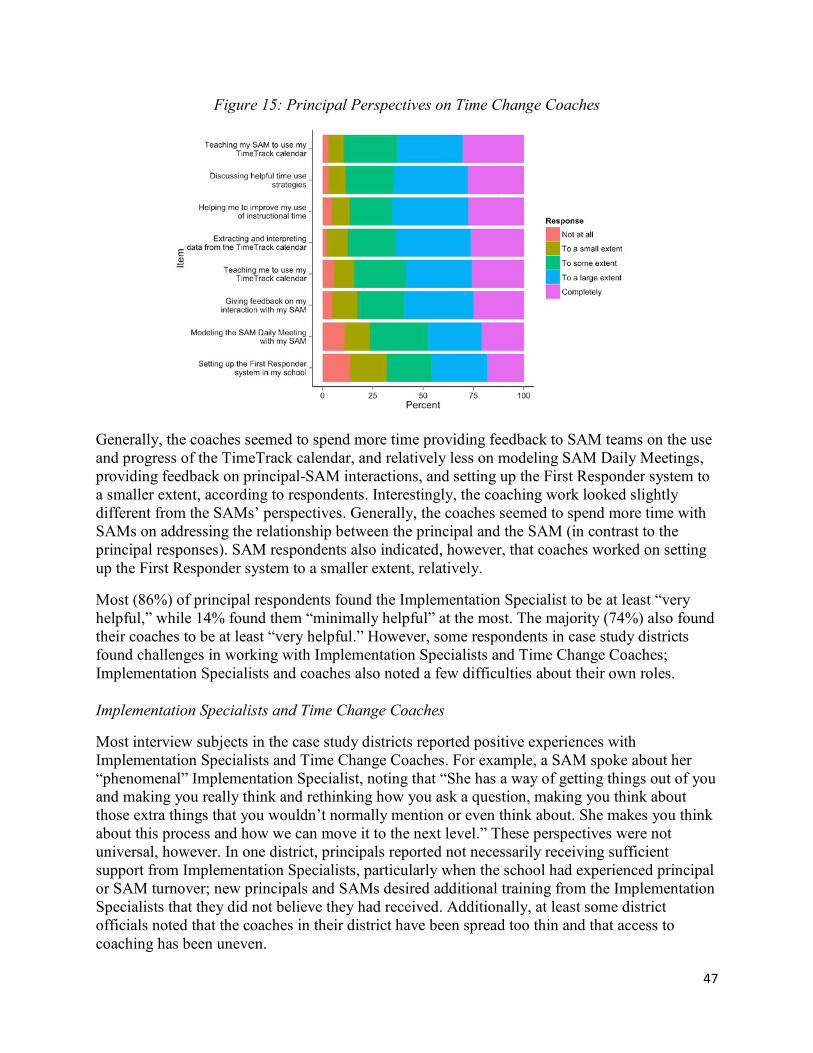
47
Figure 15: Principal Perspectives on Time Change Coaches
Generally, the coaches seemed to spend more time providing feedback to SAM teams on the use and progress of the TimeTrack calendar, and relatively less on modeling SAM Daily Meetings, providing feedback on principal-SAM interactions, and setting up the First Responder system to a smaller extent, according to respondents. Interestingly, the coaching work looked slightly different from the SAMs’ perspectives. Generally, the coaches seemed to spend more time with SAMs on addressing the relationship between the principal and the SAM (in contrast to the principal responses). SAM respondents also indicated, however, that coaches worked on setting up the First Responder system to a smaller extent, relatively.
Most (86%) of principal respondents found the Implementation Specialist to be at least “very helpful,” while 14% found them “minimally helpful” at the most. The majority (74%) also found their coaches to be at least “very helpful.” However, some respondents in case study districts found challenges in working with Implementation Specialists and Time Change Coaches; Implementation Specialists and coaches also noted a few difficulties about their own roles.
Implementation Specialists and Time Change Coaches
Most interview subjects in the case study districts reported positive experiences with Implementation Specialists and Time Change Coaches. For example, a SAM spoke about her “phenomenal” Implementation Specialist, noting that “She has a way of getting things out of you and making you really think and rethinking how you ask a question, making you think about those extra things that you wouldn’t normally mention or even think about. She makes you think about this process and how we can move it to the next level.” These perspectives were not universal, however. In one district, principals reported not necessarily receiving sufficient support from Implementation Specialists, particularly when the school had experienced principal or SAM turnover; new principals and SAMs desired additional training from the Implementation Specialists that they did not believe they had received. Additionally, at least some district officials noted that the coaches in their district have been spread too thin and that access to coaching has been uneven.

48
Interestingly, earlier PSA evaluations suggest that the coaching component of the SAM process was not up to the challenge of helping principals improve. PSA reported that principals did what they understood and found to be easy, such as observing teachers, while being less likely to analyze the data to then provide feedback to those teachers. In contrast, principals and SAMs in our study seemed largely satisfied with the training they received from coaches, and coaches themselves seemed very aware of the importance of helping principals analyze data.
Concerns from Time Change Coaches and Implementation Specialists
Time Change Coaches and Implementation Specialists indicated a few challenges about the way in which their roles have been designed. One Time Change Coach believed once-monthly school visits limited her impact. Others said their districts had too few coaches or Implementation Specialists to do their jobs well. Still others described occasional lags between the completion of the Implementation Specialist’s work in a school and the start of the coach’s. Sometimes the two were able to speak by phone or meet before the transition occurred, but scheduling sometimes made this impossible. This was not prevalent across all coaches and Implementation Specialists, but a handful shared these concerns.
Quality versus Quantity of Principal Instructional Time
Focus on Increased Time, Not Quality of Time
NSIP’s theory of action posits that principals and SAMs will not only reflect on how to increase principal instructional time, but will also consider how to improve the quality of that time. This expectation was reiterated by Time Change Coaches and Implementation Specialists as a major goal of the process. They view the process as intended to impact the school at a deeper level, beyond just the implementation of the basic components of the SAM process. One coach said: “So the process has evolved beyond just this setting up a calendar, managing your time, asking these kind of questions now to we’re getting steps beyond that to say okay, this is what we do when we have that time to get in the class …. We’re now getting into more discussion about what principals can do with teachers.” However, we did not find this shift from increased time to improved quality of time occurring across all case study schools. Instead, only one or two principals in each case study district were working to achieve this. While it is unclear why we did not see this more consistently, it is important to consider that most of the schools in our study were early in their adoption of the SAM process, often in year one. It is possible that schools must first focus on implementing the basic components and striving to increase their time on instruction before they can think about using their time more constructively. In addition the focus on quality of time use is recent in the evolution of the SAM process, and it is still being brought to life across districts. The implied need for gradual introduction of changes aligns with the reflections of Time Change Coaches about working with schools on different aspects of the process. Coaches are tasked with ensuring that the basic components of the SAM process are understood and used, as well as with helping principals think more deeply about how they use their time. One coach described her role as mostly helping with the “mechanical aspects” of the SAM process for the first year and then beginning to ask “deeper questions” in year two. This suggests that a first-year school may only be focusing on implementing the basic components of the process, while a third-year school may be talking deeply about time use.

49
PSA staff members noted similar challenges. At the time of their evaluations, PSA researchers felt the SAM process was not equipped to improve quality and instill in principals the knowledge and skills to more fully implement instructional leadership. PSA speculated that helping the principals learn how to be effective instructional leaders might be a good role for districts to assume. Although this aspect of the process in now clearly articulated in the theory of action and espoused by Time Change Coaches as a major aspect of their work, it does appear to remain a challenge, at least in some schools.
TimeTrack calendar data reveal discrepancies between quantity and quality of instructional time use. The average trajectory of time use over the year, broken down by categories coded in the TimeTrack data, is shown below. The graph shows the average percent of time spent by principals on different categories of activity (on the y axis) on each day of the year (on the x axis). Loess smoothing was used to demonstrate overall trends,5 and shaded areas encompass the middle 50% of the data (bounded by the 25th and 75th percentiles).
Figure 16: Average Percent on Time Categories by Date
From these trends, we can see that instructional time does tend to increase over the course of the first half of the year (from August to December), and then it decreases toward the end of the year (starting in April). Time spent on management also seems to follow the same trend (very slightly), although not to the same magnitude. Personal time is relatively stable throughout the year, and unscheduled time seems to generally increase as the year goes on.
We cannot determine from Figure 16 whether the program is working, because principal time use probably reflects seasonal demands, such as standardized testing and end-of-year activities. However, it is interesting that while we see changes in instructional time over the year, we do not see corresponding decreases in management time. Part of the theory of action for the SAM process includes more distributed leadership within schools so principals do not have to spend as 5 Loess smoothing is a technique often used for extracting non-parametric trend lines from scattered data by using locally weighted polynomial regression on subsets of data surrounding each individual point of data. This was conducted using R version 3.0.1.
50
much time on managerial duties. We see here that management time instead seems to increase, although not to the same extent as instructional time.
Lack of Principal Knowledge of Instruction
Some Time Change Coaches described the challenge of working with principals who did not have a strong understanding of effective instruction. They lamented that these principals could comply with the SAM process, implementing it fully, but still not reap the desired benefits. If principals increase their time on instruction but do not improve the use of that time, they will see little change in teacher practice or student achievement. One coach described her struggle to work with one such principal: “His instructional time looks fantastic on the calendars, but because I am there all day and I do walkthroughs and I do see other aspects of the school, I’m not sure he knows what’s good instruction. So just because it looks like you’re spending all this time in instruction, are you really making a difference? And I keep hounding on these so what? Has student achievement changed? Are things changing? Are the teaching strategies in place that will make a difference? … And he answers the questions the way that he’s supposed to, but I’m not sure he even knows what’s good instruction. So the weakness there is just how much can a time change coach do …. Bottom line is if you don’t know what good instruction is, then poor instruction’s going to happen and you’re not going to know the difference …. So if they don’t know what good instruction is, everything can look good, it can look good on paper …. It’s not going to make a difference in student achievement.”
Cross-Cutting Issues
Most aspects of the SAM process were implemented with fidelity and consistency, despite some challenges. However, some cross-cutting issues emerged as potential reasons for variation and/or difficulty with aspects of implementation. These are described in the following sections.
Buy-In
There were a few principals in case study districts who half-heartedly adopted the process and implemented the components only somewhat; these tended to be principals who lacked buy-in around the process and sometimes felt pushed to adopt it. Time Change Coaches and Implementation Specialists strongly believed that a lack of principal buy-in could be problematic, leading principals to drop out or implement the process in a limited fashion. One coach commented, “The biggest difference that I see with the schools I’ve worked with is whether a school volunteered to be in it, seeing the value of it and wanted to be in it, or whether the superintendent has said you’ll be a part of this program. In that respect, some of them were just compliant. ‘I have to do this, it’ll be over, I’ll do it.’”
In contrast, earlier evaluations by PSA suggested that the SAM process was not for everyone and that it required some principals to relinquish their comfort zone of management for their less comfortable zone of instructional leadership. They noted that there were different ways of dropping out of the process and huge differences in level of implementation. However, our study suggests that few principals dropped out.
51
Timing
Several case study participants stated that the beginning of the school year was a difficult time to focus on the SAM process because of competing managerial needs. They felt that their fidelity to implementation increased as the school year went on. A SAM expressed hope that implementation would be back on track after the “first rush of the beginning of the school year is over with – the changes that we’ve had, new [assistant principal], me new to the position, moving some people around. I think now we can start really implementing, but we’ve had a few meetings, and it’s been helpful, but I think now we can really get going.” Another principal noted: “Starting a school year with SAM, that’s interesting, because there are a lot of managerial components to starting a school year.” Another cited problems in getting the SAM process up and running in the new school year while also being faced with a new student registration system.
District Support
Time Change Coaches and Implementation Specialists discussed the importance of district leadership, both in initiating the SAM process in its schools and for sustaining their involvement. They believed that district level buy-in was critical for the process to continue over time. They noted, there was initial buy-in from the district, but that turnover of district-level staff became problematic when new staff did not understand or believe in the program, despite enthusiastic initial implementation. Principals see the benefits of a SAM quickly, but such benefits are less direct for those farther up the line, who ultimately must decide whether to invest in it. One Time Change Coach noted: “We’ve all talked about transitions in leadership and how you get the district office people on board, and then they move on and the next group coming in doesn’t have that [buy-in]…even though principals are still very committed, but they don’t have the district support.”
The level of district support may affect ease of implementation in schools. In the case study district with the greatest consistency and highest levels of fidelity in implementation, the SAM process is highly valued and is aligned with the district vision and strategy for leadership development. From the superintendent, and throughout the central office, the SAM process is viewed as an avenue for ongoing leadership development. Principals feel part of a community of practice that provides them with added value. The leadership coaches and Implementation Specialists are employees of the district for whom the SAM process is part of their district roles and responsibilities. They therefore can support principals in ways that align with district initiatives and expectations. This case suggests that the district commitment has played a major role in the principals’ engagement and implementation.
Staff Turnover
A few schools indicated that staff turnover caused delays in implementing the components. It seems logical that such turnover also would make it difficult for principals to begin using the components at a deeper level to think about quality of time use. One principal discussed the problems of turnover related to the SAM process: “We will definitely have to revisit quite a bit, because I have a new staff … probably about 10 new personnel, so they will have to understand and get introduced to this way of working.” Similarly, in another district challenges with implementation occurred when a SAM left the school and was replaced by someone new. In such

52
schools, SAMs appeared to need more training from Time Change Coaches, even around the basic mechanics of the process.
Problems identified with turnover at both the district and school level suggests that this could pose challenges for the SAM process in some locations.
Sustainability
The biggest concern that Time Change Coaches expressed about the SAM process writ large is sustainability. This was particularly true with Model 1, as it was difficult to sustain the salary and benefits of an additional staff member to work as a SAM. However, even in Model 3, some schools must rely on Race to the Top money or other grants to fund their participation, making sustainability questionable. This struggle also was reflected at the district level, as one district official noted: “Ultimately, we would love to have every principal in our district being a SAM principal, a SAM team, a SAM school, but when you look at a district this size … I wish there could be a way to reduce that cost somehow.” Furthermore, while several Time Change Coaches noted the impressive leadership of the NSIP director, his passion for the work, and his dynamic personality and commitment to the SAM process, a few questioned how sustainable the process would be once he was no longer in charge.
Still, 78% of principals predicted there is a 100% chance the SAM process will stay in place as long as they remain leaders of their schools. However, only 36% predicted there was a 100% chance the process would continue if they left. Twenty-two percent predicted a 75% chance, and 27% predicted a 50% chance.
School Level
Some differences emerged in findings about principals at different school levels. One Time Change Coach believed high school principals had far greater difficulty implementing and sustaining the SAM process than did principals of elementary and middle schools. She believed the high school principals had a harder time focusing on instruction over management. She explained: “Now, we’ve had three principals say, ‘I don’t want to do this anymore.’ And it’s been very interesting. They are high school principals. And we’ve noticed phenomena with high school principals, and to be quite honest and open here, a lot of it has to do with the expectation or this almost a stereotype of what a high school principal is. And they’re finding it very difficult to focus on instruction. They really—at least these three—really like the management. They had a difficult time with instruction. I think it opened up something they didn’t want to show about their skill level. And they might have been great teachers; but leading, and having instructional discussions, they were having a difficult time doing that.”
Differences in administrative structure between secondary and elementary schools might explain some differences in implementation. For example, two case study principals noted that they already had a First Responder system of sorts, prior to adopting the SAM process.
Survey results also suggested possible differences by school level. Elementary schools and schools with fewer than 700 students were less likely to have all components of the SAM process implemented fully, especially the First Responder system.
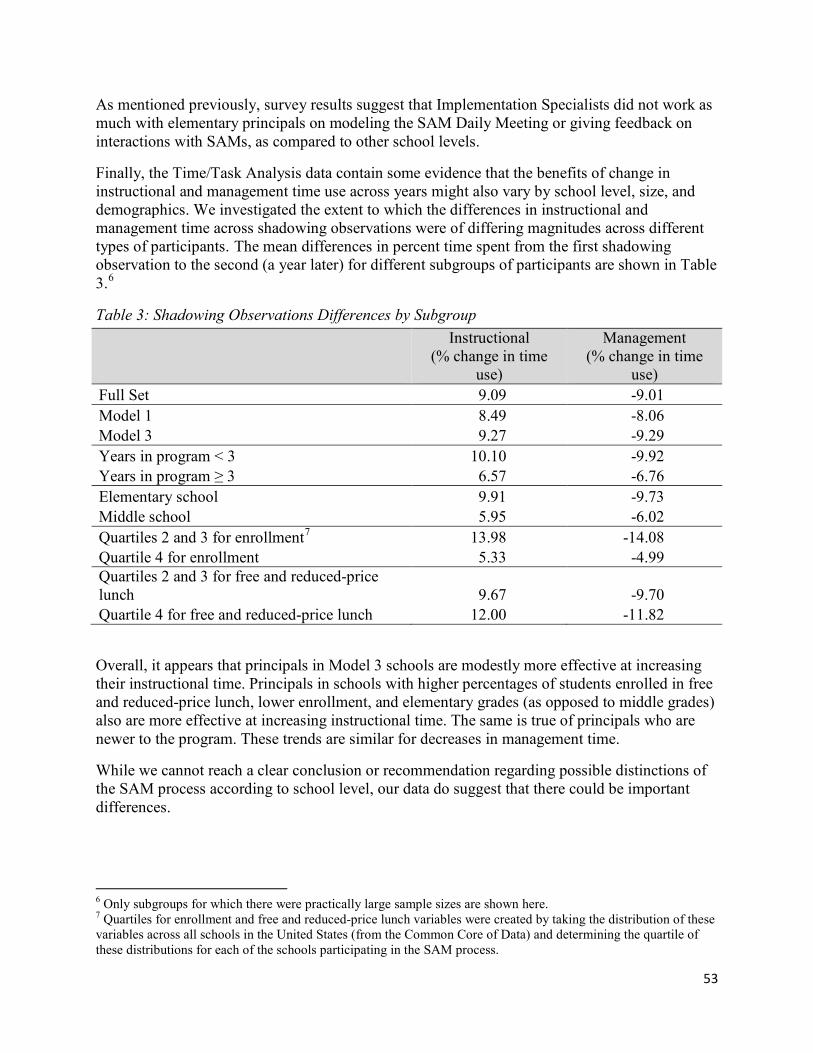
53
As mentioned previously, survey results suggest that Implementation Specialists did not work as much with elementary principals on modeling the SAM Daily Meeting or giving feedback on interactions with SAMs, as compared to other school levels.
Finally, the Time/Task Analysis data contain some evidence that the benefits of change in instructional and management time use across years might also vary by school level, size, and demographics. We investigated the extent to which the differences in instructional and management time across shadowing observations were of differing magnitudes across different types of participants. The mean differences in percent time spent from the first shadowing observation to the second (a year later) for different subgroups of participants are shown in Table 3.6
Table 3: Shadowing Observations Differences by Subgroup
Instructional (% change in time
use)
Management (% change in time
use) Full Set 9.09 -9.01 Model 1 8.49 -8.06 Model 3 9.27 -9.29 Years in program < 3 10.10 -9.92 Years in program ≥ 3 6.57 -6.76 Elementary school 9.91 -9.73 Middle school 5.95 -6.02 Quartiles 2 and 3 for enrollment7 13.98 -14.08 Quartile 4 for enrollment 5.33 -4.99 Quartiles 2 and 3 for free and reduced-price lunch 9.67 -9.70 Quartile 4 for free and reduced-price lunch 12.00 -11.82
Overall, it appears that principals in Model 3 schools are modestly more effective at increasing their instructional time. Principals in schools with higher percentages of students enrolled in free and reduced-price lunch, lower enrollment, and elementary grades (as opposed to middle grades) also are more effective at increasing instructional time. The same is true of principals who are newer to the program. These trends are similar for decreases in management time.
While we cannot reach a clear conclusion or recommendation regarding possible distinctions of the SAM process according to school level, our data do suggest that there could be important differences.
6 Only subgroups for which there were practically large sample sizes are shown here. 7 Quartiles for enrollment and free and reduced-price lunch variables were created by taking the distribution of these variables across all schools in the United States (from the Common Core of Data) and determining the quartile of these distributions for each of the schools participating in the SAM process.

54
V. Summary This report described the ongoing development and implementation of the SAM process, which has the goal of increasing the capacity of principals to use time in instructionally focused ways while decreasing time on management tasks. In closing, we summarize the key findings regarding current implementation, changes over time, lessons learned from the literature, and future developments.
Current Implementation
The study data suggest strong fidelity of implementation of the SAM process in schools. NSIP encourages fidelity around four non-negotiables in the SAM process: 1) commitment to the SAM process, 2) participation in baseline data collection using the Time/Task Analysis and protocol, 3) use of the TimeTrack Calendar and SAM Daily Meeting, and 4) ongoing coaching. Principals and SAMs generally report high levels of engagement with these main components. Consistency of implementation in schools likely flows in part from the consistency with which supports for implementation are provided by NSIP; the majority of schools received SAM training before implementation, and most found Implementation Specialists and Time Change Coaches to be quite helpful. Simultaneously, NSIP allows for some flexibility and adaptation to meet the needs of districts and individual schools, and we saw evidence of adaptation, including how many SAM team members a school utilized and how these team members worked with the principal to change time use.
Although not conclusive, our data also show evidence of the efficacy of the SAM process in changing behaviors or outcomes consistent with its theory of action, including increases in instructional time use. Results from our analysis of survey responses, TimeTrack Calendar data, and Time/Task Analysis data, as well as what we heard in interviews in the case study districts, are consistent with the idea that the SAM process helps principals focus on and find ways to increase the time they engage with the school’s instructional program.
This evidence also is consistent with the reasons principals and districts gave for participating in the SAM process. For principals, the main motivations were to improve their capacity as instructional leaders, to spend more time on instruction, and to gain better work/life balance. For districts, the main reasons for adoption were to improve principals’ ability to be instructional leaders and to increase student achievement.
Principals and districts found an increase in principal instructional time to be the greatest benefit to the SAM process, followed by improving their time management and work/life balance. Principals also reported that the process increased their focus on teaching and learning. The primary benefits identified by Time Change Coaches were increasing both the time principals spend on instruction and the quality of that time. They also considered shared leadership beneficial to schools.
Changes in the SAM Process
The SAM process has developed over time in several ways that likely have improved its consistency of implementation and efficacy. Coaching has become more formalized and includes the use of a protocol. The Implementation Specialist position was added in 2010, and the First

55
Responder system was developed as well. In addition, professional development has been expanded and the TimeTrack Calendar has been improved in response to feedback from the field. A new model of the SAM process was developed to allow an existing school staff person to become a SAM, rather than someone hired externally, and SAM teams (rather than only individual SAMs) have emerged. Lastly, there is an emphasis not only on increasing time spent on instruction, but on developing the quality of that time as well.
The Literature and the SAM Process
The literature strongly supports the rationale behind the SAM process. Principals are expected to be instructional leaders, but multiple studies conclude that principals actually spend little time on instruction. Many challenges exist around principals increasing their time on instruction: organizational norms push principals away from instructional leadership; the many demands on principals’ time make it hard to focus on instruction; and they may lack skills and knowledge about instruction; and Aside from the SAM process, no large-scale interventions have attempted to focus on specifically changing principal time allocation.
Future Developments
We note three areas for continued development of the SAM process. First, increasing time spent on instructional leadership may be necessary but likely is not sufficient to improve teaching and learning in SAM schools. Principals must increase the quality of instructional time as well. Few schools are making the shift from a focus on increased instructional time to a focus on the quality of that time use. Unfortunately, the research literature in this area is limited, providing few firm conclusions regarding what kinds of instructional activities are most valuable.
Second, related to the prior point, some principals lack knowledge of instruction, teaching, and learning. Asking principals to increase their time on instructional leadership, including teaching and learning, presupposes principals have the knowledge to improve their teachers’ skills. Administrative support personnel as SAMs may not be in a strong position to help principals improve this capacity. Increased professional development has begun to address this need.
Lastly, there are possible differences between elementary and high schools’ experiences with the SAM process. This distinction could warrant further exploration and development as those differences become better understood.
56
References Barth, R. S. (2001). Teacher leader. Phi Delta Kappan, 82(6), 443–449.
California State Department of Education (1984). California high school curriculum study: Paths through high school. Sacramento, CA: Author.
Callahan, R. E., & Button, H. W. (1964). Historical change of the role of the man in the organization: 1865–1950. In D. E. Griffiths (Ed.), Behavioral science and educational administration (Sixty-third NSSE yearbook, Part II, pp. 73–92). Chicago: University of Chicago Press.
Camburn, E. M., Goldring, E. B., Sebastian, J., May, H., & Huff, J. (in press). An examination of the benefits, limitations, and challenges of conducting randomized experiments with principals. Educational Administration Quarterly.
Covay Minor, E., Porter, A. C., Murphy, J., Goldring, E. B., Cravens, X., & Elliot, S. N. (2014). A known group analysis validity study of the Vanderbilt Assessment for Leadership in Education in US elementary and secondary schools. Educational Assessment, Evaluation and Accountability, 26(1), 29–48.
Day, C., Sammons, P., Hopkins, D., Harris, A., Leithwood, K., Gu, Q., & Kington, A. (2009). The impact of school leadership on pupil outcomes. Nottingham, UK: Department for Children, Schools, and Families.
Doyle, M. (2000). Making meaning of teacher leadership in the implementation of a standards-based mathematics curriculum. Paper presented at the annual meeting of the American Educational Research Association, New Orleans, LA.
Goddard, Y. L., Neumerski, C. M., Goddard, R. D., Salloum, S. J., & Berebitsky, D. (2010). A multilevel exploratory study of the relationship between teachers' perceptions of principals' instructional support and group norms for instruction in elementary schools. The Elementary School Journal, 111(2), 336-357.
Goldring, E., Grissom, J. A., Cannata, M. A., Drake, T. A., Neumerski, C.M., & Rubin, M. (2015). Make room value-added: Principals’ human capital decisions and the emergence of teacher observation data. Educational Researcher, 44 (2), 96-104.
Goldring, E., Huff, J., May, H., & Camburn, E. (2008). School context and individual characteristics: What influences principal practice? Journal of Educational Administration, 46(3), 332–352.
Greenfield, T. B. (1988). The decline and fall of science in educational administration. In D. E. Griffith, R. T. Stout, & P. B. Forsyth (Eds.), Leaders for America’s schools (pp. 131–159). Berkeley, CA: McCutchan.
Griffin, G. A. (1995). Influences of shared decision making on school and classroom activity: Conversations with five teachers. The Elementary School Journal, 96(1), 29–45.

57
Grimmett, P. P., & Crehan, E. P. (1987). Changes in elementary school principals as a result of laboratory training. Paper presented at the annual meeting of the Canadian Association for Teacher Education.
Grissom, J. A., & Harrington, J. R. (2010). Investing in administrator efficacy: An examination of professional development as a tool for enhancing principal effectiveness. American Journal of Education, 116, 583–612.
Grissom, J. A., & Loeb, S. (2011). Triangulating principal effectiveness: How perspectives of parents, teachers, and assistant principals identify the central importance of managerial skills. American Educational Research Journal, 48(5), 1091–1123.
Grissom, J. A., Loeb, S., & Master, B. (2013). Effective instructional time use for school leaders: Longitudinal evidence from observations of principals. Educational Researcher, 42(8), 433–444.
Grissom, J. A., Loeb, S., & Mitani, H. (in press). Principal time management skills: Explaining patterns in principals’ time use, job stress, and perceived effectiveness. Journal of Educational Administration.
Hallinger, P. (2005). Instructional leadership and the school principal: A passing fancy that refuses to fade away. Leadership and Policy in Schools, 4(3), 221–239.
Hallinger, P., & Murphy, J. (1985). Assessing the instructional management behavior of principals. The Elementary School Journal, 86(2), 217–47.
Hanson, E. M. (1981). Organizational control in educational systems: A case study of governance in schools. In S. B. Bacharach (Ed.), Organizational behavior in schools and school districts, (pp. 245–276). New York, NY: Praeger.
Heck, R. H., & Hallinger, P. (2009). Assessing the contribution of distributed leadership to school improvement and growth in math achievement. American Educational Research Journal, 46(3), 659–689.
Heck, R. H., & Hallinger, P. (2010). Collaborative leadership effects on school improvement: Integrating unidirectional- and reciprocal-effects models. The Elementary School Journal, 111(2), 226–252.
Heck, R. H., & Hallinger, P. (2014). Modeling the longitudinal effects of school leadership on teaching and learning. Journal of Educational Administration, 52(5), 653–681.
Hills, J. (1975, Autumn). The preparation of administrators: Some observations from the “firing line.” Educational Administration Quarterly, 11(3), 1–20.
Horng, E., Klasik, D., & Loeb, S. (2010). Principals’ time use and school effectiveness. American Journal of Education, 116(4), 491–523.
Horng, E., & Loeb, S. (2010). New thinking about instructional leadership. Phi Delta

58
Kappan, 92(3), 66–69.
Howell, B. (1981). Profile of the principalship. Educational Leadership, 38(4), 333–336.
Jacob, R., Goddard, R., Kim, M., Miller, R., & Goddard, Y. (2014). Exploring the causal impact of the McREL balanced leadership program on leadership, principal efficacy, instructional climate, educator turnover, and student achievement. Educational Evaluation and Policy Analysis, doi: 10.3102/0162373714549620.
Kilmer, L, Sheng, B., Wolff, L., & Yager, S. (2014). The implementation of school administrator managers (SAMs) in the Davenport Community School District. Manuscript.
LaPointe, M., Meyerson, D., & Darling-Hammond, L. (2006). Preparing and supporting principals for effective leadership: Early findings from Stanford’s school leadership study. Paper presented at the annual meeting of the American Educational Research Association, San Francisco, CA.
Lee, M., & Hallinger, P. (2012). National contexts influencing principals' time use and allocation: economic development, societal culture, and educational system. School Effectiveness and School Improvement, 23(4), 461-482.
Leithwood, K., & Jantzi, D. (2006). Transformational school leadership for large-scale reform: Effects on students, teachers, and their classroom practices. School Effectiveness and School Improvement, 17(2), 201–227.
Leithwood, K., Louis, K. S., Anderson, S., & Wahlstrom, K. (2004). How leadership influences student learning. New York, NY: The Wallace Foundation.
Little, J. W. (1988). Assessing the prospects for teacher leadership. In A. Lieberman (Ed.), Building a professional culture in schools (pp. 78–105). New York: Teachers College Press.
Little, J. W., & Bird, T. D. (1984). Is there instructional leadership in high schools? First findings from a study of secondary school administrators and their influence on teacher professional norms. Paper presented at the annual meeting of the American Educational Research Association, New Orleans, LA.
Martin, W. J., & Willower, D. J. (1981). The managerial behavior of high school principals. Educational Administration Quarterly, 17(1), 69–90.
Martinko, M. J., and Gardner, W. L. (1990). Structured observation of managerial work: A replication and synthesis. Journal of Management Studies, 27(3), 329–357.
May, H., Huff, J., & Goldring, E. B. (2012). A longitudinal study of principals’ activities and school performance. School Effectiveness and School Improvement, 23(4), 417–439.
May, H., & Supovitz, J. A. (2011). The scope of principal efforts to improve instruction. Educational Administration Quarterly, 47(2), 332–352.
59
Morris, V. C., Crowson, R. L., Porter-Gehrie, C., & Hurwitz, E. (1984). Principals in action: The reality of managing schools. Columbus, OH: Charles F. Merrill.
Murphy, J. (1990). Principal instructional leadership. In L. S. Lotto & P. W. Thurston (Eds.), Advances in educational administration: Changing perspectives on the school (Volume 1, Part B). Greenwich, CT: JAI Press.
Murphy, J. (1992). The landscape of leadership preparation: Reframing the education of school administrators. Newbury Park, CA: Corwin Press.
Murphy, J. (2013). The architecture of school improvement. Journal of Educational Administration, 51(3), 252–263.
Murphy, J., & Beck, L. G. (1994). Reconstructing the principalship: Challenges and possibilities. In J. Murphy & K. S. Louis (Eds.), Reshaping the principalship: Insights from transformational reform efforts. Newbury Park, CA: Corwin Press.
Murphy, J., & Hallinger, P. (1992). The principalship in an era of transformation. Journal of Educational Administration, 30(3), 77-89.
Murphy, J., Hallinger, P., & Heck, R. (2013). Leading via teacher evaluation: The case of the missing clothes? Educational Researcher, 42(6), 349–354.
Murphy, J., Hallinger, P., Lotto, L. S., & Miller, S. K. (1987, December). Barriers to implementing the instructional leadership role. Canadian Administrator, 27(3), 1–9.
Murphy, J., & Meyers, C. V. (2008). Turning around failing schools: Leadership lessons from the organizational sciences. Thousand Oaks, CA: Corwin.
Murphy, J., Neumerski, C. M., Goldring, E., Grissom, J., & Porter, A. (2014). Bottling fog? The quest for instructional leadership. Unpublished Manuscript. Vanderbilt University.
Nettles, S. M., & Harrington, C. (2007). Revisiting the importance of the direct effects of school leadership on student achievement: The implications for school improvement policy. Peabody Journal of Education, 82(4), 724–736.
Neumerski, C. M. (2013). Rethinking instructional leadership, a review: What do we know about principal, teacher, and coach instructional leadership, and where should we go from here? Educational Administration Quarterly, 49(2), 310–347.
Neumerski, C.M., Grissom, J., Goldring, E., Cannata, M., Drake, T. A., Rubin, M., Scheurmann, P. (2014). Inside teacher evaluation systems: Shifting the role of principal as instructional leader. Paper presented at the annual meeting of the Association for Education Finance and Policy, San Antonio, TX.
Norton, M. S., & Levan, F. D. (1987). Doctoral studies of students in educational administration programs in UCEA member institutions. Educational Considerations, 14(1), 21–24.

60
Peterson, K. D. (1977). The principal’s tasks. Administrator’s Notebook, 26(8), 1–4.
Pitner, N. (1982). The Mintzberg method: What have we really learned? Paper presented at the annual meeting of the American Educational Research Association, New York, NY.
Quinn, D. M. (2002). The impact of principal leadership behaviors on instructional practice and student engagement. Journal of Educational Administration, 40(5), 447–467.
Robinson, V. M. J., Lloyd, C. A., & Rowe, K. J. (2008). The impact of leadership on student outcomes: An analysis of the differential effects of leadership types. Educational Administration Quarterly, 44, 635–674.
Sammons, P. M., Gu, Q., Day, C., & Ko, J. (2010). Exploring the impact of school leadership on pupil outcomes: Results from a study of academically improved and effective schools in England. International Journal of Educational Management, 25(1), 83–101.
Smylie, M. A., & Hart, A. W. (1999). School leadership for teacher learning: A human and social capital development perspective. In J. Murphy & K. S. Louis, Handbook of research on educational administration (second edition) (pp. 421–441). San Francisco, CA: Jossey-Bass.
Spillane, J. P., Camburn, E. M., & Stitziel Pareja, A. (2007). Taking a distributed perspective to the school principal's workday. Leadership and Policy in Schools, 6(1), 103-125.
Supovitz, J. A., & Poglinco, S. M. (2001). Instructional leadership in a standards-based reform. ERIC Clearinghouse.
Supovitz, J., Sirinides, P., & May, H. (2010). How principals and peers influence teaching and learning. Educational Administration Quarterly, 46, 31–56.
Thomas, T. A. (1970). Changes in elementary school principals as a result of laboratory training. University of Oregon, Center for Advanced Study of Educational Administration.
Turnbull, B.J. Arcaira, E. & Sinclair, B. (2011). Implementation of the National SAM Innovation Project: A Comparison of Project Designs. Washington, DC: Policy Studies Associates, Inc.
Turnbull, B. J., Haslam, M. B., Arcaira, E. R., Riley, D. L., Sinclair, B., & Coleman, S. (2009). Evaluation of the school administrator manager project. Washington, DC: Policy Studies Associates, Inc.
Turnbull, B.J. White, R.N., & Arcaira, E.R. (2010). Achievement Trends in Schools With School Administration Managers. Washington, DC: Policy Studies Associates, Inc.
Willis, Q. (1980). The work activity of school principals: An observational study. The Journal of Educational Administration, 18(1), 27–54.

61
Wolcott, H. F. (1973). The man in the principal’s office: An ethnography. New York, NY: Holt, Rinehart and Winston.
Young, I. P. (1997). Holmes versus traditional teacher candidates: Labor market receptivity. Journal of School Leadership, 7(4), 330–344.
Young, M. D., Crow, G., Ogawa, R., & Murphy, J., (Eds.) (2009). The handbook of research on the education of school leaders. New York, NY: Routledge.

ABOUT THE WALLACE FOUNDATIONThe Wallace Foundation is a national philanthropy that seeks to improve education and enrichment for disadvantaged children and foster the vitality of the arts for everyone. The foundation works with partners to develop credible, practical insights that can help solve important, public problems.
Wallace has five major initiatives under way:
� School leadership: Strengthening education leadership to improve student achievement.
� After-school: Helping cities make good after-school programs available to many more children, including strengthening the financial management capacity of after-school providers.
� Building audiences for the arts: Developing effective approaches for expanding audiences so that many more people might enjoy the benefits of the arts.
� Arts education: Expanding arts learning opportunities for children and teens. Summer and expanded learning time: Better understanding the impact of high-quality summer learning programs on disadvantaged children, and how to enrich and expand the school day.
� Summer and expanded learning time: Better understanding the impact of high-quality summer learning programs on disadvantaged children, and how to enrich and expand the school day.

Making Time for Instructional LeadershipVOLUME 2: THE FEASIBILITY OF A RANDOMIZED
CONTROL TRIAL OF THE SAM PROCESS
Ellen Goldring, Jason A. Grissom, Christine M. Neumerski
Joseph Murphy, Richard Blissett V A N D E R B I L T U N I V E R S I T Y
Andy Porter U N I V E R S I T Y O F P E N N S Y L V A N I A

Copyright © 2015 Published by The Wallace Foundation All rights reserved This study was commissioned by The Wallace Foundation. It was conducted by researchers at Vanderbilt University and the University of Pennsylvania. The contents expressed in this report are those of the authors and do not necessarily represent the views of the sponsor. Cover photo: vgajic Front and back cover design: José Moreno Acknowledgement The support and valuable contributions of several individuals and organizations were essential to this study. We thank Mark Shellinger, Director, National SAM Innovation Project, for his ongoing engagement and valuable feedback throughout this project. Jim Mercer at NSIP assisted us with survey implementation and was consistently helpful with our numerous data questions. Other staff from NSIP gave generously of their time and provided crucial insights. We thank the participants in this study who welcomed the researchers into their schools and districts, and shared their experiences and expertise through interviews and surveys. Mollie Rubin and Laura Rogers provided valuable research support.
1
MAKING TIME FOR INSTRUCTIONAL LEADERSHIP VOLUME 2: THE FEASIBILITY OF A RANDOMIZED CONTROLLED TRIAL OF
THE SAM PROCESS
Ellen Goldring
Jason A. Grissom Christine M. Neumerski
Joseph Murphy Richard Blissett
Vanderbilt University
Andy Porter University of Pennsylvania

2
Table of Contents I. Purpose of This Report and Approach ........................................................................................ 3 II. Criteria for Judging the Feasibility and Utility of an RCT and Implementation Analysis ........ 3
Criterion 1: Are Schools Implementing the SAM Process with Fidelity? .................................. 4 Criterion 2: Is the SAM process sufficiently well established and articulated that it can be replicated across a large number of schools in an RCT? ............................................................ 5 Criterion 3: Does the SAM process show evidence of efficacy in changing behaviors or outcomes consistent with its theory of action?............................................................................ 7 Criterion 4: Do measures exist (or could they reasonably be developed) to capture elements of the theory of action and hypothesized outcomes? ....................................................................... 8 Criterion 5: Is an RCT of the SAM process feasible from a design perspective? ....................... 8
III. Designing a High-Quality RCT of the SAM Process ............................................................. 10 Recruiting and Choosing Participating Districts and Schools .................................................. 11 Choosing Sample Sizes ............................................................................................................. 12 Defining and Standardizing the Intervention ............................................................................ 13 Delivering the Intervention ....................................................................................................... 13 Collecting Data on Mediating Variables ................................................................................... 14 Measuring Impacts on Instructional Practice and Student Achievement and Implications for Study Duration and Cost ........................................................................................................... 14 Securing Access to Data ............................................................................................................ 15 Roles for NSIP .......................................................................................................................... 15
References ..................................................................................................................................... 17
3
I. Purpose of This Report and Approach A goal of this project was to collect and assess information that would shed light on whether the SAM® process is ready for a randomized controlled trial (RCT), whether a high-quality RCT is feasible, and, if so, to make recommendations regarding what steps might be taken to facilitate a high-quality RCT. This appendix discusses findings on each of those fronts.
We begin by discussing the five criteria we identified for assessing the feasibility of an RCT and an accompanying implementation analysis. Then, drawing on the data we collected to inform our investigation of the SAM process as detailed in the main report, we discuss what we learned in light of each of these criteria. The final section details our recommendations for designing a high-quality RCT and implementation analysis of the SAM process.
To preview our conclusions, there is considerable support for conducting an RCT of the SAM process. The study data suggest that there is strong fidelity of implementation and that the SAM process can be implemented at sufficient scale for an RCT. Furthermore, our data to suggest efficacy of the SAM process in changing behaviors or outcomes consistent with its theory of action, including changes in instructional time use. There are sufficient existing measures to systematically study the proximate and ultimate outcomes of the SAM process, and it is feasible to design and implement a rigorous RCT design if attention is given to the crucial design parameters and considerations we describe.
II. Criteria for Judging the Feasibility and Utility of an RCT and Implementation Analysis
Our analysis and recommendations regarding the feasibility and utility of an RCT of the SAM process are based on five criteria that reflect those used by the U.S. Department of Education’s Institute of Education Sciences in evaluating proposals for what they refer to as “Effectiveness” studies, which typically are large-scale RCTs of well-developed programs or interventions. The criteria are:
1. Are schools implementing the SAM process with fidelity? 2. Is the SAM process sufficiently well established and articulated that it can be replicated
across a large number of schools in an RCT? 3. Does the SAM process show evidence of efficacy in changing behaviors or outcomes
consistent with its theory of action? 4. Do measures exist (or could they reasonably be developed) to capture elements of the
theory of action and hypothesized outcomes? 5. Is an RCT of the SAM process feasible from a design perspective? That is, is there a
reasonable design for randomization and study implementation that could produce inferences regarding the impacts of the SAM process that are internally and externally valid and statistically precise?
The first criterion asks whether schools that are implementing the SAM process are doing so consistently as intended. Evidence that current participants are not engaging with the process
4
with fidelity would suggest that subjects in an RCT are unlikely to implement the process as it is designed.
Relatedly, the second criterion considers whether the SAM process can be taken to scale in an experiment in the sense that its components are stable and described well enough that subjects in an RCT could replicate the SAM process across many schools. If the SAM process is evolving rapidly, for example, schools may be implementing many variations on the process, making the program not replicable in the sense required by an RCT.
The third criterion asks whether existing evidence provides sufficient evidence of positive effects of the SAM process on outcomes it should affect to warrant a significant investment in further evaluation. These outcomes can be both proximal to the SAM process, such as by changing how principals allocate their time between instructional activities and other activities, and more distal outcomes, such as changes in the quality of teacher instruction as a result of changes in proximal outcomes. Minimal evidence of positive effects on relevant outcomes would provide little promise that positive effects would be uncovered in an RCT.
The fourth criterion explores whether the components of the SAM process and its hypothesized effects could be measured in a valid way. These effects include both medium-run or long-run (final) outcomes of participating in the SAM process and mediating outcomes, or near-term effects of the intervention that lead to later effects. For example, the SAM process might change principal time allocations, which then change teacher behaviors, such as instructional practices, which improve student achievement. If important components of the theory of action or the most relevant mediating or final outcomes could not be captured adequately without an unrealistically costly investment in data collection, an RCT would be difficult to justify.
The final criterion considers whether there is a logistically feasible design for an RCT that would permit convincing estimates of effects. There are numerous facets to consider. The first is internal validity. Can schools realistically be randomly assigned to the SAM process or to a business-as-usual control such that the control represents the desired counterfactual and the effects estimated are interpretable as due to the SAM process? Can the RCT be implemented in a way that guards against potential threats to validity that might be present even with random assignment, such as “spillover” among principals in the treatment and control conditions? The second is precision (or statistical power). Can an RCT be designed to be sufficiently precise to detect an effect size of educational importance on outcomes of interest? The third is external validity, or the extent to which the results of an RCT can be generalized. The technical way to explore external validity is to build a design that tests interactions, which in the case of the SAM process undoubtedly include variables such as principal experience, leader behaviors, and indicators of implementation, identified and addressed in the fieldwork component of our study.
We summarize in the following sections what we have learned about the SAM process in light of these criteria and conclude that the SAM process warrants the development of an RCT.
Criterion 1: Are Schools Implementing the SAM Process with Fidelity?
We conclude that the first criterion is met. As detailed in the main report, a large number of schools across numerous locales and types are implementing the SAM process with relative fidelity as evidenced by case study data, TimeTrack calendar data, and survey results,

5
notwithstanding local adaptation. Schools and districts are largely committed to the process, and core components of the process are evident in the schools. Principals are voluntarily participating with district buy-in.
From the survey data, we learned that the large majority of principals usually or always meet with their SAM, use and reconcile the TimeTrack calendar, hold reflective conversations, use the First Responder system, and meet with a Time Change Coach. The case studies further document the widespread implementation of the core components.
Throughout the report, we note variation and challenges in implementation as well. More nuanced and complex aspects of the process are most challenging and are implemented with less frequency and robustness. For example, the First Responder system presents challenges for some schools, and principals are much more likely to create their schedules and reconcile their calendars using the TimeTrack calendar than they are to use the calendar to disaggregate data to see how they implement specific tasks with specific teachers. Other challenges noted in the case studies refer to choosing an appropriate person to be a SAM and the extent to which the SAM is comfortable with and able to sufficiently probe and challenge the principal in the Daily Meetings. We note instances of lax use of the TimeTrack calendar, resulting in unscheduled time that we do not fully understand.
However, we conclude that the variation and challenges are within the realm of what one would expect for implementation of a complex behavioral intervention in schools that honors the need for local adaptation. Given the spread of the SAM process, across diverse locales, types of schools, districts, and principals, we conclude that there is a very high level of common implementation of the SAM process. There is a clearly defined, recognizable program that is sufficiently similar in its implementation to warrant an RCT.
This notion of fidelity with local adaptation is not unique, and it is discussed in the literature. Fidelity is commonly conceptualized as how closely implemented versions of programs align with original design (O’Donnell, 2008). Fidelity and adaptation are not mutually exclusive. Adaptation supporters argue that local conditions influence how practitioners implement programs; adaptation is necessary for successful implementation (Berman & McLaughlin, 1978).
Criterion 2: Is the SAM process sufficiently well established and articulated that it can be replicated across a large number of schools in an RCT?
We find that the second criterion is largely met. The SAM process is very clearly articulated and well understood. There is widespread agreement about the core components of the program and a well-defined theory of action. The participants in our study had no misunderstandings about the program components, expectations, or hypothesized benefits. Those engaged in the process, from NSIP personnel to district and school participants, each had a clear understanding of the core components and the respective roles and responsibilities of each party. NSIP has clear job descriptions, procedures for implementation and training, and ongoing support and professional development (PD).
The specificity of the SAM process and its theory of action bode well for a rigorous evaluation through an RCT. First, we believe that the program can be replicated and implemented with fidelity across a large number of schools because (a) there is a very clear articulation of the SAM
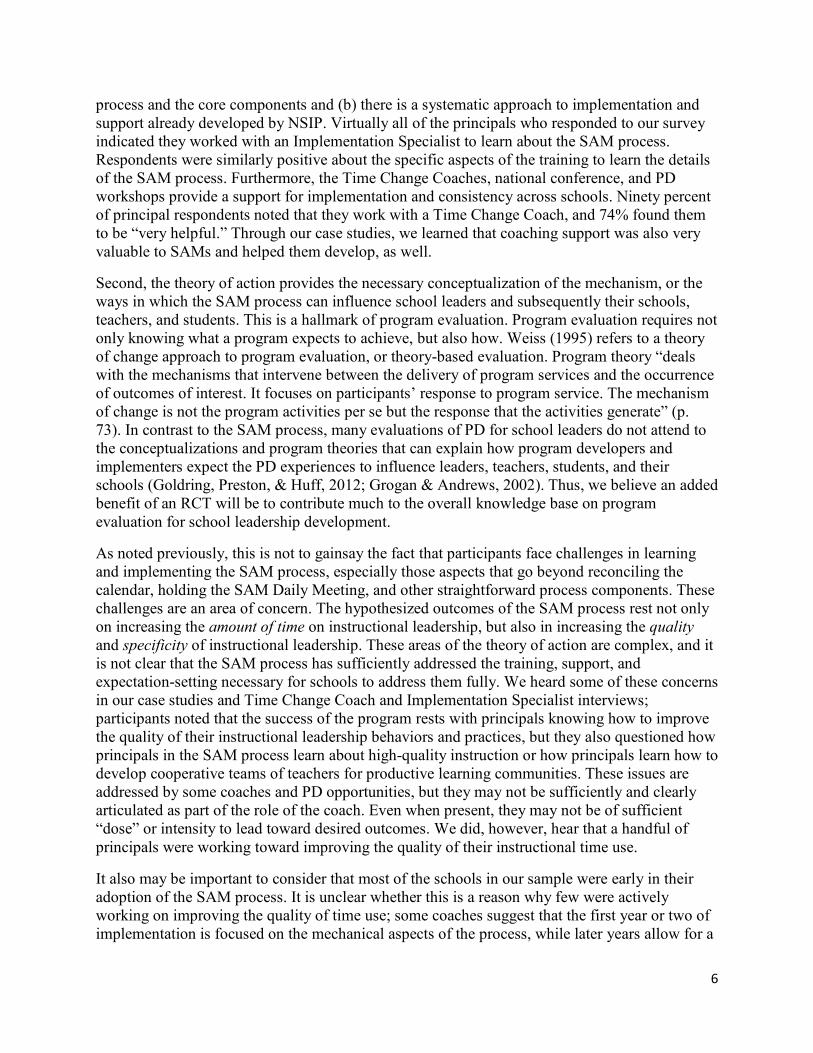
6
process and the core components and (b) there is a systematic approach to implementation and support already developed by NSIP. Virtually all of the principals who responded to our survey indicated they worked with an Implementation Specialist to learn about the SAM process. Respondents were similarly positive about the specific aspects of the training to learn the details of the SAM process. Furthermore, the Time Change Coaches, national conference, and PD workshops provide a support for implementation and consistency across schools. Ninety percent of principal respondents noted that they work with a Time Change Coach, and 74% found them to be “very helpful.” Through our case studies, we learned that coaching support was also very valuable to SAMs and helped them develop, as well.
Second, the theory of action provides the necessary conceptualization of the mechanism, or the ways in which the SAM process can influence school leaders and subsequently their schools, teachers, and students. This is a hallmark of program evaluation. Program evaluation requires not only knowing what a program expects to achieve, but also how. Weiss (1995) refers to a theory of change approach to program evaluation, or theory-based evaluation. Program theory “deals with the mechanisms that intervene between the delivery of program services and the occurrence of outcomes of interest. It focuses on participants’ response to program service. The mechanism of change is not the program activities per se but the response that the activities generate” (p. 73). In contrast to the SAM process, many evaluations of PD for school leaders do not attend to the conceptualizations and program theories that can explain how program developers and implementers expect the PD experiences to influence leaders, teachers, students, and their schools (Goldring, Preston, & Huff, 2012; Grogan & Andrews, 2002). Thus, we believe an added benefit of an RCT will be to contribute much to the overall knowledge base on program evaluation for school leadership development.
As noted previously, this is not to gainsay the fact that participants face challenges in learning and implementing the SAM process, especially those aspects that go beyond reconciling the calendar, holding the SAM Daily Meeting, and other straightforward process components. These challenges are an area of concern. The hypothesized outcomes of the SAM process rest not only on increasing the amount of time on instructional leadership, but also in increasing the quality and specificity of instructional leadership. These areas of the theory of action are complex, and it is not clear that the SAM process has sufficiently addressed the training, support, and expectation-setting necessary for schools to address them fully. We heard some of these concerns in our case studies and Time Change Coach and Implementation Specialist interviews; participants noted that the success of the program rests with principals knowing how to improve the quality of their instructional leadership behaviors and practices, but they also questioned how principals in the SAM process learn about high-quality instruction or how principals learn how to develop cooperative teams of teachers for productive learning communities. These issues are addressed by some coaches and PD opportunities, but they may not be sufficiently and clearly articulated as part of the role of the coach. Even when present, they may not be of sufficient “dose” or intensity to lead toward desired outcomes. We did, however, hear that a handful of principals were working toward improving the quality of their instructional time use.
It also may be important to consider that most of the schools in our sample were early in their adoption of the SAM process. It is unclear whether this is a reason why few were actively working on improving the quality of time use; some coaches suggest that the first year or two of implementation is focused on the mechanical aspects of the process, while later years allow for a

7
deeper focus. Thus, it remains unclear whether principals would begin to focus on quality in later years of implementation.
These also are areas where more explicit articulation of the roles of principals, SAMs, and coaches are needed. In addition, much more direct and intensive support and training of coaches is required. And there are implications for who the SAM might be. It is one thing to have a secretary as a SAM who is monitoring a calendar (time); it is another to have a SAM who can really work with the principal on learning and reflecting about providing high-quality feedback to teachers. These are issues that are at the front and center of NSIP’s ongoing development and work. NSIP is aware of these needs and complexities, and the theory of action now encompasses instructional time quality.
An additional concern is sustainability. Most schools rely on grant funding. Presumably, the costs of the implementation of the SAM process in an RCT would have to be covered by the funding agency for the entire timespan of the study. This was an area of concern for coaches, who saw sustainability as one of the largest challenges to the SAM process.
Criterion 3: Does the SAM process show evidence of efficacy in changing behaviors or outcomes consistent with its theory of action?
The evidence in support of an RCT on this criterion, changing outcomes, is mixed, dependent on the outcome variable of interest. Our answer is yes if the dependent variable is increased emphasis by principals on allocating time toward the improvement of instruction. This is a finding in the Time/Task Analysis shadowing data, comparing time use from one year to the next, and TimeTrack calendar data, comparing first-year participants to veterans. Principals and district staff clearly articulate this benefit in the case studies, as do Implementation Specialists and Time Change Coaches.
Our methodology for this study did not allow us to directly test other outcomes, beyond self-reports through interviews and surveys. Those self-report data do suggest other perceived and plausible benefits and outcomes that are consistent with the theory of action. For example, 46% of principals indicated that the SAM process helps them improve instruction in the school “a lot.” Case studies and interviews provided insights into other reported benefits, such as a positive change in school culture, valuing staff, providing leadership growth opportunities for others in schools, and managing a work/life balance. Respondents across surveys and interviews reported that the SAM process does show efficacy in changing behaviors and outcomes.
In this study, we did not test whether the SAM process changes student achievement. Prior evidence from an evaluation conducted by PSA found little evidence of achievement impacts, although as we noted in the main report, limitations faced by that study suggest that the results are largely inconclusive (Turnbull, White and Arcaira, 2010). Regardless, it is important to underscore that the SAM process as currently implemented is different from what it was at the time of the PSA study. In addition, changes in student achievement were not among the most important factors for why principals decided to participate in the SAM process. Case studies and other interviewees noted that many factors contribute to improvement in student achievement, acknowledging the indirect linkages between principal leadership and student outcomes. However, many believed that the SAM process was likely a contributing factor.

8
We think that the shift in allocation of time to instructional leadership is sufficiently important and sufficiently documented to do an RCT to determine whether there are, in fact, causal relationships between the SAM process and other important outcomes as articulated in the theory of action beyond the amount of time on instructional leadership. We are less sanguine about documenting impacts on student achievement, given the indirect nature of the relationship between changes in principal leadership and student outcomes and the empirical challenges of detecting those effects.
Criterion 4: Do measures exist (or could they reasonably be developed) to capture elements of the theory of action and hypothesized outcomes?
We believe this criterion is met. A test of the theory of action of the SAM process in an RCT rests with the availability of existing measures to test hypothesized outcomes beyond student achievement. In this case, we are interested in both mediating variables, thought of as near-term effects of an intervention that are required for the intervention to have the desired longer-term effects, as well longer-term outcomes.
In the SAM process theory of action, the most important mediating variable is actual changes in time spent on instructional leadership. There are established methodologies and measures that can be implemented both in the Time/Task Analysis shadowing and TimeTrack calendar data as part of the intervention itself, as well as other measurement approaches, external to the SAM process, that have been implemented in the recent literature, such as end of day logs and detailed shadowing observations (Goldring et al., 2008; Grissom, Loeb, & Master, 2013). Surveys, observations, and interviews can ascertain other measures of implementation fidelity.
We have robust measures for many of the other concepts in the theory of action. For example, changes in quality of instruction can be directly measured through the implementation of reliable and valid observation rubrics, such as the CLASS or Danielson Framework for Teaching (see Goldring et al., 2014). These measures have been implemented in RCTs. School culture, climate, and relational trust can be measured through previously developed surveys that have known psychometric properties (see, for example, extensive survey-based climate measures developed by the Consortium on Chicago School Research). Instructional leadership quality can be measured by the Vanderbilt Assessment of Leadership in Education (Porter et al., 2010).
The challenge will be to develop measures of both the quality and frequency of specific instructional leadership behaviors, such as providing feedback to teachers. While these measures have heretofore not been well conceptualized in the research literature, the seeds of such work are beginning with research groups across the United States. For example, the Center for Educational Leadership at the University of Washington has developed scales and rubrics for ascertaining the quality of feedback provided to teachers in post-observation conferences.
Criterion 5: Is an RCT of the SAM process feasible from a design perspective?
An RCT has three main design goals: internal validity, sufficient precision for detecting effects, and external validity. Here we discuss each of these goals and our assessment of the feasibility of an RCT of the SAM process that meets these objectives. Our general assessment is that, with careful attention to these details, an RCT can be designed that meets these goals. Additional considerations around each of the goals are discussed in the next section.
9
First, an RCT should have internal validity. By that, we mean that it should provide unbiased estimates of the treatment effect—in this case, the effect of participation in the SAM process on an outcome of interest. To provide unbiased estimates, there must be a realistic means for randomly assigning a school to the SAM process (treatment) or business-as-usual (control), and it must be possible to guard against such threats to internal validity as spillover between the treatment and control groups, differential attrition, and instrumentation bias. Our assessment is that such a design is feasible. For reasons we describe in more detail later, we recommend a design that recruits districts to offer the treatment to schools, then randomizes among schools that wish to participate, with schools as the unit of assignment. Only principals in treated schools will obtain access to the various components of the SAM process.
Spillover between participating and non-participating principals within districts is likely to be minimal because the SAM process is a school-level intervention whose main components (TimeTrack calendar, Time/Task Analysis results, support/training from NSIP) cannot easily be transferred, although steps may need to be taken to ensure that Time Change Coaches working with treatment principals do not also provide similar supports to control principals in the district, an issue discussed further in the next section. Because spillover can never be completely controlled, researchers should gather data on potential spillover via surveys from control principals during the study.
To minimize differential attrition between the treatment and control groups, the study should be designed so that a school would remain in the study only if it continues implementing the SAM process or remains an uncontaminated business-as-usual control. That is, a school is not lost when a principal leaves the school, so long as the replacement principal is recruited to use the SAM process. Neither is a school lost from the intervention group when a SAM leaves, so long as the SAM is replaced. Schools would be lost from the study if they refused to participate any longer, either because they no longer wished to implement the SAM process or they no longer wished to be in the business-as-usual control group or to provide data.
Instrumentation bias occurs when data collection methods influence the results in either the treatment or control group. Although researchers must take care to guard against instrumentation bias in designing and collecting survey and interview data, we believe the greatest threat of instrumentation bias in a study of the SAM process rests in the observational study of principal time use. That is, changes in principal instructional time are central to the SAM process theory of action, and the current process uses trained observers who are employees of NSIP to shadow participating principals. The shadowing occurs over full weeks at the baseline and once per school year subsequently to provide an unbiased accounting of changes in principal time investments. Any RCT of the SAM process will likely seek to use these observational data and potentially implement similar observations of control group principals so changes in principal time use can be tested as an effect of the intervention. To ensure that data are collected in a consistent manner, the same observers should be used for both treatment and control principals, with attempts made to keep observers “blind” to the treatment (i.e., they should not be told which principals are treatment or control) in the baseline data collection. In subsequent years, this blindness will not be possible—observers will see treatment principals using the TimeTrack calendar, for example—but observers should be trained to collect data similarly regardless of whether observing a treatment or control principal. In addition, researchers may consider dual coding of some observations or other procedures to guard against this possible threat in
10
collecting observational data. Researchers also may consider collecting shadowing data independently of NSIP, which could accommodate alternative coding schemes for tracking principal time use.
The second goal of an RCT is adequate precision (or statistical power). By precision, we mean whether an RCT can be designed to be sufficiently precise to detect an effect size of educational importance on outcomes of interest. Precision can be thought about in terms of the size of the standard error of the estimate of the treatment effect, or the statistical power for detecting a treatment effect of a given size. The primary question for ensuring sufficient precision is whether an adequate number of schools can be recruited to participate in the RCT. Precision also can be enhanced through adding covariates correlated with the dependent variables and/or blocking on variables correlated with the dependent variables, points we discuss in more detail later.
Third, an RCT should have external validity. By external validity, we mean that the results can be generalized from the specific study to a larger set of circumstances (e.g., different populations of subjects, different contexts). Designers of an RCT can improve external validity by recruiting districts to participate from a variety of locations and contexts. Aside from choice of study sites, the technical way to explore external validity is to build a design that allows sufficiently powered tests of interactions with variables that might plausibly alter the implementation or effects of the program. For example, given evidence that elementary and secondary school principals engage differently with the SAM process, one might build a design that allows a test of whether the intervention interacts with level of schooling. If there is no interaction, then the intervention has greater external validity than if there is an interaction, which indicates that the size of the effect depends upon whether you are investigating one level of schooling or another (Porter, 1997).
There are at least two important issues to consider in designing a study that incorporates tests for interactions. The first is which variables it would be desirable to test. In the case of the SAM process, likely candidates include years of principal experience (i.e., novice principals may be affected by participation in the SAM process much differently than principals who have been leading schools for many years), school enrollment size or level (given that principal time use is likely very different in small and large schools), and characteristics of the student population that might be associated with principal time demands (such as average prior achievement levels in the school). Researchers also would potentially seek to test for interactions with indicators of SAM implementation, with the expectation that the impact of the SAM process is higher in schools that implement it more rigorously. The second issue is how the need to test such interactions affects the size of the study. The statistical power for tests of interactions typically is low, suggesting that the design will need to include many more schools to allow for reliable tests. For some kinds of variables, oversampling may be necessary, as in the example of schooling level, since most districts have many more elementary schools than secondary schools.
III. Designing a High-Quality RCT of the SAM Process Having established from our analysis that an RCT of the SAM process is both warranted and feasible, we next provide further recommendations regarding how an RCT might be implemented to meet its goals of achieving high internal validity, precision, and external validity.
11
Recruiting and Choosing Participating Districts and Schools
From our current data collection and analysis, two principles appear key in recruiting sites and participants for an RCT of the SAM process. The first is that district context is likely to be an important factor in how principals use their time and in how the SAM process is implemented. The second is that the kind of buy-in from principals that comes with self-selecting into the SAM process is essential to its likelihood of success in a school. To address the first principle, we recommend that each district be treated as a “block” to control for district-specific impacts on time use and SAM process implementation—that is, districts would be recruited first, and then randomization would occur within districts. To address the second principle, we recommend that school participation be voluntary, not required. Districts agreeing to partner in the study would offer the opportunity to participate to principals, and randomization would be conducted within the list of principals who sign up.
Although concerns for external validity suggest that researchers should aim to recruit districts from diverse contexts, including with respect to size and location, we recommend that recruitment should focus on districts of medium to large size. Larger districts are necessary to ensure that there are sufficient numbers of principals who seek to opt into the treatment. Larger districts also are more likely to have processes in place to facilitate the sharing of school, teacher, and—if necessary—student data for the evaluation. While including schools from smaller districts (of the kinds typical of rural areas, for example) is desirable, we suspect that the benefits of recruiting more populous districts for an RCT outweigh potential external validity costs. (We did not study SAM process implementation in small, rural districts in our case studies).
We also recommend that an RCT recruit new districts (i.e., districts that do not currently have schools participating in the SAM process). There are at least two reasons for this recommendation. First, new districts will start afresh with no preconceived notions of what the SAM process involves. The fresh start makes possible a common definition of the SAM process intervention and the nature of district involvement. Second, new districts will have more eligible schools and less likelihood of the control schools being contaminated by having former SAM principals at the outset or during the period of intervention.
Another important recruitment issue is what incentives might be necessary to ensure initial and continued participation in the study. Given the substantial ongoing growth of the SAM process into new districts willing to pay for the process and NSIP’s services, we anticipate that researchers will not encounter trouble with identifying districts willing to serve as study sites in exchange for free provision of the SAM process to participating principals. Although it may be necessary to budget some payment to school districts for data provision, our assessment is that access to the SAM process at no cost is likely a sufficient incentive for district participation. Similarly, incentives are unlikely to be necessary for treatment principals beyond access to the SAM process for their schools. Control principals, however, may require incentives to ensure that they provide survey and/or interview data each year as the RCT unfolds, given concerns about differential attrition from the study as a threat to internal validity. Unless it is cost-prohibitive, we recommend a delayed treatment approach in which control group principals are promised the SAM process at a later time—perhaps in the third year of implementation—as an incentive to provide data on the business-as-usual condition in initial years of the study.
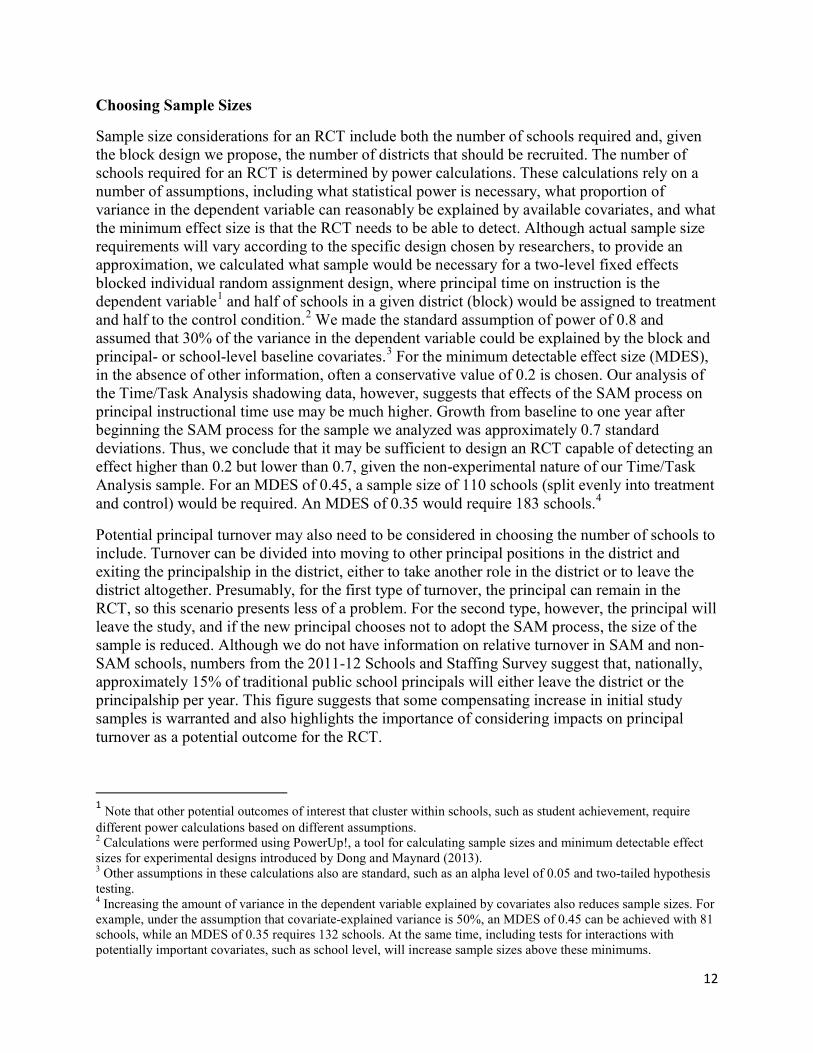
12
Choosing Sample Sizes
Sample size considerations for an RCT include both the number of schools required and, given the block design we propose, the number of districts that should be recruited. The number of schools required for an RCT is determined by power calculations. These calculations rely on a number of assumptions, including what statistical power is necessary, what proportion of variance in the dependent variable can reasonably be explained by available covariates, and what the minimum effect size is that the RCT needs to be able to detect. Although actual sample size requirements will vary according to the specific design chosen by researchers, to provide an approximation, we calculated what sample would be necessary for a two-level fixed effects blocked individual random assignment design, where principal time on instruction is the dependent variable1 and half of schools in a given district (block) would be assigned to treatment and half to the control condition.2 We made the standard assumption of power of 0.8 and assumed that 30% of the variance in the dependent variable could be explained by the block and principal- or school-level baseline covariates.3 For the minimum detectable effect size (MDES), in the absence of other information, often a conservative value of 0.2 is chosen. Our analysis of the Time/Task Analysis shadowing data, however, suggests that effects of the SAM process on principal instructional time use may be much higher. Growth from baseline to one year after beginning the SAM process for the sample we analyzed was approximately 0.7 standard deviations. Thus, we conclude that it may be sufficient to design an RCT capable of detecting an effect higher than 0.2 but lower than 0.7, given the non-experimental nature of our Time/Task Analysis sample. For an MDES of 0.45, a sample size of 110 schools (split evenly into treatment and control) would be required. An MDES of 0.35 would require 183 schools.4
Potential principal turnover may also need to be considered in choosing the number of schools to include. Turnover can be divided into moving to other principal positions in the district and exiting the principalship in the district, either to take another role in the district or to leave the district altogether. Presumably, for the first type of turnover, the principal can remain in the RCT, so this scenario presents less of a problem. For the second type, however, the principal will leave the study, and if the new principal chooses not to adopt the SAM process, the size of the sample is reduced. Although we do not have information on relative turnover in SAM and non-SAM schools, numbers from the 2011-12 Schools and Staffing Survey suggest that, nationally, approximately 15% of traditional public school principals will either leave the district or the principalship per year. This figure suggests that some compensating increase in initial study samples is warranted and also highlights the importance of considering impacts on principal turnover as a potential outcome for the RCT.
1 Note that other potential outcomes of interest that cluster within schools, such as student achievement, require different power calculations based on different assumptions. 2 Calculations were performed using PowerUp!, a tool for calculating sample sizes and minimum detectable effect sizes for experimental designs introduced by Dong and Maynard (2013). 3 Other assumptions in these calculations also are standard, such as an alpha level of 0.05 and two-tailed hypothesis testing. 4 Increasing the amount of variance in the dependent variable explained by covariates also reduces sample sizes. For example, under the assumption that covariate-explained variance is 50%, an MDES of 0.45 can be achieved with 81 schools, while an MDES of 0.35 requires 132 schools. At the same time, including tests for interactions with potentially important covariates, such as school level, will increase sample sizes above these minimums.
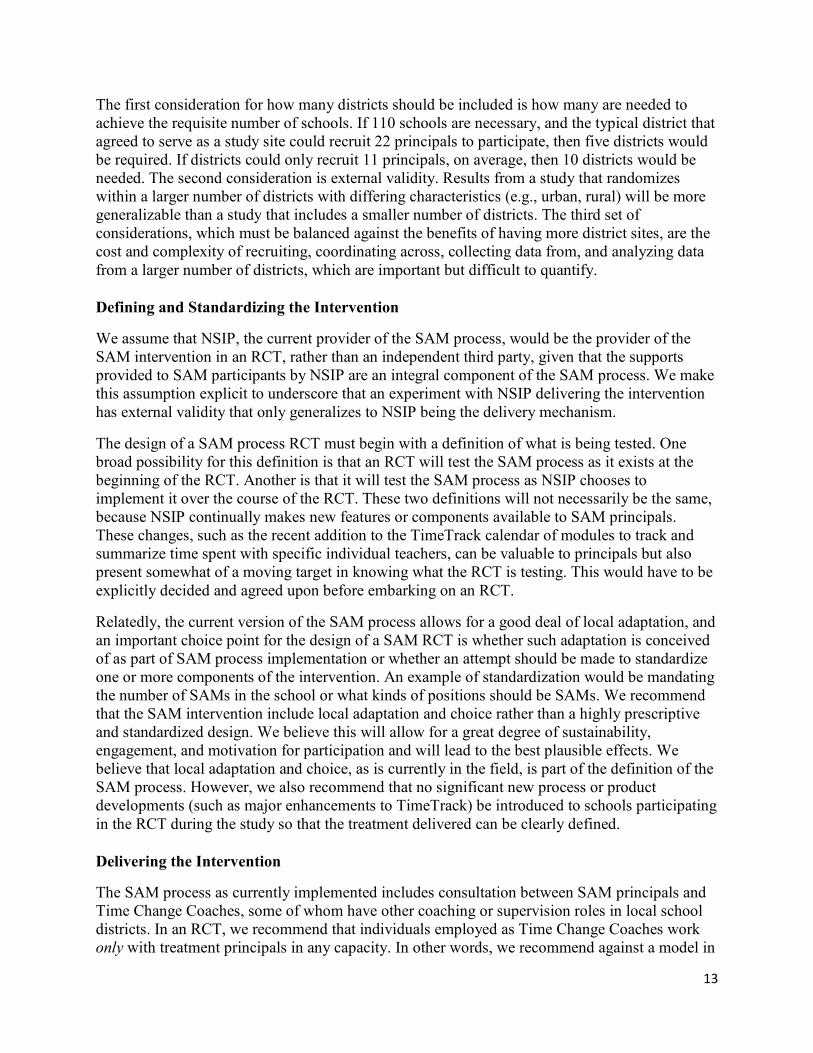
13
The first consideration for how many districts should be included is how many are needed to achieve the requisite number of schools. If 110 schools are necessary, and the typical district that agreed to serve as a study site could recruit 22 principals to participate, then five districts would be required. If districts could only recruit 11 principals, on average, then 10 districts would be needed. The second consideration is external validity. Results from a study that randomizes within a larger number of districts with differing characteristics (e.g., urban, rural) will be more generalizable than a study that includes a smaller number of districts. The third set of considerations, which must be balanced against the benefits of having more district sites, are the cost and complexity of recruiting, coordinating across, collecting data from, and analyzing data from a larger number of districts, which are important but difficult to quantify.
Defining and Standardizing the Intervention
We assume that NSIP, the current provider of the SAM process, would be the provider of the SAM intervention in an RCT, rather than an independent third party, given that the supports provided to SAM participants by NSIP are an integral component of the SAM process. We make this assumption explicit to underscore that an experiment with NSIP delivering the intervention has external validity that only generalizes to NSIP being the delivery mechanism.
The design of a SAM process RCT must begin with a definition of what is being tested. One broad possibility for this definition is that an RCT will test the SAM process as it exists at the beginning of the RCT. Another is that it will test the SAM process as NSIP chooses to implement it over the course of the RCT. These two definitions will not necessarily be the same, because NSIP continually makes new features or components available to SAM principals. These changes, such as the recent addition to the TimeTrack calendar of modules to track and summarize time spent with specific individual teachers, can be valuable to principals but also present somewhat of a moving target in knowing what the RCT is testing. This would have to be explicitly decided and agreed upon before embarking on an RCT.
Relatedly, the current version of the SAM process allows for a good deal of local adaptation, and an important choice point for the design of a SAM RCT is whether such adaptation is conceived of as part of SAM process implementation or whether an attempt should be made to standardize one or more components of the intervention. An example of standardization would be mandating the number of SAMs in the school or what kinds of positions should be SAMs. We recommend that the SAM intervention include local adaptation and choice rather than a highly prescriptive and standardized design. We believe this will allow for a great degree of sustainability, engagement, and motivation for participation and will lead to the best plausible effects. We believe that local adaptation and choice, as is currently in the field, is part of the definition of the SAM process. However, we also recommend that no significant new process or product developments (such as major enhancements to TimeTrack) be introduced to schools participating in the RCT during the study so that the treatment delivered can be clearly defined.
Delivering the Intervention
The SAM process as currently implemented includes consultation between SAM principals and Time Change Coaches, some of whom have other coaching or supervision roles in local school districts. In an RCT, we recommend that individuals employed as Time Change Coaches work only with treatment principals in any capacity. In other words, we recommend against a model in
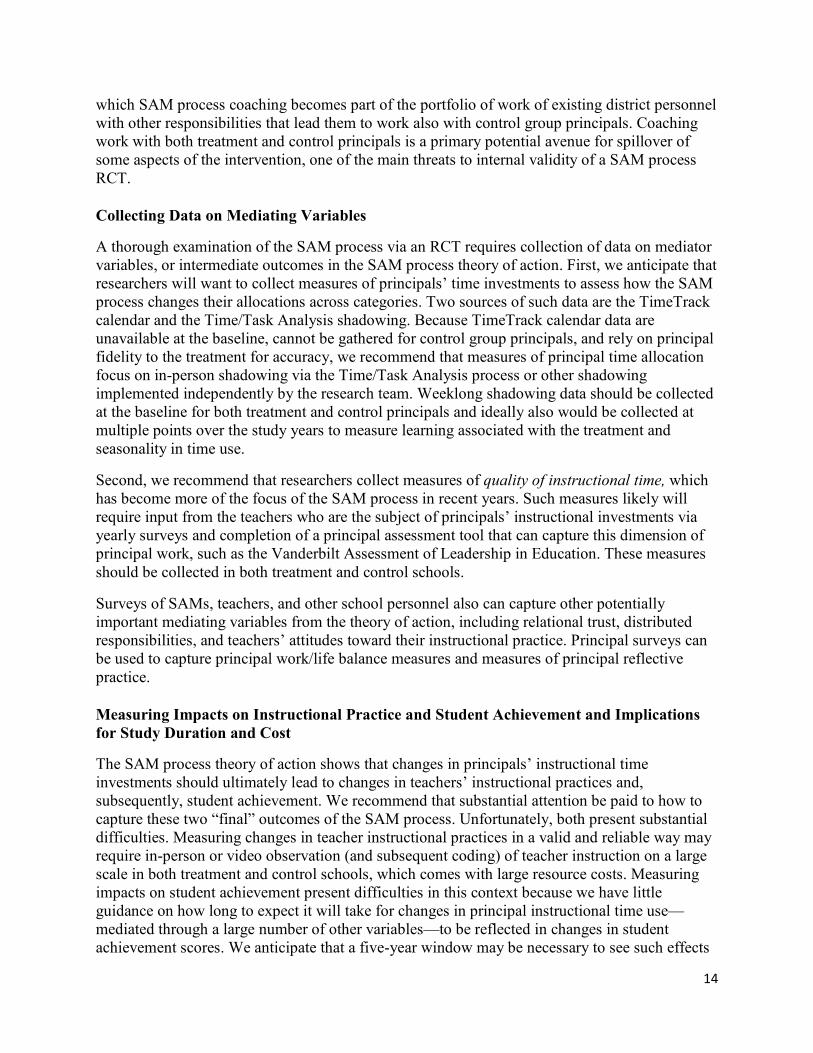
14
which SAM process coaching becomes part of the portfolio of work of existing district personnel with other responsibilities that lead them to work also with control group principals. Coaching work with both treatment and control principals is a primary potential avenue for spillover of some aspects of the intervention, one of the main threats to internal validity of a SAM process RCT.
Collecting Data on Mediating Variables
A thorough examination of the SAM process via an RCT requires collection of data on mediator variables, or intermediate outcomes in the SAM process theory of action. First, we anticipate that researchers will want to collect measures of principals’ time investments to assess how the SAM process changes their allocations across categories. Two sources of such data are the TimeTrack calendar and the Time/Task Analysis shadowing. Because TimeTrack calendar data are unavailable at the baseline, cannot be gathered for control group principals, and rely on principal fidelity to the treatment for accuracy, we recommend that measures of principal time allocation focus on in-person shadowing via the Time/Task Analysis process or other shadowing implemented independently by the research team. Weeklong shadowing data should be collected at the baseline for both treatment and control principals and ideally also would be collected at multiple points over the study years to measure learning associated with the treatment and seasonality in time use.
Second, we recommend that researchers collect measures of quality of instructional time, which has become more of the focus of the SAM process in recent years. Such measures likely will require input from the teachers who are the subject of principals’ instructional investments via yearly surveys and completion of a principal assessment tool that can capture this dimension of principal work, such as the Vanderbilt Assessment of Leadership in Education. These measures should be collected in both treatment and control schools.
Surveys of SAMs, teachers, and other school personnel also can capture other potentially important mediating variables from the theory of action, including relational trust, distributed responsibilities, and teachers’ attitudes toward their instructional practice. Principal surveys can be used to capture principal work/life balance measures and measures of principal reflective practice.
Measuring Impacts on Instructional Practice and Student Achievement and Implications for Study Duration and Cost
The SAM process theory of action shows that changes in principals’ instructional time investments should ultimately lead to changes in teachers’ instructional practices and, subsequently, student achievement. We recommend that substantial attention be paid to how to capture these two “final” outcomes of the SAM process. Unfortunately, both present substantial difficulties. Measuring changes in teacher instructional practices in a valid and reliable way may require in-person or video observation (and subsequent coding) of teacher instruction on a large scale in both treatment and control schools, which comes with large resource costs. Measuring impacts on student achievement present difficulties in this context because we have little guidance on how long to expect it will take for changes in principal instructional time use—mediated through a large number of other variables—to be reflected in changes in student achievement scores. We anticipate that a five-year window may be necessary to see such effects

15
to give principals time to change their behavior, teachers to change their behavior in response, and students’ achievement to respond to an improvement in instruction.
This window has direct consequences for the duration of the study. Fortunately, descriptive evidence from both Time/Task Analysis and TimeTrack calendar data suggests that changes to principal time use as a result of participation in the SAM process likely happens quickly and may be evident even after the first year of the intervention (although getting the SAM process up and running proves a challenge in many schools, according to our survey and interview data). Given uncertainty about the time required to see impacts on instructional practice or student achievement, we recommend that schools be funded for five years of intervention, which suggests a seven-year study: one to implement the RCT design, five years of intervention, followed by one year to complete analysis and write-up of results. We note that an RCT that did not seek to assess impacts on student achievement presumably could be reduced to 2–3 years of intervention, with accompanying reductions in total study length.
NSIP provides SAM process services to schools for $12,900 in the first year. For 110 schools—one estimate provided in the section on sample sizes—this is a cost of $1,419,000 (assuming the control schools would also eventually receive SAM process services under a delayed-treatment design). Subsequent years would be lower cost; NSIP reduces its fees each year that a school participates. The total cost of delivering the SAM process in the context of an RCT would depend on these reductions and how many years control schools would be provided access.
Securing Access to Data
Access to data on SAM process implementation, fidelity, and mediating and final outcomes is essential to success of an RCT. Collection of survey, interview, and administrative data for both treatment and control schools for the duration of the study likely will be required in any RCT design. In the present study, securing access to relevant data was hampered by the relatively low numbers of principals who provided consent to NSIP to release their data or to allow NSIP to provide the research team with their contact information for surveys or interviews. Based on this experience, we recommend that an evaluation study team enter into data sharing agreements with districts and schools directly, not through NSIP, to provide these data to researchers, including consenting to allow NSIP to provide internal data on participating schools to researchers (such as TimeTrack data), as a condition of participation at the outset of the study. Furthermore, we recommend that structures be put into place whereby the research team works with school districts directly to obtain data or solicit school personnel for participation, rather than working through NSIP. The research team should work directly with NSIP to obtain internal data on principals, SAMs, and others as necessary—for example, internal TimeTrack calendar data, which is likely to be valuable in capturing implementation fidelity—but again, researchers should obtain permissions from schools themselves directly as a condition of the study that will allow NSIP to provide those data.
Roles for NSIP
As provider of the SAM process (the treatment), NSIP would play an integral role in an RCT. We suggest that the research study team recruit more districts than needed initially that meet research study criteria (i.e., number of schools for random assignment, not a district with current SAMs), and then that the study team would work with NSIP. NSIP’s role would begin with
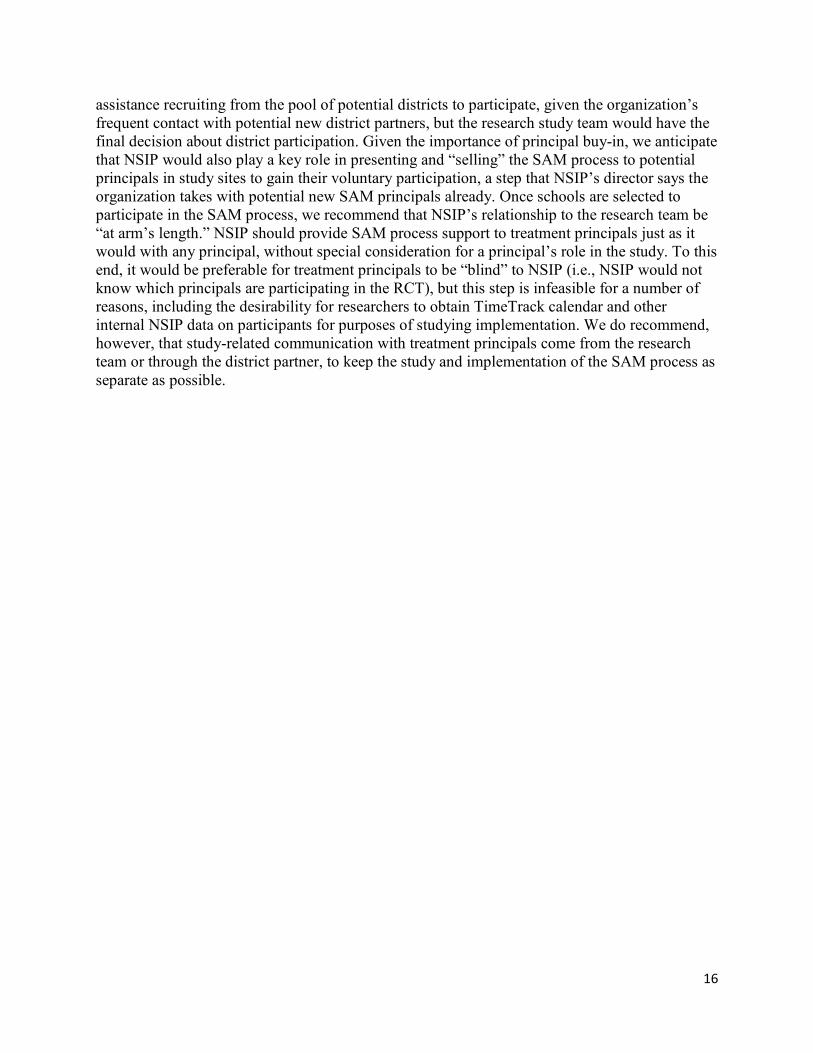
16
assistance recruiting from the pool of potential districts to participate, given the organization’s frequent contact with potential new district partners, but the research study team would have the final decision about district participation. Given the importance of principal buy-in, we anticipate that NSIP would also play a key role in presenting and “selling” the SAM process to potential principals in study sites to gain their voluntary participation, a step that NSIP’s director says the organization takes with potential new SAM principals already. Once schools are selected to participate in the SAM process, we recommend that NSIP’s relationship to the research team be “at arm’s length.” NSIP should provide SAM process support to treatment principals just as it would with any principal, without special consideration for a principal’s role in the study. To this end, it would be preferable for treatment principals to be “blind” to NSIP (i.e., NSIP would not know which principals are participating in the RCT), but this step is infeasible for a number of reasons, including the desirability for researchers to obtain TimeTrack calendar and other internal NSIP data on participants for purposes of studying implementation. We do recommend, however, that study-related communication with treatment principals come from the research team or through the district partner, to keep the study and implementation of the SAM process as separate as possible.

17
References Berman, P., & McLaughlin, M. W. (1978). Federal programs supporting educational change,
vol. VIII: Implementing and sustaining innovations. Santa Monica, CA. Dong, N., & Maynard, R. (2013). PowerUp!: A tool for calculating minimum detectable effect
sizes and minimum required sample sizes for experimental and quasi-experimental design studies. Journal of Research on Educational Effectiveness, 6(1), 24–67.
Goldring, E., & Preston, C. & Huff, J. (2012). Conceptualizing and evaluating professional
development for school leaders. Planning and Change, 43(3), 1-13. Grissom, J. A., Loeb, S., & Master, B. (2013). Effective instructional time use for school leaders:
Longitudinal evidence from observations of principals. Educational Researcher, 42(8), 433–444.
Grogan, M., & Andrews, R. (2002). Defining preparation and professional development for the
future. Educational Administration Quarterly, 38(2), 233–256. Kubisch, L. B. Schorr, & C. H. Weiss (Eds.), New Approaches to Evaluating Community
Initiatives Volume 1: Concepts, Methods, and Contexts (pp. 65–94). Washington, DC: The Aspen Institute.
O’Donnell, C. L. (2008). Defining, conceptualizing, and measuring fidelity of implementation
and its relationship to outcomes in K-12 curriculum intervention research. Review of Educational Research, 78(1), 33–84.
Porter, A. C. (1997). Comparative experiments in educational research. In R. Jaeger
(Ed.), Complementary methods for research in education (second edition) (pp. 523–551). Washington, DC: American Educational Research Association. (Revised chapter and reading from 1988 edition.)
Porter, A. C., Polikoff, M. S., Goldring, E., Murphy, J., Elliott, S. N., & May, H. (2010).
Investigating the validity and reliability of the Vanderbilt Assessment of Leadership in Education. Elementary School Journal, 111, 282–313.
Turnbull, B.J. Arcaira, E. & Sinclair, B. (2011). Implementation of the National SAM Innovation
Project: A Comparison of Project Designs. Washington, DC: Policy Studies Associates, Inc.
Turnbull, B. J., Haslam, M. B., Arcaira, E. R., Riley, D. L., Sinclair, B., & Coleman, S. (2009).
Evaluation of the school administrator manager project. Washington, DC: Policy Studies Associates, Inc.

18
Turnbull, B.J. White, R.N., & Arcaira, E.R. (2010). Achievement Trends in Schools With School Administration Managers. Washington, DC: Policy Studies Associates, Inc.
Weiss, C. H. (1995). Nothing as practical as good theory: Exploring theory-based evaluation for comprehensive community initiatives for children and families. In J. P. Connell, A. C. Kubisch, L. B. Schorr, & C. H. Weiss (Eds.), New Approaches to Evaluating Community Initiatives Volume 1: Concepts, Methods, and Contexts (pp. 65–94). Washington, DC: The Aspen Institute.

19

ABOUT THE WALLACE FOUNDATIONThe Wallace Foundation is a national philanthropy that seeks to improve education and enrichment for disadvantaged children and foster the vitality of the arts for everyone. The foundation works with partners to develop credible, practical insights that can help solve important, public problems.
Wallace has five major initiatives under way:
� School leadership: Strengthening education leadership to improve student achievement.
� After-school: Helping cities make good after-school programs available to many more children, including strengthening the financial management capacity of after-school providers.
� Building audiences for the arts: Developing effective approaches for expanding audiences so that many more people might enjoy the benefits of the arts.
� Arts education: Expanding arts learning opportunities for children and teens. Summer and expanded learning time: Better understanding the impact of high-quality summer learning programs on disadvantaged children, and how to enrich and expand the school day.
� Summer and expanded learning time: Better understanding the impact of high-quality summer learning programs on disadvantaged children, and how to enrich and expand the school day.

APPENDICES
Ellen Goldring, Jason A. Grissom, Christine M. Neumerski
Joseph Murphy, Richard Blissett V A N D E R B I L T U N I V E R S I T Y
Andy Porter U N I V E R S I T Y O F P E N N S Y L V A N I A
Making Time for Instructional Leadership
Copyright © 2015 Published by The Wallace Foundation All rights reserved
This study was commissioned by The Wallace Foundation. It was conducted by researchers at Vanderbilt University and the University of Pennsylvania. The contents expressed in this report are those of the authors and do not necessarily represent the views of the sponsor.
Cover photo: vgajic Front and back cover design: José Moreno
Acknowledgement
The support and valuable contributions of several individuals and organizations were essential to this study. We thank Mark Shellinger, Director, National SAM Innovation Project, for his ongoing engagement and valuable feedback throughout this project. Jim Mercer at NSIP assisted us with survey implementation and was consistently helpful with our numerous data questions. Other staff from NSIP gave generously of their time and provided crucial insights. We thank the participants in this study who welcomed the researchers into their schools and districts, and shared their experiences and expertise through interviews and surveys. Mollie Rubin and Laura Rogers provided valuable research support.

1
MAKING TIME FOR INSTRUCTIONAL LEADERSHIP
APPENDICES
Ellen Goldring
Jason A. Grissom Christine M. Neumerski
Joseph Murphy Richard Blissett
Vanderbilt University
Andy Porter University of Pennsylvania
2
Table of Contents Appendix A: The Study Methodology ............................................................................................ 3
Appendix B: Sam Process Job Descriptions Provided By Nsip ..................................................... 7
Appendix C: Team Performance Rubric ....................................................................................... 10
Appendix D: Annotated Bibliography .......................................................................................... 11
Appendix E: Interview Analysis Of Sam Process—Time Change Coaches and Implementation Specialists ........................................................................................................... 16
Appendix F: Principal And Sam Survey Results .......................................................................... 27
Appendix G: Sam Team Implementation ..................................................................................... 38
Appendix H: Landscape Analysis Of Sam Process Shadowing And Calendar Data ................... 39
Appendix I: Interview Protocols ................................................................................................... 60
Policy Studies Associates (PSA) Evaluators Focus Group ....................................................... 60
NSIP Director ............................................................................................................................ 61
NSIP Implementation Specialist ............................................................................................... 64
NSIP Data Processing Specialist ............................................................................................... 67
Time Change Coach .................................................................................................................. 69
Case School Principals .............................................................................................................. 71
Case School Sams ..................................................................................................................... 74
Case School First Responders ................................................................................................... 76
Case District Officials ............................................................................................................... 78
Appendix J: Principal And Sam Surveys And Survey Solicitations ............................................. 81
Principal Survey Of Sam Process ............................................................................................. 83
Sam Survey Of Sam Process ..................................................................................................... 92
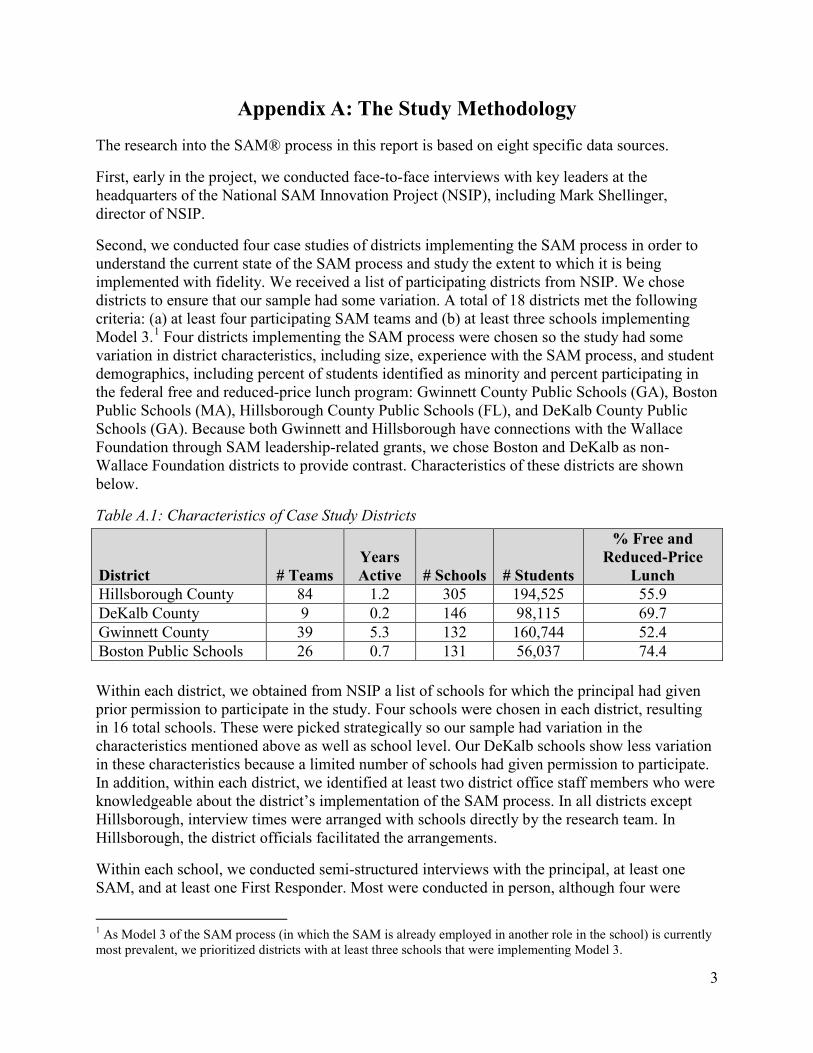
3
Appendix A: The Study Methodology The research into the SAM® process in this report is based on eight specific data sources.
First, early in the project, we conducted face-to-face interviews with key leaders at the headquarters of the National SAM Innovation Project (NSIP), including Mark Shellinger, director of NSIP.
Second, we conducted four case studies of districts implementing the SAM process in order to understand the current state of the SAM process and study the extent to which it is being implemented with fidelity. We received a list of participating districts from NSIP. We chose districts to ensure that our sample had some variation. A total of 18 districts met the following criteria: (a) at least four participating SAM teams and (b) at least three schools implementing Model 3.1 Four districts implementing the SAM process were chosen so the study had some variation in district characteristics, including size, experience with the SAM process, and student demographics, including percent of students identified as minority and percent participating in the federal free and reduced-price lunch program: Gwinnett County Public Schools (GA), Boston Public Schools (MA), Hillsborough County Public Schools (FL), and DeKalb County Public Schools (GA). Because both Gwinnett and Hillsborough have connections with the Wallace Foundation through SAM leadership-related grants, we chose Boston and DeKalb as non-Wallace Foundation districts to provide contrast. Characteristics of these districts are shown below.
Table A.1: Characteristics of Case Study Districts
District # Teams Years Active # Schools # Students
% Free and Reduced-Price
Lunch Hillsborough County 84 1.2 305 194,525 55.9 DeKalb County 9 0.2 146 98,115 69.7 Gwinnett County 39 5.3 132 160,744 52.4 Boston Public Schools 26 0.7 131 56,037 74.4 Within each district, we obtained from NSIP a list of schools for which the principal had given prior permission to participate in the study. Four schools were chosen in each district, resulting in 16 total schools. These were picked strategically so our sample had variation in the characteristics mentioned above as well as school level. Our DeKalb schools show less variation in these characteristics because a limited number of schools had given permission to participate. In addition, within each district, we identified at least two district office staff members who were knowledgeable about the district’s implementation of the SAM process. In all districts except Hillsborough, interview times were arranged with schools directly by the research team. In Hillsborough, the district officials facilitated the arrangements.
Within each school, we conducted semi-structured interviews with the principal, at least one SAM, and at least one First Responder. Most were conducted in person, although four were
1 As Model 3 of the SAM process (in which the SAM is already employed in another role in the school) is currently most prevalent, we prioritized districts with at least three schools that were implementing Model 3.
4
conducted over the phone because of scheduling conflicts. Semi-structured interviews also were conducted with district office personnel, and, in Hillsborough, with district coaches. Circumstances in the districts led to some minor deviations to this. Two schools in DeKalb were going through a transition period with either their SAMs or primary First Responders, and thus had no one in those positions for us to interview. At the district level we found variance in the roles of officials, including some who were involved with their own SAM teams.
Interview protocols were developed to examine the perspective of principals, SAMs, First Responders, and district personnel around a variety of issues: how and why principals chose to participate in the SAM process, the benefits and challenges they experienced through participation, and the variation or consistency in implementation of the process across schools. Interviews were audio recorded and transcribed. Researchers coded interviews for themes and patterns both within and across schools in each district, as well as across all four districts. (See Appendix J and E for case study interview protocols and complete case study reports.)
The third data source was interviews of Time Change Coaches and Implementation Specialists conducted at the annual national SAM conference in the winter of 2014 in San Diego. Interviewees were selected by Mark Shellinger, director of NSIP, to meet the following criteria: (1) they included a sample of coaches and Implementation Specialists working in three of the case study districts (Boston, Hillsborough, and Gwinnett) and another district initially considered for participation (Buffalo [NY] Public Schools);2 (2) they were not new to their role as Time Change Coaches or Implementation Specialists and therefore could provide a broad perspective on the SAM process; and (3) they were at the SAM conference and could be interviewed in person. Three participants were Implementation Specialists, three were coaches, and five worked as both coaches and Implementation Specialists. One person was a district leader who worked on school turnaround and was highly involved with the SAM process at the district level; she was included in the sample because of her deep knowledge of the process in her district.
Two researchers conducted the semi-structured interviews, which ranged from 45 minutes to an hour in length. Interview protocols were designed to capture the following: coaches’ and Implementation Specialists’ understanding of their roles and of the essential components of the SAM process; their perspective on how the process has evolved and changed over time; their views on the benefits and challenges of the SAM process; their perspective on district involvement; and the degree to which there was adaptation of or fidelity to the SAM process within and across districts. (See Appendix J for interview protocols.)
All interviews were audio recorded and transcribed. We coded interviews for themes, identifying patterns across participants, as well as patterns that emerged within specific roles or districts. We also used principal, SAM, First Responder, and district staff interviews in each of the four case study sites to enhance our understanding of the contexts in which the Time Change Coaches and Implementation Specialists worked.
Fourth, we obtained and analyzed Time/Task Analysis® and TimeTrack® calendar data covering August 1, 2013, to June 15, 2014. NSIP provided the data, which came in three table types: (1) descriptive characteristics of program participants; (2) data from individuals’
2 Buffalo was later dropped as a case study site after researchers were unable to secure sufficient responses to interview requests.

5
TimeTrack calendars; and (3) data from individuals’ shadowing periods, the Time/Task Analysis data.
Time/Task Analysis data originate when a NSIP designee observes the principal for several days as the school inaugurates the SAM process to obtain a baseline measure of time allocation. Observers manually code whether time at any particular moment is spent on instructional, managerial, or personal items. Program participants are then shadowed again annually to gather data for comparison to the baseline collection. In contrast, the TimeTrack calendar is a core, daily component of SAM implementation and functions as a computer-based tool for principals and supporting teams to track the principal’s time expenditure. For both the Time/Task shadowing and TimeTrack calendar data, the information we received was generally at the person-day level, meaning that a row of data would include one day’s worth of data for an individual, reported as the percent of time he or she spent on various categories of activities as per SAM process definitions.
All files are linked via calendar IDs, which are consistent across files for a given participant. The data in this report cover 373 administrators involved in the SAM process, representing 78% of the 481 total participating SAM teams.3 Approximately 33% of the data has been de-identified, meaning that the administrator and school name have been replaced with “Administrator ###” and “School ###,” respectively.4
Fifth, online surveys were administered to all current principals and participating SAMs in fall 2014 over three weeks in late November and early December 2014. The Vanderbilt team developed survey instruments for principals and SAMs with feedback from NSIP and piloted the surveys with a small group of SAM principals. (See Appendix K for the surveys and email participation invitations.) The survey was conducted anonymously using SurveyMonkey, with links distributed to principals and SAMs directly by NSIP. To discourage bias in responses, both a pre-solicitation e-mail and the e-mails and reminders containing the survey links underscored that responses were anonymous and would be viewed only by Vanderbilt researchers. Among the 720 active SAM principals contacted, survey responses were received from 388, for a response rate of 54%. The response rate from SAMs was lower, with 382 of a possible 982 SAMs responding, or 39%.
Sixth, a member of our research team interviewed key researchers from Policy Studies Associates (PSA) who were directly involved in the previous evaluations of the SAM process. The interviews were conducted in Washington, DC, at the PSA offices, in a focus group format with four researchers. The objective of the focus group was to improve our understanding of the context and earlier findings, further explicate our interpretation of PSA's earlier findings, identify changes in the SAM process, and gain insights into the challenges of evaluating SAM implementation and impact, including data availability and completeness, attrition and turnover of SAM principals and staff, and other potential insights for a future randomized controlled trial (RCT) in this area. (See Appendix J for focus group protocol.)
3 Total numbers from NSIP as of January 9, 2013. 4 Principals were given the option of having their data deidentified before it was provided to the research team. In comparing trajectories of time use across de-identified and identified participants, the patterns were not different enough to cause concern that there are significant differences in SAM participation between these different groups. Trajectories in instructional time across time for these groups are shown in Appendix I of this report.

6
Seventh, we carefully reviewed documents and reports specifically related to the SAM process. We reviewed the earlier PSA evaluation reports of the SAM process and developed memos regarding each of those reports. In addition, we reviewed various artifacts and documents received directly from NSIP, such as job descriptions, implementation rubrics, and support guides.
Lastly, we reviewed the literature on the importance of principals’ instructional leadership roles for school effectiveness and the prevailing explanation for why it has been so difficult to move principals toward instructional leadership. We reviewed selected recent quantitative empirical studies measuring principals’ time allocation to instructional leadership tasks, as well as interventions in the literature aimed at increasing principals’ instructional leadership.
It is important to note that all data collection was coordinated through NSIP. Before we could collect data from SAM principals and their SAMs, NSIP required that potential subjects consent both to NSIP releasing their individual data (e.g., TimeTrack calendar data) and to being contacted for research purposes (e.g., for an interview). NSIP did not have an existing research consent process in place at the beginning of this project, so they deployed a consent form through the system that provides the TimeTrack calendar. They instructed Time Change Coaches to work with principals to fill out the consent form. This process took place primarily in November 2013.
NSIP provided the following three statements to principals for their consent:
1. I give NSIP permission to share Time/Task Analysis, shadowing, and TimeTrack data from my school with researchers approved by NSIP, as long as my school staff and I are not identified, with the understanding that researchers will maintain the confidentiality of the data, will use the data only for research purposes, and will report any analysis of the data in aggregate form only.
2. I also give NSIP permission to provide the name of my school with my data. I understand that researchers will maintain the confidentiality of the data, will use the data only for research purposes, and will report any analysis of the data in aggregate form only.
3. I give NSIP permission to share my e-mail address with researchers approved by NSIP for the purpose of making requests for interviews or participation in surveys concerning my experience in the SAM process.
Note that these statements are not specific to the present study.
In January 2014, NSIP reported to us that 87% of principals had consented to at least one of the above statements. Eighty-five percent consented to statement 1, allowing NSIP to release Time/Task Analysis and TimeTrack data to us, but only 60% allowed their school name to be associated with those data, and only 58% consented to have their contact information shared for purposes of interviewing or surveying.
The relatively low rate of consent to statement 3 affected both the selection of case study principals and the approach to the surveys. For case study selection, NSIP provided us with lists of schools in each of the selected districts whose principals had consented to be contacted along with enough additional information to calculate overall consent rates for statement 3. These rates
7
were 70% in Boston, 28% in DeKalb, 74% in Gwinnett, and 46% in Hillsborough. For the surveys, the inability to contact approximately 42% of SAM principals made conducting an external survey inadvisable. Moreover, NSIP did not have a process in place to obtain consent from SAMs to be contacted and thus was not able to provide us with contact information for any SAMs for a SAM survey. Instead, NSIP offered to facilitate anonymous surveys of both principals and SAMs for the research team internally (not just those who had provided permissions); that is, the research team provided NSIP with the survey questions for each survey, which were programmed by NSIP into SurveyMonkey and sent out by NSIP staff. Because this approach did not require supplying principal or SAM contact information (or other information about the schools) to the research team, all principals and SAMs could be contacted. Thus the sampling frames for the two surveys were all currently active principals and SAMs as of the release of the survey in November 2014.
Comparing the characteristics of the principals and schools in the TimeTrack data and the survey data, we find that our samples are generally consistent with data received from NSIP in January 2015 concerning the characteristics of their participants, including school levels, years of experience with the SAM process, school enrollment, and percentage of students in their schools participating in free and reduced-price lunch. TimeTrack data were somewhat overrepresented in elementary schools, and survey data were somewhat underrepresented in principals newer to the SAM process.
We address the implication of these processes for a potential RCT in the last section of the report.
We integrate information across these multiple data sources to inform each of the study topics. In addition, more detailed analyses of individual data sources are presented in separate reports in the appendices. These separate analyses inform the summary report. Specifically the appendices include an analysis of the interviews with SAM Time Change Coaches and Implementation Specialists, four individual case study reports, an analysis of TimeTrack calendar data, an analysis of survey data, and a review of memos from PSA evaluation reports.
Appendix B: SAM Process Job Descriptions provided by NSIP
TIME/TASK ANALYSIS DATA COLLECTOR (TTADC)
Time/Task Analysis® Data collectors are charged with collecting time use data. They “shadow” participating school leaders taking data every five minutes from the time the leader arrives at work until he/she leaves at the end of the day following an explicit protocol and ethics contract.
8
Qualifications:
• background check • recommendation from district or National SAM Innovation Project (NSIP) leader • experience as a school leader • successful completion of TTADC training • passing score, TTADC initial test • passing score, online TTADC test prior to each collection • compliance with collection protocol and NSIP ethics contract
TIME CHANGE COACH
Time Change Coaches (TCCs) are tasked with supporting and developing SAM teams. TCCs meet, at a minimum, once each month with the team at the school or office site for one-half day. TCCs review, at a minimum, each leader’s TimeTrack® record once each week and provide feedback.
TCCs use the SAM® Team Performance Rubric, Coaching Guide, and SAM Ethics Contract when working with teams and employ a facilitative coaching approach designed to build reflective practice skills and successful use of TimeTrack, NoteTrack, SAM Daily Meeting, SAM Communications Protocol, and First Responders.
Qualifications:
• background check • recommendation from district or NSIP leader • experience as a school leader • successful record as a Time/Task Analysis Data Collector • successful completion of initial TCC training • participation in three annual in-person professional development training sessions • participation in five annual online professional development training sessions • successful SAM team development • compliance with TCC protocols and NSIP ethics contract
IMPLEMENTATION SPECIALIST
SAM Implementation Specialists are charged with developing a SAM team’s initial practice using the SAM Team Performance Rubric. Specialists work with SAM teams daily, usually for two to three weeks, to develop basic skills and practices necessary to make TimeTrack, NoteTrack, SAM Daily Meeting, First Responders, and SAM Communications Protocol part of the team’s regular work day. Once the team has achieved the third level of the performance rubric it is transferred to a Time Change Coach.
Specialists use both facilitative and instructional coaching approaches when working with a team and follow the NSIP ethics contract.
Qualifications:

9
• background check • recommendation from district or NSIP leader • experience as a school leader • successful record as a Time/Task Analysis Data Collector • successful completion of initial TCC training • successful record as a TCC • successful completion of initial Specialist training • participation in three annual in-person professional development training sessions • participation in five annual online professional development training sessions • successful SAM team development • compliance with specialist protocols and NSIP ethics contract

10
Appendix C: Team Performance Rubric

11
Appendix D: Annotated Bibliography Goldring, E., Huff, J., May, H., & Camburn, E. (2008). School context and individual
characteristics: what influences principal practice?. Journal of Educational Administration, 46(3), 332-352.
Method: Cluster analysis of time use Instrument: End-of-day (EOD) activity web log Additional instruments: Principal survey (individual attributes, knowledge); teacher survey (student engagement, academic press); Common Core of Data (CCD) (school demographics) Number of participants: 46 Frequency/duration of measurement: Once daily recording of hourly allocation for six consecutive school days stretched over two weeks, one round only Definition of instructional leadership: "monitoring/observing instruction, school restructuring or reform, supporting teachers’ professional development, analyzing student data or work, modeling instructional practices, teaching a class" Average percent of time allocated to instructional leadership: 20.4% (eight hours/week) School level: E, M, H (within one district) Synopsis: Leadership style and proportion of time principals allocate to activities relates to school context. Three clusters of leadership styles identified: eclectic principals (split time evenly over a range of activities); instructional leaders (average 13 hours/ week on instructional leadership IL)); and student-centered leaders (average 20 hours/week on student activities). Student-centered and instructional principals more likely to work in disadvantaged schools than eclectic principals. Leadership styles are unrelated to personal attributes. Grissom, J. A., Loeb, S., & Master, B. (2013). Effective Instructional Time Use for School
Leaders Longitudinal Evidence From Observations of Principals. Educational Researcher, 42(8), 433-444.
Method: Multivariate analysis of time use and student achievement growth Instrument: Direct observations Additional instruments: Interviews: (principal's definition and description of instructional leadership); surveys (description of classroom observations) Number of participants: 125 (observations); 314/306 (surveys) Frequency/duration of measurement: five-minute intervals for one day each spring over three years (2008, 2011, 2012) Definition of instructional leadership: Use Murphy's (1988) definition: "the class of leadership functions that support classroom teaching and student learning." Average percent of time allocated to instructional leadership: 12.7% School level: E, M, H (within one district) Synopsis: Overall instructional time use does not have a significant relationship with student achievement growth. When tasks are disaggregated, teacher coaching and evaluating does correlate with math achievement growth. Classroom walkthroughs were negatively associated with growth, possibly because principals’ conceptions of their purpose varied.

12
Horng, E. L., Klasik, D., & Loeb, S. (2010). Principal's time use and school effectiveness. American Journal of Education, 116(4), 491-523.
Method: Regression analysis of time use and school outcomes in multivariate framework Instrument: Time use observation coded into 43 tasks across six categories Additional instruments: Florida accountability grade (student achievement); teacher survey (teacher assessments of school, teacher satisfaction); parent survey (parent assessment of school) Number of participants: 65 Frequency/duration of measurement: five-minute intervals for one day, all observations done over one week in April 2008 Definition of instructional leadership: No specific reference to "instructional leadership"; most closely falls under "day-to-day instruction" (informally coaching teachers to improve instruction, formally evaluating teachers, conducting classrooms observations, implementing required professional development (PD), using data to inform instruction, teaching students) and "instructional program" (developing educational program across school, evaluating curriculum, using assessment results for program evaluation and development, planning PD for teachers, planning PD for prospective principals, releasing or counseling out teachers, planning/directing supplementary instruction, utilizing school meetings); authors later expand definition to "broadly" include organizational management. Average percent of time allocated to instructional leadership: 13% (6% day-to-day instruction, 7% instructional program); if organizational leadership is added, 33% School level: E, M, H (within one district) Synopsis: Across the sample, principals allocated most of their time to administrative tasks (close to 30%) and organizational management (20%). Organizational management correlates with high school outcomes, while time spent on day-to-day instruction and instructional program tasks was not statistically related to school performance and negatively associated with teacher and parent perceptions of climate. However, principals in higher-graded schools spent a larger proportion of time on day-to-day instruction compared to peers. Lee, M., & Hallinger, P. (2012). National contexts influencing principals' time use and
allocation: economic development, societal culture, and educational system. School Effectiveness and School Improvement, 23(4), 461-482.
Method: Correlational analysis of principal time use and macrolevel context (using secondary dataset) Instrument: Principal questionnaire (total time use, allocation) Additional instruments: school questionnaire (resource availability, home-school involvement, student populations, school socioeconomic status, school safety); purchasing power parity (economic development), power distance index (societal culture), curriculum policies (standardization of education) Number of participants: 5,297 principals from 34 societies in 28 countries Frequency/duration of measurement: One round of data based on principals' answers in PIRLS 2006 school questionnaire Definition of instructional leadership: Not defined in article, but co-author Hallinger has previously defined it (Hallinger & Murphy 1985) as: "defining the school's mission, managing the instructional program, and promoting a positive school learning climate".
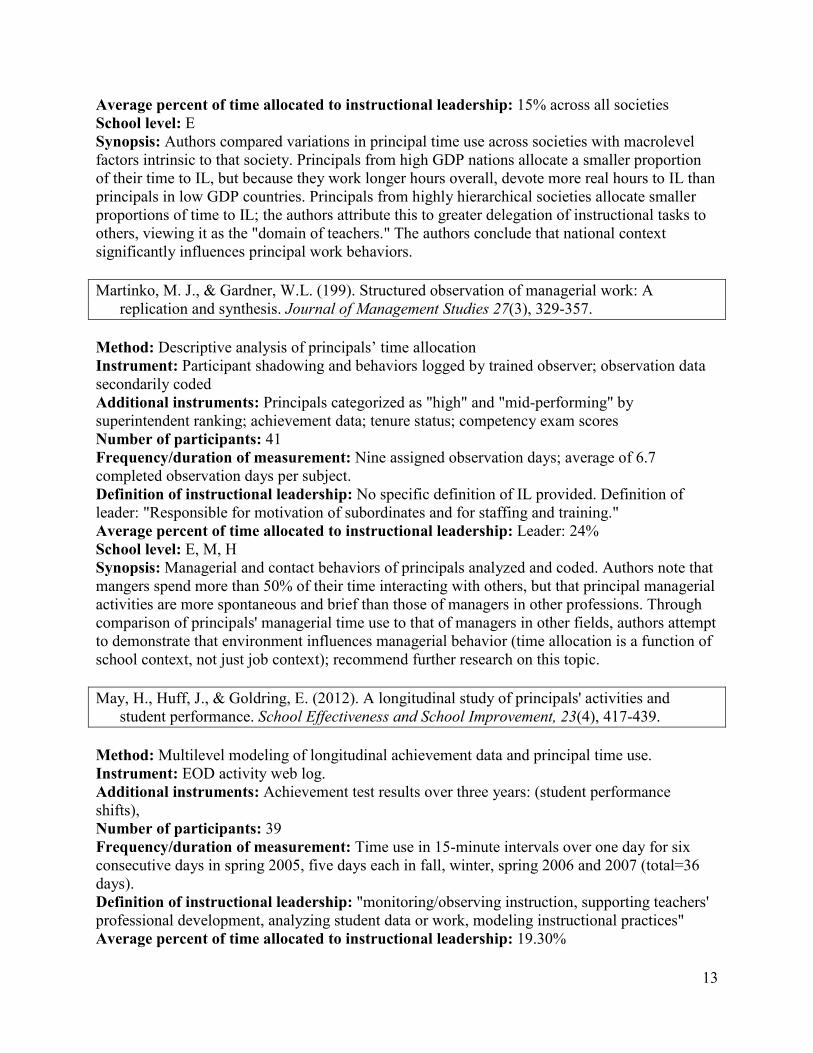
13
Average percent of time allocated to instructional leadership: 15% across all societies School level: E Synopsis: Authors compared variations in principal time use across societies with macrolevel factors intrinsic to that society. Principals from high GDP nations allocate a smaller proportion of their time to IL, but because they work longer hours overall, devote more real hours to IL than principals in low GDP countries. Principals from highly hierarchical societies allocate smaller proportions of time to IL; the authors attribute this to greater delegation of instructional tasks to others, viewing it as the "domain of teachers." The authors conclude that national context significantly influences principal work behaviors. Martinko, M. J., & Gardner, W.L. (199). Structured observation of managerial work: A
replication and synthesis. Journal of Management Studies 27(3), 329-357. Method: Descriptive analysis of principals’ time allocation Instrument: Participant shadowing and behaviors logged by trained observer; observation data secondarily coded Additional instruments: Principals categorized as "high" and "mid-performing" by superintendent ranking; achievement data; tenure status; competency exam scores Number of participants: 41 Frequency/duration of measurement: Nine assigned observation days; average of 6.7 completed observation days per subject. Definition of instructional leadership: No specific definition of IL provided. Definition of leader: "Responsible for motivation of subordinates and for staffing and training." Average percent of time allocated to instructional leadership: Leader: 24% School level: E, M, H Synopsis: Managerial and contact behaviors of principals analyzed and coded. Authors note that mangers spend more than 50% of their time interacting with others, but that principal managerial activities are more spontaneous and brief than those of managers in other professions. Through comparison of principals' managerial time use to that of managers in other fields, authors attempt to demonstrate that environment influences managerial behavior (time allocation is a function of school context, not just job context); recommend further research on this topic. May, H., Huff, J., & Goldring, E. (2012). A longitudinal study of principals' activities and
student performance. School Effectiveness and School Improvement, 23(4), 417-439. Method: Multilevel modeling of longitudinal achievement data and principal time use. Instrument: EOD activity web log. Additional instruments: Achievement test results over three years: (student performance shifts), Number of participants: 39 Frequency/duration of measurement: Time use in 15-minute intervals over one day for six consecutive days in spring 2005, five days each in fall, winter, spring 2006 and 2007 (total=36 days). Definition of instructional leadership: "monitoring/observing instruction, supporting teachers' professional development, analyzing student data or work, modeling instructional practices" Average percent of time allocated to instructional leadership: 19.30%
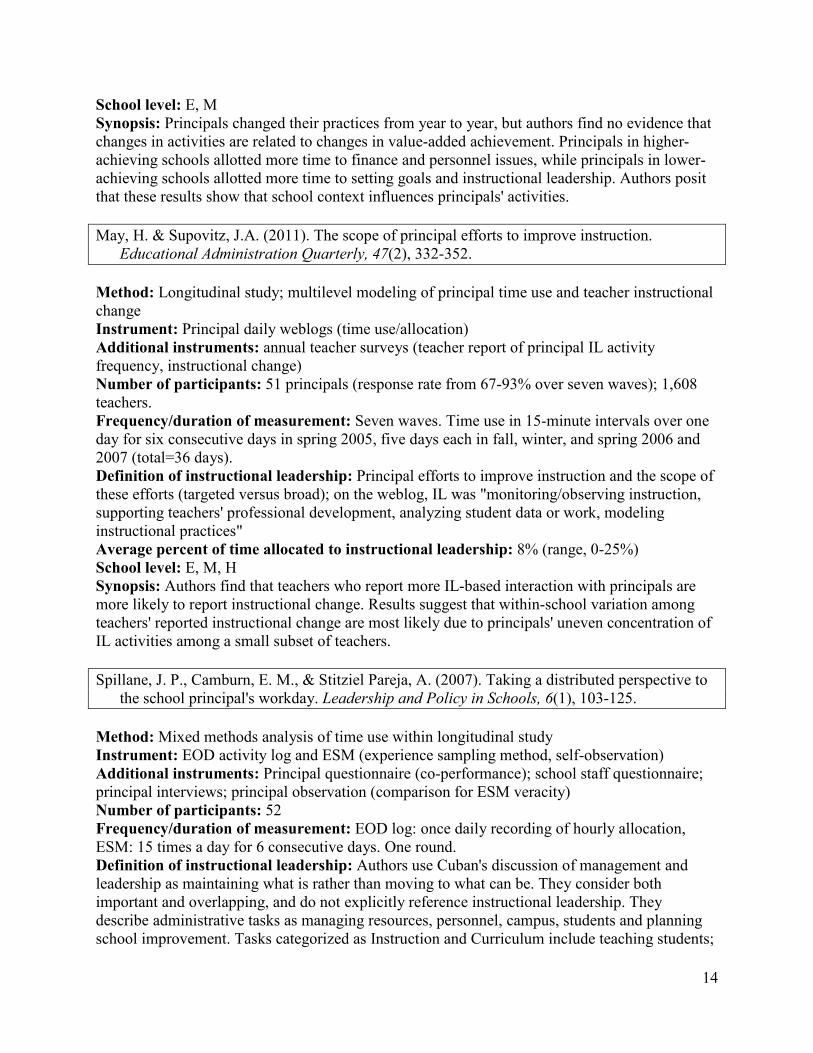
14
School level: E, M Synopsis: Principals changed their practices from year to year, but authors find no evidence that changes in activities are related to changes in value-added achievement. Principals in higher-achieving schools allotted more time to finance and personnel issues, while principals in lower-achieving schools allotted more time to setting goals and instructional leadership. Authors posit that these results show that school context influences principals' activities. May, H. & Supovitz, J.A. (2011). The scope of principal efforts to improve instruction.
Educational Administration Quarterly, 47(2), 332-352. Method: Longitudinal study; multilevel modeling of principal time use and teacher instructional change Instrument: Principal daily weblogs (time use/allocation) Additional instruments: annual teacher surveys (teacher report of principal IL activity frequency, instructional change) Number of participants: 51 principals (response rate from 67-93% over seven waves); 1,608 teachers. Frequency/duration of measurement: Seven waves. Time use in 15-minute intervals over one day for six consecutive days in spring 2005, five days each in fall, winter, and spring 2006 and 2007 (total=36 days). Definition of instructional leadership: Principal efforts to improve instruction and the scope of these efforts (targeted versus broad); on the weblog, IL was "monitoring/observing instruction, supporting teachers' professional development, analyzing student data or work, modeling instructional practices" Average percent of time allocated to instructional leadership: 8% (range, 0-25%) School level: E, M, H Synopsis: Authors find that teachers who report more IL-based interaction with principals are more likely to report instructional change. Results suggest that within-school variation among teachers' reported instructional change are most likely due to principals' uneven concentration of IL activities among a small subset of teachers. Spillane, J. P., Camburn, E. M., & Stitziel Pareja, A. (2007). Taking a distributed perspective to
the school principal's workday. Leadership and Policy in Schools, 6(1), 103-125. Method: Mixed methods analysis of time use within longitudinal study Instrument: EOD activity log and ESM (experience sampling method, self-observation) Additional instruments: Principal questionnaire (co-performance); school staff questionnaire; principal interviews; principal observation (comparison for ESM veracity) Number of participants: 52 Frequency/duration of measurement: EOD log: once daily recording of hourly allocation, ESM: 15 times a day for 6 consecutive days. One round. Definition of instructional leadership: Authors use Cuban's discussion of management and leadership as maintaining what is rather than moving to what can be. They consider both important and overlapping, and do not explicitly reference instructional leadership. They describe administrative tasks as managing resources, personnel, campus, students and planning school improvement. Tasks categorized as Instruction and Curriculum include teaching students;

15
reviewing classwork and lesson plans; observing classrooms; discussing practice and curriculum; planning PD and standardized testing; and reviewing data. Average percent of time allocated to instructional leadership: Instruction and Curriculum: 22.2%, Administrative management: 63.4% School level: E, M, H, and special schools within 1 district Synopsis: Authors found that there is a "co-performance" of leadership where principals often conduct their activities in concert with other people, often a teacher. Nearly half of all principal activities are co-performed, even when principal is leading the activity. This reaffirms the authors' prior work and hypothesis that school leadership is distributed. Principals were less likely to lead Instruction and Curriculum-related tasks (55% of the time) than administration-related tasks (77% of the time). Supovitz, J. A., & Poglinco, S. M. (2001). Instructional leadership in a standards-based reform.
ERIC Clearinghouse. Method: Descriptive analysis of frequency of instructional observation Instrument: Principal questionnaire Additional instruments: Survey (content knowledge, importance of content knowledge); interview and site visits (principals' views of instructional leadership, accountability, job priorities) Number of participants: 17 principals identified as instructional leaders out of 127 responding America’s Choice principals. Frequency/duration of measurement: One round of census data based on spring 2001 annual evaluation survey Definition of instructional leadership: The definition includes three behaviors: 1) organization of schools around an emphasis on instructional improvement supported by a distinct vision of instructional quality; 2) cultivation of a community of instructional practice in schools (collaboration, network-building); and 3) reorganization of leaders' own professional life, time, and priorities to support instructional improvement Average percent of time allocated to instructional leadership: IL-identified leaders observe instruction more frequently (88% observe classrooms every day) than the AC principals as a whole (39% observe every day) School level: E, M Synopsis: Summary as part of a series of CPRE evaluation of America's Choice school improvement program. This document focuses on principal instructional leadership - definition, principals' understanding of it, and principal behaviors.
16
Appendix E: Interview Analysis of SAM Process—Time Change Coaches and Implementation Specialists
EXECUTIVE SUMMARY
We interviewed a total of 12 Time Change Coaches and Implementation Specialists during the winter of 2014. Regardless where Time Change Coaches and Implementation Specialists worked, they were remarkably consistent in their description of the SAM process, suggesting a shared understanding of the program writ large. They shared perceptions about its strengths, the challenges encountered in implementation, the roles they are expected to play in supporting principals and SAMs®, and the ways in which the SAM® process has evolved since its inception. Other main findings include:
Time Change Coaches and Implementation Specialists were overwhelmingly positive about the SAM process and its potential impact on leadership practice, teacher practice and student achievement;
Time Change Coaches and Implementation Specialists were very clear about their role in the SAM process;
Funding and sustainability of the SAM process is a concern for some schools; Time Change Coaches found principals less engaged in the SAM process if they were forced
to participate in the program rather than join voluntarily.
These findings are detailed throughout this report.
METHODOLOGY
During the winter of 2014, two researchers interviewed Time Change Coaches (also referred as coaches throughout this report) and Implementation Specialists at the annual SAM Conference. Interviewees were selected by Mark Shellinger, director of the National SAM Innovation Project, and were chosen because they met the following criteria: (1) they worked in one of the case study districts (Boston, Hillsborough, and Gwinnett) or another district initially considered for participation (Buffalo [NY] Public Schools);5 (2) they were not new to their role as Time Change Coaches or Implementation Specialists and therefore could provide a broad perspective on the SAM process; and (3) they were attending the annual SAM conference in San Diego and could be interviewed in person. Three of the participants were Implementation Specialists, three were Time Change Coaches, and five worked in both roles. One person was a district leader who worked on school turnaround and was highly involved with the SAM process at the district level; she was included in the sample because of her deep knowledge of the process in her district.
Researchers conducted structured interviews with each participant, ranging from 45 minutes to an hour in length. Interview protocols were designed to capture the coaches’ and Implementation Specialists’ understanding of their role and of the essential components of the SAM process, their perspective on how the process has evolved and changed over time, their views on the benefits and challenges of the SAM process, their perspective on district involvement, and the 5 Buffalo was later dropped as a case study site after researchers were unable to secure sufficient responses to interview requests.

17
degree to which there was adaptation of or fidelity to the SAM process within and across districts.
All interviews were audiotaped and transcribed. We coded interviews for themes, identifying patterns across participants, as well as patterns that emerged within specific roles or districts. We also used principal, SAM, First Responder, and district staff interviews in each of the four case study sites to enhance our understanding of the contexts in which the coaches and Implementation Specialists worked.
RESULTS
Overview of the Role of Implementation Specialist (IS) and Time Change Coach
The following description of the role of the Implementation Specialist and Time Change Coach is based on Model 3 of the SAM process. This model consists of an existing school staff member (or members) that work as the SAM and who are not paid an additional stipend for this position. Instead, the SAM supports the principal around instructional time use in addition to his or her traditional duties in the school. The coaches and IS in our sample largely are currently working in the context of Model 3 schools.
Implementation Specialist
The Implementation Specialist is a relatively new role in the SAM process. It was introduced several years ago as a way to help members of the school community (principal, SAMs, staff, First Responders) understand the SAM model, implement its basic components, and begin to use it on a daily basis. This includes helping with the technical aspects of the process, such as the Time Track Calendar and Daily Meeting. To facilitate this work, Implementation Specialists are provided with a list of roughly 35 specific objectives developed by National SAM Innovation Project (NSIP) that they must complete in participating schools. In addition to this checklist, the Implementation Specialist is expected to routinely ask both principals and SAMs what else they may need to be “up and running” before the coach begins his/her work with them. The typical timeframe is for the IS to have the basic aspects of the SAM process implemented within two to three weeks, although this can vary depending on the needs of the individual school.
One Implementation Specialist explained his role as follows:
“Principals who have committed to undertaking the SAM work go through a phase of data collection…As result of that information being shared [with principals], they are then primed and ready to really begin drilling more down into the day to day work of the SAM process. My role is to go in to support them in any way I can, to make sure that the technical issues are addressed, whether it's with setting up the computers, identifying individuals who will have access to their SAM calendars, helping principals think about how they want to lay the SAM process work into their particular school based on the culture and climate.”
A critical aspect of the Implementation Specialist’s role is to use the SAM/Principal Team Performance Rubric to guide implementation. This four-point scale rubric (see Appendix C) was developed by NSIP to identify which level of the process the SAM and principal have reached:
18
beginning, developing, accomplished, or exemplary. Implementation Specialists work with schools until they reach a “Level 3” on the rubric, which indicates that they have successfully implemented the basic components of the process: the Daily Meeting, the Time Track Calendar, and the First Responder system. Accordingly, most Implementation Specialists in our sample mentioned the importance of using the rubric to determine when the school was ready to transition to the support of the coach. One offered, “... our role is really like almost turning the key over and starting the car and letting it run very smoothly. And then once it's running, you put the Time Change coach in there and they're driving it.”
Interviewees perceived the recent development of the IS role as helping to improve the quality, pace, consistency, and fidelity of implementation.
Time Change Coach
The role of the Time Change Coach has become more formalized over time, particularly with the introduction of the rubric. They begin their work once the initial “implementation” period is complete and schools have achieved at least a “3” on the rubric. Coaches are tasked with ensuring that the basic components of the SAM process are understood and utilized, as well as helping principals to think more deeply about how they use their time. The coach is expected to spend a minimum of a half day in SAM schools per month. During this visit, coaches meet with SAMs privately to determine what they may need to be effective with their principals. Coaches also meet with principals to better understand what additional support they may need, and supplement those meetings with interim e-mail and phone calls. . The coach looks at the Time Track Calendar once a week, providing feedback to the principal. NSIP provides an automated system that alerts the coach when the principal is not accessing the calendar; in turn, the coach is expected to check in with the principal to determine the additional support that he or she may need.
Coaches gave consistent descriptions of their role, with most emphasizing that they pose reflection questions to principals, rather than telling them what to do, an essential element of the job. As one explained, “The Implementation Specialist’s job is to get them up and running, to see that they’re doing it the way it’s supposed to be done. The coach then takes over with the questions and the actual thought processes of how is this working, what are you going to do with it ... bottom line, we need to make a difference in student achievement.” Coaches train SAMs to use this same type of questioning, so that the SAM is prompting the principal to reflect on time use. Importantly, the coach maintains a relationship with the SAM and principal, not reporting directly to the district; this helps build trust and confidentiality.
One coach described her role as mostly helping with the “mechanical” aspects of the SAM process for the first year and then beginning to ask deeper questions in Year 2. Another coach described the importance of tailoring her coaching to each school’s needs:
“I try to individualize my coaching to each building because they are all unique in where they are in the journey. New teams tend to need a lot more support in the technical aspects of the program like the Time Track software and…how do we get our Daily Meeting in, how do we get that scheduled, what should we be doing in our daily meeting, all of those. And then as we move forward with teams, after they’ve been in for a while, what I focus on is so now you’ve got – if you’re the principal, you have time now to be in
19
the classroom so how do you spend that time and what’s the impact of how you’re spending your time?”
In considering whether to conduct a randomized controlled trial (RCT), it may be important to think about how far into the implementation process various schools are, particularly since Time Change Coaches note the difference in working on “mechanical” versus “deeper” aspects of the process. A first year school may only be focusing on implementing the basic components of the process, while a year third year school may be talking deeply about time use.
Respondents in our sample also indicated some variation between schools that are in Wallace Foundation districts and those that are not. Coaches in Wallace districts are actually embedded in the district and often have more knowledge of the local context. They are district personnel and are therefore part of the district approach to school leadership and support. This may provide an advantage in their role of supporting SAM principals and schools; therefore, it may be important in considering whether and how to develop an RCT.
The SAM Process Is Evolving and Changing
There have been several notable changes in the SAM process since it first began. According to the respondents in this sample, the original philosophy was that a SAM should be a single person; that has evolved such that SAM is considered a process, rather than a person, with a greater emphasis on distributed leadership. One respondent explained that this shift was critical to helping schools realize “...that it’s really not a canned program and that there’s no right or wrong. That it really truly is individualized, and that’s what gives it its power. You know, that the individual determines what – what it’s going to do for them and what they need.” As one coach explained, some schools now have an entire SAM team, in which responsibilities for the process are shared, rather than one person as a SAM.
Other respondents described the ways in which the philosophy of the SAM process has shifted over time so that principals are encouraged to reflect not only on increasing their time on instruction, but on how they use that time.
One Time Change Coach described this evolution and its benefits:
“What began maybe several years ago as a way to help protect the principal’s time has now leaped ahead into much more than that, because what we see we’re actually doing by helping principals identify and provide training support for First Responders is they are building a culture that is way different in their building. One of distributed leadership. One of problem solvers, independent thinkers, people that can take a look at issues and say, I can take care of this, I don’t need someone else to tell me what to do. But, that takes place over a long period of time.”
Such coaches view the process as intended to impact the school at a deeper level, beyond just the implementation of the basic components of the SAM process: “So the process has evolved beyond just this setting up a calendar, managing your time, asking these kind of questions now to we’re getting steps beyond that to say okay, this is – this is what we do when we have that time to get in the class and so as you can tell at the conference, we’re now getting into more discussion about what principals can do with teachers...”

20
For example, electronic calendars were not part of the original SAM process, but now the Time Track Calendar is routinely upgraded and now includes a variety of graphs and features to track and analyze time use.
School and District Goals for Adopting the SAM Process
Time Change Coaches and Implementation Specialists indicated that districts and principals tend to have similar goals for adopting the SAM process. For districts, the primary motivation is often to increase the instructional leadership of principals in ways that positively impact student achievement. As one explained, districts want to “help [principals] to manage it all in an effective, clear fashion so that instead of spending all their time on the management things that don't touch student achievement…helping that principal to build a team so that they can really take care of the priorities of teaching and learning.”
Principals, on the other hand, adopt the SAM process for a few key reasons: 1) to improve their instructional leadership in ways that improve teaching, and ultimately, student achievement; 2) to improve their time management and make their work more manageable overall; and 3) to develop their staff members. One principal explained: “Number one…they really do want to impact teaching and learning in their buildings. They want to impact teacher practice. They want to understand more deeply what’s happening in classrooms. ...Others feel very strongly that they have the skills to be that instructional leader, but they have never been able to figure out how to spend the time doing it. Or how to set goals around how they should spend their time.”
Others commented on the importance of the SAM process for principals who are struggling to make their job more manageable: “I think the majority of them were passionate teachers who really want to help to improve teaching and learning and they think that they could impact more students and more teachers at that level, so that’s why they want to become a principal. Then they get in the role and reality hits and it’s more management…So they see this as oh, maybe there is a way to really be a principal, an instructional leader that I wanted to be, and there’s a process that I can use to help me to do that.”
Some respondents noted that most principals share a common motivation for becoming involved in the SAM process, regardless of the student achievement level of their schools: “But all of them have the same concerns in mind. How can I spend more time in the classroom, how can I provide a good professional development for my teachers, how can I engage the parents and not only the parents, but the school community, how can I do that? How can I improve student achievement?”
Benefits, Successes, and Strengths of the SAM Process
Benefits of the SAM Process
Respondents described several benefits to the SAM process, both for the principal and for the schools writ large: 1) a more distributed approach to leadership; 2) the development of a common, school-wide culture; 3) more principal time on instruction, and as a result, improved teacher practice; 4) principals providing more feedback to teachers; and 5) a more manageable day for principals.

21
Time Change Coaches and Implementation Specialists discussed how the SAM process improves school leadership, particularly as it becomes more distributed over time. Many principals find that they move from being the solitary school leader to part of a leadership team as the SAMs and First Responders take on new roles in shared leadership. Specifically, the First Responder system invites school staff to take on new responsibilities, which protects the principal’s instructional time while building a sense of distributed leadership throughout the school. One coach noted that if the principal is to spend more time with teachers “you have to have other people in your building that you rely on to be leaders in a variety of areas, whether it’s content areas or whether it’s in office things, you know, management things. So it really does lead to – to a much more, you know, distributed model when principals are truly and fully implementing the process.” Time Change Coaches and Implementation Specialists noted that the development of a common culture, which includes relationship-building around a new approach to instruction, was another benefit of the SAM process. Part of this culture includes a celebration of staff talents and abilities that were previously unrecognized. For example, secretaries and janitors may be celebrated for their role as SAMs or First Responders in protecting the principal’s instructional time.
Respondents overwhelmingly discussed the increase in time that principals spend on instruction as a main benefit of the program. Some also saw a change in the quality of principal time use, although this seemed to vary both by individual principal (i.e. some principals increased instructional time use without yet increasing quality of time use). One explained, “We have the data. ... You can see how much time was spent a year ago on instruction, and how much time is being spent now. You can look at the quality of what was done versus what's happening now. What are the areas the person is focusing on, and you can see a change or a shift.” Most respondents also talked about the importance of linking principal time spent on instruction with increased student achievement, but they acknowledged the difficulty in determining a causal link. Even in cases in which schools did improve student achievement, Time Change Coaches stated that they could not objectively say whether or not this was solely due to the implementation of the SAM process.
One byproduct of the increase in principal time on instruction appears to be an increase in the feedback they provide to teachers. For some principals, tracking which teachers receive feedback helps ensure they reach all teachers, not just a subset. The coaches believe these ongoing conversations with principals help them remain engaged with each teacher around something purposeful: “They're having more conversations with teachers. A, they have to anyway, because that's the district expectation, but B, they're tracking them. ... We chart it. I mean, each month, I hand them a chart that says, you know, this is how many hours and minutes you've had on these feedback conversations, on these observations. How is that working for you? Is that getting the results you want? Is there something that you want to try and do more of?”
Others coaches commented that an additional benefit of the SAM process is making the mandatory teacher evaluations occur more smoothly: “Because of this goal that they've set, they are spending more time in conversations with teachers, and in doing observations, and planning things, and it really ties together with all the new evaluation requirements that are happening all over the country. It fits real well.”
Finally, many principals find the SAM process makes their day more manageable. For example, the SAM Calendar helps principals “see” where lost time occurs on a daily basis and to make
22
decisions to prevent that from occurring. The Calendar also helps the school staff understand how busy the principal can be and the importance of protecting his time so that he might focus more specifically on instruction.
Evidence of Success of the SAM Process
Time Change Coaches and Implementation Specialists were asked to describe the evidence they look for to determine if a school’s SAM process is successful. They identified four ways: 1) the principal spends more time on instruction than management; 2) the school experiences a cultural shift that includes a school-wide focus on instruction; 3) the school uses distributed leadership; and 4) teachers’ practice and student achievement both change.
One coach finds success when the principal’s instructional time exceeds that of management time, as evidenced by the Time Track Calendar: “The purpose of the SAM process, in a nutshell, is to provide the system or a structure, a vehicle, a process, whatever word you want to use, so that the principal can meet with other people daily in order to plan and follow through on how their time is spent in a way that increases instructional -- a focus on more instructional time.”
Another measure of success is when coaches and Implementation Specialists perceive a cultural shift, in which the entire staff focuses more specifically on instruction. The idea is that when the school adopts the SAM process, the principal makes instruction a priority over management. Because this occurs through a shared leadership approach (i.e. the SAM team, First Responders, etc.), the entire staff should buy into the idea that the school-wide instructional focus is essential, with various people working to buffer the principal’s time so that this can occur.
Shared leadership is also essential. Coaches see successful implementation when “principal [has] a support team that can reflect, can push back, can ask questions, can make suggestions that, you know, is there for the purpose of being – helping that principal to buffer themselves from things that keep them from doing what they have scheduled to do each day.” Others coaches discussed the importance of being able to walk down the school hall and see that everyone knows who the First Responders are and which issue they are assigned to cover. This includes the parent/guardian community: “One of the big things that we work with them on is how to communicate that to parents, how to develop a newsletter or something that goes home that says here’s our first responder list and ... here’s what it’s about and here’s who can help you and you know, we want to serve you immediately, we don’t want you to have to wait for your information and answers.”
The “ultimate” measure of success of the SAM process is the increase in student achievement. However, respondents noted that they only had anecdotal evidence of such increases, as there was no way to isolate the SAM process as the sole cause of improved student achievement in some schools. They believe it likely contributes, but lack firm evidence. In lieu of such proof, Time Change Coaches look for the focus “on increasing instruction with the intent to impact change and influence different levels of teacher practice.” Since “a big component of the instructional task or event is observations, walk-throughs, and feedback to teachers about teacher practice,” coaches look for “a conversation about what difference is it making” as a way of ensuring the SAM process has been implemented well.

23
We also asked Time Change Coaches and Implementation Specialists to describe how they measure their own success. They found that when principals changed their practice to increase time spent on instruction, as well as begin making an impact on instruction, they felt successful. One coach talked extensively about increased student achievement as the bottom line as evidence of success. Others felt successful when many more schools and districts have joined the SAM process over time, most principals appear grateful for the coach’s work, and when NSIP and Mark Shellinger (Director, National SAM Innovation Project) listen to their feedback and try to improve the SAM model accordingly.
Strengths of the SAM Process
Time Change Coaches and Implementation Specialists were overwhelmingly positive about the SAM process, citing the basic components as excellent and contributing to a multitude of benefits for principals and schools writ large (as described above), as well as other aspects of the SAM process. For example, almost all respondents saw Mark Shellinger himself as a strength, as well as NSIP in general. They found them to be “consistent, willing, and passionate about the work.” They admired the willingness of Mark and his team to make changes and improvements to the SAM process based on their feedback and that of the principals and SAMs. Several identified the professional development they received as a strength, and most discussed the benefits of the annual SAM conference.
Challenges and Barriers
Although respondents largely focused on the strengths of the SAM process, as well as its benefits for schools and the signs of its success, we also asked them to identify its weaknesses. When pressed to discuss challenges and barriers, respondents described three categories: 1) challenges for the SAM process as a system writ large; 2) challenges for the individual principal; and 3) challenges for the Time Change Coaches and Implementation Specialists themselves.
Challenges of the SAM Process Writ Large
The biggest concern about the SAM process writ large is its sustainability. This was particularly true in light of Model 1, as it was difficult to sustain the salary and benefits for an additional staff member to work as a SAM. However, even in Model 3, some schools must rely on federal Race to the Top money or other grants to fund their participation, making sustainability questionable. Furthermore, several Time Change Coaches commented on Mark Shellinger’s impressive leadership, his passion for the work, and dynamic personality and commitment to the SAM process; a few questioned the sustainability of the process once Mark was no longer in charge.
Another respondent worried about the rapid growth of the SAM process and found a tension between wanting to grow and needing to refine the program. She explained that this is connected to the concern about the sustainability of the program overall: “It’s kind of like we’re always building it as we go, and I’m not saying that’s a bad thing but we’re going fast and sometimes I wish we could just slow down a minute and really say okay, let’s stop right here and let’s just kind of refine tools, resources, processes… I guess the question for me is are we leaving enough capacity in the district that it can continue and that that vision and mission of what this program’s all about could be sustained.”

24
Others discussed the importance of district leadership, both in initiating the SAM process for its schools and for sustaining their involvement. They believed that district level buy-in was critical for the process to continue over time. They noted that even when there was initial buy-in turnover of district-level staff became problematic when new staff did not understand or believe in the program. Such dissonance can leave principals feeling unsupported by the district. One person noted, “One thing I think we’ve learned, a big a-ha has been that the district has to be totally on board with it. They have to support it…you can sell the principals like this when you talk about it and the folks who are the – that are further away from that position don’t catch on as quick. And then you get to the superintendent and yeah, they see the importance and appreciate the thought but you know, whether they want to buy into it and invest in it is difficult”
Challenges for Individual Principals
Most of the challenges that respondents described had to do with variation at the principal-level, rather than systemic issues. In other words, few challenges were described beyond district-support and sustainability that had the potential to impact large groups of participating schools. Instead, most struggles arose because of individual principal characteristics. For example, some respondents described working with principals who did not have a strong understanding of effective instruction. They lamented that these principals could comply with the SAM process, implementing it fully, but still not reap the desired benefits. If principals increase their time on instruction, but do not improve the use of that time on instruction, they will see little change in teacher practice or student achievement. One coach described her struggle to work with one such principal: “His instructional time looks fantastic on the calendars but because I am there all day and I do walk-throughs and I do see other aspects of the school, I’m not sure he knows what’s good instruction. So just because you’re – it looks like you’re spending all this time in instruction, are you really making a difference? ...Has student achievement changed? ... Are the teaching strategies in place that will make a difference? ...And he answers the questions the way that – he’s supposed to, but I’m not sure he even knows what’s good instruction. …Bottom line is if you don’t know what good instruction is then poor instruction’s going to happen and you’re not going to know the difference.”
Multiple respondents suggested that the lack of principal buy-in can also be problematic. If principals do not volunteer for the SAM process, but are forced to participate, there can be difficulties. While some of these principals learn to strongly believe in the process, others drop out or only implement the components minimally. Several respondents described the challenge of juggling the TimeTrack® Calendar with other calendars. Some principals were mandated by their districts to use a particular calendar and found it cumbersome to add the TimeTrack Calendar to this. Others couldn’t seem to give up their other calendars and chose to use multiple ones, albeit with a struggle: “This is probably one of the biggest -- I don't want to say drawbacks, but challenges…Many schools are using multiple calendars. They're using Google Doc or they're using Microsoft Outlook or what else, and so the SAM calendar is another calendar that's thrown into the principal's world, and so the challenge becomes keeping track of things that might be in the Microsoft Outlook or the Google Doc calendar and get -- that can then get recorded into the SAM calendar…”
Some noted that principal experience did not necessarily predict success. Some new principals needed to wait a year before joining the SAM process; others were eager and able to participate
25
immediately. Some veteran principals struggled, while others embraced the process. Those who struggled tended to find great challenge in “giving up” their responsibilities to the First Responders. One explained, “That’s a hard, hard, hard part of this, for principals to do. Because, they come into their role believing…that they are to have all of the answers. And of course the buck does stop with them, so giving up pieces of their responsibility is really hard. Harder for some than for others.”
Several respondents also described the importance of the principal choosing the “right” SAM for the process. Principals who do not choose a person (or group) that is comfortable pushing on time use and asking reflective questions tend to struggle. Similarly, several noted that some principals struggle to find the time to hold the Daily Meeting, and that time constraints can be problematic in some cases. They also described the importance of the principal having established a culture of trust in the school for the process to succeed: “If the – if the staff thinks that your presence inside their classroom is for you to sabotage them and to get them, then you – we always say take care of that culture first. You know, really get to understand and know your staff. We also recommend that a person does not participate in the SAM project if they're going into a school that has had severe problems…”
Finally, one Time Change Coach believed high school principals had far greater difficulty implementing and sustaining the SAM process than did principals of elementary and middle schools. She believed the high school principals had a harder time focusing on instruction over management. She explained: “Now, we've had three principals say, I don't want to do this anymore. And it's been very interesting. They are high school principals....They really – at least these three, really like the management. They had a difficult time with instruction. I think it – it opened up something they didn't want to show about their skill level. And they might have been great teachers – But leading, and having instructional discussions – they were having a difficult time doing that.”
Challenges of the Coach and Implementation Specialist Role
Interviewees cited three challenges about the way in which the coaching and Implementation Specialist role has been set up in the SAM process. One Time Change Coach believed being in a school only once per month limited her impact. Others described the problem of not having enough coaches or Implementation Specialists in their district to do their jobs well. Lastly, others said that sometimes there was a lag between when the Implementation Specialist finished working in a school and when the coach was able to begin. Sometimes the two are able to speak by phone or meet before the transition occurs, but other times this is not possible because of scheduling. Only one person listed this as a challenge.
Implications for an RCT
Interviews with Time Change Coaches and Implementation Specialists suggest a few considerations that may be relevant for the decision around pursuing an RCT. These implications should be cross-checked across the various other data collected for this project.
Time Change Coaches and Implementation Specialists were largely consistent in describing the SAM process, the way it is implemented, the strengths and benefits of the process, and its weaknesses. This was true regardless of which school districts respondents worked in or how

26
long they had been involved in the process. From the interviewees’ perspective, there is little variation in the way schools engage with the SAM process. The variation that does exist appears to be largely due to individual principals’ personalities, experience, and knowledge, rather than systematic variation. For example, some principals had a harder time than others relinquishing control to First Responders and fully implementing that aspect of the SAM process; however, there was nothing about a particular group of principals that seemed to make them more or less likely to struggle with this. Similarly, some principals had a better grasp on effective instructional practices and thus were able to use the SAM process to leverage improved instruction; respondents did not find anything systematic about which principals had this advantage and which did not.
However, Coaches and Implementation Specialists described some challenges that were more likely to occur within certain districts or across many of them. Those should be cautiously reviewed along with other data sources to consider how they may or may not impact an RCT. Specifically, the issues of 1) sustainability; 2) principal buy-in; and 3) possible variation by high school level emerged as potentially important in the consideration of an RCT.
First, respondents expressed concern about sustainability for schools that relied on grant funding. They also worried about district leadership buy-in and its importance for maintaining the program in schools. This was particularly problematic when district leaders who supported the SAM process left and were replaced by others who were unfamiliar with it or did not see its value. In considering an RCT, one may want to investigate the level of buy-in at the district level, as well as its stability or tendency toward frequent turnover of district leaders.
Second, most interviewees discussed the difference in working with principals who volunteered, and therefore bought into the SAM process philosophy, versus those who were mandated to participate. As one said, “The biggest difference that I see with the schools I’ve worked with is whether a school volunteered to be in it, seeing the value of it and wanted to be in it, or whether the superintendent has said you’ll be a part of this program. In that respect, some of them were just compliant. I have to do this, it’ll be over, I’ll do it.” This idea of choosing to participate versus compliance is an issue to consider for an RCT. It suggests the possible need for a random selection of principals who have volunteered for the program, rather than a random selection of all principals.
Less clear is whether or not the school level (elementary vs. high school) relates to how well the SAM process is implemented and sustained. One coach in our sample described three principals who dropped out of the process – all high schools – and believed high school principals in particular struggled to engage in instructional time more than principals in elementary or middle schools. Stating that these principals “really like the management” aspect of their role, she cautioned that principals at this level may face different challenges than those in other levels. Given that only one respondent described this, it will be important to triangulate with other data sources before determining whether this is a criterion that should be considered in light of an RCT.
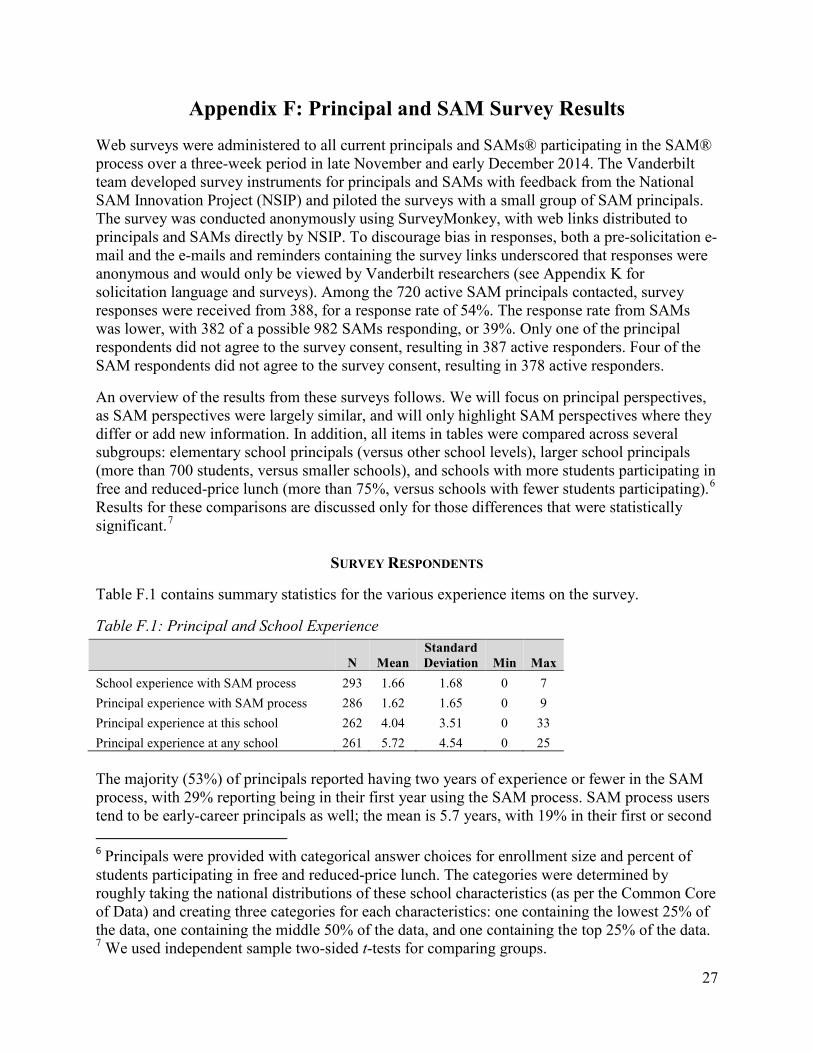
27
Appendix F: Principal and SAM Survey Results Web surveys were administered to all current principals and SAMs® participating in the SAM® process over a three-week period in late November and early December 2014. The Vanderbilt team developed survey instruments for principals and SAMs with feedback from the National SAM Innovation Project (NSIP) and piloted the surveys with a small group of SAM principals. The survey was conducted anonymously using SurveyMonkey, with web links distributed to principals and SAMs directly by NSIP. To discourage bias in responses, both a pre-solicitation e-mail and the e-mails and reminders containing the survey links underscored that responses were anonymous and would only be viewed by Vanderbilt researchers (see Appendix K for solicitation language and surveys). Among the 720 active SAM principals contacted, survey responses were received from 388, for a response rate of 54%. The response rate from SAMs was lower, with 382 of a possible 982 SAMs responding, or 39%. Only one of the principal respondents did not agree to the survey consent, resulting in 387 active responders. Four of the SAM respondents did not agree to the survey consent, resulting in 378 active responders.
An overview of the results from these surveys follows. We will focus on principal perspectives, as SAM perspectives were largely similar, and will only highlight SAM perspectives where they differ or add new information. In addition, all items in tables were compared across several subgroups: elementary school principals (versus other school levels), larger school principals (more than 700 students, versus smaller schools), and schools with more students participating in free and reduced-price lunch (more than 75%, versus schools with fewer students participating).6 Results for these comparisons are discussed only for those differences that were statistically significant.7
SURVEY RESPONDENTS
Table F.1 contains summary statistics for the various experience items on the survey.
Table F.1: Principal and School Experience
N Mean Standard Deviation Min Max
School experience with SAM process 293 1.66 1.68 0 7 Principal experience with SAM process 286 1.62 1.65 0 9 Principal experience at this school 262 4.04 3.51 0 33 Principal experience at any school 261 5.72 4.54 0 25 The majority (53%) of principals reported having two years of experience or fewer in the SAM process, with 29% reporting being in their first year using the SAM process. SAM process users tend to be early-career principals as well; the mean is 5.7 years, with 19% in their first or second 6 Principals were provided with categorical answer choices for enrollment size and percent of students participating in free and reduced-price lunch. The categories were determined by roughly taking the national distributions of these school characteristics (as per the Common Core of Data) and creating three categories for each characteristics: one containing the lowest 25% of the data, one containing the middle 50% of the data, and one containing the top 25% of the data. 7 We used independent sample two-sided t-tests for comparing groups.

28
year as a principal. Most principals and schools seem to be fairly new to the SAM process, and the principals involved tend to be newer as well, with fewer than five years of experience at the school. While we cannot compare directly because responses were whole numbers, likely leading to ambiguous rounding, these data suggest that our sample may have underrepresented principals who are newer to the SAM process, as compared to data we received in January 2015.
In addition, several survey items captured characteristics of the schools:
• The majority (64%) of the respondents work in elementary schools, while 18% work in middle schools, 13% work in high schools, and 6% work in schools classified as “Other.”8 For comparison, nationally approximately 55% of schools are elementary schools, suggesting that elementary schools are more likely than other schools to use the SAM process.
• Most principals (86%) work in what they identified as “regular” schools (not charter or special schools).
• 52% of the respondents work in schools with 250 to 700 students, 42% work in schools with more than 700 students, and 6% work in schools with fewer than 250 students. For comparison, nationally 25% of schools fall into this lowest category, while 25% fall into the highest category, suggesting that larger schools are more likely to make use of the SAM process.
• 9% of the respondents work in schools where low numbers of students are eligible for free and reduced price lunch (<30%), 39% work in schools in the medium range (30% to 75%), and 53% work in schools with more than 75% of students eligible. SAM schools serve larger percentages of students eligible for free and reduced-price lunch when compared to schools nationally.
With an average of 1.16 years of experience, SAMs are on average, newer to the SAM process than principals.
GOALS FOR PARTICIPATION
Table 2 shows responses to the following question: “How important was each of the following factors in your decision to participate in the SAM process?” For each item, respondents could choose one of five responses, which were “Not at all important” (1), “A little important” (2), “Somewhat important” (3), “Very important” (4), and “Extremely important” (5).
8 School levels were based on school classifications from the Common Core of Data.
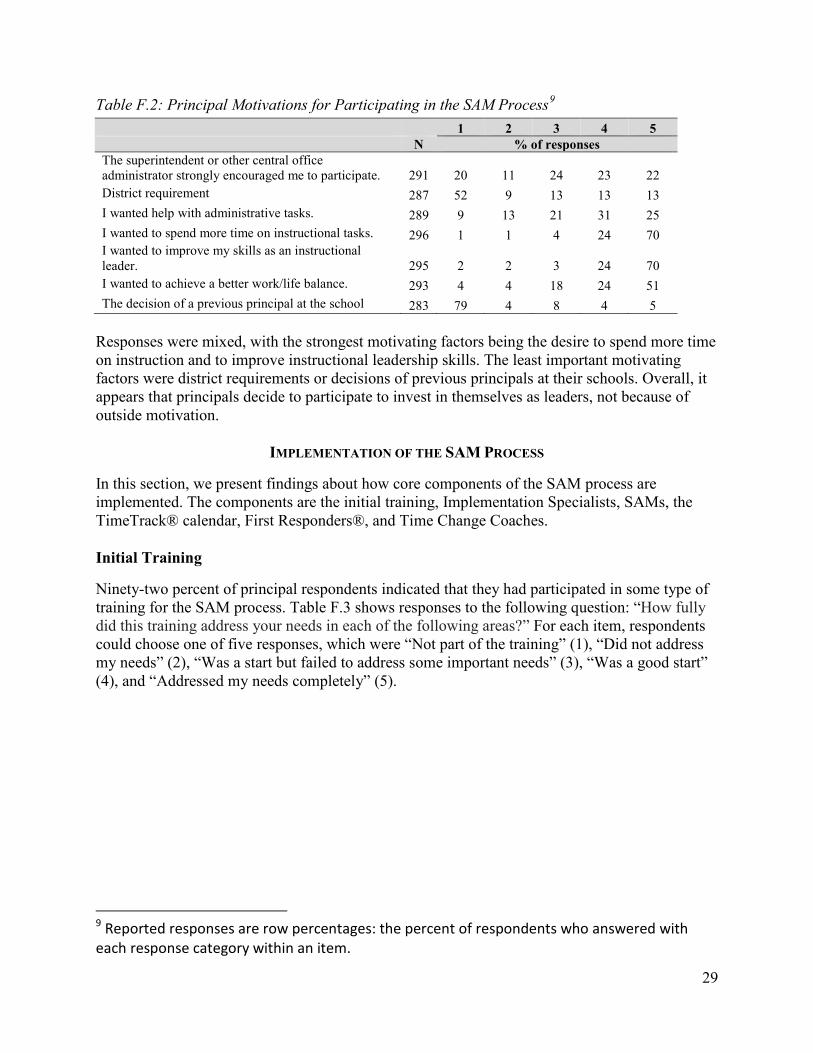
29
Table F.2: Principal Motivations for Participating in the SAM Process9 1 2 3 4 5
N % of responses
The superintendent or other central office administrator strongly encouraged me to participate. 291 20 11 24 23 22 District requirement 287 52 9 13 13 13 I wanted help with administrative tasks. 289 9 13 21 31 25 I wanted to spend more time on instructional tasks. 296 1 1 4 24 70 I wanted to improve my skills as an instructional leader. 295 2 2 3 24 70 I wanted to achieve a better work/life balance. 293 4 4 18 24 51 The decision of a previous principal at the school 283 79 4 8 4 5
Responses were mixed, with the strongest motivating factors being the desire to spend more time on instruction and to improve instructional leadership skills. The least important motivating factors were district requirements or decisions of previous principals at their schools. Overall, it appears that principals decide to participate to invest in themselves as leaders, not because of outside motivation.
IMPLEMENTATION OF THE SAM PROCESS
In this section, we present findings about how core components of the SAM process are implemented. The components are the initial training, Implementation Specialists, SAMs, the TimeTrack® calendar, First Responders®, and Time Change Coaches.
Initial Training
Ninety-two percent of principal respondents indicated that they had participated in some type of training for the SAM process. Table F.3 shows responses to the following question: “How fully did this training address your needs in each of the following areas?” For each item, respondents could choose one of five responses, which were “Not part of the training” (1), “Did not address my needs” (2), “Was a start but failed to address some important needs” (3), “Was a good start” (4), and “Addressed my needs completely” (5).
9 Reported responses are row percentages: the percent of respondents who answered with each response category within an item.

30
Table F.3: Principal Perspectives on Training 1 2 3 4 5
N % of responses
Interpreting the Time/Task Analysis report from the week of shadowing 261 4 1 4 56 34 Setting goals for my time 263 2 1 4 48 46 Mechanics of using the TimeTrack calendar 262 3 2 5 47 44 Preparing teachers for a change in my role 260 7 3 8 54 27 Using TimeTrack data to monitor progress toward my goals 261 2 1 4 51 43 Delegating managerial tasks to First Responders 263 2 1 11 46 40 Working with a SAM 263 2 2 4 45 48 Working with a SAM coach 262 3 1 6 46 43 Choosing a SAM 260 10 2 6 43 39 Choosing First Responders 261 5 2 8 46 39
For each item, respondents answered fairly positively about the content of the training. The areas that respondents wanted covered more concerned the delegation of tasks for First Responders and the preparation of teachers for the change in the principal’s role.10
Implementation Specialists
A large majority (89%) of principals reported working with an implementation specialist to implement the SAM process. Table F.4 shows responses to the following question: “To what extent did the Implementation Specialist assist with each of the following?” For each item, respondents could choose one of five responses, which were “Not at all” (1), “To a small extent” (2), “To some extent” (3), “To a great extent” (4), and “To an exceptional extent” (5).
Table F.4: Principal Perspectives on Implementation Specialists 1 2 3 4 5
N % of responses
Teaching me to use my TimeTrack calendar 250 2 4 17 44 33 Teaching my SAM to use my TimeTrack calendar 250 2 4 11 46 38 Discussing helpful time use strategies 248 1 5 17 42 36 Extracting and interpreting data from the TimeTrack calendar 248 2 8 18 47 26 Modeling the SAM Daily Meeting with my SAM 250 4 9 20 38 30 Giving feedback on my interaction with my SAM 250 5 8 18 40 30 Setting up the First Responder system in my school 249 8 8 23 37 25 Choosing a SAM 248 33 11 15 23 18 Choosing First Responders 248 19 12 25 26 19
10 Principals in larger schools seemed to find the training more helpful, with most of the items rated significantly more positively with the exception of preparing teachers for the change in the role, working with a SAM coach, choosing a SAM, and choosing First Responders (which were rated similarly in smaller schools).

31
Principal respondents indicated that the Implementation Specialists greatly assisted with most initial training needs for the principal and SAM. However, respondents did not feel that the Implementation Specialists helped as much with setting up the First Responder system, choosing a SAM, or choosing First Responders. Implementation specialists did not seem to work as much with elementary school principals on modeling the SAM Daily Meeting or giving feedback on interaction with the SAM, as compared to other school levels.
Most (86%) of principal respondents find the Implementation Specialist to be at least “very helpful,” while 14% find them “minimally helpful” at most.
The SAMs
From the survey data, we learned that SAMs held various positions in the school. According to principals who responded to this question (N = 302), those positions were:
• 189 (63%) secretaries, • 74 (25%) assistant principal, • 12 (4%) school business manager/bookkeepers, • 36 (12%) teachers, and • 107 (35%) other positions, including school counselors, parent coordinators, and
deans, plus a small number of Model 1 SAMs. Note that some schools have more than SAM, some of whom are in different roles, so the percentages sum to more than 100%. Of those reporting more than one position, many (12% of the full sample) had a secretary and assistant principal combination. Five percent of principals reported having a staff person dedicated exclusively to the SAM position. Twenty-seven percent of the principals had their SAMs change at some point, excluding those changes that occurred because the principals changed schools or their SAM left the school.
Most principals met with their SAM(s) at least once a day (72%) or two to three times a week (23%). These meetings, according to SAMs, are generally less than 30 minutes long (83%). Seventy-six percent of SAMs responded that the Daily Meeting system is “good” or “excellent.”
Table F.5 shows responses to the following question: “To what extent do you implement the following processes in your school with your SAM?” For each item, respondents could choose one of five responses, which were “Not at all implemented” (1), “Rarely implemented” (2), “Sometimes implemented” (3), “Usually implemented” (4), and “Always implemented” (5).

32
Table F.5: Principal Work with SAMs 1 2 3 4 5
N % of responses
Schedule a SAM Daily Meeting 270 1 1 11 36 50 Meet with my SAM 270 1 1 8 38 52 Have a reflective conversation 269 2 4 19 45 30 Reconcile the TimeTrack calendar from previous days 270 2 3 12 33 50 Receive feedback on my calendar 270 3 9 22 39 27 Discuss how I am progressing toward my overall target goals 268 3 9 28 36 25 Discuss issues other staff are handling 268 3 10 26 38 23 Set specific target on tasks, such as meeting with specific teachers 270 4 7 20 43 27 Analyze and disaggregate TimeTrack data 269 4 15 35 33 14 Run reports on TimeTrack data 270 7 23 34 25 11 Utilize a First Responder system 265 6 7 14 40 33
Most items were implemented at least sometimes, with the SAM Daily Meetings and calendar reconciliation happening most consistently, and the analysis, disaggregation, and viewing of the TimeTrack data and reports happening least consistently. Elementary school principals are somewhat less likely to implement meetings with their SAM, although the rates are still very high (86% compared to 96% for other schools). Generally, principal respondents find their SAMs to be helpful, with 83% of them finding them “very helpful” or “exceptionally helpful.”
We asked SAMs, “How comfortable are you in asking your principal questions about his/her time use?” Most of the time, SAMs reported being “very comfortable” or “exceptionally comfortable” with questioning their principals about their time use (86%). We also asked, “How comfortable are you with having difficult conversations with your principal around his/her use of time?” A smaller percentage (72%) reported being “very comfortable” or “exceptionally comfortable” with having difficult conversations about their principals’ time use.
TimeTrack Calendar
A variety of people have access to the TimeTrack calendars, according to SAMs:
• 278 principals have access. • 129 vice principals have access. • 15 counselors have access. • 21 teacher leaders have access. • 156 school office staff members have access. • 42 district administrators (excluding Time Change Coach) have access. • 259 Time Change Coaches have access. • 23 other staff members have access.
Elementary schools were more likely to have counselors, teacher leaders, school office staff, and other staff with access to the calendar.
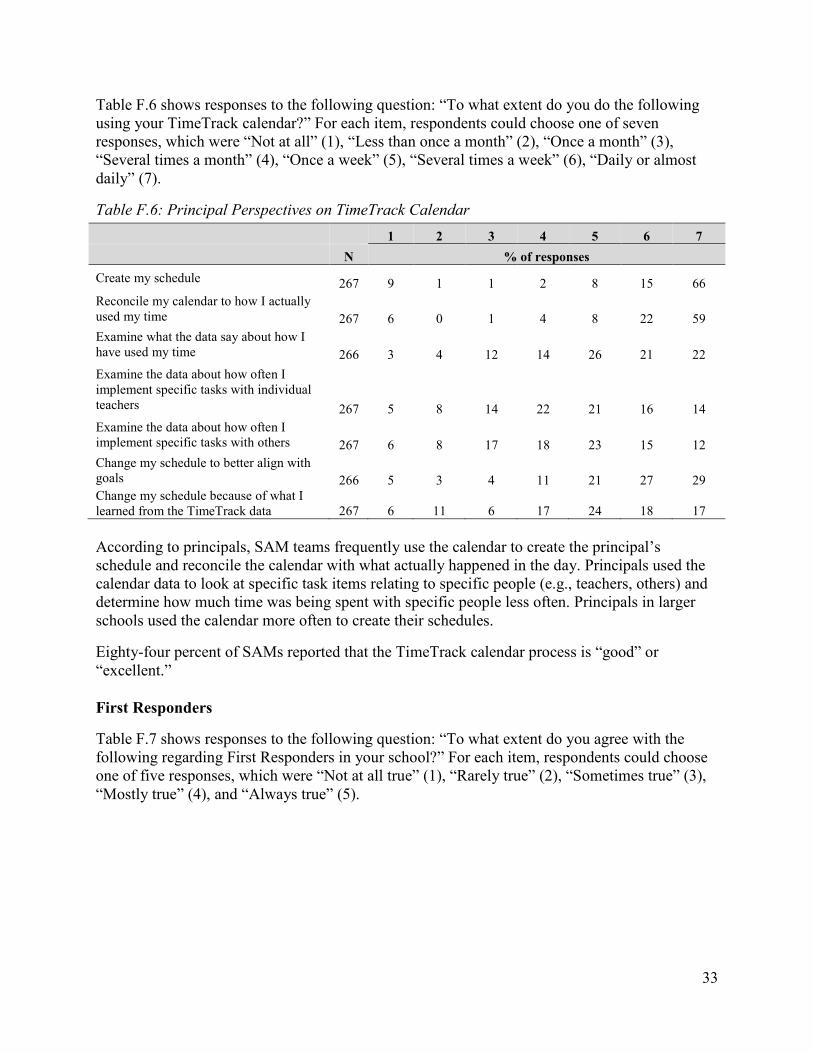
33
Table F.6 shows responses to the following question: “To what extent do you do the following using your TimeTrack calendar?” For each item, respondents could choose one of seven responses, which were “Not at all” (1), “Less than once a month” (2), “Once a month” (3), “Several times a month” (4), “Once a week” (5), “Several times a week” (6), “Daily or almost daily” (7).
Table F.6: Principal Perspectives on TimeTrack Calendar 1 2 3 4 5 6 7 N % of responses Create my schedule 267 9 1 1 2 8 15 66 Reconcile my calendar to how I actually used my time 267 6 0 1 4 8 22 59 Examine what the data say about how I have used my time 266 3 4 12 14 26 21 22 Examine the data about how often I implement specific tasks with individual teachers 267 5 8 14 22 21 16 14 Examine the data about how often I implement specific tasks with others 267 6 8 17 18 23 15 12 Change my schedule to better align with goals 266 5 3 4 11 21 27 29 Change my schedule because of what I learned from the TimeTrack data 267 6 11 6 17 24 18 17 According to principals, SAM teams frequently use the calendar to create the principal’s schedule and reconcile the calendar with what actually happened in the day. Principals used the calendar data to look at specific task items relating to specific people (e.g., teachers, others) and determine how much time was being spent with specific people less often. Principals in larger schools used the calendar more often to create their schedules.
Eighty-four percent of SAMs reported that the TimeTrack calendar process is “good” or “excellent.”
First Responders
Table F.7 shows responses to the following question: “To what extent do you agree with the following regarding First Responders in your school?” For each item, respondents could choose one of five responses, which were “Not at all true” (1), “Rarely true” (2), “Sometimes true” (3), “Mostly true” (4), and “Always true” (5).

34
Table F.7: Principal Perspectives on First Responders 1 2 3 4 5
N % of responses
There are First Responders with clearly defined areas of responsibility. 263 5 3 14 47 32 Office staff use the First Responder system. 261 5 4 18 49 24 Based on the issue at hand, teachers know which First Responder to approach. 260 7 8 22 46 18 Based on the issue at hand, parents are aware of the appropriate First Responder to approach. 263 14 19 37 22 8 The First Responder system helps me use my time effectively. 259 5 4 22 41 28
Principals reported high levels of fidelity to SAM process goals of having a First Responder system set up and having in-school staff use it. Parents, however, are not as often aware of which First Responders are appropriate to approach. In contrast to principal responses, however, SAMs were not as positive about whether teachers knew how to use the First Responder system. For example, whereas 64% of principals said this statement was mostly or always true, only 50% of SAMs responded similarly. There is slightly less fidelity in elementary schools, where all of the above items are significantly less likely to be true for principal respondents, with the exception of office staff using the First Responder system. In larger schools, principals were significantly more positive that there were First Responders with clearly defined areas of responsibility and that the First Responder system was helping them use their time effectively. In schools with more students participating in free and reduced-price lunch, however, principals reported more challenges with parents knowing the appropriate First Responder to approach about the program.
Generally, principals felt that the First Responder system helped them organize their time. Fifty-seven percent of SAMs responded that the First Responder system is “good” or “excellent,” indicating that a large portion of SAMs feel lukewarm or worse about the extent to which the First Responder system is working in their schools.
Time Change Coaches
Ninety percent of principal respondents work with a Time Change Coach. The majority (82%) reported that their coaches spend fewer than five hours in their school each month, and 13% reported that their coaches spend five to nine hours each month. The majority (74%) found their coaches to be “very helpful” or “exceptionally helpful.”
Table F.8 shows responses to the following question: “To what extent does your SAM coach assist with each of the following?” For each item, respondents could choose one of five responses, which were “Not at all” (1), “To a small extent” (2), “To some extent” (3), “To a large extent” (4), and “Completely” (5).

35
Table F.8: Principal Perspectives on Time Change Coaches 1 2 3 4 5
N % of responses
Teaching me to use my TimeTrack calendar 250 6 10 26 33 26 Teaching my SAM to use my TimeTrack calendar 249 3 8 27 33 31 Discussing helpful time use strategies 249 3 8 24 37 28 Extracting and interpreting data from the TimeTrack calendar 250 2 10 24 38 26 Modeling the SAM Daily Meeting with my SAM 248 11 13 29 27 21 Giving feedback on my interaction with my SAM 249 5 12 23 35 25 Setting up the First Responder system in my school 248 14 18 22 28 18 Helping me to improve my use of instructional time 246 4 9 21 38 28
Generally, the coaches seemed to spend more time providing feedback to SAM teams on the use and progress of the TimeTrack calendar. Respondents indicated that coaches worked on modeling SAM Daily Meetings, providing feedback on principal-SAM interactions, and setting up the First Responder system to a smaller extent, relatively.
SAMs were also asked what Time Change Coaches did with them. These responses are shown in Table F.9. As in G.8, response categories were “Not at all” (1), “To a small extent” (2), “To some extent” (3), “To a large extent” (4), and “Completely” (5).
Table F.9: SAM Perspectives on Time Change Coaches 1 2 3 4 5
N % of responses
Teaching me to use my TimeTrack calendar 297 6 5 19 37 32 Discussing helpful time use strategies 297 5 4 20 40 31 Extracting data from the TimeTrack calendar 297 5 4 22 38 30 Interpreting data from the TimeTrack calendar 297 6 4 24 34 33 Modeling the SAM Daily Meeting with my principal 296 7 11 18 31 33 Giving feedback on my interaction with my principal 294 7 9 17 32 36 Helping us implement the First Responder system 295 9 9 20 37 25
Generally, the coaches seemed to spend more time with SAMs on addressing the relationship between the principal and the SAM (in contrast to the principal responses, above). Respondents indicated that coaches worked on setting up the First Responder system to a smaller extent, relatively. Seventy-six percent of SAMs responded that the coaching is “good” or “excellent.”
Note that principals and SAMs responded differently concerning the role of Time Change Coaches. The coach role appears to vary by SAM team member.
OVERALL CHALLENGES, BENEFITS, AND SUSTAINABILITY
We asked principals, “To what extent are the goals of the SAM process (as stated by the NSIP) integrated into the life of the school?” Five percent of principal respondents said that the goals of the SAM process were “fully” or “mostly separated” from the life of the school. Fourteen percent
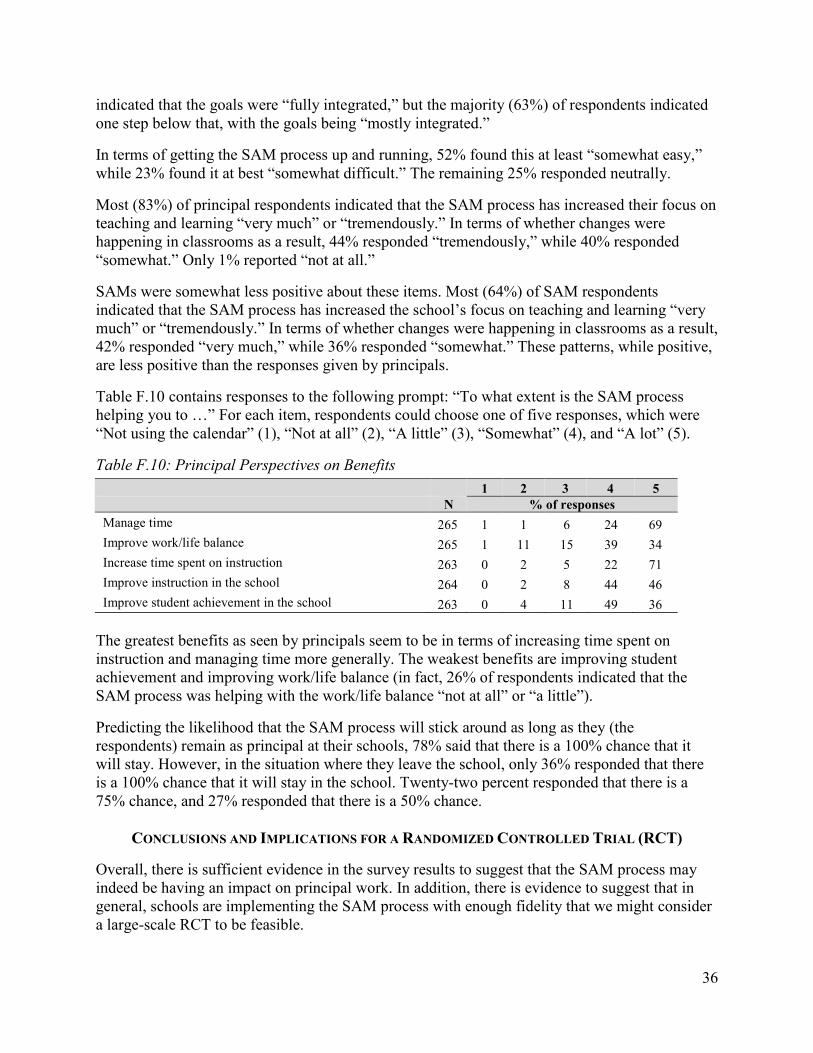
36
indicated that the goals were “fully integrated,” but the majority (63%) of respondents indicated one step below that, with the goals being “mostly integrated.”
In terms of getting the SAM process up and running, 52% found this at least “somewhat easy,” while 23% found it at best “somewhat difficult.” The remaining 25% responded neutrally.
Most (83%) of principal respondents indicated that the SAM process has increased their focus on teaching and learning “very much” or “tremendously.” In terms of whether changes were happening in classrooms as a result, 44% responded “tremendously,” while 40% responded “somewhat.” Only 1% reported “not at all.”
SAMs were somewhat less positive about these items. Most (64%) of SAM respondents indicated that the SAM process has increased the school’s focus on teaching and learning “very much” or “tremendously.” In terms of whether changes were happening in classrooms as a result, 42% responded “very much,” while 36% responded “somewhat.” These patterns, while positive, are less positive than the responses given by principals.
Table F.10 contains responses to the following prompt: “To what extent is the SAM process helping you to …” For each item, respondents could choose one of five responses, which were “Not using the calendar” (1), “Not at all” (2), “A little” (3), “Somewhat” (4), and “A lot” (5).
Table F.10: Principal Perspectives on Benefits 1 2 3 4 5
N % of responses
Manage time 265 1 1 6 24 69 Improve work/life balance 265 1 11 15 39 34 Increase time spent on instruction 263 0 2 5 22 71 Improve instruction in the school 264 0 2 8 44 46 Improve student achievement in the school 263 0 4 11 49 36
The greatest benefits as seen by principals seem to be in terms of increasing time spent on instruction and managing time more generally. The weakest benefits are improving student achievement and improving work/life balance (in fact, 26% of respondents indicated that the SAM process was helping with the work/life balance “not at all” or “a little”).
Predicting the likelihood that the SAM process will stick around as long as they (the respondents) remain as principal at their schools, 78% said that there is a 100% chance that it will stay. However, in the situation where they leave the school, only 36% responded that there is a 100% chance that it will stay in the school. Twenty-two percent responded that there is a 75% chance, and 27% responded that there is a 50% chance.
CONCLUSIONS AND IMPLICATIONS FOR A RANDOMIZED CONTROLLED TRIAL (RCT)
Overall, there is sufficient evidence in the survey results to suggest that the SAM process may indeed be having an impact on principal work. In addition, there is evidence to suggest that in general, schools are implementing the SAM process with enough fidelity that we might consider a large-scale RCT to be feasible.
37
There were several important points that came out the survey results regarding the implementation of the SAM process, including some that have important implications for the need for and design of an RCT:
• The initial training addressed many needs for principals, indicating that the examination of the training as an important part of the treatment in question will be critical for the design of an RCT.
• As of now, people are not using the calendar as much to analyze, disaggregate, and view their data. Overall, principals reported implementing the parts of the SAM process that involve more specific use and analysis of the TimeTrack data less often. It is possible that the deeper data analysis tools in the TimeTrack calendar system are not yet a core component of the SAM process.
• A significant percentage of SAMs reported being less than “very comfortable” with keeping principals accountable for their time use. This challenge highlights the importance of choosing a SAM and addressing this aspect during SAM coaching. The First Responder system poses challenges for some principals, particularly in having teachers and parents understand how to use the system. This is an area that could require additional support and training.
• A significant portion of principals reported difficulty in getting the SAM process up and running. As such, the design of an RCT might consider that results may not come immediately and that longer-term measurement may be important.
• Principals and SAMs varied in their assessments of the extent to which changes were happening in the classroom as a result of participation in the SAM process. In an RCT, there is likely to be heterogeneity in effects of the SAM process across schools.
• The greatest perceived benefits of the process were for increasing time on instruction and managing time more effectively. The weakest perceived benefits were improving student achievement and improving work/life balance.
• SAMs generally reported similar results as principals, although where they did disagree (e.g., extent to which there were changes in classrooms), they were less positive about the SAM process. In an RCT, outcomes based on principal self-reports should be triangulated with data collected from SAMs, as their perspectives might differ.
• Elementary schools and schools with fewer than 700 students were less likely to have many of the specific components of the SAM process implemented to the same extent, especially in terms of the implementation of the First Responder system. Issues related to fidelity of implementation would be important to probe by school characteristics in an implementation study that might accompany an RCT.
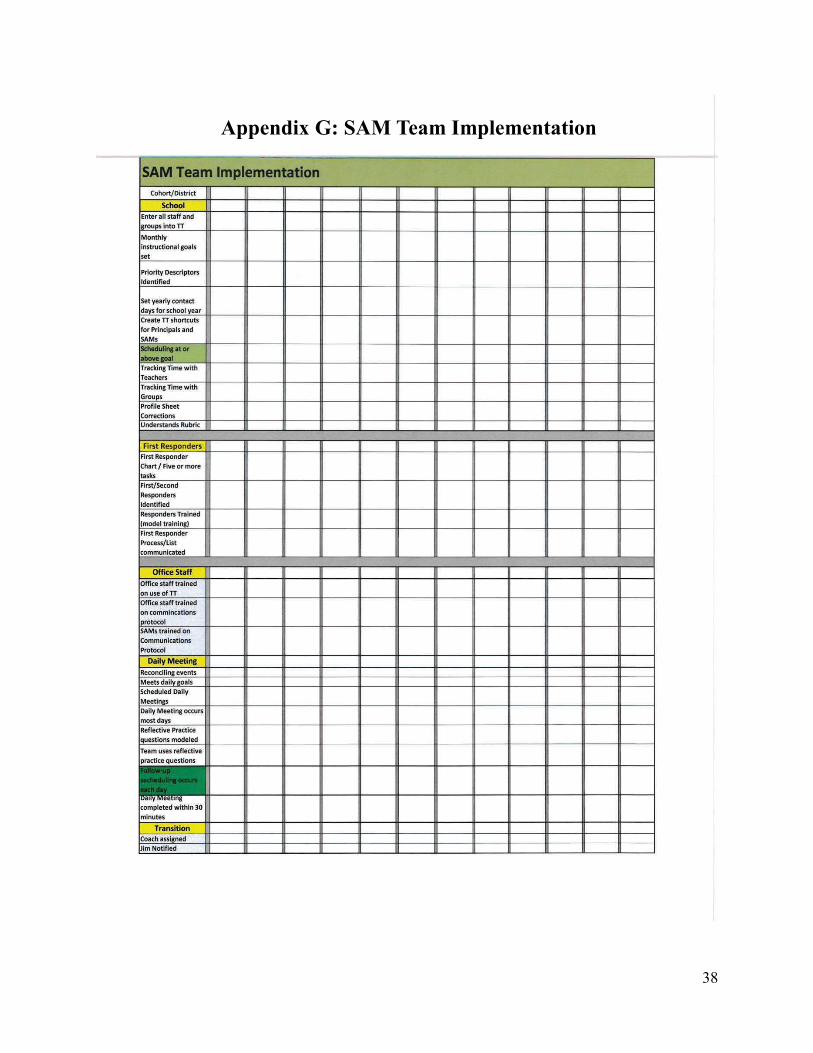
38
Appendix G: SAM Team Implementation

39
Appendix H: Landscape Analysis of SAM Process Shadowing and Calendar Data
THE DATA
Two sources of data permit analysis of principals’ time use and changes in that time use as they engage in the SAM® process. First are the Time/Task Analysis® shadowing data. At entry into the SAM process and once per year thereafter, SAM principals are shadowed by trained National SAM Innovation Project (NSIP) observers who record their time use using a standardized protocol over approximately one week. The second source is TimeTrack® calendar data, which chronicle principal time use as entered by principals and SAMs® throughout the school year. The TimeTrack calendar is a main component of the implementation of the SAM process and functions as a computer-based tool for principals and supporting teams to track the principal’s time expenditure. For both the Time/Task Analysis and TimeTrack data, the information we received was generally at the person-day level, meaning that a typical row of data (as we formatted it) would include one day’s worth of data for an individual, reported as the percent of time that participants spent on various categories of activities as per SAM process definitions.
Data for this landscape analysis were provided by NSIP and comprise three types: (1) descriptive characteristics of program participants, (2) data from individuals’ TimeTrack calendars, and (3) data from individuals’ Time/Task Analysis shadowing periods. All files are linked via calendar IDs, which are consistent across files for a given participant. These data cover 373 administrators involved in the SAM process, representing 78% of the 481 total SAM teams participating in the SAM process.11 Approximately 33% of the data has been deidentified, meaning that the administrator and school name have been replaced with “Administrator ###” and “School ###,” respectively.12 TimeTrack calendar data cover active calendars from August 1, 2013, to June 15, 2014. Time/Task Analysis shadowing data were provided for any year that an active SAM principal had been shadowed.
Measures include percent time spent on instruction, management, personal time, and unscheduled time. Within instructional and management time, the data show breakdowns for different categories of time use, listed in Table H.1.
11 Total numbers from NSIP as of January 9, 2013. 12 Principals were given the option of having their data deidentified before it was provided to the research team. In comparing trajectories of time use across deidentified and identified participants, the patterns were not different enough to cause concern that there are significant differences in SAM process participation between these different groups. Trajectories in instructional time across time for these groups are shown in Figure H.18.

40
Table H.1: Categories of Time Use Instructional Management Decision Making Groups and Committees District: Meetings, Supervisor, Others External: Officials, Others Feedback: Celebration Feedback: Directive Feedback: Non-Directive Modeling/Teaching Observation Office Work/Prep Parents/Guardians Planning, Curriculum, Assessment Professional Development Student Supervision Walkthrough Work With Student(s)
General Management Building Management Celebration Decision Making Groups and Committees District: Meetings, Supervisor, Others Employee Discipline Employee Supervision External: Officials, Others Office Work/Prep Parents/Guardians Student Discipline Student Supervision
Characteristics of Administrators and Schools
Total, there are 373 unique calendar IDs in the data (with no duplicated IDs). These are distributed across 58 districts (of 63 participating districts13) in 18 states, the highest-participating states being Florida, Iowa, and Georgia. The districts with the most teams, however, are Hillsborough County (FL), Gwinnett County (GA), and Denver (CO).
Figure H.1: SAM Process Participation by State
13 We do not have data from RSD Charter School, Inc. (AZ), Brandywine School District (DE), Georgia College (GA), Jefferson County Public Schools (KY), St. John the Baptist Parish Public Schools (LA), and Lonedell R-XIV (MO). In addition to the list we received of participating districts, we also received data from Kansas City Public Schools (MO).

41
Characteristics of SAM Process Participation
The breakdown by SAM process model is shown in Table H.2.14
Table H.2: SAM Process Models N % Model 1 56 15 Model 2 3 1 Model 3 299 80 Unknown 15 4 Total 373 100 Almost all Model 1 schools are in Iowa or New York, and all Model 2 schools are in Iowa. A large majority of participants are using Model 3, which is the least costly version of the SAM process. Most participants (84%) have been involved with the SAM process for less than two years.15 This is roughly on par with the percentage of first- and second-year SAM principals reported to us in January 2015, when this percentage was 78%.
Looking only at averages, Minnesota, Indiana, and Kentucky schools have participated the longest. New Hampshire, New Jersey, and Arizona schools seem to be newest to the process, averaging lower than three-quarters of a year.
Time/Task Analysis Shadowing Data
Shadowing data come from a larger date range, with the earliest shadowing having been conducted in November 2008 and the most recent in December 2014. Shadowing tends to happen in the fall, with an additional, significant number of observations during the spring, as shown in Figure H.2 (Month 1 = January).
14 Model 1 of the SAM process involves hiring a new staff member whose major responsibilities are to administer the SAM process in the school. Model 2 involves redesigning an existing staff member’s role and adding additional compensation to do this work. Model 3 involves adding SAM responsibilities to an existing staff member’s role, with no additional compensation. 15 It is unclear whether the number of years in the program refers to years that the current principal has been involved or the years that the school has been involved.

42
Figure H.2: Month of Shadow Observations
In the data, 51% of participants had been shadowed at least twice. Most shadowing experiences were less than a full week, with 44% being three days and 22% being four days. Only 30% were a full five days.
Characteristics of the Schools
Most participating schools are elementary schools, with 68% serving elementary grades only and 10% also serving grades above. Eighteen percent of participating schools serve middle grades, and only 4% serve high school grades. Thus, schools in the SAM process data serve relatively younger students; nationally, 25% of schools are classified as secondary schools.16
We obtained additional school characteristics by including data from the 2011–12 school universe data files17 from the Common Core of Data (CCD). We were able to match 214 of the 240 identified schools (89%), covering 221 different calendar users.18 Most (98%) of these 221 users work in what CCD classifies as “regular” schools, with the rest working in alternative, vocational, or special education schools. More than half (55%) work in a city, and 86% work in schools eligible for Title I funding. Compared to national averages, these SAM schools are larger and have more students participating in the free and reduced-price lunch program, as well as more Hispanic and black students. Figure H.3 is a grouped bar plot showing the distribution of users among schools in different quartiles of these student demographic variables, with the quartiles based on the full distributions of these characteristics across all schools in CCD. The “Quartile 1” bars, for example, show the number of schools in the SAM data that are in the lowest 25% of schools in the United States in terms of the various demographic characteristics.
16 According to new figures provided to us by NSIP in January 2015, 63% of SAM schools are elementary schools. 17 These were the most recent full data files available at the time of this analysis. Data were matched on district and school names. 18 Unmatched “school teams” often were actually district office teams.
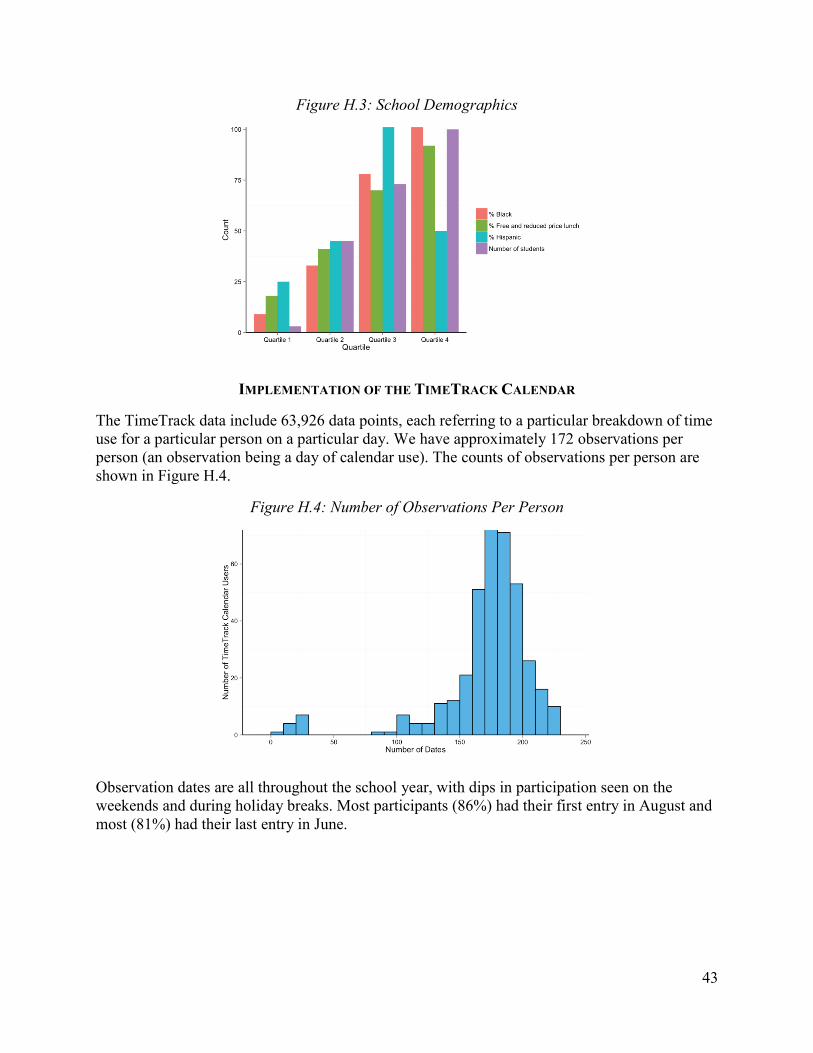
43
Figure H.3: School Demographics
IMPLEMENTATION OF THE TIMETRACK CALENDAR
The TimeTrack data include 63,926 data points, each referring to a particular breakdown of time use for a particular person on a particular day. We have approximately 172 observations per person (an observation being a day of calendar use). The counts of observations per person are shown in Figure H.4.
Figure H.4: Number of Observations Per Person
Observation dates are all throughout the school year, with dips in participation seen on the weekends and during holiday breaks. Most participants (86%) had their first entry in August and most (81%) had their last entry in June.

44
Figure H.5: Observation Dates
The vast majority of entries are made during the normal work week (Monday through Friday), although 51 entries were made on Sundays and 83 made on Saturdays, across 40 people.
There are varying numbers of missing days. It is difficult to determine how often participants were not using the calendar (as opposed to just not working) because of differing school calendars across schools and districts, but the plots in Figure H.6 provide some insight.
Figure H.6: Missing Days
As expected, there were greater numbers of missing days during the months of June and December, because of holidays and the end of the data period that we received.19 There also are higher numbers of missing days during November, January, March, and April, which may correspond to Thanksgiving, winter, and spring breaks. Overall, it does not seem that there is any significant trend in missing days. In addition, there does not seem to be any significant difference 19 Counts of missing days were calculated for each month by subtracting each person’s number of entries for each month from the number of days in that month. Resulting differences will be inflated because of weekends but should be, for the most part, equally inflated across months, and as such the plots here are still useful for comparison.

45
in missing data between groups of participants with different years of experience with the SAM process, as seen in Figure H.7 (using the month of October as an example).
Figure H.7: Missing days in October by Years of Experience with SAM Process
It also is important to note that the calculation of the percent time spent on the different categories by the TimeTrack software is not completely accurate because it relies on careful user data entry. For example, there are three observations in the data with percent time on instruction less than 0%, and 83 with more than 100% (across 41 people). These out-of-range values occur because total time on a category is calculated using a total sum of coded entries on the calendar, while the total time spent working is calculated from a manual entry of start and end time by users. If a user entered an end time at 3:00 p.m., for example, but had coded instructional time all day, plus an evening event, then they would end up having percent time on instruction greater than 100%.20 This error count is shown in Table H.3 for the different time categories. These inconsistencies suggest that time calculations should be taken as approximations for purposes of the analyses presented here.
Table H.3: Clearly Incorrect Time Records
Category Less
than 0 More
than 100
People with at least one
implausible entry Instructional 3 83 41 Management 2 19 12 Personal 0 6 6 Unscheduled 571 3 130 We also may consider unscheduled time as an indicator for the implementation of the program. Beyond missing complete days, participants may neglect the calendar during the day as well, leaving much unscheduled time that could make the interpretation of the data difficult (because we do not know what was happening during the unscheduled time). In Figure H.8, we can see that while principals in their first year of implementation tend to be very diligent about
20 This conclusion was reached in coordination with Jim Mercer at NSIP.

46
scheduling all of their time at the beginning, by the end of the year, more than half of their time is unscheduled. In later years, principals start higher but seem to settle after October to have around 25% to 35% of time unscheduled.
Figure H.8: Unscheduled Time by Years in Program
Interestingly, we also see that those principals who started off with the highest baseline instruction levels tend to become more lax in their time logging throughout the year compared to other principals, ending with around 60% of time being unscheduled.
Figure H.9: Unscheduled Time by Baseline Instruction Quartile
OUTCOMES OF TIME USE
Change across Years: Evidence from Time/Task Analysis Shadowing Data
For those individuals who were shadowed twice (138), we can see a general increase in time spent on instruction. We generally see the same for those who were shadowed three times (27),
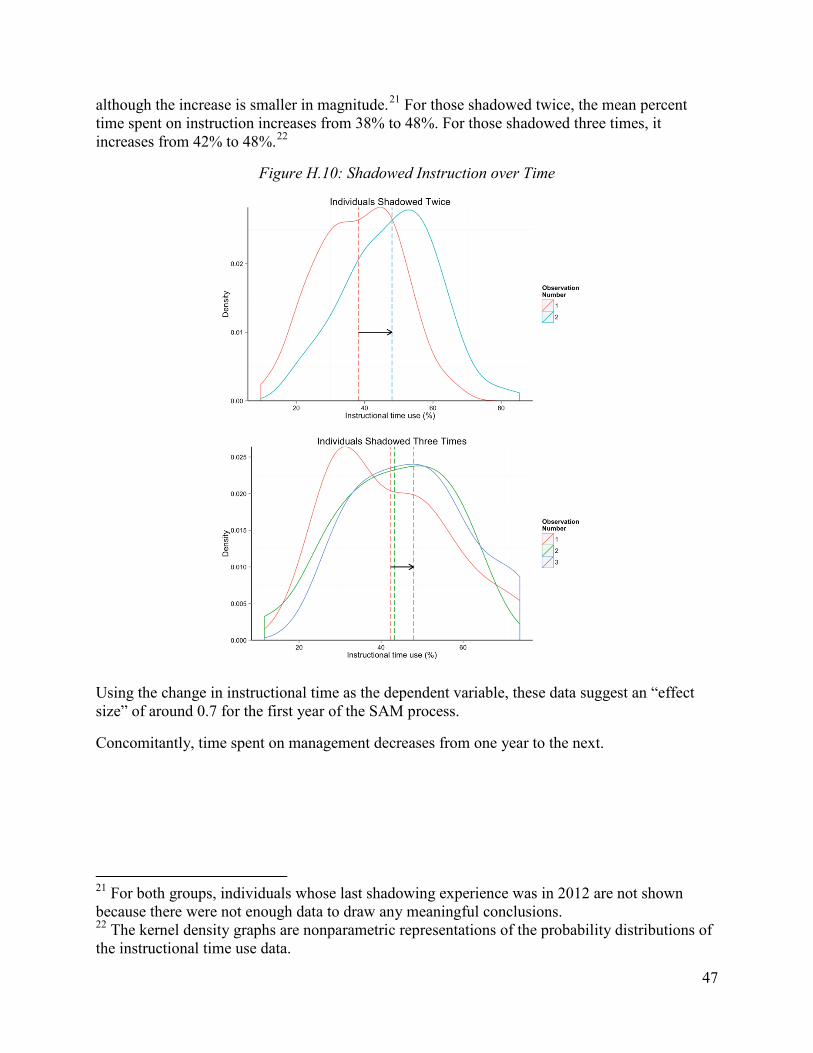
47
although the increase is smaller in magnitude.21 For those shadowed twice, the mean percent time spent on instruction increases from 38% to 48%. For those shadowed three times, it increases from 42% to 48%.22
Figure H.10: Shadowed Instruction over Time
Using the change in instructional time as the dependent variable, these data suggest an “effect size” of around 0.7 for the first year of the SAM process.
Concomitantly, time spent on management decreases from one year to the next.
21 For both groups, individuals whose last shadowing experience was in 2012 are not shown because there were not enough data to draw any meaningful conclusions. 22 The kernel density graphs are nonparametric representations of the probability distributions of the instructional time use data.
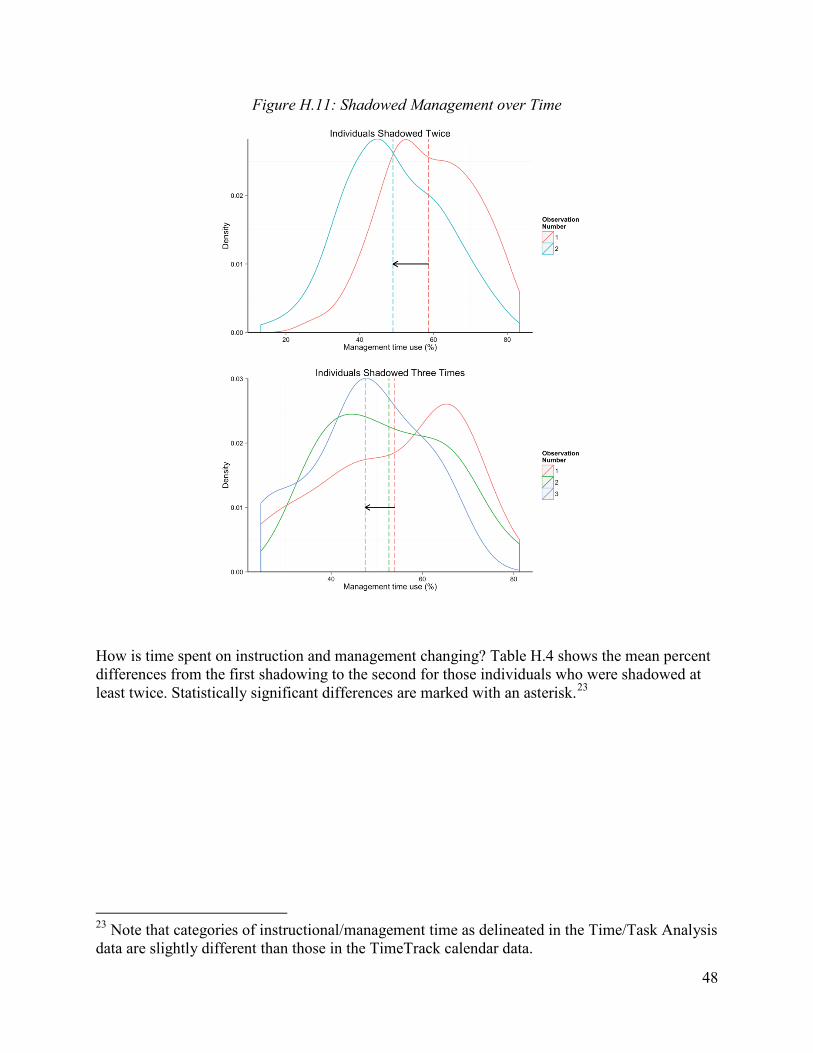
48
Figure H.11: Shadowed Management over Time
How is time spent on instruction and management changing? Table H.4 shows the mean percent differences from the first shadowing to the second for those individuals who were shadowed at least twice. Statistically significant differences are marked with an asterisk.23
23 Note that categories of instructional/management time as delineated in the Time/Task Analysis data are slightly different than those in the TimeTrack calendar data.

49
Table H.4: Instruction and Management Category Changes over Time Mean % Difference Instructional 9.09* Office Work/Prep 3.13* Observation/Walkthrough 2.56* Feedback: Non-Directive 1.38* Planning, Curriculum, Assessment 1.37* Decision Making Groups and Committees 0.91 Work with Student(s) 0.61 External: Officials, Others 0.21 Modeling/Teaching 0.10 Feedback: Celebration 0.10 Parents/Guardians 0.01 Student Supervision -0.02 Professional Development -0.15 District: Meetings, Supervisor, Others -0.34 Feedback: Directive -0.79* Management -9.01* Employee Supervision -3.72* Office Work/Prep -2.27* Student Supervision -1.03 Parents/Guardians -0.95* District: Meetings, Supervisors, Others -0.68* Student Discipline -0.35 Employee Discipline -0.18* Building Management -0.07 Decision Making Groups and Committees -0.05 Celebration 0.03 External: Officials, Others 0.25 Observations 376
Across all individuals, time spend on instruction increased an average of 9%. Most of this change seems to be attributable to increases in instructional office work and preparation; observations and walkthroughs; planning, curriculum, and assessment; and non-directive feedback. In addition, although the mean difference is not practically significant, there is a statistically significant decline in directive feedback. Management time decreased, on average, by 9%. This overall decrease seems mostly attributable to decreases in employee supervision; management office work and preparation; interaction with parents and guardians; meetings and supervision with districts; and employee discipline.
We note that the top two increases in instructional time were in office work and preparation and observations and walkthroughs, while the corresponding top two decreases in management time were office work and preparation and employee supervision. These classes of activity are very

50
similar to each other; more specific understandings of what shadowers count as being instructional or management time, and what distinguishes between the two, will be important for the design of a randomized controlled trial (RCT).
Lastly, we investigated the extent to which the differences in instructional and management time across shadowing observations were of differing magnitudes across different types of participants. The mean differences in percent time spent for different subgroups of participants are shown in Table 5.24
Table H.5: Shadowing Observations Differences by Subgroup Instructional Management Full Set 9.09 -9.01 Model 1 8.49 -8.06 Model 3 9.27 -9.29 Years in program < 3 10.10 -9.92 Years in program ≥ 3 6.57 -6.76 Elementary school 9.91 -9.73 Middle school 5.95 -6.02 Quartiles 2 and 3 for enrollment 13.98 -14.08 Quartile 4 for enrollment 5.33 -4.99 Quartiles 2 and 3 for free and reduced-price lunch 9.67 -9.70 Quartile 4 for free and reduced-price lunch 12.00 -11.82 Overall, it appears that principals in Model 3 schools are modestly more effective at increasing their instructional time. Principals in schools with higher percentages of students enrolled in free and reduced-price lunch, lower enrollment, and elementary grades (as opposed to middle grades) are more effective at increasing instructional time. The same is true of principals who are newer to the program. These trends are similar for decreases in management time.
Change within Years: Evidence from TimeTrack Calendar Data
The average change in time use, broken down by those categories coded in the TimeTrack data, is shown in Figure H.12. The graph shows the average percent of time spent by principals on different categories of activity (on the y axis) on each day of the year (on the x axis). Loess smoothing was used to summarize overall trends,25 and shaded areas encompass the middle 50% of the data (bounded by the 25th and 75th percentiles).
24 Only subgroups for which there were practically large sample sizes are shown here. 25 Loess smoothing is a technique used for extracting non-parametric trend lines from scattered data by using locally weighted polynomial regression on subsets of data surrounding each individual point of data.

51
Figure H.12: Average Percent on Time Categories by Date
From these trends, we can see that instructional time does tend to increase over the course of the first half of the year, and then it decreases toward the end of the year. Time spent on management also seems to follow the same trend, although not to the same magnitude. Personal time is relatively stable throughout the year, and unscheduled time seems to generally increase as the year goes on.
With instructional, management, and unscheduled time, however, there seems to be a broad range of possible trajectories. Figure H.13 shows the separate trajectories for instructional time use of all participants.26 Still, the mean trend lines are meaningful.
Figure H.13: All Instructional Time Trajectories
Whether or not the program is working as intended is not obvious from Figure H.12, in part because there are likely seasonal changes in principal time use that these data reflect. However, it is useful to note that while we see changes in instructional time over the year, we do not see corresponding decreases in management time. Part of the theory of action for the SAM process 26 Some values are outside of 0% and 100% in the graph because Loess smoothing was used to account for data noise.
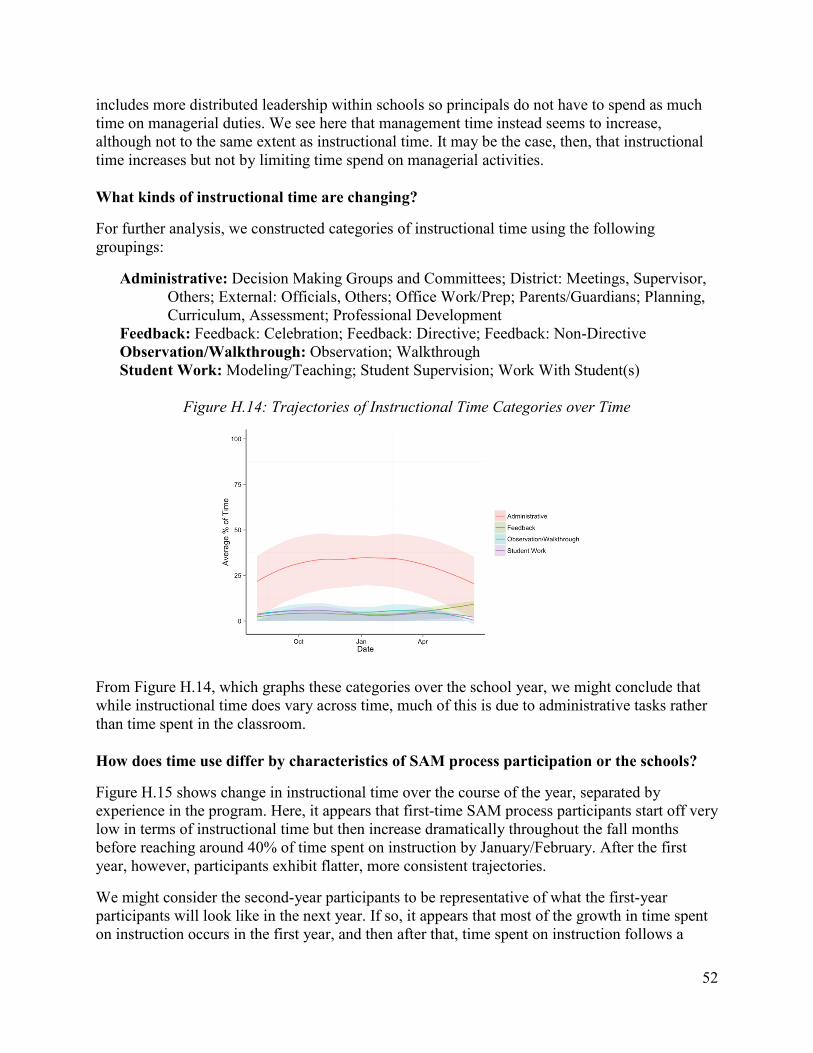
52
includes more distributed leadership within schools so principals do not have to spend as much time on managerial duties. We see here that management time instead seems to increase, although not to the same extent as instructional time. It may be the case, then, that instructional time increases but not by limiting time spend on managerial activities.
What kinds of instructional time are changing?
For further analysis, we constructed categories of instructional time using the following groupings:
Administrative: Decision Making Groups and Committees; District: Meetings, Supervisor, Others; External: Officials, Others; Office Work/Prep; Parents/Guardians; Planning, Curriculum, Assessment; Professional Development
Feedback: Feedback: Celebration; Feedback: Directive; Feedback: Non-Directive Observation/Walkthrough: Observation; Walkthrough Student Work: Modeling/Teaching; Student Supervision; Work With Student(s)
Figure H.14: Trajectories of Instructional Time Categories over Time
From Figure H.14, which graphs these categories over the school year, we might conclude that while instructional time does vary across time, much of this is due to administrative tasks rather than time spent in the classroom.
How does time use differ by characteristics of SAM process participation or the schools?
Figure H.15 shows change in instructional time over the course of the year, separated by experience in the program. Here, it appears that first-time SAM process participants start off very low in terms of instructional time but then increase dramatically throughout the fall months before reaching around 40% of time spent on instruction by January/February. After the first year, however, participants exhibit flatter, more consistent trajectories.
We might consider the second-year participants to be representative of what the first-year participants will look like in the next year. If so, it appears that most of the growth in time spent on instruction occurs in the first year, and then after that, time spent on instruction follows a

53
more seasonal, regular pattern that is at all time points greater in the amount of time spent on instruction than first-year participants were when they started. This evidence is consistent with the idea that the SAM process is having some impact on instructional time use.
Figure H.15: Time on instruction by time in program
We may also be concerned that these results are localized to certain types of principals, especially in terms of their relative “need” for this program (based on baseline shadowing data). In Figure H.16, we see that indeed, those principals who spent more time on instruction during their baseline shadowing period also have higher increases in instructional time over the course of the year, peaking at around 50% for those in the top half of the baseline instruction distribution and around 40% for those in the bottom half.
Figure H.16: Time on instruction by baseline instruction quartile
Finally, the school year for a principal may look very different depending on the district environment. Indeed, when graphing trajectories of time use (similar in structure to Figure H.12) for our four case study districts individually, we find that the trajectories look quite different.
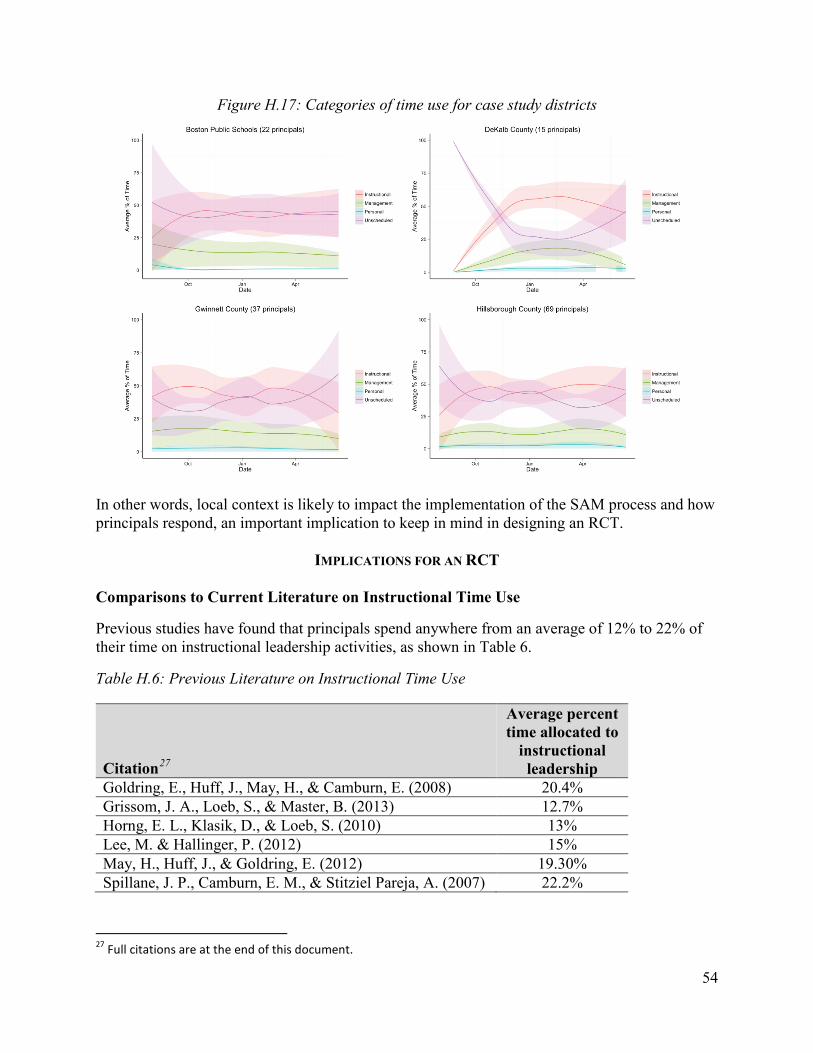
54
Figure H.17: Categories of time use for case study districts
In other words, local context is likely to impact the implementation of the SAM process and how principals respond, an important implication to keep in mind in designing an RCT.
IMPLICATIONS FOR AN RCT
Comparisons to Current Literature on Instructional Time Use
Previous studies have found that principals spend anywhere from an average of 12% to 22% of their time on instructional leadership activities, as shown in Table 6.
Table H.6: Previous Literature on Instructional Time Use
Citation27
Average percent time allocated to
instructional leadership
Goldring, E., Huff, J., May, H., & Camburn, E. (2008) 20.4% Grissom, J. A., Loeb, S., & Master, B. (2013) 12.7% Horng, E. L., Klasik, D., & Loeb, S. (2010) 13% Lee, M. & Hallinger, P. (2012) 15% May, H., Huff, J., & Goldring, E. (2012) 19.30% Spillane, J. P., Camburn, E. M., & Stitziel Pareja, A. (2007) 22.2%
27 Full citations are at the end of this document.
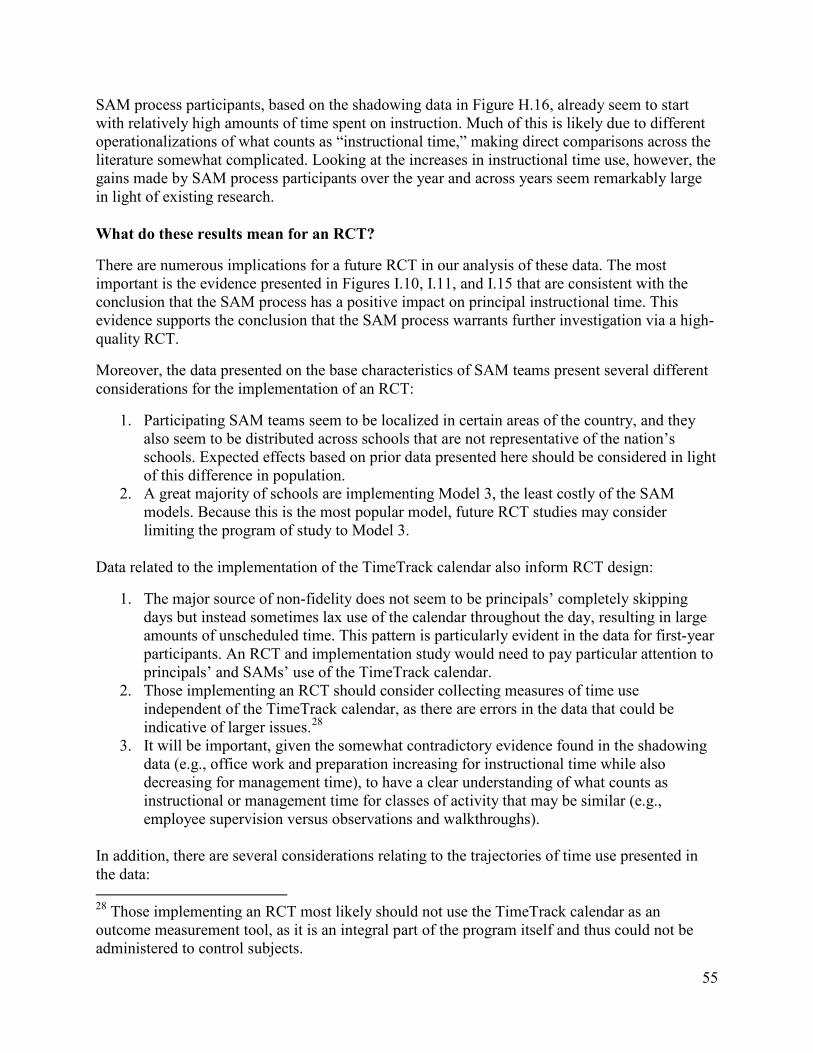
55
SAM process participants, based on the shadowing data in Figure H.16, already seem to start with relatively high amounts of time spent on instruction. Much of this is likely due to different operationalizations of what counts as “instructional time,” making direct comparisons across the literature somewhat complicated. Looking at the increases in instructional time use, however, the gains made by SAM process participants over the year and across years seem remarkably large in light of existing research.
What do these results mean for an RCT?
There are numerous implications for a future RCT in our analysis of these data. The most important is the evidence presented in Figures I.10, I.11, and I.15 that are consistent with the conclusion that the SAM process has a positive impact on principal instructional time. This evidence supports the conclusion that the SAM process warrants further investigation via a high-quality RCT.
Moreover, the data presented on the base characteristics of SAM teams present several different considerations for the implementation of an RCT:
1. Participating SAM teams seem to be localized in certain areas of the country, and they also seem to be distributed across schools that are not representative of the nation’s schools. Expected effects based on prior data presented here should be considered in light of this difference in population.
2. A great majority of schools are implementing Model 3, the least costly of the SAM models. Because this is the most popular model, future RCT studies may consider limiting the program of study to Model 3.
Data related to the implementation of the TimeTrack calendar also inform RCT design:
1. The major source of non-fidelity does not seem to be principals’ completely skipping days but instead sometimes lax use of the calendar throughout the day, resulting in large amounts of unscheduled time. This pattern is particularly evident in the data for first-year participants. An RCT and implementation study would need to pay particular attention to principals’ and SAMs’ use of the TimeTrack calendar.
2. Those implementing an RCT should consider collecting measures of time use independent of the TimeTrack calendar, as there are errors in the data that could be indicative of larger issues.28
3. It will be important, given the somewhat contradictory evidence found in the shadowing data (e.g., office work and preparation increasing for instructional time while also decreasing for management time), to have a clear understanding of what counts as instructional or management time for classes of activity that may be similar (e.g., employee supervision versus observations and walkthroughs).
In addition, there are several considerations relating to the trajectories of time use presented in the data: 28 Those implementing an RCT most likely should not use the TimeTrack calendar as an outcome measurement tool, as it is an integral part of the program itself and thus could not be administered to control subjects.

56
1. Given the theory of action for the SAM process about lowering management time and the conflicting evidence we see in the data within years, it is important that the RCT also consider time on management as an outcome.
2. In the same vein, because most movement on instructional time seems to come from those tasks that do not necessarily involve engaging with teachers in the classroom, an RCT will need to be specific about the measures of instructional time. Most importantly, instructional tasks that are more administrative in nature need to be distinguished from in-classroom and teacher-feedback activities.
3. There seems to be significant seasonality in principals’ time use, and as such, any RCT should be careful in comparing time use across different points in the year.
4. Explorations of program impacts should search for a moderating influence of baseline time spent on instruction.
5. Evidence in Table 5 also suggests important moderating influences of school grade levels, enrollment, and student participation in free and reduced-price lunch.
6. Because of the significantly different trends shown in Figure 15, an RCT would best be implemented using a within-district randomization design, and analyses should account for district contexts.
7. Changes in shadowing data also may be used as an outcome variable.
OTHER SUPPORTING DATA
Figure H.18: Instructional time by deidentification
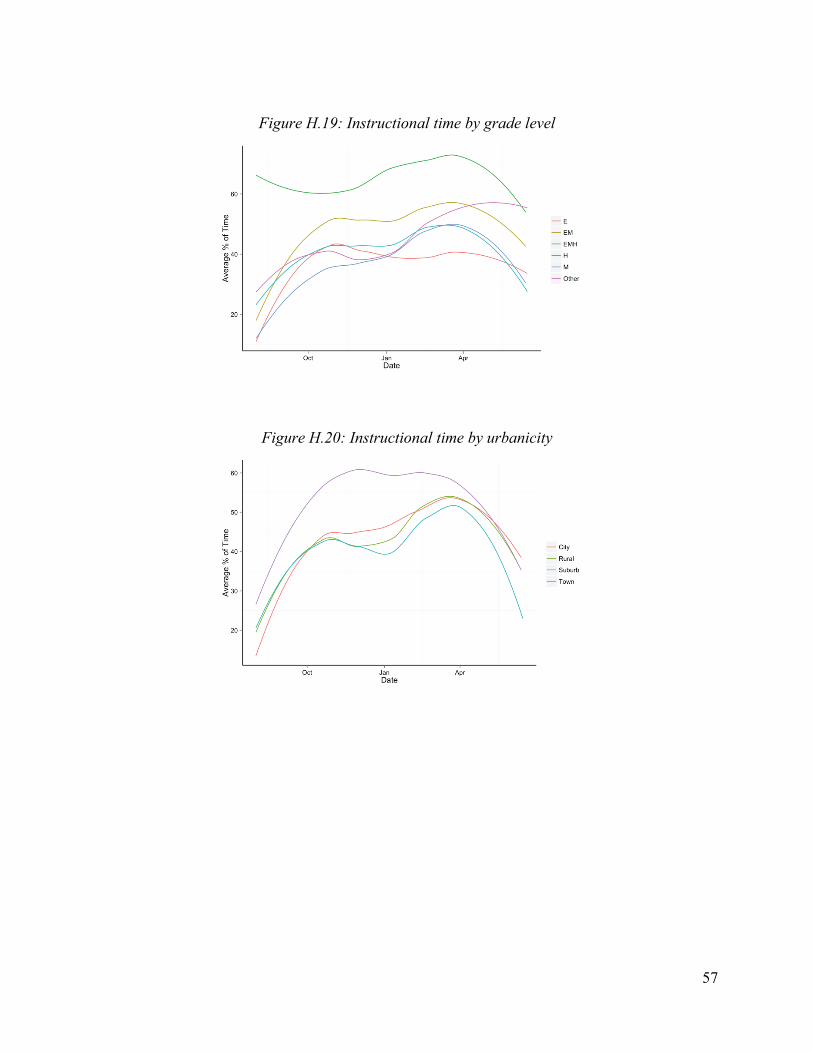
57
Figure H.19: Instructional time by grade level
Figure H.20: Instructional time by urbanicity
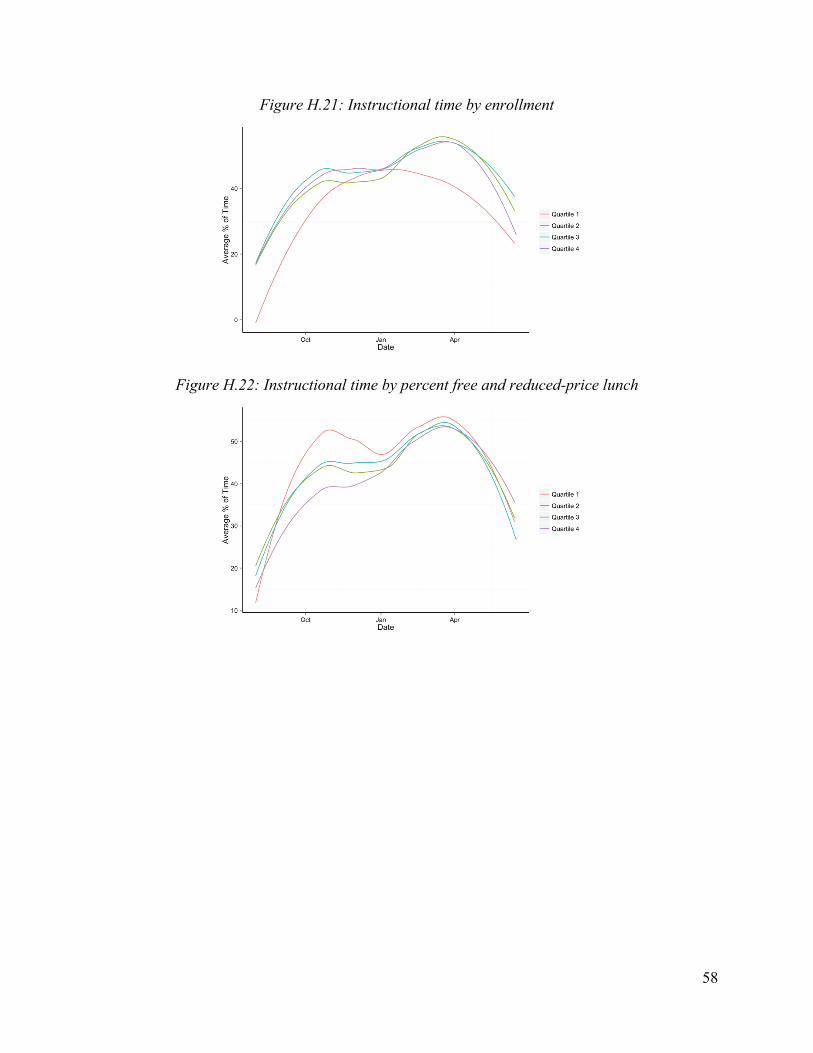
58
Figure H.21: Instructional time by enrollment
Figure H.22: Instructional time by percent free and reduced-price lunch
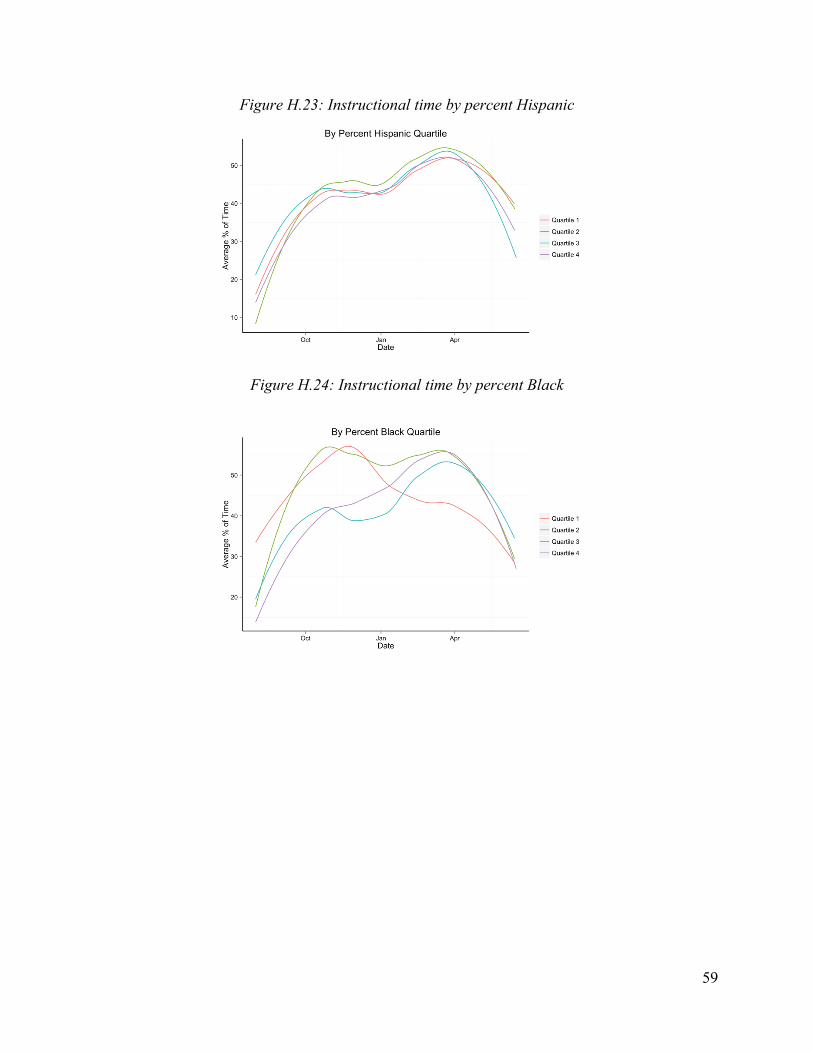
59
Figure H.23: Instructional time by percent Hispanic
Figure H.24: Instructional time by percent Black

60
Appendix I: Interview Protocols
Policy Studies Associates (PSA) Evaluators Focus Group 1. What are the most important dimensions of implementation of the SAM
process/program? Probe for: Three, possibly four, models of SAMs A SAM with education experience and skills or not Is the time use data private to the principal and coach, or is it given to the superintendent? Is the school and principal participating in the SAM process voluntary or were they
required?) 2. You found that principals spend more time on observation of teachers than on analysis
and feedback. Is that correct? What do you make of that? 3. What did you conclude, if anything, about the TimeTrack tool? (Probe on usage, and
missing data—and timely use.) 4. Am I right that secondary schools stayed in the SAM process longer than elementary
schools? 5. Why do principals stop the SAM process? Is this a concern for a possible RCT? 6. How long should a school with a continuing principal stay in the SAM process? 7. What do you know about turnover in the SAM role and is this a concern for an RCT? 8. Should the process change over time for a continuing principal? 9. Is the SAM process cost-effective? 10. If the SAM process really does have a positive effect on student achievement, how long
would it need to be in effect with a continuing principal in a school before it would translate into improved student achievement? Are there shorter-term outcomes besides student achievement you might consider based on your study?
11. In your work, what were the most helpful sources of information about the SAM process and how it works and to what effect? Why were they helpful? What was the least helpful and why?
12. Was attending the national conferences helpful? What unique information did that provide?
13. Was attending the SAM training helpful? What unique information did that provide? 14. Have you learned anything or come to any further insights about the SAM process since
completing your evaluation? If so, what are they and are they described in a document? 15. If you had to do the SAM evaluation over, what, if anything, would you do differently? 16. Do you believe that at this time, the SAM process merits a fully-powered randomized
controlled trial? Why? 17. What makes the SAM process work? What are the key ingredients? (Probe on First
Responders, Daily Meeting, Time Change coach…) 18. What would be the most important ways to improve the SAM process?

61
NSIP Director
I. The Landscape 1. Can you describe the current status of the SAM process/program?
a. How many schools are participating? b. Which models are they using? c. How have these models evolved over time? d. What is the modal model? e. Why have the models changed? f. What is Wallace’s influence?
2. What states/locals are most likely to engage with the SAM work and adopt SAMs? Why? a. Any particular policy context? b. Type of superintendent? c. School/district context? d. Are some schools/districts/contexts better suited for the SAM model(s)?
3. What are the 2-3 things that have surprised you most about the work with SAM over the years?
4. What is the structure of the NSIP organization? II. Adoption
1. How do schools become engaged with the SAM process? a. Do schools/principals volunteer for the program? If not, how are they selected?
Why? b. Do you recruit? If so, how? c. Do districts generally decide to reach out or individual schools?
2. What do districts hope to accomplish? a. Individual schools/principals? b. Goals for joining? c. Has this evolved or changed over time?
3. State/district adoption? III. Supports
1. What levels and types of support do they receive from NSIP? 2. What is the nature of the interrelationships and interactions between districts/schools and
NSIP? a. Roles of Time Change Coaches? b. Implementation Specialists? c. State Coordinators? d. Other supports and roles? (Probe: full time/part time, sphere of work, number of
schools for each, how allocated, the training and support for these personnel) 3. Do districts provide support for this? How? (Or is the support mainly from the contracted
services with NSIP?) IV. Strengths
1. What are the strengths of the SAM model? What are the weaknesses? Why?

62
2. How do you see it evolving or changing into the future? Why is it evolving and changing?
a. How are new teacher evaluation accountability policies influencing use, adaptation, and importance of SAMs?
V. Challenges
1. What are the barriers or challenges to becoming a SAM school? (Cost? Culture? Time?) 2. What are barriers or challenge to implementing SAM? 3. Why have schools stopped using the SAM process? Is there attrition and turnover out of
the SAM schools? 4. What reasons do SAM-participating districts give for leaving? 5. Are there principals within years who stop participating, tracking their time, etc.? 6. Does NSIP have a means of monitoring this and intervening?
VI. Outcomes
1. How do you measure your success? 2. What about cost-benefit analysis? 3. What about weaknesses? 4. If you had all of these resources, but had to do something different than SAM, what
would it be? VII. Implementation
1. What are the elements of the SAM approach and how does it work, both from your perspective and from the schools’ perspectives? Probe to understand implementation about:
a. Principals’ activities aimed at improving instruction b. TimeTrack, data use c. Daily Meeting—does the conversation go beyond scheduling and reach impact of
practice? d. Coaching e. Professional development f. The First Responders process for management tasks g. Identification by principals of changes in teacher practice associated with
instructional leadership time. 2. How is SAM implemented/enacted in the field? (to the extent not covered above). Who
does what in the schools? How? 3. How have leadership roles in the school changed as a result of SAM participation? 4. Where does the money come from to pay for SAMs? 5. What is the typical length of time for a school/principal to be in SAM?
a. How long does NSIP think a school/principal should stay in the program? Why? 6. Have any states adopted SAM? Districts adopting SAM for all schools in the district?
(Should come from the data sets so no need to ask) 7. What do you see as the key SAM school features?
a. Are there additional optional features? 8. Is there one particular SAM model? Or is there adaptation?
a. How are schools adapting to their unique circumstances?

63
b. What on the dimensions on which they vary, in addition to the time-coach? 9. What is the NSIP perspective on the implementation and adaptation? 10. What do you think explains district-to-district variation in implementation beyond just
choice of a different model? VIII. The Engine
1. What is the theory of action behind the SAM model? What changes happen most because of SAMs?
2. How has the theory of action changed over time? 3. What do you see as intermediate action, intermediary variables, and proximate outcomes,
and longer-term effects? IX. Our Project Work
1. What would you be most interesting in learning from our project work? 2. Are the similar SAMs like tools/proposes in use that you are aware of? 3. Would you like to see a randomized controlled trial conducted of SAM? Why or why
not?

64
NSIP Implementation Specialist
Personal Role 1. What is your role at NSIP, and what is your job description? 2. How long have you been at NSIP? What is your background?
I. The Landscape
1. Can you describe the current status of the SAM program? a. How many schools are participating? b. Which models are they using? c. How have these models evolved over time? d. What is the modal model? e. Why have the models changed? f. What is Wallace’s influence?
2. What states/locals are most likely to engage with the SAM work and adopt SAMs? Why? a. Any particular policy context? b. Type of superintendent? c. School/district context? d. Are some schools/districts/contexts better suited for the SAM model(s)?
3. What are the 2-3 things that have surprised you most about the work with SAM over the years?
4. What is the structure of the NSIP organization? II. Adoption
1. How do schools become engaged with SAMs? a. Do schools/principals volunteer for the program? If not, how are they selected?
Why? b. Do you recruit? If so, how? c. Do districts generally decide to reach out or individual schools?
2. What do districts hope to accomplish? a. Individual schools-principals? b. Goals for joining? c. Has this evolved or changed over time?
3. State/district adoption? III. Supports
1. What levels and types of support do they receive from NSIP? 2. What is the nature of the interrelationships and interactions between districts/schools and
NSIP? a. Roles of Time Change Coaches? b. Implementation Specialists c. State Coordinators d. Other supports and roles? (Probe: full time/part time, sphere of work, number of
schools for each, how allocated, the training and support for these personnel) 3. Do districts provide support for this? How? (Or is the support mainly from the contracted
services with NSIP?)

65
IV. Strengths
1. What are the strengths of the SAM model? What are the weaknesses? Why? 2. How do you see it evolving or changing into the future? Why is it evolving and
changing? a. How are new teacher evaluation accountability policies influencing use,
adaptation, and importance of SAMs? V. Challenges
1. What are the barriers or challenges to becoming a SAM school? (Cost? Culture? Time?) 2. What are barriers or challenge to implementing SAM? 3. Why have schools stopped using SAMs? Is there attrition and turnover out of the SAM
schools? 4. What reasons do SAM-participating districts give for leaving? 5. Are there principals within years who stop participating, tracking their time, etc.? 6. Does NSIP have a means of monitoring this and intervening?
VI. Outcomes
1. How do you measure your success? 2. What about cost-benefit analysis? 3. What about weaknesses? 4. If you had all of these resources, but had to do something different than SAM, what
would it be?
VII. Implementation 1. What are the elements of the SAM approach and how does it work, both from your
perspective and from the schools’ perspectives? Probe to understand implementation about:
a. Principals’ activities aimed at improving instruction b. TimeTrack, data use c. Daily Meeting—does the conversation go beyond scheduling and reach impact of
practice? d. Coaching e. Professional development f. The First Responders process for management tasks g. Identification by principals of changes in teacher practice associated with
instructional leadership time. 2. How is SAM implemented/enacted in the field? (to the extent not covered above). Who
does what in the schools? How? 3. How have leadership roles in the school changed as a result of SAM participation? 4. Where does the money come from to pay for SAMs? 5. What is the typical length of time for a school/principal to be in SAM?
a. How long does NSIP think a school/principal should stay in the program? Why? 6. Have any states adopted SAM? Districts adopting SAM for all schools in the district?
(Should come from the data sets so no need to ask.) 7. What do you see as the key SAM school features?

66
a. Are there additional optional features? 8. Is there one particular SAM model? Or is there adaptation?
a. How are schools adapting to their unique circumstances? b. What on the dimensions on which they vary in addition to the time coach?
9. What is the NSIP perspective on the implementation and adaptation? 10. What do you think explains district-to-district variation in implementation beyond just
choice of a different model?
VIII. The Engine 1. What is the theory of action behind the SAM model? What changes happen most because
of SAMs? 2. How has the theory of action changed over time? 3. What do you see as intermediate action, intermediary variables, and proximate outcomes,
and longer term effects? IX. Our Project Work
1. What would you be most interesting in learning from our project work? 2. Are the similar SAMs like tools/proposes in use that you are aware of? 3. Would you like to see a randomized control trial conducted of SAM? Why or why not?

67
NSIP Data Processing Specialist
Personal Role 1. What is your role at NSIP? Do you interact with the schools? 2. How long have you been at NSIP? What is your background?
I. Data Management
1. What changes have you noticed in NSIP, SAM, and the time tracking software? 2. What is the quality of the data that you are collecting and how complete are the data that
you’re collecting? 3. Are there things you wish you were collecting that you are not? 4. What are common issues that you have experienced or heard about regarding the
implementation and use of the software? 5. What is missing, and what is most problematic? 6. How do you monitor data quality? 7. What data, if any, are you collecting to see if the SAM initiative is productive? 8. What supports do schools need in order to use the time tracker?
II. Supports
1. What levels and types of support do they receive from NSIP? 2. What is the nature of the interrelationships and interactions between districts/schools and
NSIP? a. Roles of Time Change Coaches? b. Implementation Specialists?
c. State Coordinators? d. Other supports and roles? (Probe: full time/part time, sphere of work, number of schools
for each, how allocated, the training and support for these personnel) 3. Do districts provide support for this? How? (Or is the support mainly from the contracted
services with NSIP?) III. Strengths
1. What are the strengths of the SAM model? What are the weaknesses? Why? 2. How do you see it evolving or changing into the future? Why is it evolving and
changing? a. How are new teacher evaluation accountability policies influencing use,
adaptation, and importance of SAMs? IV. Challenges
1. What are the barriers or challenges to becoming a SAM school? (Cost? Culture? Time?) 2. What are barriers or challenge to implementing SAM? 3. Why have schools stopped using SAMs? Is there attrition and turnover out of the SAM
schools? 4. What reasons do SAM-participating districts give for leaving? 5. Are there principals within years who stop participating, tracking their time, etc.? 6. Does NSIP have a means of monitoring this and intervening?

68
V. Outcomes 1. How do you measure your success? 2. What about cost-benefit analysis? 3. What about weaknesses? 4. If you had all of these resources, but had to do something different than SAM, what
would it be?

69
Time Change Coach I. General Questions Let us talk a little about your history with the SAM process.
1. How did you get into the SAMs work? 2. How long have you been doing this? 3. What types of preparation have you had to be a coach?
• General (coaching training, supervising principals) • SAM specific (check quality & sufficiency)
4. How many schools have you worked with over time? 5. What levels of schools have you worked with? 6. Besides the extra income, what appeals to you about being a Time Change Coach? • What do you get personally out of it? • What do you get to give? 7. When we look at coaches from the outside, it looks a bit like you are out there somewhat
on your own. Is that an accurate assessment? Explain. 8. What are your linkages back to the general SAMs operation at NSIP?
• How much contact? • What is the nature of the contact? • What is the form of the contact?
9. In general, when you work with a school, what is your connection to the district? 10. What are some of the things that make the coaching part of the SAM initiative work
well? 11. What are the general challenges? 12. Can you tell us a bit about your work with the Implementation Specialists? 13. Any linkages with First Responders? 14. Do you also work with the SAMs? 15. If I asked you who you worked for, what would you tell me?
II. Focus on Target School Questions Set Pick a school that you are a coach at now. Someplace where you have been around long enough to talk knowledgeably about the SAMs operation there [OR, we assign a school]. Let us talk about the past four weeks or so. We want to zero in on your work during that time. Walk us through that time at __________ (use name of school). [10 minutes for the coach to provide the narrative]
1. How much time was invested during that four weeks? [Probe into the narrative; e.g., I heard you say that there were two on site meetings, is that correct? I get a sense that you are doing a lot of preparation work for each meeting; can you elaborate on that a bit?]
2. What types of help/guidance/facilitation do you provide at _________ (use name of school)? [Use narrative]
3. How would you describe the "what" of coaching, what is going on? [Probe into the narrative]
4. In a single word or phrase besides the word "coach," describe your role. 5. What is the role of data in your coaching work? (SAMs with an eye open for other data
too) • What data? • How used?

70
Benefits If someone were to ask you to show that you were adding value to the leadership capacity of ___________ (name of principal—not school),
1. What domains would you highlight (e.g., decision making, interpersonal relations with teachers; time management)? That is, where is the principal better off for having worked with you?
2. What evidence would you bring to the table in each of those domains that there has been improvement (e.g., in interpersonal relations with teachers; trust is increasing)?
Let's turn to the school for a minute. 3. Where would you have one look to see value added at __________ (name of school)
(e.g., teacher motivation, implementation of a targeted instructional practice)? 4. Again, what evidence would you bring to the table around the domains of value added
you just noted (e.g., teacher motivation)? 5. What is the one best contribution you have given to ________ (use name of school)?
III. End Question 1. Is there anything else you would like to tell us about your role of SAMs coach?

71
Case School Principals
A. GETTING STARTED 1. How did ________________ (school name) get involved with the SAM initiative?
• Why did you decide to adopt the SAM process? • How long have you been involved with the SAM program?
2. How much of the decision to work with the project was yours? 3. Do you or the district pay for the initiative? How (operating funds, grants?) How has that
changed over time? B. IMPLEMENTATION OVERALL
1. On a scale of 1 to 10 how smooth has the implementation process been?
1 2 3 4 5 6 7 8 9 10 Really bumpy
Smooth as silk
2. How is it working overall now?
1 2 3 4 5 6 7 8 9 10
Not so great
Excellently
3. From your perspective, what were the most important things that happened to get the
SAM process up and running in your school? (listen for district action, school variables, and SAM program components but do not probe on these.)
4. As you think back over the implementation process, what is the one piece of the system that was (has been) most critical? Why? (no probes)
5. What were the challenges in getting the SAMs initiative going? 6. What ongoing challenges does _____________ (use school name) face around the SAM
process? BENEFITS
1. What benefits has the SAM process brought to you as a leader, not to the school but to you?
2. What benefits have come to ____________ (use name of school) because of the SAM work? (Listen for:) • Mission: Clarity of mission/goals of the school; sense of integration, cohesion,
alignment • Culture: Changes in relationships among teachers; Involvement of staff; Sense of
community • Instructional Program: Changes in teaching in classrooms; Use of time (school, and
classrooms); Influence on data (collection, analysis, use) • Student Outcomes: Engagement; Learning results
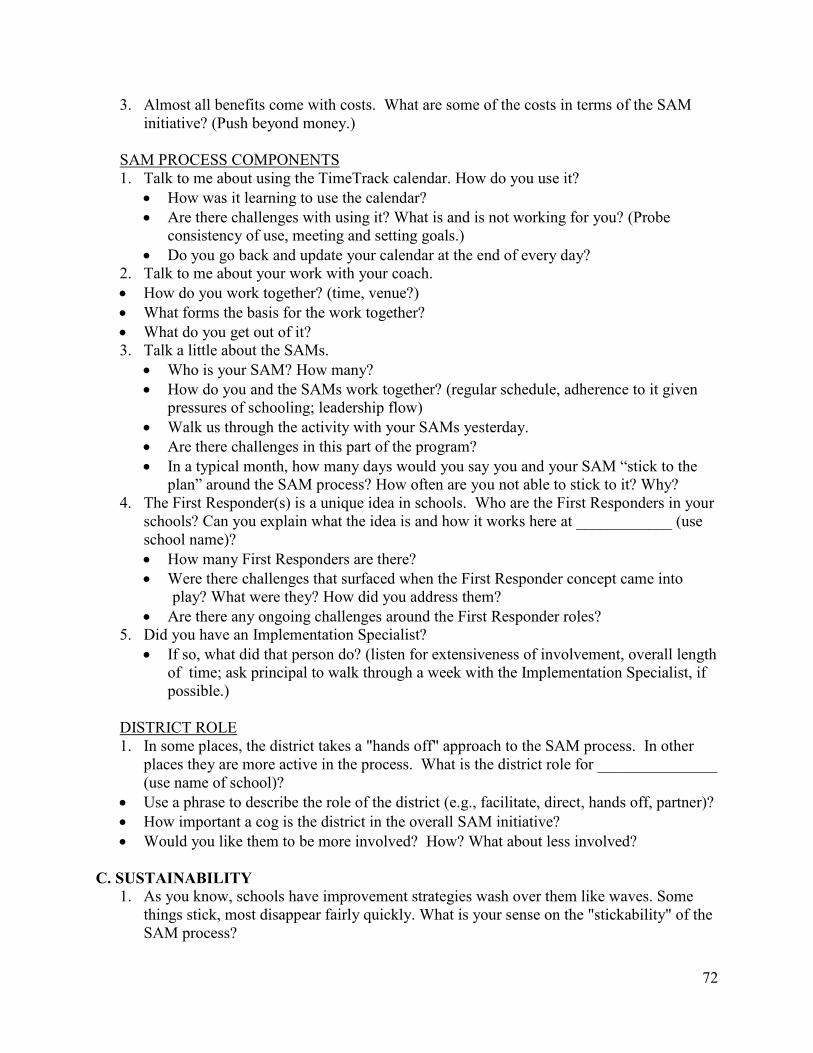
72
3. Almost all benefits come with costs. What are some of the costs in terms of the SAM initiative? (Push beyond money.)
SAM PROCESS COMPONENTS
1. Talk to me about using the TimeTrack calendar. How do you use it? • How was it learning to use the calendar? • Are there challenges with using it? What is and is not working for you? (Probe
consistency of use, meeting and setting goals.) • Do you go back and update your calendar at the end of every day?
2. Talk to me about your work with your coach. • How do you work together? (time, venue?) • What forms the basis for the work together? • What do you get out of it? 3. Talk a little about the SAMs.
• Who is your SAM? How many? • How do you and the SAMs work together? (regular schedule, adherence to it given
pressures of schooling; leadership flow) • Walk us through the activity with your SAMs yesterday. • Are there challenges in this part of the program? • In a typical month, how many days would you say you and your SAM “stick to the
plan” around the SAM process? How often are you not able to stick to it? Why? 4. The First Responder(s) is a unique idea in schools. Who are the First Responders in your
schools? Can you explain what the idea is and how it works here at ____________ (use school name)? • How many First Responders are there? • Were there challenges that surfaced when the First Responder concept came into
play? What were they? How did you address them? • Are there any ongoing challenges around the First Responder roles?
5. Did you have an Implementation Specialist? • If so, what did that person do? (listen for extensiveness of involvement, overall length
of time; ask principal to walk through a week with the Implementation Specialist, if possible.)
DISTRICT ROLE
1. In some places, the district takes a "hands off" approach to the SAM process. In other places they are more active in the process. What is the district role for _______________ (use name of school)?
• Use a phrase to describe the role of the district (e.g., facilitate, direct, hands off, partner)? • How important a cog is the district in the overall SAM initiative? • Would you like them to be more involved? How? What about less involved?
C. SUSTAINABILITY
1. As you know, schools have improvement strategies wash over them like waves. Some things stick, most disappear fairly quickly. What is your sense on the "stickability" of the SAM process?

73
2. In the big picture of helping you be a stronger leader, how important is the SAM process (1-10 scale)?
1 2 3 4 5 6 7 8 9 10
Not at all important
Extremely important
3. In the big picture of improving things for students, teachers, and staff, how important is
the SAM process (1-10 scale)?
1 2 3 4 5 6 7 8 9 10 Not at all important
Extremely important
4. If the resources to support the SAM work dried up, what would you do? 5. What would you give up to keep it?
D. SUMMATIVE
1. If approached by a colleague who had the opportunity to bring the SAM process to her school, what would you tell your friend?
2. Is there anything else we should know about the SAM process at _____________ (use name of school)?

74
Case School SAMs SET QUESTIONS
1. Tell us a bit about yourself and what you do for the school for your full time job—not as a SAM.
2. How did the SAM work become part of your responsibilities? 3. Are you the only SAM at ___________ (use name of school) or do you have SAM
colleagues? 4. Can you explain your specific role as a SAM in the program at ____________ (use name
of school)? • Probes: What do you do? How long do you meet for the daily conversation? How do
you use the TimeTrack calendar? Who do you meet with? Does the principal keep up with changing his/her calendar each day to reflect the actual time use? What do you do to support principal’s follow-through on their goals?
5. How long have you been a SAM? 6. Has the role changed over time? (in this school as well as overall) 7. If so, in what ways? 8. If I asked you what is the most important thing you do as a SAM, what would you say? 9. Are there other important things you do as a SAM? 10. How did you learn to become a SAM? How were you trained? (Probe about quality of
implementation and learning the role) 11. What is most difficult to do in this role? How long does it take to learn? What might
account for success in this role versus difficulty? 12. What do you do when you see your principal not following through? 13. How do you view your position doing this along with your other responsibilities and roles
that you were doing before? TARGET QUESTIONS
14. Can you walk us through the last week of your SAM work at ___________ (use name of school)? (Push for day-by-day analysis; push for records/documents as foundation of narrative.)
15. It sounds as if you (or the principal or….) is the key framer of the work. Did I hear that right?
16. I heard that the system runs pretty regularly (or I heard that getting the meetings in was tough). Can you talk a little more about this?
17. You know what you describe is not the norm at most American schools. Why do you think the SAM initiative is here at ________ (use name of school)?
18. From where you sit, how has the district responded to the SAM initiative? 19. Has being a SAM changed your relationship with the principal? 20. If so, in what ways? 21. Principals are pretty independent characters. How did your principal take to being more
boxed in? 22. Do you work at all with any of the other SAM roles? (coaches, First Responders,
Intervention Specialist) 23. Can you walk us through today's (or yesterday's) AM meeting? (Push for artifacts from
the meeting; probe for questions around working dynamics, balance of influence,

75
specifics of work, vitality of plan, adherence to yesterday's plan and other issues around accountability).
24. In a typical month, how many days would you say you and your principal “stick to the plan” around the SAM process? How often are you not able to stick to it? Why?
OUTCOMES
25. What benefits do you see emerging from the SAM work? 26. Has it led to change on the part of principal? Has it led to change on the part of teachers
(e.g., how they think about the principal)? 27. Do you think that the children notice it? Has the SAM process impacted them in any
way? 28. Have connections and relationships with parents and communities changed?
CLOSING QUESTION
29. Is there anything else you would like to tell us here at _________________ (use name of school)?

76
Case School First Responders
A. GENERAL 1. Can you give us a picture of the First Responder part of the SAM initiative here at
___________ (use school name)? • So there are _______ First Responders. Is that right? • And each has a specific responsibility? Detail. • How has the SAM process changed your role – what do you do differently since
SAM? • How were you trained? • Is it working? • How do you interact with the SAM(s)? • How do you interact with the principal now different from before the SAM process? • What changes have you noticed in the school since you became a First Responder?
2. What is the rationale for introducing the First Responders concept? That is, what are the goals of this part of the SAM initiative? • Protect time of principal? • Create better customer relations? • Make things clearer and more efficient for teaching staff?
3. It looks like each First Responder is dedicated to a specific task area? • Does that sound right? • Is there any collective work among the First Responders? • Have the first responders helped you reach your goals for implementing the SAM
process in your school? • How and why, or why not? (In other words, is it working to free up time for the
principal to focus on instructional matters?) 4. What challenges has the school faced in getting the First Responders intervention up and
running? 5. Is it real/meaningful? Do people find it helpful or is it simply another organizational
system layered on top of everything people are already doing? (Set up as a continuum.) Want to know if it helps the principal be a more focused instructional leader.
6. By and large: • How have the teachers taken to it? • How have the staff taken to it? • How have the parents taken to it? • How has the principal taken to it? • How have district folks responded to it when the principal is not available?
7. What role did the Intervention Specialist play in getting First Responders identified and job ready?
8. What are: • The benefits you have seen from using First Responders at _________ (use school
name)? • Any downsides you have noticed? (check two questions against questions 2 and 5
above)

77
B. SPECIFIC ROLE 1. OK, let's talk more specifically about your role as a First Responder. • You are First Responder for what task(s)? • How long have you been a First Responder? 2. Ok, can you tell us how you enacted your First Responder responsibilities for the last few
days? Are these things typical? • Amount of time? • Contact with whom? • The response of the initiating parties • Outcomes of contacts?
C. CLOSING
1. Anything else we should know about First Responders at _____________ (use name of school)?

78
Case District Officials A. GETTING IN
1. Is the SAM process a district initiative, or did the schools pick it up on their own? • If district: What percent of the schools are using the SAM process (check for
information on school levels, experience of principals, etc.) • If not all: How is the decision to become involved made? (What are the criteria?) • If a combination of both: How does district recruit – or find schools, and what criteria
do you use? How do you recruit schools? (Probe for volunteer, strong suggestion, requirement... Strong-armed?)
2. How did the district find out about the SAM process? (If applicable) 3. Why was the decision made to use the SAM process? (If applicable) 4. How is the SAM process funded? (regular operating budget, grant, school vs. district
money, etc.) 5. Can you describe the relationship (connection) between the district and SAM central
office at NSIP? • Has this relationship changed over time? If so, how?
6. In some places, the district takes a hands off approach with the SAM process. In other places, they are more active in the process. What is the story here in _______________ (use name of district)?
• Use a phrase to describe the role of the district (e.g., facilitate, direct, hands off, partner). • How important a cog is the district in the overall SAM initiative? • If schools in your district have adopted the SAM process on their own (rather than via the
district), does the district provide them support? If so, what and how?
B. IMPLEMENTATION OVERALL NOTE: CLARIFY FOR INTERVIEWEE WHAT WE MEAN BY “IMPLEMENTATION;” IT IS NOT THE FIRST FEW WEEK OF SAM TRAINING.
1. On a scale of 1 to 10, how smooth has the implementation process been?
1 2 3 4 5 6 7 8 9 10 Really bumpy
Smooth as silk
Why did you rank it this way?
2. How is it working overall?
1 2 3 4 5 6 7 8 9 10 Not so great
Excellently
Why did you rank it this way?

79
3. From your perspective, what were the most important things that happened to get the SAM process up and running? (Listen for district action, school variables, and SAM program components but do not probe on these.)
4. As you think back over the implementation process, what is the one piece of the system that was (has been) most critical? Why? (no probes.)
5. What were the challenges in getting the SAM initiative going? 6. What ongoing challenges does _____________ (use district name) face around the SAM
process? • To what extent is there consistent implementation across all schools using SAM
process in your district? • What do you consider to be strong implementation? Weak implementation? • What factors, in your opinion, might account for those principals who are using the
SAM process as designed versus those who do not. 7. How long would you say it takes to have good implementation?
SAM PROCESS COMPONENTS
1. What can you tell me about how the overall SAM process works, the "workings" of the system? • How long should a given principal in a given school continue on the SAM process? • How long do principals tend to stay with the SAM process in this district? (RB note:
They might not be able to answer this, as we typically have schools new to the district.)
• PROBE: o Initial visit and explanation)? o Implementation specialist o Coach (check to see if coach is district person) o SAMs o First Responders o Other aligned PD
2. What is the role of the district in the SAM process? • What supports, if any, does the district provide to SAM schools (e.g., coaching)? • Are there district level personnel responsible for SAM implementation, monitoring or
other tasks? How many? What roles? What proportion of their time is allocated to SAM work?
• How is the district evaluating the SAM process? NSIP ROLE
1. How involved is NSIP at the various stages of adoption? (If applicable) • Before adoption • Getting the system implemented • Ongoing implementation
C. BENEFITS
1. What benefits have come to ____________ (use name of district) because of the SAMs work?
2. What benefits have come to the schools because of the SAM process? (listen for)

80
• Mission/direction • School culture • Instructional program • Student outcomes 3. Almost all benefits come with costs. What are some of the costs associated with the SAM
initiative? D. SUSTAINABILITY
1. As you know, schools have improvement strategies wash over them like waves. Some things stick, most disappear fairly quickly. What is your sense on the "stickability" of the SAM process?
2. In the big picture of helping your principals to be stronger leaders, how important is the SAM process (1-10 scale)?
1 2 3 4 5 6 7 8 9 10
Not at all important
Extremely important
Why did you rank it this way?
3. In the big picture of improving things for students, teachers, and staff, how important is the SAM process (1-10 scale)?
1 2 3 4 5 6 7 8 9 10
Not at all important
Extremely important
Why did you rank it this way?
4. If the resources to support the SAM work dried up, what would you do? What would you give up to keep it?
F. SUMMATIVE
1. If approached by a colleague who had the opportunity to bring the SAM process to her district, what would you tell your friend?
2. If you could change anything about the SAM process, what would you change? 3. Is there anything else we should know about the SAM process at _____________ (use
name of district)?

81
Appendix J: Principal and SAM Surveys and Survey Solicitations
PRESOLICITATION MESSAGE
Dear SAM Teams,
The National SAM Innovation Project has benefited from two external research studies, completed in 2009 and 2011, that led to a series of improvements in the SAM process. As a result, the NSIP Board agreed last year to a smaller study proposed by the Wallace Foundation to determine the feasibility of a much larger and extensive study of SAM schools. In other words, research on whether a large study would be valuable and, if so, how it would be done.
The Wallace Foundation selected Vanderbilt University for this work. Vanderbilt researchers have been working on this study for the last year and now are ready to survey SAM teams. You will receive a request to complete their survey later this week. The request will come through NSIP Technical Coordinator Jim Mercer and will be in the same Survey Monkey form that you’ve seen before. As a result, you cannot be identified if you complete the survey and your individual responses will only be viewed by Vanderbilt research team. The team will use the composite results in its final report to the Wallace Foundation and NSIP Board.
I encourage you to take a few minutes to complete the survey. It is short but will give you an opportunity to reflect on your SAM work.
Thanks for the great work you do every day,
Mark Shellinger NSIP Director
INITIAL SURVEY MESSAGE
Dear SAM Principals,
As Mark Shellinger described in an email earlier this week, for the past year our team from Vanderbilt has been conducting a study of SAM schools on behalf of the Wallace Foundation. The goal of this study is to help NSIP and the Wallace Foundation determine whether a future large-scale, randomized study of the SAM process might be useful and how such a study might be approached.
As part of our current work, we have a short survey about your experience with the SAM process that we ask that you complete. The survey is anonymous, and neither Vanderbilt nor NSIP will be able to identify your response or link it to your school. Results will be reported in aggregate form only. The survey should take approximately 15 minutes. A link to the survey appears below:
[Insert survey link]
A separate survey will also be sent to the SAM(s) in your school.

82
We know that your time is very valuable, so we appreciate you taking a few minutes to complete this short survey. If you have difficulties completing the survey or questions about the study, just respond to this email or contact me at the email address below.
Again, thanks!
FIRST REMINDER
Subject: REMINDER: Vanderbilt University Survey of SAM Principals
Dear SAM Principals,
Last week we contacted you about a study of SAM schools that our team at Vanderbilt is conducting on behalf of the Wallace Foundation in cooperation with NSIP. An important component of the study is a short survey of current principals and SAMs about their experiences with the SAM process.
If you have completed the survey already, thanks so much for taking the time! If you haven’t, this message is just a gentle reminder about the survey and a note that we hope you can find time in the next few days to fill it out.
The survey itself is anonymous, and neither Vanderbilt nor NSIP will be able to identify your response or link it to your school. It should take you only about 15 minutes to complete. A link to the survey appears below:
[Insert survey link]
We really appreciate your time. If you have difficulties completing the survey or questions about the study, just respond to this email or contact me at the email address below.
SECOND REMINDER
Dear SAM Principals,
I hope everyone had an enjoyable Thanksgiving. A few weeks back we sent you a link to a survey as part of a study of SAM schools that our team at Vanderbilt is conducting in cooperation with NSIP and the Wallace Foundation. This is just one last reminder about the survey, which we will close up at the end of this week. Many of you have completed it already, which we really appreciate. If you haven’t had an opportunity to take the survey and tell us about your experiences with the SAM process, you have a few more days!
The survey is anonymous, and neither Vanderbilt nor NSIP will be able to identify your response or link it to your school. It should take you only about 15 minutes to complete. A link to the survey appears below:
[Insert survey link]
Again, many thanks for taking a few minutes to help us out.
83
Principal Survey of SAM Process Thank you for your participation in this study of the SAM process.
Purpose of the Study. A team of researchers from Vanderbilt University has been funded by the Wallace Foundation to conduct a study that examines the on-the-ground implementation of the School Administration Manager (SAM) process. The results of this study will inform decisions about the feasibility of a larger scale randomized control trial study in the future.
Purpose of the Survey. This survey is intended to gather information on principals’ experiences with the SAM process, including information on program implementation, challenges, benefits, costs, and sustainability. A similar survey will be sent to the SAM in your school. Survey results will not be used to evaluate individuals or schools.
Procedures. Completion of the survey should take approximately 15 to 20 minutes. If you have any questions, concerns, or comments about the survey, or difficulties taking the survey, please feel free to contact Richard Blissett at [redacted].
Confidentiality. Your responses to this survey are completely anonymous and will not be viewed by NSIP. Responses will be aggregated into summary form and will never be presented in a way that would permit readers to identify specific schools or respondents. No one at your school, district, or the Wallace Foundation will have access to survey responses.
Participants. All principals involved with the SAM process, as provided to us by NSIP, have been invited to participate in this survey.
Benefits of Participation. Your completion of this survey gives you the opportunity to reflect on your experience with the SAM process. Results from this research will provide insight into the implementation of the SAM process. Research participants should be able to use information from this work to inform continued policy and practice.
Risks of Participation. There are minimal risks associated with your participation in this study.
Voluntary Participation. Your participation in this survey is completely voluntary. You can decide not to participate or to discontinue your participation at any time.
Contact Information. If you should have any questions about this research study, please feel free to contact Dr. Ellen Goldring at [redacted] or [redacted] in the Department of Leadership, Policy, and Organizations at Vanderbilt University.
For additional information about this study, giving consent, or your rights as a participant in this study, please feel free to contact the Vanderbilt University Institutional Review Board Office at [redacted] or toll free at [redacted].
Informed Consent. By clicking this box, you are indicating that you have read and understood the information provided to you about your participation in this survey.
I have read and understood the information.
Thank you very much for your help in this important study!

84
1. Including this year (SY 2014-2015), for how many school years has your current school been participating in the SAM process? 2. Including this year (SY 2014-2015), for how many school years have you as a principal been participating in the SAM process? 3. How important was each of the following factors in your decision to participate in the SAM process? Not at all
important A little
important Somewhat important
Very important
Extremely important
The superintendent or other central office administrator strongly encouraged me to participate.
District requirement I wanted help with administrative tasks.
I wanted to spend more time on instructional tasks.
I wanted to improve my skills as an instructional leader.
I wanted to achieve a better work-life balance
The decision of a previous principal at the school
Other (please specify)
4. Who is your SAM (or SAMs)? (Check all that apply.)
Secretary Assistant Principal School Business Manager/Bookkeeper Teacher
Other (please specify) 5. Has your SAM changed since you have been in the program in this school? (Note: Exclude those changes that occurred because you changed schools or your SAM left the school.) Yes No
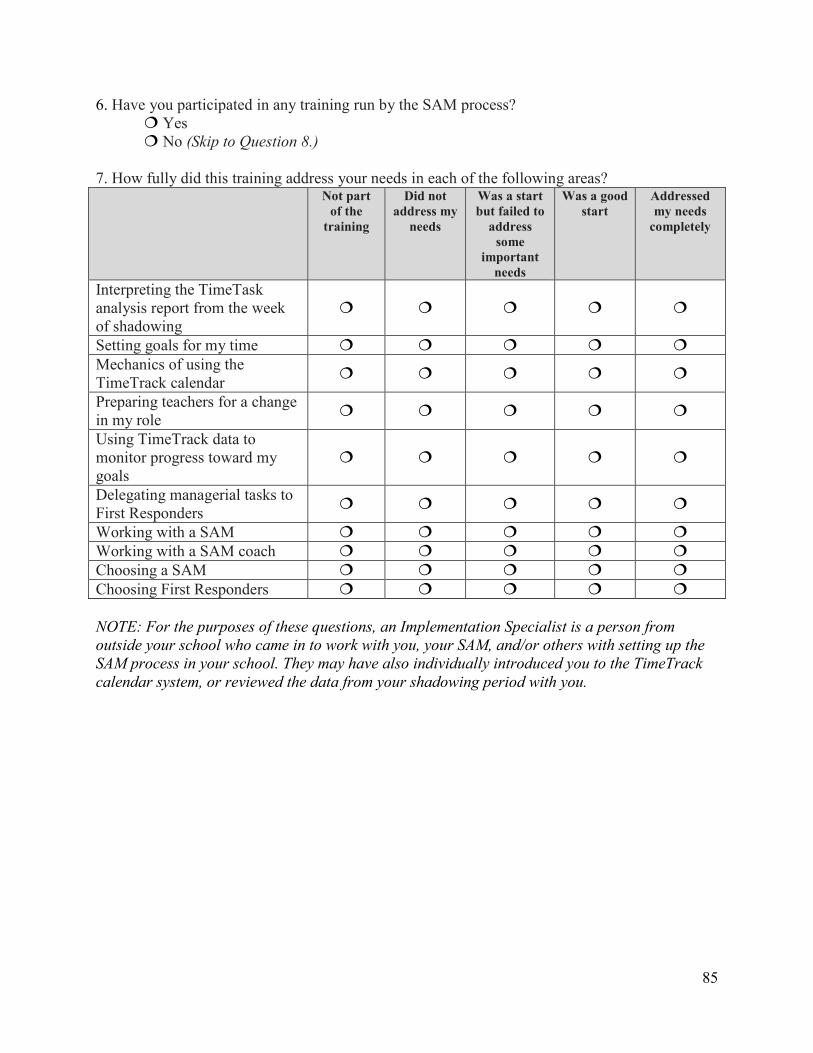
85
6. Have you participated in any training run by the SAM process? Yes No (Skip to Question 8.)
7. How fully did this training address your needs in each of the following areas? Not part
of the training
Did not address my
needs
Was a start but failed to
address some
important needs
Was a good start
Addressed my needs
completely
Interpreting the TimeTask analysis report from the week of shadowing
Setting goals for my time Mechanics of using the TimeTrack calendar
Preparing teachers for a change in my role
Using TimeTrack data to monitor progress toward my goals
Delegating managerial tasks to First Responders
Working with a SAM Working with a SAM coach Choosing a SAM Choosing First Responders NOTE: For the purposes of these questions, an Implementation Specialist is a person from outside your school who came in to work with you, your SAM, and/or others with setting up the SAM process in your school. They may have also individually introduced you to the TimeTrack calendar system, or reviewed the data from your shadowing period with you.

86
8. Did you work with an Implementation Specialist at the outset of the SAM process? Yes No (Skip to Question 11.)
9. To what extent did the Implementation Specialist assist with each of the following? Not at all To a small
extent To some extent
To a great extent
To an exceptional
extent Teaching me to use my TimeTrack calendar
Teaching my SAM to use my TimeTrack calendar
Discussing helpful time use strategies
Extracting and interpreting data from the TimeTrack calendar
Modeling the SAM Daily Meeting with my SAM
Giving feedback on my interaction with my SAM
Setting up the First Responder system in my school
Choosing a SAM Choosing First Responders 10. Overall, how helpful did you find the Implementation Specialist’s assistance?
Not at all helpful Minimally helpful Somewhat helpful Very helpful Exceptionally helpful
NOTE: For the purposes of these questions, a SAM coach is a person from outside your school who has come in to work with you, your SAM, and/or others regularly after the initial setup of the system to provide feedback and other assistance as part of the SAM process. 11. To what extent does your SAM coach assist with each of the following?

87
Not at all
To a small extent
To some extent
To a large extent
Completely
Teaching me to use my TimeTrack calendar
Teaching my SAM to use my TimeTrack calendar
Discussing helpful time use strategies
Extracting and interpreting data from the TimeTrack calendar
Modeling the SAM Daily Meeting with my SAM
Giving feedback on my interaction with my SAM
Setting up the First Responder system in my school
Helping me to improve my use of instructional time
12. On average, how many hours total would you estimate your SAM coach spends in your school during a typical month? My school does not work with a SAM coach (Skip to Question 14.)
Less than 5 5-9 10-15 16-20 20+
13. Overall, how helpful do you find your SAM coach’s assistance?
Not at all helpful Minimally helpful Somewhat helpful Very helpful Exceptionally helpful
14. To what extent do you do the following using your TimeTrack calendar?

88
Not at all
Less than
once a month
Once a month
Several times a month
Once a week
Several times a week
Daily or
almost daily
Create my schedule Reconcile my calendar to how I actually used my time
Examine what the data say about how I have used my time
Examine the data about how often I implement specific tasks with individual teachers
Examine the data about how often I implement specific tasks with others
Change my schedule to better align with goals
Change my schedule because of what I learned from the TimeTrack data
15. To what extent do you agree with the following regarding First Responders in your school? Not at all
true Rarely true Sometimes
true Mostly
true Always
true There are First Responders with clearly defined areas of responsibility
Office staff use the First Responder system
Based on the issue at hand, teachers know which First Responder to approach
Based on the issue at hand, parents are aware of the appropriate First Responder to approach
The First Responder system helps me use my time effectively
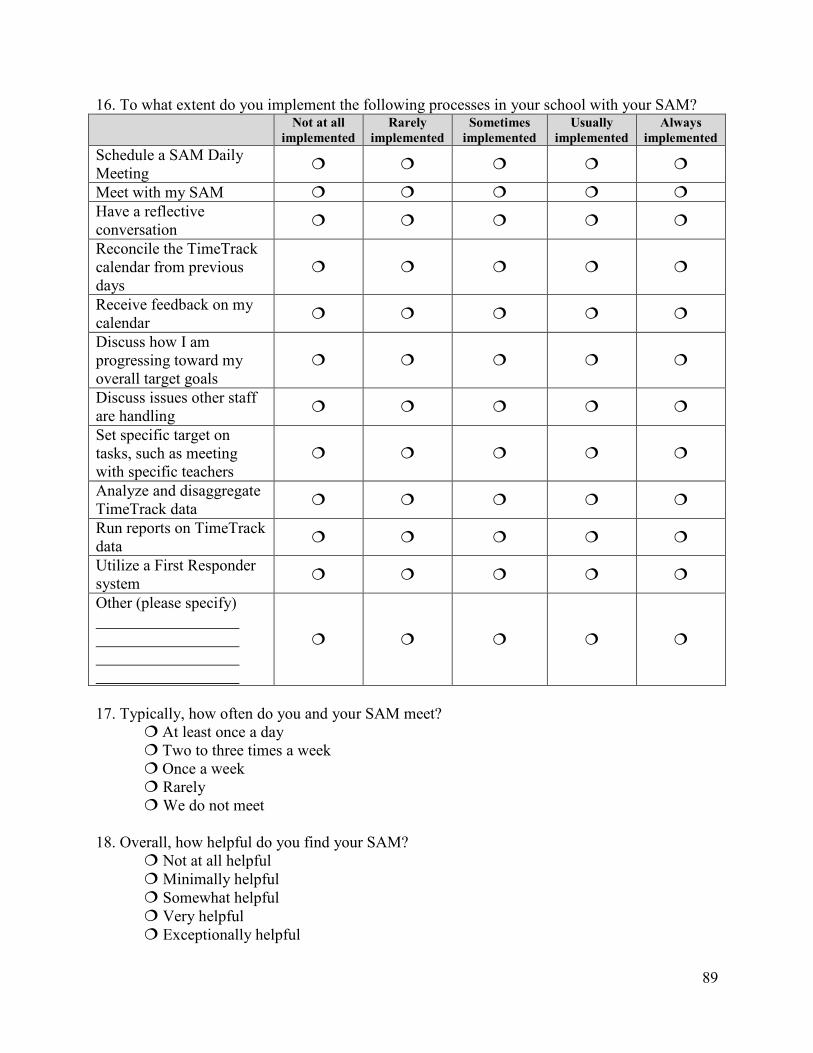
89
16. To what extent do you implement the following processes in your school with your SAM? Not at all
implemented Rarely
implemented Sometimes
implemented Usually
implemented Always
implemented Schedule a SAM Daily Meeting
Meet with my SAM Have a reflective conversation
Reconcile the TimeTrack calendar from previous days
Receive feedback on my calendar
Discuss how I am progressing toward my overall target goals
Discuss issues other staff are handling
Set specific target on tasks, such as meeting with specific teachers
Analyze and disaggregate TimeTrack data
Run reports on TimeTrack data
Utilize a First Responder system
Other (please specify)
17. Typically, how often do you and your SAM meet?
At least once a day Two to three times a week Once a week Rarely We do not meet
18. Overall, how helpful do you find your SAM?
Not at all helpful Minimally helpful Somewhat helpful Very helpful Exceptionally helpful

90
19. How would you characterize the overall challenge in getting the SAM process up and running in your school?
Very easy Very difficult
20. To what extent are the goals of the SAM process (as stated by the NSIP) integrated into the life of the school?
Completely separated
Fully integrated
21. To what extent has the SAM process increased your focus on teaching and learning?
Not at all Tremendously
22. To what extent are changes occurring in classrooms because of the SAM process?
Not at all Tremendously
23. To what extent is the SAM process helping you to… Not using
the calendar
Not at all A little Somewhat A lot
Manage time Improve work/life balance Increase time spent on instruction
Improve instruction in the school Improve student achievement in the school
24. What is the likelihood of your school continuing to participate in the SAM process for the foreseeable future? 0% chance 25%
chance 50% chance 75%
chance 100% chance
If you remain as principal If you are no longer principal at the school

91
25. Including this year (SY 2014-2015), for how many school years have you been a principal at this school? 26. Including this year (SY 2014-2015), for how many school years have you been a principal at any school? 27. What is the lowest grade served by your school? PK K 1 2 3 4 5 6 7 8 9 10 11 12
28. What is the highest grade served by your school? PK K 1 2 3 4 5 6 7 8 9 10 11 12
29. Which of the following best describes this school? Regular school – elementary or secondary
Charter school Special program emphasis school – such as a science or math school, performing arts
school, talented or gifted school, foreign language immersion school, magnet, career/technical, alternative, special education
30. Approximately how many students are in your school? Below 250 250 to 700 Above 700 31. Approximately what percent of students are eligible for free and reduced price lunch in your school? Below 30% 30% to 75% Above 75%
92
SAM Survey of SAM Process Thank you for your participation in this study of the SAM process.
Purpose of the Study. A team of researchers from Vanderbilt University has been funded by the Wallace Foundation to conduct a study that examines the on-the-ground implementation of the School Administration Manager (SAM) process. The results of this study will inform decisions about the feasibility of a larger scale randomized control trial study in the future.
Purpose of the Survey. This survey is intended to gather information on SAMs’ experiences with the SAM process, including information on program implementation, challenges, benefits, costs, and sustainability. A similar survey will be sent to the principal in your school. Survey results will not be used to evaluate individuals or schools.
Procedures. Completion of the survey should take approximately 15 to 20 minutes. If you have any questions, concerns, or comments about the survey, or difficulties taking the survey, please feel free to contact Richard Blissett at [redacted].
Confidentiality. Your responses to this survey are completely anonymous and will not be viewed by NSIP. Responses will be aggregated into summary form and will never be presented in a way that would permit readers to identify specific schools or respondents. No one at your school, district, or the Wallace Foundation will have access to survey responses.
Participants. All SAMs involved with the SAM process, as provided to us by NSIP, have been invited to participate in this survey.
Benefits of Participation. Your completion of this survey gives you the opportunity to reflect on your experience with the SAM process. Results from this research will provide insight into the implementation of the SAM process. Research participants should be able to use information from this work to inform continued policy and practice.
Risks of Participation. There are minimal risks associated with your participation in this study.
Voluntary Participation. Your participation in this survey is completely voluntary. You can decide not to participate or to discontinue your participation at any time.
Contact Information. If you should have any questions about this research study, please feel free to contact Dr. Ellen Goldring at [redacted] or [redacted] in the Department of Leadership, Policy, and Organizations at Vanderbilt University.
For additional information about this study, giving consent, or your rights as a participant in this study, please feel free to contact the Vanderbilt University Institutional Review Board Office at [redacted] or toll free at [redacted].
Informed Consent. By clicking this box, you are indicating that you have read and understood the information provided to you about your participation in this survey.
I have read and understood the information.
Thank you very much for your help in this important study!
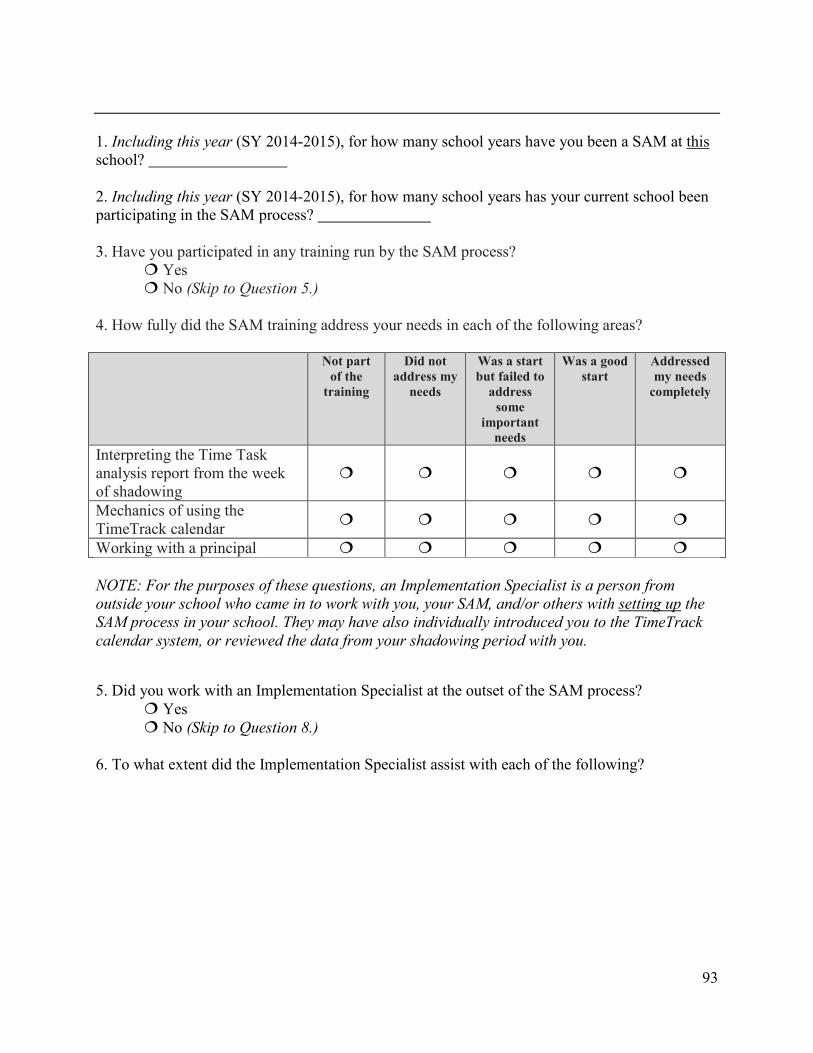
93
1. Including this year (SY 2014-2015), for how many school years have you been a SAM at this school? 2. Including this year (SY 2014-2015), for how many school years has your current school been participating in the SAM process? 3. Have you participated in any training run by the SAM process?
Yes No (Skip to Question 5.)
4. How fully did the SAM training address your needs in each of the following areas? Not part
of the training
Did not address my
needs
Was a start but failed to
address some
important needs
Was a good start
Addressed my needs
completely
Interpreting the Time Task analysis report from the week of shadowing
Mechanics of using the TimeTrack calendar
Working with a principal NOTE: For the purposes of these questions, an Implementation Specialist is a person from outside your school who came in to work with you, your SAM, and/or others with setting up the SAM process in your school. They may have also individually introduced you to the TimeTrack calendar system, or reviewed the data from your shadowing period with you.
5. Did you work with an Implementation Specialist at the outset of the SAM process?
Yes No (Skip to Question 8.)
6. To what extent did the Implementation Specialist assist with each of the following?

94
Not at all
To a small extent
To some extent
To a great extent
To an exceptional
extent Teaching me to use my TimeTrack calendar
Discussing helpful time use strategies
Extracting data from the TimeTrack calendar
Interpreting data from the TimeTrack calendar
Modeling the SAM Daily Meeting with my principal
Giving feedback on my interaction with my principal
7. Overall, how helpful did you find the Implementation Specialist’s assistance?
Not at all helpful Minimally helpful Somewhat helpful Very helpful Exceptionally helpful
NOTE: For the purposes of these questions, a SAM coach is a person from outside your school who has come in to work with you, your principal, and/or others regularly after the initial setup of the system to provide feedback and other assistance as part of the SAM process. 8. On average, how many hours total would you estimate your SAM coach spends in your school during a typical month? My school does not work with a SAM coach (Skip to Question 11.)
Less than 5 5-9 10-15 16-20 20+
9. To what extent has the SAM coach assisted with each of the following?

95
Not at all
To a small extent
To some extent
To a great extent
To an exceptional
extent Teaching me to use my TimeTrack calendar
Discussing helpful time use strategies
Extracting data from the TimeTrack calendar
Interpreting data from the TimeTrack calendar
Modeling the SAM Daily Meeting with my principal
Giving feedback on my interaction with my principal
Helping us implement the First Responder system
10. Overall, how helpful have you found the SAM coach’s assistance?
Not at all helpful Minimally helpful Somewhat helpful Very helpful Exceptionally helpful
11. To what extent do you agree with the following regarding First Responders in your school? Not at all
true Rarely true Sometimes
true Mostly
true Always
true There are First Responders with clearly defined areas of responsibility
Office staff use the First Responder system
Based on the issue at hand, teachers know which First Responder to approach
Based on the issue at hand, parents are aware of the appropriate First Responder to approach
12. To what extent do you implement the following processes in your school with your principal?
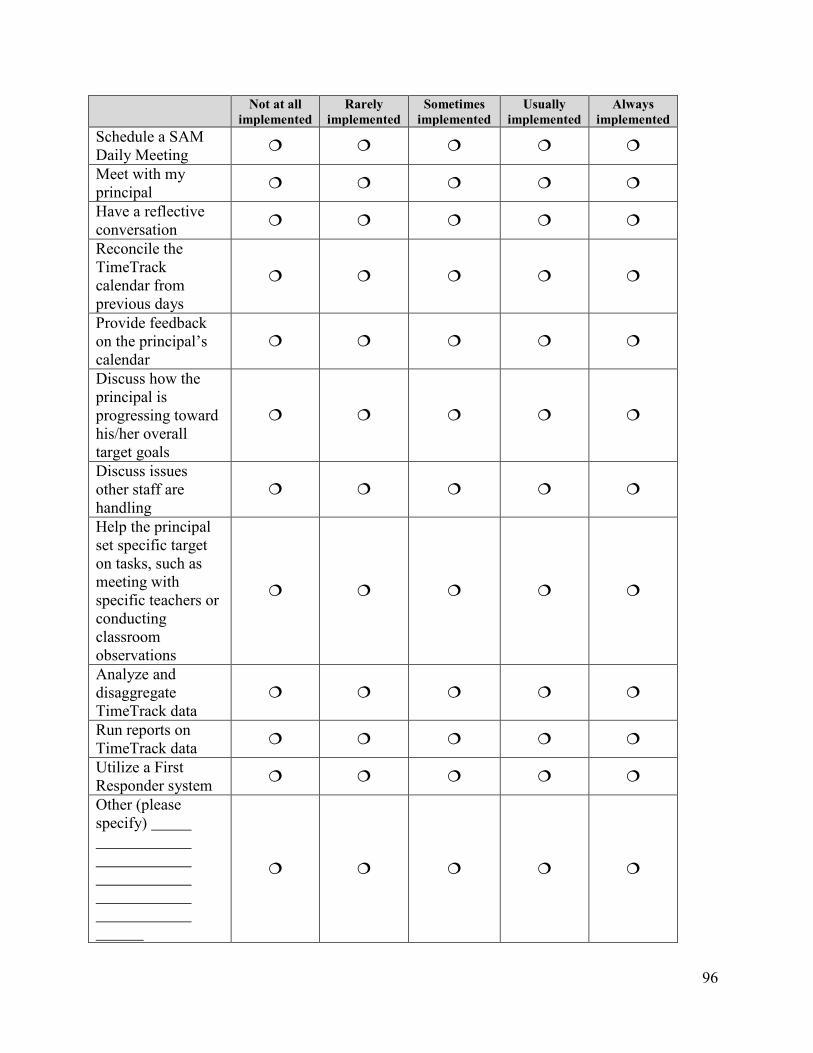
96
Not at all implemented
Rarely implemented
Sometimes implemented
Usually implemented
Always implemented
Schedule a SAM Daily Meeting
Meet with my principal
Have a reflective conversation
Reconcile the TimeTrack calendar from previous days
Provide feedback on the principal’s calendar
Discuss how the principal is progressing toward his/her overall target goals
Discuss issues other staff are handling
Help the principal set specific target on tasks, such as meeting with specific teachers or conducting classroom observations
Analyze and disaggregate TimeTrack data
Run reports on TimeTrack data
Utilize a First Responder system
Other (please specify)

97
13. Typically, how often do you and your principal meet?
At least once a day Two to three times a week Once a week Rarely We do not meet
14. Typically, how long do your meetings with your principal last?
Less than 15 minutes 15 to 30 minutes More than 30 minutes It varies We do not meet
15. How comfortable are you in asking your principal questions about his/her time use?
Not at all comfortable
Exceptionally comfortable
16. How comfortable are you with having difficult conversations with your principal around his/her use of time?
Not at all comfortable
Exceptionally comfortable
17. The following people have access to the principal’s TimeTrack calendar.
Principal Vice principal(s) (How many? ) Counselor(s) Teacher leader(s) School office staff District administrator(s) (excluding SAM coach) SAM coach Other (please specify) 18. How would you characterize the overall challenge in getting the SAM process up and running in your school?
Very easy Very difficult
19. To what extent are the goals of the SAM process (as stated by the NSIP) integrated into the life of the school?
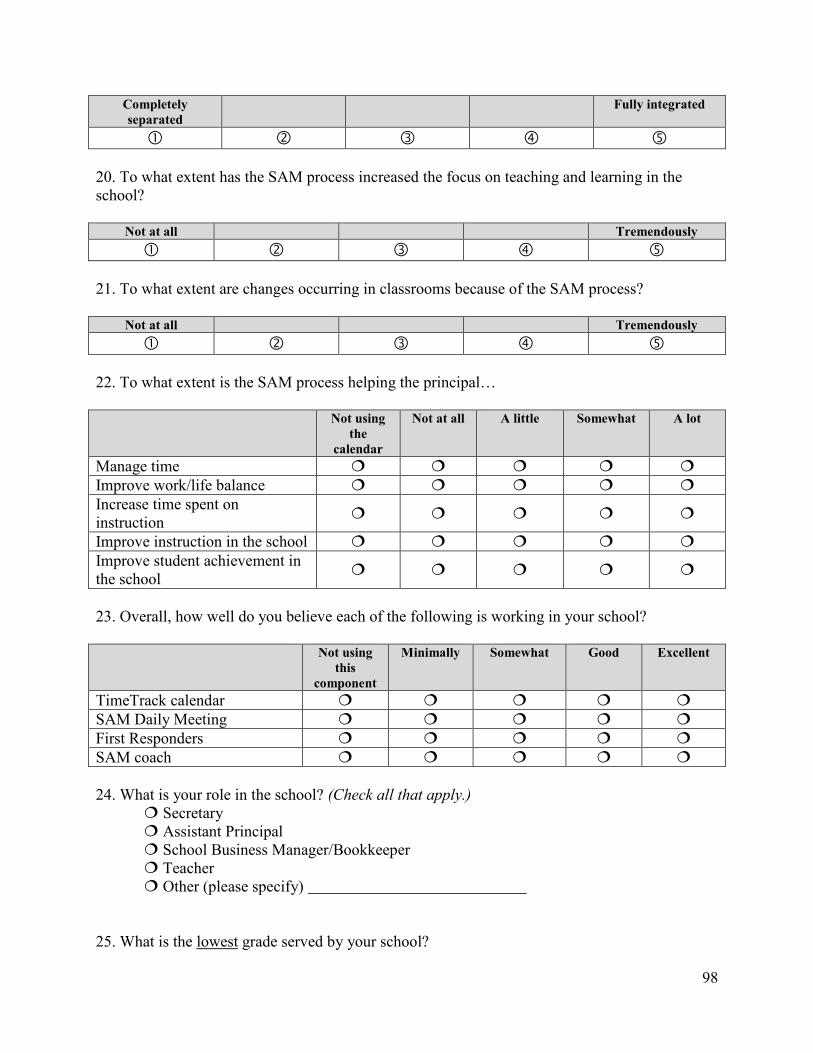
98
Completely separated
Fully integrated
20. To what extent has the SAM process increased the focus on teaching and learning in the school?
Not at all Tremendously
21. To what extent are changes occurring in classrooms because of the SAM process?
Not at all Tremendously
22. To what extent is the SAM process helping the principal… Not using
the calendar
Not at all A little Somewhat A lot
Manage time Improve work/life balance Increase time spent on instruction
Improve instruction in the school Improve student achievement in the school
23. Overall, how well do you believe each of the following is working in your school? Not using
this component
Minimally Somewhat Good Excellent
TimeTrack calendar SAM Daily Meeting First Responders SAM coach 24. What is your role in the school? (Check all that apply.)
Secretary Assistant Principal School Business Manager/Bookkeeper Teacher
Other (please specify) 25. What is the lowest grade served by your school?

99
PK K 1 2 3 4 5 6 7 8 9 10 11 12
26. What is the highest grade served by your school? PK K 1 2 3 4 5 6 7 8 9 10 11 12
27. Which of the following best describes this school? Regular school – elementary or secondary
Charter school Special program emphasis school – such as a science or math school, performing arts
school, talented or gifted school, foreign language immersion school, magnet, career/technical, alternative, special education
28. Approximately how many students are in your school? Below 250 250 to 700 Above 700 29. Approximately what percent of students are on free and reduced price lunch? Below 30% 30% to 75% Above 75%

AbOUt thE WALLAcE FOUndAtiOnThe Wallace Foundation is a national philanthropy that seeks to improve education and enrichment for disadvantaged children and foster the vitality of the arts for everyone. The foundation works with partners to develop credible, practical insights that can help solve important, public problems.
Wallace has five major initiatives under way:
� School leadership: Strengthening education leadership to improve student achievement.
� After-school: Helping cities make good after-school programs available to many more children, including strengthening the financial management capacity of after-school providers.
� building audiences for the arts: developing effective approaches for expanding audiences so that many more people might enjoy the benefits of the arts.
� Arts education: Expanding arts learning opportunities for children and teens. Summer and expanded learning time: Better understanding the impact of high-quality summer learning programs on disadvantaged children, and how to enrich and expand the school day.
� Summer and expanded learning time: Better understanding the impact of high-quality summer learning programs on disadvantaged children, and how to enrich and expand the school day.