making travel safer: victoria’s speed enforcement program
TRANSCRIPT
V I C T O R I A
Auditor General
Victoria
Making travel safer:
Victoria’s speed enforcement
program
Ordered to be printed
VICTORIAN GOVERNMENT
PRINTER July 2006
PP No. 217, Session 2003‐06

ISBN 1 921060 27 1

The Hon. Monica Gould MP The Hon. Judy Maddigan MP President Speaker Legislative Council Legislative Assembly Parliament House Parliament House Melbourne Melbourne
Dear Presiding Officers
Under the provisions of section 16AB of the Audit Act 1994, I transmit my performance audit report on Making travel safer: Victoria’s speed enforcement program.
Yours faithfully
JW CAMERON Auditor‐General 20 July 2006


v
Foreword
Each year in Victoria, hundreds of people are killed and thousands more are injured in road crashes, with significant personal and economic costs for Victorians.
In November 2001, the Victorian Government launched the arrive alive! road safety strategy with the objective of reducing road trauma by 20 per cent by 2007. A key focus of the strategy is on improving compliance with speed limits. The ensuing speed enforcement program has attracted much debate about its purpose and the quality of its delivery. This report examines whether Victoria’s speed detection and enforcement program effectively contributes to safer travel on our roads.
Both the numbers of motorists speeding on our roads and the degree to which they speed have reduced since 2001. Road trauma has also reduced, with current data indicating that the target of 20 per cent fewer fatalities by 2007 will be achieved.
We found no evidence that the speed enforcement program is focused on raising revenue. Speed cameras are used at sites and times that match identified speed risks and crash histories. Sound quality assurance has been introduced to minimise errors in detecting speeding motorists, although some aspects can still be improved.
The program is aimed at deterring motorists from speeding both “anywhere, anytime” across the road network as well as at specific high risk sites, while demerit points are used to ensure that repeat offenders can lose their right to drive. Road safety agencies will need to maintain the effectiveness of each of these elements to ensure that the speed enforcement program continues to contribute to improved road safety across Victoria.
This report will inform the debate around the speed enforcement program and provides important guidance for the future performance of the program.
JW CAMERON Auditor‐General
20 July 2006


vii
Contents
Foreword........................................................................................................................v
1. Executive summary ................................................................................................1 1.1 Road safety and speed enforcement in Victoria ..........................................3
1.2 Has the program been effective?....................................................................31.3 Is the speed enforcement program about risk or revenue?........................41.4 Are the quality assurance processes on the program sound? ...................71.5 Is the penalty system working effectively? ..................................................9
2. Road safety and speed enforcement.................................................................15 2.1 The costs of road trauma ..............................................................................17
2.2 The role of speed in road trauma ................................................................192.3 The Victorian road safety strategy: arrive alive!.........................................212.4 Victoria’s initiatives in speed enforcement................................................222.5 Responsibilities for road safety in Victoria ................................................242.6 About this audit .............................................................................................26
3. Effectiveness of the program .............................................................................27 3.1 Introduction....................................................................................................29
3.2 Are fewer drivers speeding? ........................................................................293.3 Has road trauma reduced?...........................................................................35
4. Targeting speed enforcement activities ...........................................................45 4.1 Introduction....................................................................................................47
4.2 Are the arrive alive! speed enforcement strategies based on sound evidence?.............................................................................................48
4.3 Are statewide resources allocated to maximise deterrence effects and risk reduction?........................................................................................54
4.4 Is deployment of mobile cameras based on risk? .....................................62
5. Quality assurance measures...............................................................................71 5.1 Introduction....................................................................................................73
5.2 Are speed detection devices appropriately maintained, tested and certified? ..................................................................................................78
5.3 Is equipment operated correctly?................................................................84

viii
6. Effectiveness of the penalty system..................................................................91 6.1 Introduction....................................................................................................93
6.2 Are speeding offences recorded and verified effectively? ......................956.3 Are penalties applied effectively? .............................................................100
Appendix A. Conduct of the audit .......................................................................111
Appendix B. Glossary and acronyms...................................................................115

1
1. Executive summary

Executive summary 3
1.1 Road safety and speed enforcement in Victoria
Each year, hundreds of people are killed and thousands more are injured in casualty crashes on Victorian roads. Road crashes translate into enormous personal and economic costs for Victorians.
All road crashes have multiple causes, and speed is estimated to be a factor in more than a quarter of fatal and serious injury crashes. While the risk of driving at high speeds is well known, the risk of lower level speeding is only starting to be appreciated by the community.
arrive alive!, Victoria’s road safety strategy for 2002‐2007 aims to reduce annual fatalities and serious injuries from road crashes by 20 per cent by 20071. A key focus of the strategy is speed and speeding.
Four government agencies have responsibility for the speed enforcement program: VicRoads, Victoria Police, the Department of Justice and the Transport Accident Commission.
This report examines the effectiveness of Victoria’s speed enforcement program. It considers whether: • the program has been effective in reducing speeding and road trauma • the program is focused on reducing risks rather than raising revenue • there are adequate quality assurance measures to ensure accurate and
effective speed detection • the penalty system is effective.
1.2 Has the program been effective?
We examined trends in travel speeds, speeding infringements issued and road trauma, and found improvements in aspects of each of these measures.
VicRoads’ surveys of travel speeds in metropolitan Melbourne’s 60, 70 and 80 km/h speed zones show improved compliance with speed limits. In 2005, for the first time, average travel speeds in these zones were below legal speed limits. However, around 15 per cent of motorists in these zones still travel at speeds above the speed limit.
1 A 20 per cent reduction on the 3‐year average for 1999‐2001.
4 Executive summary
In 100 and 110 km/h speed zones across the state, compliance with speed limits has not improved. Around 15 per cent of motorists are driving several km/h faster than the speed limit in these speed zones, although average speeds (metropolitan Melbourne) and median speeds (country areas) are below the legal limit.
Under arrive alive!, enforcement efforts were increased, with more mobile speed camera hours, new fixed speed camera locations and a reduction in the enforcement threshold. This could potentially have increased both the number and percentage of motorists detected speeding. However, the data we examined shows that the number of speeding infringements issued peaked in 2002‐03 and has since declined. Some of the decline in total numbers of infringements issued has been because fixed camera operations were suspended for a period following problems identified on the Western Ring Road. The number of infringements from mobile cameras and police enforcement has also reduced, giving a strong indication that driver behaviour has changed in response to the increased enforcement effort.
The improvement in compliance is even greater when the effect of a reduced enforcement threshold (which means that motorists who were not previously assessed as speeding were now speeding) is considered.
arrive alive! sets ambitious targets aiming for a 20 per cent reduction in deaths and serious injuries on the road by 2007. During the first 4 years of the strategy (2002‐2005) there has been a reduction of around 16 per cent in fatalities, and approximately 8 per cent in serious injuries.
Road crashes are multi‐causal, and many initiatives, both state and national, are currently underway to reduce road trauma, so we cannot conclude that the improvements are solely due to improved compliance with speed limits. However, the greatest reductions in trauma have been in the lower speed zones, which are the most intensively enforced. There have also been significant reductions in pedestrian trauma and severity of serious injuries – 2 measures sensitive to changes in travel speeds. These factors suggest that improved compliance with speed limits has been a major contributor to trauma reductions.
1.3 Is the speed enforcement program about risk or revenue?
Much of the community sensitivity about speed enforcement centres on concerns that decisions about the program are based on increasing revenue, rather than reducing road trauma.

Executive summary 5
In common with all fine‐based enforcement programs, the speed enforcement program undoubtedly raises revenue. This report demonstrates that revenue raised through speed infringements is still significantly lower than expenditure on road safety.
We assessed the strategic and operational decisions around the program to determine whether they were made with the primary objective of reducing speed‐related road trauma.
We examined whether: • decisions about the statewide speed enforcement strategy were based on
sound evidence of road safety benefits • strategic decisions about allocating resources between police
enforcement, fixed cameras and mobile cameras, target deterrence effects and risk
• operational deployment to mobile camera sites is based on reducing crash risk.
We are satisfied that the speed enforcement initiatives are underpinned by strong evidence and are primarily directed at reducing road trauma, rather than raising revenue.
We found that decisions about the speed enforcement initiatives in the arrive alive! strategy were based on an extensive body of research.
One of these strategies was to make enforcement more unpredictable. However, the impact of the public release of mobile and fixed camera sites will need to be monitored closely into the future to ensure that the benefits of covert enforcement (better compliance with speed limits across the whole road network, not just at known enforcement sites) are not lost.
A review of the speed camera strategy took place in 2003. The review was used to inform the future strategic directions of new and existing speed camera technology in Victoria and to provide a scientific basis for the speed camera strategy. However, given the changes to the automated speed camera systems since then, it may be timely to reconsider a review in the lead in to any subsequent road safety strategy beyond 2007.
We also considered the state‐level allocation of resources between police on‐road enforcement, fixed and mobile speed cameras. To achieve the greatest trauma reductions, we expected to find that the allocation of effort would provide a mix of targeted and network‐wide deterrents.

6 Executive summary
We found that enforcement efforts are broadly aligned with state‐level trauma distribution, and provide a mix of interventions targeted at ”black‐spot” sites and “black‐times”, as well as a level of ”anywhere, anytime” enforcement. We consider that more effort is currently being directed at addressing specific speed risks through overt enforcement than at promoting general deterrence through the “anywhere, anytime” covert enforcement approach.
Over time, speed camera activity has increased, but there has been a decline in police on‐road enforcement activity. Strategically, this creates a risk that the general deterrence benefits across the network provided by random police enforcement are lost.
Mobile and fixed speed camera locations are selected by Victoria Police. There are extensive site selection criteria for mobile speed camera locations, and these are applied by experienced staff. The current requirement that all mobile camera sites should have a documented crash history for the previous 12 months should be reconsidered. Crash risks associated with speed occur anywhere, not just at sites with a crash history.
Documented site selection guidelines for fixed cameras are much less comprehensive. We found that the current fixed camera sites could be justified, however, clearer guidelines would be likely to ensure that the credibility of the system in the future is retained.
Victoria Police allocates mobile camera hours to approved speed camera locations based on a variety of information, including trauma patterns, traffic volume and the number of offenders. This intelligence is not always readily available to, or used well by, traffic management units, which are responsible for rostering.
We found that all sites had either a crash history or an assessed crash risk. We also found that there was a good spread of activity across sites, without an undue focus on particular sites. There was no evidence that sites with the highest infringement rates were targeted for undue intensive enforcement activity.
We found a small number of sites where speed was a persistent problem, with more than 10 per cent of motorists detected speeding ‐ most were in the default urban 50 km/h speed zones. Greater efforts need to be made to deal with these sites if it becomes clear that enforcement at the site is not changing behaviour.

Executive summary 7
Recommendations
1. That Victoria Police reviews the “crash history in the previous 12 months” provisions for site selection for mobile cameras and considers whether 12 months is an appropriate period.
2. That Victoria Police, in consultation with the Department of Justice, VicRoads and the Transport Accident Commission, develops and implements more detailed site selection guidelines for fixed cameras.
3. That Victoria Police: • enhances current traffic intelligence tools • provides regional areas with better access to centralised
intelligence • trains traffic police to understand and use intelligence tools.
4. That Victoria Police and VicRoads develop formal arrangements to jointly review sites where speed remains a problem, and implement additional measures where appropriate.
1.4 Are the quality assurance processes on the program sound?
Significant work has been done to ensure that speed enforcement technology is supported by sound quality assurance processes to prevent a repeat of the problems with fixed cameras identified on the Western Ring Road in 2003. This has included the Department of Justice establishing a business unit dedicated to speed enforcement technology, policy and providing oversight of the management of the speed camera systems.
We examined the quality control measures in place to ensure that all speed detection devices were well‐maintained and accurate, and used according to instructions.
Although it is too early to adequately assess the effectiveness of a number of major changes to the fixed camera system, we did note that the verification systems for fixed cameras have been strengthened, and additional detection technologies have been put in place to ensure that every vehicle detected speeding by a fixed camera is assessed by 2 systems. The current technology in use means that a high proportion of fixed camera infringements are rejected when one system or the other does not capture the vehicle. In 2005, around 50 per cent of detections were rejected.

8 Executive summary
While we support the strengthening of the fixed camera verification system, we are concerned by the high number of speeding detections that are rejected because one of the 2 detection systems fails. However, we are confident that infringements will not be issued to motorists who were not speeding (rather, many speeding motorists will not receive infringements).
The Department of Justice has improved its monitoring of mobile camera maintenance, testing and certification, and we are confident that the monitoring systems ensure that certification requirements are met.
We are satisfied that Victoria Police has good processes for maintaining, testing and certifying its speed enforcement equipment, that the documentation is well maintained and that certification is timely.
We found that the mobile camera program has stringent controls on correct siting and operation of equipment. Victoria Police has recently implemented 6‐monthly site audits to ensure that sites remain compliant with the selection criteria. We found good adherence in most traffic management units although some units’ progress fell short. While we are satisfied that the identified discrepancies have been addressed, continued attention will be needed to ensure the audit process is used effectively.
Since 2005, a suite of control measures has been implemented to reduce the potential for mobile camera operator error. Errors have occurred as a result of operators failing to comply with standard operating requirements. This error rate represented around 0.09 per cent of infringements issued resulting from mobile camera detections in 2004 and 2005.
The control measures include better training, support and supervision of camera operators, and audits of camera operator accreditation by the Department of Justice. In addition, the Department of Justice and the contractor responsible for the speed camera administrative systems have also strengthened quality assurance processes for checking site and speed zone information before any camera images are assessed. This should reduce the risk of issuing invalid infringement notices.
We also found that mobile camera tolerances were consistently applied by camera operators. We found that police generally apply a consistent tolerance, however, individual officers may apply wider tolerances than those given to the automated devices.

Executive summary 9
Recommendations
5. That the Department of Justice addresses the high rejection rate for fixed camera verification systems.
6. That Victoria Police ensures that site audits are conducted as required, and maintains documented records of these audits.
1.5 Is the penalty system working effectively?
When speeding offences are detected, offending motorists should be penalised with a fine and loss of demerit points.
The process from detection to the point where demerit points are allocated to a licensed driver is complex.
We examined the process from the point where the offence is recorded (either by a police officer issuing an on‐the‐spot fine or by an automated detection system) to the point where fines are issued and demerit points are allocated to licences.
We found that while the quality of police on‐the‐spot infringement data was good, there were few quality controls on data entry to ensure accuracy in the future. Victoria Police’s contribution to the penalty system would be enhanced if it introduced a better validation process to safeguard data quality.
We found that there were good controls on speed camera photograph verification, and infringements are issued without undue delay. Many motorists detected speeding by speed camera systems will not receive infringements because of the stringent quality control processes in place which reject detected speed incidents if there is any doubt.
We do not believe the reasons for infringement rejections can be monitored effectively given the large number of different “rejection reason codes” employed. To improve monitoring, the Department of Justice should review and reduce the number of “rejection reason codes” used.
10 Executive summary
Prior to 1 July 2006, formal cautions were being applied in accordance with Victoria Police policy, but drivers with an otherwise clean driving record were not informed that they may be eligible for a caution. Making information on eligibility for a formal caution more widely available may support the other actions the road safety agencies are taking to build community confidence in the speed enforcement program. The Infringements Act 2006, which came into effect on 1 July 2006, has introduced new laws relating to how the formal cautions, now known as official warnings, are issued.
Revenue from fines is projected to increase significantly in 2005‐06, largely as a result of the fixed camera operation recommencing. This will not lead to a net increase in expenditure on road safety, despite the 2005‐06 budget announcement that all speed and red‐light camera fines would be directed to the Better Roads Victoria trust account. This is because there has been a commensurate reduction in the amount of “normal” output appropriation to VicRoads, which makes the initiative budget neutral.
The large amount of uncollected fines, $554 million at 30 June 2004, should decrease as tougher measures being introduced for fine defaulters take effect.
The responsible agencies now need to focus on making the demerit points system effective. Demerit points are used to ensure that drivers who repeatedly break road rules will ultimately lose their right to drive. We found that more than 10 per cent of demerit points issued for speeding could not be allocated to a driver for a number of reasons.
The road safety agencies have identified longer‐term options for addressing this issue, such as improving information technology systems and requiring motorists to carry their licences. However, we consider that changes to business practices, and better follow‐up of data mismatches should be implemented urgently.
Recommendations
7. That the Department of Justice reviews the number of reject reason codes used in the Evidence Management System.
8. That the Department of Justice and Victoria Police communicate the availability of, and conditions for, official warnings more widely.

Executive summary 11
9. That VicRoads, the Department of Justice and Victoria Police urgently implement steps to improve the application of demerit points to the responsible driver through: • improving the provision of licence numbers on police traffic
infringement notices • changing the driver nomination process to improve
information provision • improving the follow‐up of rejection reports • investigating possible modifications to the Driver Licensing
System to improve the matching capabilities of the system.
RESPONSE provided by Secretary, Department of Justice
I believe that the audit report represents a fair and reasonable account of the government’s speed enforcement program. A particular strength of the report is its thorough detailing of the evidence of the road safety focus underpinning speed enforcement activities in Victoria, and the conclusions reached about the value of these activities. The report also provides independent acknowledgement of the significant progress that the government has made in addressing the issues in speed camera management that were highlighted in the report of the 2004 independent Inquiry into the Western Ring Road Fixed Digital Speed Camera System Contract and its Management (the Baragwanath Report).
I agree with the intent of the recommendations in the report and the Department of Justice will work with its road safety partners to continue to improve road safety outcomes, including the effectiveness of the speed enforcement program. In this regard, I acknowledge the importance accorded in the audit to ensuring that the recording of infringements and their subsequent processing is fair and accountable. I believe that this is a clear expectation of what is essentially a criminal justice process, and one which is necessary to underpin public confidence in the management of the speed enforcement program.
The findings and recommendations in the report will assist the development of the new road safety strategy to replace arrive alive! 2002‐07, the government’s current road safety strategy.
The Department of Justice agrees in principle to those recommendations it believes are relevant to its operations (Recommendations 5, 7 and 8).
12 Executive summary
RESPONSE provided by Chief Commissioner, Victoria Police
Victoria Police acknowledges the findings of the Auditor‐General in respect of the issues referred to in the audit report. The recommendations are succinct and address issues that have been previously identified by Victoria Police. Those recommendations are in the process of being actioned.
I would also like to comment on the following 2 matters raised in the executive summary of the report:
• The lack of comprehensive fixed‐site camera guidelines to ensure the credibility of the system in the future.
Victoria Police views the fixed‐site camera guidelines as adequate, however, they are subject to ongoing review.
• The perception of increased speed camera activity being linked to a decrease in police on‐road enforcement activity. A strategic risk could result, whereby the general deterrence benefits across the network provided by random police enforcement are lost.
Victoria Police asserts that the 2 activities are not linked or dependent on each other. Responsibility for road safety enforcement is clearly articulated as a role of each of the police regions. Regional management allocate resources for enforcement activities across the entire spectrum of policing, not just road safety. This allocation is prioritised on a needs basis and is not considered in conjunction with speed camera operations. Victoria Police has recently embarked on the implementation of an intelligence framework (Project Nimbus) which places emphasis on targeting an identified problem (crime and traffic) and or location, so that maximum benefit is gained through on‐road enforcement activity. The reduction of road trauma is an unremitting objective of Victoria Police.
Victoria Police agrees with those recommendations relevant to its operations (Recommendations 1, 2, 3, 4, 6, 8 and 9).
RESPONSE provided by Chief Executive Officer, VicRoads
VicRoads welcomes the findings of the Auditor‐General’s review and the recommendations contained within the report. This report provides a well‐balanced view of Victoria’s speed enforcement program, which has delivered significant road safety benefits for the Victorian community.
VicRoads is satisfied that the report provides a fair assessment of the rationale, evidence and conclusions behind the road safety strategies adopted to reduce road trauma associated with speed and speeding. It is vital that the public has ongoing confidence in Victoria’s speed camera program.

Executive summary 13
RESPONSE provided by Chief Executive Officer, VicRoads - continued
It is considered that the Executive Summary draws a narrow conclusion on the link between safety camera fine revenue, the Better Roads Victoria trust account and expenditure on road safety.
Revenue from speed and red light cameras, as well as on‐the‐spot speeding fines is directed to the Better Roads Victoria trust account for expenditure on traffic and transport integration programs, road maintenance, network development and on specific road safety projects. This establishes a transparent link between safety camera revenue, speeding fines revenue and the government’s expenditure on roads and road safety. However, road safety expenditure is not limited to, nor wholly linked to, the Better Roads Victoria trust fund.
Funding from state sources to VicRoads in 2005‐06 included $126 million for specific road safety projects, plus approximately $196 million for road maintenance, $154 million for Traffic and Transport Integration, and $650 million for Road System Development. All of these programs have a strong safety component. In 2004‐05, the above categories totalled $705 million.
The operational responsibility for speed enforcement in Victoria rests with Victoria Police, with the Department of Justice responsible for camera enforcement technology. VicRoads’ speed enforcement responsibility is limited to heavy vehicle speed compliance, in support of general speed enforcement by Victoria Police.
It should be noted that speed enforcement and the use of speed camera technology is one component of an overall strategy to improve speed compliance. Research shows that enforcement must, as is the case in Victoria, be supported by education and publicity to effectively achieve changes in road user behaviour with regard to travel speed.
VicRoads agrees with Recommendations 4 and 9, and partially agrees with Recommendation 2.
RESPONSE provided by Chief Executive Officer, Transport Accident Commission
The TAC has reviewed the report and welcomes its overall tenor and findings. The TAC will continue to work with its arrive alive! partners to help ensure the continued success of the integrated strategy addressing speeding and speed‐related trauma on Victoria’s roads.

15
2. Road safety and speed enforcement


Road safety and speed enforcement 17
2.1 The costs of road trauma
Every year, hundreds of people are killed1, and thousands are seriously injured2 or receive minor injuries in motor vehicle crashes3 on Victorian roads.
In addition to the enormous personal costs of road trauma borne by those injured and their families, the economic cost is substantial.
In 2004‐05, the Transport Accident Commission paid more than $643 million to 41 035 people4 who had been injured in road crashes for medical treatment, loss of income, long‐term care, and common law injury claims5.
The full economic costs of road crashes are greater than just the costs of care for the injured. The Bureau of Transport and Regional Economics (BTRE) estimates the costs of road trauma taking into account the value of a victim’s lost output or productivity caused by injury or premature death. This lost output includes both paid work, usually measured in terms of the victim’s work‐related income, and unpaid work, which involves an estimate of the victim’s contribution to household and community work. The BTRE estimates of total road crash costs also take into account costs of property damage and traffic delays from road crashes, as well as costs of medical treatment and long‐term care.
Based on this method, the cost of all casualty crashes in Victoria in 2003 was estimated to be $3.4 billion. These costs are detailed in Figure 2A.
1 The definition of a person killed in a road crash, as given in the 1968 Convention of Road Traffic, is: “any person who was killed outright or who died within 30 days as a result of the accident”. 2 In Victoria, a “serious injury” is defined as someone who is taken to hospital as a result of a crash. 3 Bureau of Transport and Regional Economics 2000, Road crash costs in Australia, Bureau of Transport and Regional Economics Report 102, Canberra. 4 Includes payments to people injured in previous years. 5 Transport Accident Commission 2005, Annual Report, Transport Accident Commission, Melbourne, p. 13.

18 Road safety and speed enforcement
FIGURE 2A: COST OF CASUALTY CRASHES TO THE VICTORIAN COMMUNITY, 2003
Injury severity Cost per person injured
($’000)
Number of casualties
(no.)
Cost to Victoria
($’000) Fatal $1 780 330 587 400 Serious injury $386 6 620 2 555 320 Minor injury $14 16 204 226 856 Total 23 154 3 369 576
Note: Cost estimates adjusted to 2003 dollars, using consumer price index increase. Source: Victorian Auditor‐Generalʹs Office, from Bureau of Transport and Regional Economics data.
The BTRE notes that many aspects of these costings are conservative, in particular the social cost of crashes. The costs are also based only on reported crashes (those counted in police records): there are many uncounted injury crashes, and despite being uncounted, they still involve real costs. In addition, the costs of property‐damage‐only crashes are not included in Figure 2A, but are considerable.
Police officers investigating a serious road crash.
(Photo courtesy of Victoria Police.)

Road safety and speed enforcement 19
2.2 The role of speed in road trauma
All road crashes are multi‐causal, so it is impossible to precisely quantify the number of crashes caused by speed. However, travel speed impacts on both the risk of involvement in a crash6 and on the severity of any crash that does occur.
Most estimates of how speed contributes to road trauma suggest that speed is a factor in around 25 to 30 per cent of fatal and serious injury crashes7. This does not include the effects of speed on crash severity, and many cases of marginal speeding are probably unrecorded.
Australian and international research has shown that: • for an individual speeding vehicle in an urban 60 km/h zone, the risk of
involvement in a casualty crash doubles with each 5 km/h increase in free travelling speed8 above 60 km/h9
• for a speeding vehicle on a rural road, the risk of involvement in a casualty crash more than doubles for each 10 km/h above the average free travelling speed for the location10
• a 5 per cent reduction in the average speed of all vehicles typically results in a decrease of about 10 per cent in the number of casualty crashes and a larger decrease in serious injuries (14 per cent) and fatalities (21 per cent)11.
6 B Frith, G Strachan, and T Patterson, “Road safety implications of excessive and inappropriate vehicle speed” in Australasian Road Safety Handbook, Vol. 2, Ch. 6, Austroads, Sydney, 2003. <http://www.onlinepublications.austroads.com.au/script/Details.asp?DocN=AS081906068455> 7 For example, the Australian Transport Safety Bureau found that “excessive speed” is the most common factor identified in coroners’ records for fatal crashes (about 26 per cent) in Australian Transport Safety Bureau 2004, Road safety in Australia: A publication commemorating World Health Day 2004, Australian Transport Safety Bureau, Canberra. 8 “Free travel speed” is the speed of a vehicle in free flowing traffic, unimpeded by other vehicles. It is a good indicator of the speed at which drivers choose to travel. 9 C Kloeden, A McLean, V Moore and G Ponte, Travelling speed and the risk of crash involvement, Federal Office of Road Safety, Canberra, 1997, p. 391; and C Kloeden, A McLean and G Glonek, Reanalysis of travelling speed and the risk of crash involvement in Adelaide, South Australia, CR207, Australian Transport Safety Bureau, Canberra, 2002, <http://www.atsb.gov.au/publications/2002/Speed_Risk_3.aspx>. 10 C Kloeden, G Ponte and A McLean, Travelling speed and the risk of crash involvement on rural roads, CR204, Australian Transport Safety Bureau, Canberra, 2001, <http://www.atsb.gov.au/publications/2001/Rural_Speed_1.aspx>. 11 Estimates based on a meta‐analysis of 98 research studies containing 460 empirical estimates of effects of speed changes, in: A Amundsen, P Christensen and R Elvik, Speed and road accidents: an evaluation of the power model. Institute of Transport Economics, Oslo, 2004, <http://www.toi.no/getfile.php/Publikasjoner/T%D8I%20rapporter/2004/740‐2004/740‐2004.pdf>.

20 Road safety and speed enforcement
One of the primary mechanisms for ensuring the safety of our road system is the setting of speed limits on each road appropriate for the engineering standard and the type of use of that road (including abutting land use). While the risks of exceeding legal limits by large margins have been accepted by the community for some time, the risks of “lower level speeding” (exceeding the legal limit by only a small number of km/h) are only beginning to be understood.
The relative risk of casualty crash involvement for vehicles travelling only a few km/h above the speed limit is lower than for those travelling a greater amount above the limit. However the contribution of “low level speeders” to the total number of casualty crashes is high because of the high number of motorists travelling at these speeds. Therefore, “low level speeding” represents a substantial risk across the road network12. The relationship is illustrated in Figure 2B.
FIGURE 2B: SPEED ‐ RISK MATRIX
Low risk
Number of drivers
Degr
ee o
f spe
ed a
bove
the
spee
d lim
it
Medium risk
High risk
Low
High
Low High
A small number of driverssignificantly above thespeed limit represents ahigh risk
A large number of driversslightly above the speedlimit represents a high risk
Source: Victorian Auditor‐Generalʹs Office.
12 C Kloeden, A McLean and G Glonek, Reanalysis of travelling speed and the risk of crash involvement in Adelaide, South Australia, CR207, Australian Transport Safety Bureau, Canberra, 2002.

Road safety and speed enforcement 21
Figure 2B illustrates the way in which a large number of drivers travelling at a relatively small margin above the posted speed limit can create, in aggregate, similar risk to the smaller number of drivers who travel at a high margin above the legal limit.
2.3 The Victorian road safety strategy: arrive alive!
Victoria’s key planning and coordination document for road safety is arrive alive!, the road safety strategy for 2002‐2007. The strategy aims to reduce annual death and serious injury from crashes on Victorian roads by 20 per cent by 2007.
The 17 key initiatives in the policy are identified in Figure 2C.
FIGURE 2C: ARRIVE ALIVE! – KEY INITIATIVES
Motorcycle safetyBicycle safety
Heavy vehicle safetyPublic transport safety
Pedestrian safety
Road and roadside design andsafety
Vehicle safety/occupantprotection
Enhanced crash informationWorking with the community
Young/novice driversOlder drivers Post-crash trauma
arrive alive!Reduce road
trauma by 20%by 2007
Drink drivingFatigue
Drugs and drivingRepeat offenders and unlicensed drivers
Speed and speeding
Data and communication
Engineering
Post-crashDemographics
Other road users
Driver behaviour
Source: Victorian Auditor‐Generalʹs Office.

22 Road safety and speed enforcement
2.3.1 Victoria’s road safety performance In benchmark studies, Victoria performs well compared with other Australian states and overseas jurisdictions. For example: • In 2003, Victoria recorded 6.7 deaths per 100 000 population, the second
lowest in Australia after the ACT (which has few rural roads). This was also well below the OECD median of 9.3 deaths per 100 000 population for that year13.
• In the 12 months to March 2006, Victoria recorded 6.5 deaths per 100 000 population, and 0.9 deaths per 10 000 registered vehicles. By both measures, Victoria was the best performing Australian jurisdiction14.
The arrive alive! strategy set ambitious targets to reduce the level of road trauma further. In Part 3 of this report, we consider progress towards these targets and recent Victorian trends in detail.
2.4 Victoria’s initiatives in speed enforcement
Between the late 1980s and early 2000s, Victoria was one of the leading jurisdictions in the world to implement comprehensive and focused enforcement programs aimed specifically at reducing speed‐related road trauma. These initiatives included: • new speed detection equipment (including 60 speed cameras) • increased enforcement hours • covert enforcement • fixed site speed cameras on the Western Ring Road, Monash Freeway
and CityLink tunnels in Melbourne • intensive publicity to reinforce the enforcement effort.
Also, in 2001 the default urban speed limit was lowered from 60 km/h to 50 km/h unless otherwise posted, and new a 40 km/h speed zone was introduced for school zones and strip shopping areas.
13 Australian Transport Safety Bureau 2005, International road safety comparisons: The 2003 report, Australian Transport Safety Bureau, Canberra, p. 8, viewed 25 May 2006, <http://www.atsb.gov.au/publications/2004/pdf/Int_Comp_03.pdf>. 14 Transport Accident Commission, Monthly Road Safety Summary, Melbourne, April 2006.

Road safety and speed enforcement 23
The arrive alive! strategy built on these early initiatives, and made the following changes to the speed enforcement program: • progressive increase in mobile camera operating hours (from 4 200 to
6 000 target hours per month) between August 2001 and February 2002 and again in December 2004, from 6 000 hours per month to 7 000 hours15
• staged introduction of “flashless” camera operations during daytime, use of a greater variety of unmarked cars, and use of new locations and times of day, all aimed at making the enforcement more covert and unpredictable to speeding drivers
• reduction in the speeding offence enforcement threshold16 in progressive stages from March to September 2002
• tougher penalties for speeding offences • investment in more speed detection equipment by Victoria Police and
the Department of Justice.
In Parts 3 and 4 of this report, we examine the effectiveness of the speed enforcement measures, and consider the extent to which they were based on sound evidence.
2.4.1 Recent reviews In recent years, Victoria has had some high profile failures in elements of the speed detection and enforcement system, and there has been intense criticism of elements of the program in the community and the media. This has prompted a number of reviews of existing practices, including reviews into the Western Ring Road speed camera failure. We examine issues of quality assurance in Part 5 of this report.
Another review by the Speed Limits Advisory Group investigated the sufficiency of speed limit signage.
Speed Limits Advisory Group
Acceptance of speed enforcement programs is heavily dependant on community understanding of why speed limits are set and a perception that legal speed limits are reasonable and signage is adequate.
15 From 1 July 2006, mobile camera hours will be reduced back to 6 000 per month. 16 The enforcement threshold is the speed at or above which an infringement notice will be issued.

24 Road safety and speed enforcement
In August 2005, the Victorian Premier announced a review to address possible deficiencies in speed limit signage which could create confusion for motorists. The government asked the Speed Limits Advisory Group to undertake the review to “ensure that speed zones throughout the state are meeting both road safety needs and community expectations”17.
The group is made up of representatives from government and non‐government bodies and community groups. Its purpose is to advise VicRoads on general speed limit matters.
In May 2006, the Minister for Transport announced the group’s recommendations18. The key recommendations were: • install more advance warning signs for roads with special speed limits
(e.g. schools, strip shopping centres and town centres) • install electronic signs at school speed zones on roads with a 70 km/h
speed limit • replace 80 km/h buffer speed zones on the approach to country towns
with “60 km/h ahead” warning signs • place repeater signs 100 (instead of 300) metres after a reduction in
speed limit to remind motorists • review and evaluate speed limit operating hours on shopping strips • use message signs on freeways with variable speed zones to explain
why speed limit is lowered • undertake a speed‐related community awareness campaign.
Due to the timing of this review and its report, we did not include speed zoning and signage in the scope of this audit.
2.5 Responsibilities for road safety in Victoria
The 4 government agencies that form the “road safety partnership” are: VicRoads, Victoria Police, the Department of Justice and the Transport Accident Commission. Each agency has specific responsibilities relating to the delivery of the speed enforcement program, however, many of these responsibilities are undertaken with consultation or in partnership with the other road safety partners, local government and non‐government organisations.
17 S Bracks (Premier of Victoria), Government announces review of speed limits, media release, Melbourne, 15 August 2006. 18 P Batchelor (Minister for Transport), Victorian speed zones to be made clearer, media release, Melbourne, 1 May 2006.
Road safety and speed enforcement 25
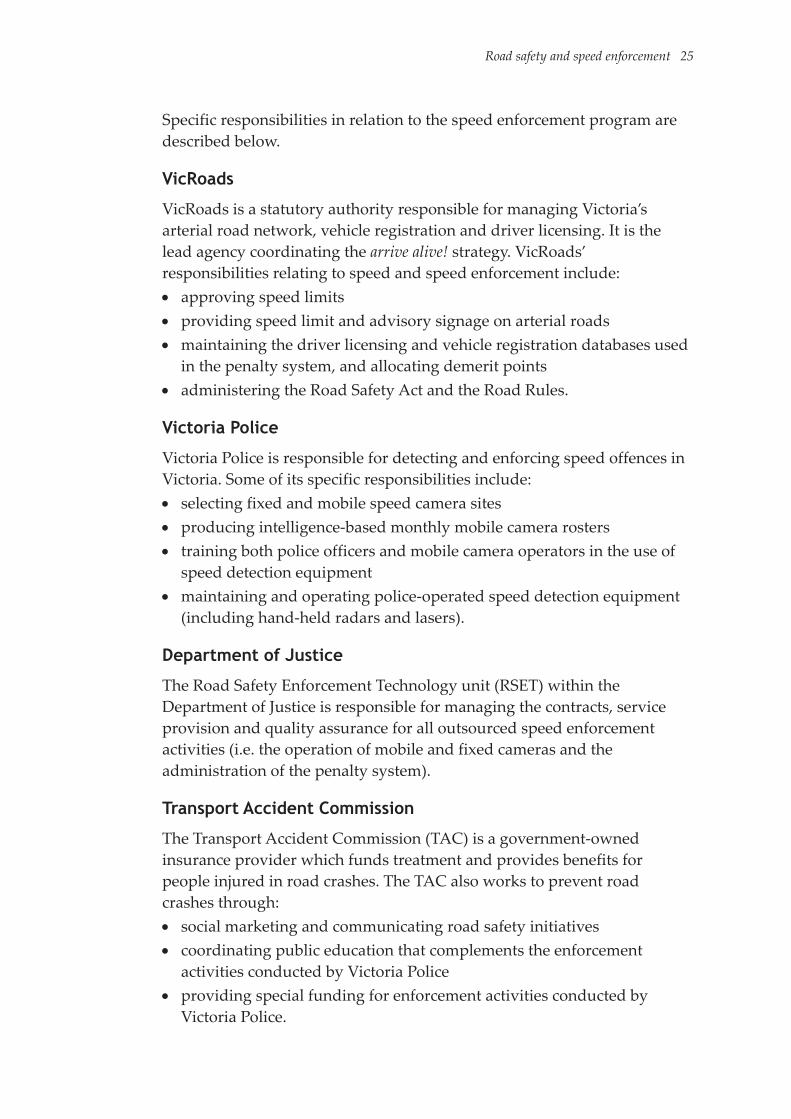
Specific responsibilities in relation to the speed enforcement program are described below.
VicRoads
VicRoads is a statutory authority responsible for managing Victoria’s arterial road network, vehicle registration and driver licensing. It is the lead agency coordinating the arrive alive! strategy. VicRoads’ responsibilities relating to speed and speed enforcement include: • approving speed limits • providing speed limit and advisory signage on arterial roads • maintaining the driver licensing and vehicle registration databases used
in the penalty system, and allocating demerit points • administering the Road Safety Act and the Road Rules.
Victoria Police
Victoria Police is responsible for detecting and enforcing speed offences in Victoria. Some of its specific responsibilities include: • selecting fixed and mobile speed camera sites • producing intelligence‐based monthly mobile camera rosters • training both police officers and mobile camera operators in the use of
speed detection equipment • maintaining and operating police‐operated speed detection equipment
(including hand‐held radars and lasers).
Department of Justice
The Road Safety Enforcement Technology unit (RSET) within the Department of Justice is responsible for managing the contracts, service provision and quality assurance for all outsourced speed enforcement activities (i.e. the operation of mobile and fixed cameras and the administration of the penalty system).
Transport Accident Commission
The Transport Accident Commission (TAC) is a government‐owned insurance provider which funds treatment and provides benefits for people injured in road crashes. The TAC also works to prevent road crashes through: • social marketing and communicating road safety initiatives • coordinating public education that complements the enforcement
activities conducted by Victoria Police • providing special funding for enforcement activities conducted by
Victoria Police.

26 Road safety and speed enforcement
2.6 About this audit
The objective of the audit was to assess whether Victoria’s speed detection and enforcement strategy effectively contributed to safer roads.
We examined the performance of Victoria Police, the Department of Justice and VicRoads in their roles managing elements of the speed detection and enforcement system.
The audit assessed whether: • the number of speeding motorists has decreased, and the number and
severity of crashes has reduced • the program is implemented with road safety as its first priority, and
enforcement activities are directed at reducing risk, not raising revenue • detection and enforcement operations comply with relevant legislation
and guidelines • the penalty system is administered effectively.
Appendix A provides further details about our audit method, including the cost of the audit.

27
3. Effectiveness of the program


Effectiveness of the program 29
3.1 Introduction
The purpose of speed enforcement is to improve compliance with legal speed limits and, as a result, road trauma should decrease.
If the program is effective, we would expect to see: • a change in the behaviour of motorists – there should be increased
compliance with speed limits, with a decrease in the number and percentage of motorists detected speeding and, importantly, a decrease in speeds measured across the road network (using measurement methods that are not directly related to enforcement activities)
• a reduction in road trauma – if compliance with speed limits improves, then (assuming all other factors, such as vehicle distances travelled, remain roughly equal) there should be a reduction in the number and severity of crashes.
3.2 Are fewer drivers speeding?
Behavioural research into how deterrence works has identified 2 ways in which speed enforcement operates to change behaviour: • specific deterrence ‐ individual motorists who are detected speeding
and penalised are less likely to offend in the future because of their experience of detection and the consequences
• general deterrence – all motorists, whether they have been detected and punished or not, adjust their behaviour because of the threat of detection and punishment1.
This means that if speed enforcement activities are achieving their objective, motorists should be increasing their compliance to speed limits across the entire road network.
3.2.1 Changes to free travel speeds “Free travel speed” is the speed of a vehicle in free flowing traffic, unimpeded by other vehicles. As such, it is a good indicator of the speed at which drivers choose to travel.
1 A Delany, H Ward and M Cameron, The history and development of speed camera use, Monash University Accident Research Centre, Melbourne, 2005.

30 Effectiveness of the program
VicRoads conducts surveys of free travel speeds in Melbourne and regional Victoria every 6 months. The surveys measure vehicle speeds in open road conditions for: • Melbourne metropolitan 60, 70 and 80 km/h zones • Melbourne freeways • country Victoria 100 and 110 km/h zones.
VicRoads calculates average speeds for the Melbourne sites, median speeds for the country sites and the 85th percentile2 for all sites.
Over time, the results can be used to measure compliance with the speed limit, and to give an indication of the general deterrence effect of the enforcement program.
Travel speeds in Melbourne’s 60, 70 and 80 km/h zones
Figure 3A shows that in Melbourne’s 60, 70 and 80 km/h zones, there have been noticeable decreases in 85th percentile free travel speeds, especially since 2000.
FIGURE 3A: 85TH PERCENTILE FREE TRAVEL SPEEDS IN MELBOURNE 60, 70 AND 80 KM/H SPEED ZONES
60
65
70
75
80
85
90
2 1 2 1 2 1 2 1 2 1 2 1 2 1 2 1 2 1 2 1 2
1995 1996 1997 1998 1999 2000 2001 2002 2003 2004 2005
Speed zone
Trav
el sp
eeds
(km
/h)
60 km/h 70 km/h 80 km/h
Note: Survey period (1) relates to the month of May and (2) relates to the month of November. Source: Victorian Auditor‐Generalʹs Office, from VicRoads data.
2 The 85th percentile speed is the speed at or below which 85 per cent of motorists are driving.

Effectiveness of the program 31
When average travel speeds are considered, the improvement in compliance is clear. In 2005, for the first time, average travel speeds in 60 and 70 km/h zones were below the speed limit.
Travel speeds on Melbourne’s freeways
In 2004, VicRoads started sampling free travel speeds on Melbourne’s freeways. The freeway time series is much shorter than the metropolitan survey, but it shows that free travel speeds have increased slightly since 2004. At the 85th percentile, the travel speeds are around 7 or 8 kilometres over the 100 km/h speed limit, with average travel speeds around 98 km/h.
Travel speeds in country Victoria’s 100 and 110 km/h zones
In country areas, the VicRoads free travel speed surveys only cover 100 and 110 km/h zones. Figure 3B shows that 85th percentile free travel speeds have remained steady at about 5 km/h over the speed limit since 1998.
FIGURE 3B: 85TH PERCENTILE FREE TRAVEL SPEEDS ON COUNTRY ROADS
95
100
105
110
115
1 2 1 2 1 2 1 2 1 2 1 2 1 2 1 2
1998 1999 2000 2001 2002 2003 2004 2005
Speed zone
Trav
el sp
eeds
(km/
h)
100 km/h 110 km/h
Note: Survey period (1) relates to the first half of the year and (2) relates to the second half of the year. Source: Victorian Auditor‐Generalʹs Office, from VicRoads data.
There was a very slight upward trend that peaked in late 2001, with marginally lower speeds since then. On the evidence of past research into speed and crash rates, even these apparently minor speed changes should have been sufficient to change serious casualty rates on the relevant roads by a few per cent, if all other factors had remained constant (see section 2.2 of this report).
Median travel speeds are around 3 to 4 km/h below the speed limit.

32 Effectiveness of the program
3.2.2 Changes to speeding offences The arrive alive! strategy enforcement initiatives meant that potentially, both the number and percentage of motorists detected speeding would increase initially because: • the increased enforcement efforts (through increased numbers of fixed
cameras and increased mobile camera hours) would enable more vehicles to be assessed and more speeding offences to be detected
• the reduced enforcement thresholds would mean that some motorists who previously were above the old enforcement threshold would now also be classed as speeding. This could potentially increase the percentage of motorists penalised for speeding.
If the arrive alive! program is effective in changing driver behaviour, we expected that after initial increases in both the absolute numbers and the percentages of drivers penalised for speeding there would be a decrease over time as more drivers adjust behaviour and comply with speed limits.
Number of speeding offences detected
Figure 3C shows the total number of speeding infringements issued by fixed and mobile cameras, and on‐the‐spot fines issued by Victoria Police.
FIGURE 3C: SPEEDING INFRINGEMENTS BY TYPE OF ENFORCEMENT
0
200
400
600
800
1 000
1 200
1 400
Numb
er of
traff
ic inf
ringe
ment
notic
es ('0
00)
Police on-the-spot 221 909 177 646 232 255 193 528 186 112 174 093
Fixed cameras 0 38 059 111 382 113 309 27 447 54 780
Mobile cameras 538 874 498 266 609 473 874 637 673 628 699 938
1999-00 2000-01 2001-02 2002-03 2003-04 2004-05
Source: Victorian Auditor‐Generalʹs Office, from Department of Justice data.
Effectiveness of the program 33
Figure 3C shows that the total number of infringements has decreased since a peak in 2002‐03. Part of this decrease can be attributed to the reduction in fixed camera enforcement effort as a result of the system not being fully operational during 2003‐2005. However, the number of infringements from mobile cameras has also decreased since 2002‐03, despite the monthly hours increasing in December 2004, from 6 000 hours per month to 7 000 hours, and the tightening of the enforcement threshold. This reduction is significant because it gives a strong indication that there has been an improved level of compliance to speed limits in recent years.
Also, the number of police on‐the‐spot speeding fines has decreased, although some of this decrease can be attributed to fewer hours dedicated to road policing as other policing priorities have emerged.
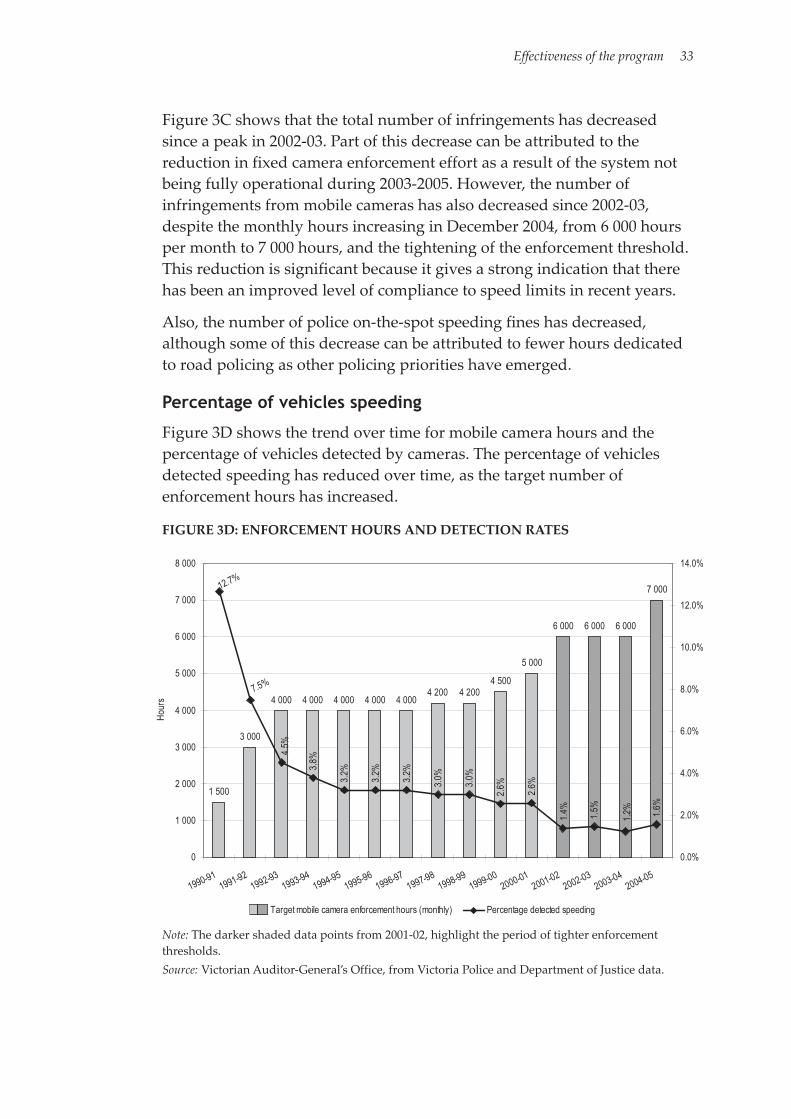
Percentage of vehicles speeding
Figure 3D shows the trend over time for mobile camera hours and the percentage of vehicles detected by cameras. The percentage of vehicles detected speeding has reduced over time, as the target number of enforcement hours has increased.
FIGURE 3D: ENFORCEMENT HOURS AND DETECTION RATES
1 500
3 000
4 000 4 000 4 000 4 000 4 0004 200 4 200
4 500
5 000
6 000 6 000 6 000
7 000
1.4%
1.5%
1.2% 1.6
%
2.6%
2.6%3.0
%
3.0%
3.2%
3.2%
3.2%3.8
%4.5%
7.5%
12.7%
0
1 000
2 000
3 000
4 000
5 000
6 000
7 000
8 000
1990-911991-92
1992-931993-94
1994-951995-96
1996-971997-98
1998-991999-00
2000-012001-02
2002-032003-04
2004-05
Hour
s
0.0%
2.0%
4.0%
6.0%
8.0%
10.0%
12.0%
14.0%
Target mobile camera enforcement hours (monthly) Percentage detected speeding
Note: The darker shaded data points from 2001‐02, highlight the period of tighter enforcement thresholds. Source: Victorian Auditor‐General’s Office, from Victoria Police and Department of Justice data.

34 Effectiveness of the program
Figure 3D shows that in 1990‐91, 1 500 hours of speed camera surveillance were conducted monthly, and around 13 per cent of vehicles detected were speeding. During the years 1990‐91 to 1992‐93, steady increases in camera hours were matched by reductions in the percentage of motorists speeding, which declined to around 4.5 per cent. From the mid‐ to the late‐1990s, camera hours remained relatively steady, and the percentage of motorists speeding plateaued at around 3 per cent.
The next significant reduction in the percentage of motorists detected speeding occurred in 2001‐02. This coincided with the implementation of arrive alive! enforcement initiatives.
One of the program’s initiatives, namely, the reduction in the enforcement threshold in 2002 (indicated in Figure 3D by darker coloured bars), masks the full extent of the improvement in compliance. Reducing the threshold means that some motorists who would not have been reported as speeding in some years (i.e. detected travelling in excess of the enforcement threshold) would be now. Had the threshold not changed, then the percentage of motorists detected speeding would have been even less than the 1.2 to 1.6 per cent of motorists detected speeding since the tightening of the threshold.
Percentage of motorists 10 km/h or more over the speed limit
The Transport Accident Commission (TAC) reports on the percentage of motorists exceeding the speed limit by more than 10 km/h.
In 2001, 2.4 per cent of all motorists detected by mobile cameras were more than 10 km/h above the limit. This reduced to 1.8 per cent in 2002, with further decreases each year to 1.1 per cent in 2005.
3.2.3 Conclusion – Are fewer drivers speeding? Both free travel speeds and speeding infringement data show an overall improvement in compliance with legal speed limits.
Free travel speeds in metropolitan Melbourne’s 60, 70 and 80 km/h speed zones have reduced significantly since the 1990s, and in 2005, for the first time, average travel speeds in these zones were within the legal limit. However, changes in travel speeds in 100 and 110 km/h speed zones in rural areas have been much smaller and recent data indicates travel speeds have increased in metropolitan Melbourne’s 100 km/h zones since 2004. As we will discuss in Part 4 of this report, the improvement in compliance in the lower speed zones corresponds to the areas with greatest enforcement activity.

Effectiveness of the program 35
The increased enforcement effort, and reduced tolerances implemented under arrive alive! meant that, if driver behaviour remained unchanged, more motorists would be detected speeding (both in absolute numbers and percentage terms). Data shows that both the absolute number of infringements issued, and the percentage of drivers detected speeding have reduced, indicating better compliance with speed limits.
As well as a reduction in the total percentage of drivers speeding, the degree of speeding is reducing, with fewer drivers detected at more than 10 km/h above the speed limit.
While the observed reductions in both free travel speeds and speeding offences are a positive trend, showing that drivers are speeding less, a small proportion are still speeding. Free travel speed measurements indicate that around 15 per cent of all motorists still exceed the legal limit in all measured speed zones.
3.3 Has road trauma reduced?
Road crashes are multi‐causal with a number of contributing factors (e.g. weather conditions, road quality, driver impairment). Speed is only one factor among many (albeit a very important one, as it contributes to both the likelihood of a crash occurring and the severity of all crashes).
This complexity means that it is not possible to conduct a simple analysis that isolates the impact of the speed enforcement program on state level road trauma performance from the impact the other factors have.
Consideration of trends in road trauma should also take into account the fact that road travel is increasing in Victoria. For example, the number of registered vehicles increased by 10 per cent between 2001 and 20053. This means that if nothing else changed, then the amount of road trauma should logically increase.
The following section of the report looks at Victorian trends in road trauma before and after the arrive alive! program commenced.
3.3.1 Progress against arrive alive! targets The arrive alive! strategy’s primary target is to reduce fatalities and serious injuries by 20 per cent by 2007. The base year for the purpose of the target is the 3‐year average for 1999‐2001.
3 Australian Bureau of Statistics, Motor Vehicle Census, Australia, March 2005, publication 9309.0, viewed 10 July 2006 at <http://abs.gov.au/AUSSTATS/[email protected]/Lookup/9309.0Main+Features1Mar%202005?OpenDocument>.

36 Effectiveness of the program
Figure 3E shows that at December 2005 fatalities were down from the 1999‐2001, 3‐year average by 16 per cent.
Full year data for 2005 serious injuries was not available at the time of preparing our report4. It is estimated that serious injuries have reduced by 7.5 per cent.
FIGURE 3E: PROGRESS AGAINST THE ARRIVE ALIVE! TARGETS
3-year average 1999-2001
2002 2003 2004 2005
Fatalities (no.) 412 397 330 343 346 Reduction from base year average (%) 3.6 19.9 16.7 16.0 Serious injuries (no.) 6 395 6 924 6 683 6 379 (a) 5 916 Reduction from base year average (%) -8.3 -4.5 0.3 7.5
(a) Figure reported is an estimate based on year‐to‐date data for 1 Jan. – 30 Nov. 2005.
Source: Victorian Auditor‐Generalʹs Office, from Transport Accident Commission data.
3.3.2 Casualty reductions The patterns of trauma distribution, and of the casualty reductions achieved in recent years vary across speed zones and between metropolitan Melbourne and the rest of Victoria. The following data provides more information on performance trends by location and by speed zone groupings.
Changes in fatalities
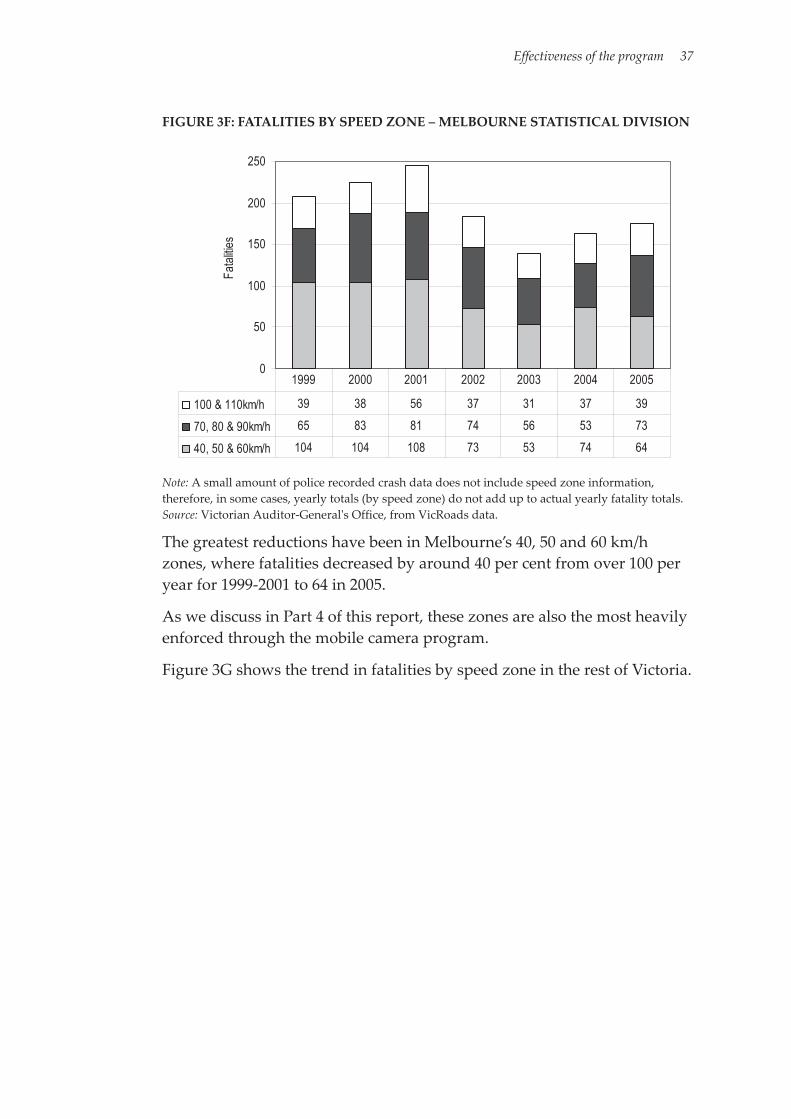
Figure 3F shows the trend in fatalities by speed zone in the Melbourne Statistical Division5.
4 During the period of our audit fieldwork (September 2005‐April 2006), Victoria Police were implementing a new IT system for recording crash data. Up‐to‐date serious injury data was not available beyond the end of November 2005 during this change over period. 5 The Melbourne Statistical Division (MSD) is defined by the Australian Bureau of Statistics and is sometimes used as a more convenient geographical area in preference to the Melbourne metropolitan area. The area covers the same area as the Melbourne metropolitan area, except for the upper part of Yarra Ranges Shire. In 2001, there was only a difference of 567 persons in the Melbourne metropolitan area, compared with the MSD.
Effectiveness of the program 37
FIGURE 3F: FATALITIES BY SPEED ZONE – MELBOURNE STATISTICAL DIVISION
0
50
100
150
200
250
Fatal
ities
100 & 110km/h 39 38 56 37 31 37 39
70, 80 & 90km/h 65 83 81 74 56 53 73
40, 50 & 60km/h 104 104 108 73 53 74 64
1999 2000 2001 2002 2003 2004 2005
Note: A small amount of police recorded crash data does not include speed zone information, therefore, in some cases, yearly totals (by speed zone) do not add up to actual yearly fatality totals. Source: Victorian Auditor‐Generalʹs Office, from VicRoads data.
The greatest reductions have been in Melbourne’s 40, 50 and 60 km/h zones, where fatalities decreased by around 40 per cent from over 100 per year for 1999‐2001 to 64 in 2005.
As we discuss in Part 4 of this report, these zones are also the most heavily enforced through the mobile camera program.
Figure 3G shows the trend in fatalities by speed zone in the rest of Victoria.

38 Effectiveness of the program
FIGURE 3G: FATALITIES BY SPEED ZONE – REST OF VICTORIA
0
50
100
150
200
250
Fatal
ities
100 & 110km/h 141 142 140 157 139 146 12670, 80 & 90km/h 14 14 24 22 22 11 1940, 50 & 60km/h 21 25 31 31 26 19 23
1999 2000 2001 2002 2003 2004 2005
Note: A small amount of police recorded crash data does not include speed zone information, therefore, in some cases, yearly totals (by speed zone) do not add up to actual yearly fatality totals. Source: Victorian Auditor‐Generalʹs Office, from VicRoads data.
In the rest of Victoria, most fatalities occur in the 100 and 110 km/h speed zones. The fatality rate in these speed zones has fluctuated. The 3‐year average for 1999‐2001 was 141. In 2002, the fatality rate increased to 157, but has since reduced to 126 in 2005.
Changes in serious injuries
Figures 3H and 3I show the trends for serious injuries by speed zone in the Melbourne Statistical Division and the rest of Victoria.

Effectiveness of the program 39
FIGURE 3H: SERIOUS INJURIES BY SPEED ZONE – MELBOURNE STATISTICAL DIVISION
0
1 000
2 000
3 000
4 000
5 000Se
rious
injur
ies
100 & 110km/h 452 391 424 435 451 405 39370, 80 & 90km/h 946 1078 1207 1204 1243 1181 117940, 50 & 60km/h 2838 2812 2786 2950 2892 2707 2409
1999 2000 2001 2002 2003 2004 (a) 2005
(a) Figure reported is an estimate based on year‐to‐date data for 1 Jan. – 30 Nov. 2005. Note: A small amount of police recorded crash data does not include speed zone information, therefore, in some cases, yearly totals (by speed zone) do not add up to actual yearly serious injury totals.
Source: Victorian Auditor‐Generalʹs Office, from VicRoads data.
FIGURE 3I: SERIOUS INJURIES BY SPEED ZONE – REST OF VICTORIA
0
500
1 000
1 500
2 000
2 500
Serio
us in
juries
100 & 110km/h 1070 1207 1322 1261 1210 1205 108170, 80 & 90km/h 151 226 245 265 225 229 22640, 50 & 60km/h 582 615 655 712 600 575 539
1999 2000 2001 2002 2003 2004 (a) 2005
(a) Figure reported is an estimate based on year‐to‐date data for 1 Jan. – 30 Nov. 2005. Note: A small amount of police recorded crash data does not include speed zone information, therefore, in some cases, yearly totals (by speed zone) do not add up to actual yearly serious injury totals.
Source: Victorian Auditor‐Generalʹs Office, from VicRoads data.

40 Effectiveness of the program
The greatest numbers of serious injuries occur in metropolitan Melbourne, and the majority of these are in 40, 50 and 60 km/h zones. Figure 3H shows that serious injuries in these zones have reduced, with a decrease of around 15 per cent from the 3‐year average for 1999‐2001.
In both metropolitan Melbourne and in the rest of Victoria’s 70, 80 and 90 km/h speed zones, casualties have slightly increased since 1999‐2001.
3.3.3 Changes in pedestrian trauma Pedestrians are among the most vulnerable road users, and while travel speed at the point of impact is an important determinant of injury severity for all road users, threshold speeds for survival are lower for pedestrians. Research has shown that: • a pedestrian struck by a vehicle travelling at 30 km/h has approximately
a 90 per cent chance of survival • at 40 km/h this declines to a 75 per cent chance of survival • at 50 km/h the chance of survival is less than 20 per cent • at 60 km/h the chance of a pedestrian surviving the impact of a vehicle is
almost nil6.
A small reduction in vehicle travel speeds can result in a large reduction in the speed at the point of impact in a collision. For pedestrian collisions, impact speed can make a big difference to that person’s chances of survival. This sensitivity to changes in travel speed means that decreases in pedestrian trauma are a good indicator of the safety benefits of lower travel speeds in urban areas (where most pedestrian crashes occur). The trend in pedestrian deaths and serious injuries is shown in Figure 3J.
6 R Anderson, A McLean, M Farmer, B Lee and C Brooks, “Vehicle travel speeds and the incidence of fatal pedestrian crashes” in Accident Analysis and Prevention, 1997, Vol. 29(5), pp. 667‐74.

Effectiveness of the program 41
FIGURE 3J: VICTORIAN PEDESTRIAN FATALITIES AND SERIOUS INJURIES
8141 49 48
705 701
59 58
725 728
616 578
0
100
200
300
400
500
600
700
800
2000 2001 2002 2003 2004 2005
Numb
er
Fatalities Serious injuries
Note: The 2005 serious injury figure is an estimate based on year‐to‐date data for 1 Jan. – 30 Nov. 2005. Source: Victorian Auditor‐Generalʹs Office, from Transport Accident Commission data.
Figure 3J shows strong reductions in pedestrian deaths and injuries. Fatalities have decreased from 81 in 2001 to 48 in 2005 with a low of 41 in 2003. Serious injuries decreased from 728 in 2002 to an estimate of 578 in 2005.
3.3.4 Changes in injury severity Crash impact speeds directly affect the severity of injuries, but it is difficult to precisely quantify the changes to injury severities over time. One indicator of crash severity is the length of stay in hospital. In general, the more severe the injury, the longer the patient will stay in hospital, although a number of other factors can also influence length of stay.
Figure 3K shows the change in the proportion of time spent in hospital following a road crash.

42 Effectiveness of the program
FIGURE 3K: SHARE OF TAC CLAIMANTS’ LENGTH OF STAY IN HOSPITAL
0%
5%
10%
15%
20%
25%
30%
35%
40%
45%
50%
2000-01 2001-02 2002-03 2003-04 2004-05
Length of stay in hospital
Shar
e of le
ngth
of sta
y tim
es
1 day 2-5 days 6 or more days
Source: Victorian Auditor‐Generalʹs Office, from Transport Accident Commission data.
Figure 3K shows that the proportion of road accident victims staying in hospital 6 days or longer (i.e. the most severely injured) has declined from 32 per cent in 2000‐01 to 26 per cent in 2004‐05. The proportion of patients staying 2‐5 days has also declined, but to a lesser extent.
3.3.5 Changes to the cost of trauma treatment The decreases in fatalities and serious injuries during the implementation of arrive alive! have resulted in a corresponding decrease in the total number of claims to the Transport Accident Commission (TAC). However, the benefits paid by the TAC have risen despite the reduced number of claims. Figure 3L shows the trend.

Effectiveness of the program 43
FIGURE 3L: TAC CLAIM LODGEMENTS AND BENEFITS PAID
21 383 21 702 21 36120 648
19 733 19 292
22 921
0
5 000
10 000
15 000
20 000
25 000
1998-99 1999-00 2000-01 2001-02 2002-03 2003-04 2004-05
Numb
er of
claim
s
0
100
200
300
400
500
600
700
Bene
fits pa
id ($
m)
Total claim lodgements Benefits paid
Note: Benefits paid each year can result from claims lodged in the same year or in a number of preceding years. Source: Victorian Auditor‐Generalʹs Office, from the Transport Accident Commission’s 2005 Annual Report.
3.3.6 Conclusion – Has road trauma reduced? The level of road trauma has reduced in Victoria, with fewer deaths and serious injuries since 2001, despite increases in vehicle registrations, and kilometres travelled. Many factors have contributed to these changes, however, reduced travel speeds have been a major contributor.
The most significant trauma reductions have been in metropolitan Melbourne’s low speed zones, where fatalities have decreased by around 40 per cent and serious injuries by 15 per cent. This reduction corresponds with the reduction in free travel speeds in these zones.
Travel speeds in both metropolitan Melbourne and country 100 and 110 km/h speed zones have remained relatively stable over time, and the trauma reductions on these roads have been small.
There have been big decreases in fatalities and serious injuries for pedestrians, where urban speeds are a major determinant of severity.

44 Effectiveness of the program
The increase in benefits paid by the TAC to crash victims can indicate that the severity of injuries has increased, or the costs of medical treatment have increased, or both. Given that the proportion of patients staying for longer periods in hospital has decreased, the increase in benefits paid is most likely a result of increases in the ongoing costs of medical treatment and associated payments (i.e. loss of earnings, impairment benefits, long‐term care).

45
4. Targeting speed enforcement activities


Targeting speed enforcement activities 47
4.1 Introduction
The purpose of the speed enforcement program and the rationale for location of speed cameras is often questioned. Some critics suggest that the program’s primary intention is revenue raising rather than improving safety.
This part of the report considers whether the allocation and deployment of resources for speed enforcement is based, first and foremost, on considerations of road user safety. We assessed the strategic and operational decisions around the program to determine whether they were made with the primary objective of reducing speed‐related road trauma.
We examined whether: • decisions about statewide speed enforcement strategy were based on
sound evidence of road safety benefits • strategic decisions about allocating resources between police
enforcement, fixed cameras and mobile cameras, target deterrence effects and risk
• operational deployment to mobile camera sites is based on reducing crash risk.
Figure 4A below briefly describes road safety revenue and expenditure.
FIGURE 4A: ROAD SAFETY REVENUE AND EXPENDITURE
Currently, the revenue from speed cameras accounts for about half of all fines revenue in Victoria. Further detail on trends over time is provided in Part 6 of this report. In brief, in 2004-05, speeding fines raised around $166.9 million in revenue, and in 2005-06, this is predicted to increase to $233.4 million. Revenue from all traffic infringements in 2004-05 was $244.6 million. Victoria’s expenditure on road safety (across Victoria Police, VicRoads, the Department of Justice and the Transport Accident Commission) in 2004-05 was estimated at more than $370 million. This included: • $53 million in direct expenditure on road safety programs in VicRoads • $62 million for the safer roads infrastructure program ($240 million over the life of the program)
• $18 million for the statewide black-spot program ($240 million over the life of the program) • $149 million for general road infrastructure improvements (of which 10 per cent was estimated to
be for safety improvements), and $195 million of VicRoads expenditure on maintenance (of which 10 per cent was considered as a contribution to road safety)
• $50 million for processing traffic infringements • $25 million for road safety awareness, enforcement and technology programs at the TAC
• $130 million for Victoria Police road enforcement, and road incident traffic management. In the 2005-06 budget, the government announced that from 1 July 2005, all speed and red-light camera fines revenue would be spent on road safety. Source: Ministerial Council for Road Safety and the Department of Justice.

48 Targeting speed enforcement activities
4.2 Are the arrive alive! speed enforcement strategies based on sound evidence?
In 2001, the Monash University Accident Research Centre (MUARC) assessed 17 possible initiatives for inclusion in a Victorian road safety strategy and estimated the likely impact various initiatives would have on reducing the road toll.
The report estimated that improvements to road design and roadside safety would lead to the greatest reduction in road trauma, but that behavioural changes led by speed reductions could also lead to similar outcomes. It calculated that a reduction in mean travel speeds by 10 per cent could reduce fatalities by 36 per cent and serious injuries by 27 per cent. Travel speeds could be reduced through a number of measures, including lowering 60 km/h zones to 50 km/h zones, and strengthening speed enforcement to improve compliance with legal speed limits1.
In 2002, a ministerial forum was held in response to the Victorian road toll of 444 in 2001, which was the highest for 10 years. It considered the relatively moderate outcomes of Victoria’s “Safety First” road safety strategy for 1995 to 2000, the recently released arrive alive! strategy for 2002 to 2007, and any additional, critical priority actions. The forum identified that focused, well‐resourced and more radical actions needed to be implemented immediately2.
The ministerial forum highlighted an urgency to achieve road trauma reductions and, therefore, a strong focus was given to behavioural change programs, such as speed enforcement. Behavioural programs can be implemented more quickly than infrastructure projects and, as a result, have a more immediate impact on the road toll.
The recommendations presented by MUARC were generally consistent with the arrive alive! policy. Key initiatives for the speed enforcement component of arrive alive! included: • increased attention to “lower level speeding” • intensifying enforcement efforts – more hours for the mobile camera
program, more fixed cameras and a trial of point‐to‐point technology • making enforcement more unpredictable – including implementing
“flashless” mobile cameras and a mix of marked and unmarked vehicles • reviewing the speed camera strategy. 1 N Haworth, Road Safety Strategy 2001‐2006: Update of estimates of possible reductions, Monash University Accident Research Centre, Melbourne, 2001. 2 The background research paper for the forum was: Monash University Accident Research Centre, Report on road safety policy development forum, Monash University, Melbourne, 2002.

Targeting speed enforcement activities 49
In the next sections we examine the major elements of the policy, the extent to which they were underpinned by evidence‐based research and how far they have been implemented.
4.2.1 Increased attention to “lower level speeding” The arrive alive! strategy emphasised the importance of improving compliance with speed limits, and reducing speeding that was previously seen as “low‐level speeding” (less than 10 km/h above the speed limit). This was based on research showing that the relative risk of crash involvement3 approximately doubles for each 5 km/h increase in speed above 60 km/h4.
A number of initiatives implemented through arrive alive! supported this objective, including the “wipe off 5” education campaign and the subsequent reduction in enforcement thresholds.
Implementing reduced enforcement thresholds to ensure more “low‐level speeding” could be detected and enforced was simple for automated detection, as machines have no discretion on which offences they enforce. However, police officers have discretion, and Victoria Police reported that initially, it had some difficulty getting some officers to focus on lower level speeds.
Figure 4B shows the difference in the distribution between speeding infringements issued by cameras, and speeding infringements issued by police.
3 Relative to a speed of 60 km/h in urban 60 km/h zones. 4 C Kloeden, A McLean and G Glonek, Reanalysis of travelling speed and the risk of crash involvement in Adelaide, South Australia, Australian Transport Safety Bureau, Canberra, 2002.

50 Targeting speed enforcement activities
FIGURE 4B: INFRINGEMENT CATEGORIES BY ENFORCEMENT METHOD, 2005
0
50
100
150
200
250
300
350
400
Numb
er of
infrin
geme
nts ('0
00)
Police on-the-spot infringements 27 705 131 274 11 852 3 619 2 083
Camera infringements 399 980 340 032 8 695 1 457 367
Less than 10 km/h 10-24 km/h 25-34 km/h 35-44 km/h 45+ km/h
Source: Victorian Auditor‐Generalʹs Office, from Department of Justice data.
Figure 4B shows that the distribution of speeds detected by enforcement technology reflects the typical distribution of speeds, with the greatest proportion of infringements for less than 10 km/h above the limit, and declining traffic infringement notices (TINs) at higher levels. Police‐issued speeding infringement notices are much more likely to be for speeds 10 km/h or more above the speed limit.
We also found that, over time, there has been a slight improvement in the attention paid to lower level speeds by police, with the percentage of TINs issued by police for offences under 10 km/h above the limit increasing by around one per cent per year since 2001.
4.2.2 Increase in automated enforcement effort Under the arrive alive! strategy, the number of hours available for mobile speed detection increased, and the range of speed detection equipment in use expanded.
Mobile cameras
During most of the 1990s the camera hours remained relatively static between 4 000 and 4 200 hours per month. In the lead‐up to, and during arrive alive!, the following increases were made: • between August 2001 and February 2002, statewide camera hours were
progressively increased to 6 000 target hours per month

Targeting speed enforcement activities 51
• in December 2004, camera hours were increased from 6 000 hours per month to 7 000 hours5.
The first increase in operating hours was based on a cost‐benefit economic analysis of the program conducted by MUARC in 20006. The study considered the costs of running the program and the potential benefit in terms of reduced social costs through crash reduction. It identified a range of 3 592 to 6 408 enforcement hours per month as optimal at that time.
It should be noted that “optimal” meant that although there would still be road safety benefits from enforcement hours above the level of 6 408, beyond this point the rate of economic return7 would begin to diminish.
The second increase in operating hours, from 6 000 to 7 000 hours per month, was used to supplement the state level enforcement when fixed speed cameras were taken off‐line.
In June 2006, the Department of Justice approved the reduction of operating hours back to 6 000 per month, effective from 1 July 2006.
Fixed cameras
The arrive alive! strategy committed to additional speed‐only fixed cameras, improved red‐light speed camera systems and a trial of point‐to‐point technology on freeway cameras on the Hume Highway.
In 2002, 35 sites on 5 major freeways were identified for speed‐only fixed cameras. In 2003, another 82 sites at 78 intersections were identified for fixed red‐light speed cameras.
Problems identified in 2003 with the accuracy and reliability of the fixed camera system on the Western Ring Road meant that all operating fixed cameras in use at the time were suspended. Operation of the remainder of cameras was delayed while measures were put in place to ensure that the systems were accurate (these measures are described in Part 5 of the report).
5 From 1 July 2006, mobile camera hours will be reduced back to 6 000 per month. 6 K Gelb, S Narayan, K Diamantopoulou and M Cameron, An economic assessment of the speed camera program, Monash University Accident Research Centre, Melbourne, 2000. 7 The “rate of economic return” is the ratio of the cost of an activity to the potential economic benefit from that activity.

52 Targeting speed enforcement activities
In March 2006, fixed cameras on CityLink/Monash Freeway, Geelong Road and at 31 red‐light speed camera sites were fully operational (i.e. cameras were active and infringements were being issued). New operations on the West Gate Bridge were active for a short time before being suspended. The Department of Justice advised us that the remainder of red‐light speed cameras and cameras on the Western Ring Road would commence operation by the end of 2006.
At June 2006, the installation works for the trial of point‐to‐point technology on the Hume Highway were in place, but the system had not yet commenced operation.
4.2.3 Making enforcement more unpredictable arrive alive! included a number of initiatives to make enforcement more unpredictable, such as the staged introduction of “flashless” cameras, increased use of unmarked cars, and use of new locations and times of day for enforcement.
The rationale for this was that making it harder for motorists to predict when and where enforcement will occur, increases the likelihood that they will comply with the speed limit at all times and in all locations.
Experience in Victoria and other jurisdictions has shown that overt detection produces immediate, localised speed reduction, as motorists slow down because of the certainty of detection in the region of the camera. However, overt detection is less successful at slowing speeds across the road network, as many motorists will adjust their speed up again when they have passed the camera location8. Many in the community see overt detection as more acceptable and “fair”, but that may also reflect a perception that overt detection lowers the chances of being detected and punished for speeding.
Since the strategy was launched in 2002, there has been a shift toward more overt detection. In April 2006, the government publicly released the locations for all fixed camera sites and approved mobile speed camera sites (although the time of activity remains confidential).
8 A Delaney, K Diamantopoulou and M Cameron, MUARC’s speed enforcement research: Principles learnt and implications for practice, Monash University Accident Research Centre, Melbourne, 2003.

Targeting speed enforcement activities 53
4.2.4 Review of the speed camera strategy arrive alive! and the Victoria Police Road Safety Enforcement Strategy committed to a “review of the speed camera strategy”9. In 2003, MUARC conducted a review of research into Victorian, interstate and international automated enforcement systems10. The review was used to inform the future strategic directions of new and existing speed camera technology in Victoria and to provide a scientific basis for the speed camera strategy.
4.2.5 Conclusion – Evidence base for the arrive alive! speed enforcement strategies We found that the stronger focus on speed enforcement under arrive alive! was underpinned by thorough research, conducted by independent bodies.
The increased attention to “lower‐level speeding” and the introduction of additional mobile camera hours were based on sound research showing clear evidence of benefit, and were implemented as planned.
The planned steps to make enforcement less predictable were partially implemented, however, the road safety agencies have since responded to community concerns about speed enforcement by increasing the emphasis on overt detection within the mix of enforcement methods. Steps that were not envisaged in the original strategy, such as publicly disclosing speed camera sites, have been taken.
Building and maintaining community confidence in the program is an important consideration in managing the program. However the road safety agencies will need to monitor performance into the future in order to ensure that the network‐wide deterrence effects obtained through covert, unpredictable enforcement are not lost.
The planned review of the speed camera strategy was undertaken in the early stages of arrive alive!. In addition, recent problems have led to further reviews of some elements of the automated enforcement system, particularly in terms of quality assurance.
Given the number of changes to the speed enforcement strategy since arrive alive! began, a comprehensive review of the whole speed enforcement strategy should be considered during the development of any road safety strategy to succeed arrive alive!.
9 Victoria Police, 2003, Victoria Police road safety enforcement strategy 2003‐2008, Victoria Police, Melbourne. 10 M Cameron, A Delaney, K Diamantopoulou and B Lough, Scientific basis for the strategic direction of the safety camera program in Victoria, Monash University Accident Research Centre, Melbourne, 2003.

54 Targeting speed enforcement activities
4.3 Are statewide resources allocated to maximise deterrence effects and risk reduction?
Fixed and mobile speed cameras are often cited as “revenue raisers” because of their relatively low operational costs compared with police detection and the large number of vehicles that can be detected under automated systems. We examined the allocation of resources between the 3 detection systems, and the process of determining the locations of automated enforcement.
We expected that decisions about the mix of police and automated enforcement would be based on maximising the deterrence effects of the enforcement program, and reducing the number of casualty crashes.
We expected that the distribution of effort to the different enforcement methods would support the objective of providing a mix of targeted and network‐wide deterrents. In practice, this would mean that the highest risk sites and speed zones would be identified for attention, but this would be balanced with generalised and random coverage across the whole network.
We also expected that there would be clear and transparent processes for selecting locations for automated enforcement.
4.3.1 Coverage – Determining the enforcement mix While there are particular factors that can make certain locations a greater crash risk than others (such as high traffic volumes and the road environment), speed‐related crashes can occur anywhere on the road network, at anytime. A sound strategy for reducing speed‐related crashes must balance activities across the highest risk locations and across the road network as a whole.
The mobile camera network provides coverage across a geographically wide area, with cameras located at any of 2 600 sites across the state.
There are 2 types of fixed speed cameras operating in Victoria. They are: • red‐light speed cameras located at high risk intersections • speed‐only cameras located on high traffic volume freeways and
highways.
Police on‐road enforcement can occur at any time and any place in the road network. Road policing can be covert or overt.

Targeting speed enforcement activities 55
Alignment of enforcement activity to trauma distribution
We considered whether the areas targeted by enforcement broadly line up with the distribution of casualty crashes.
Figure 4C shows the breakdown of serious casualties in 2005 by speed zone in the Melbourne Statistical Division and the rest of Victoria.
FIGURE 4C: DISTRIBUTION OF ROAD TRAUMA BY SPEED ZONE, 2005
1 216
412 545
236
1 084
2 402
64 12619233973
0
500
1 000
1 500
2 000
2 500
40, 50 & 60km/h
70, 80 & 90km/h
100 & 110 km/h 40, 50 & 60km/h
70, 80 & 90km/h
100 & 110 km/h
Melbourne Statistical Division Rest of Victoria
Numb
er
Serious injuries Fatalities
Note: Serious injury data are estimated based on year‐to‐date data for 1 Jan. – 30 Nov. 2005. A small amount of police recorded crash data does not include speed zone information, therefore, in some cases, yearly totals (by speed zone) do not add up to actual yearly fatality and serious injury totals. Source: Victorian Auditor‐Generalʹs Office, from VicRoads data.
The broad patterns of trauma distribution show that the majority of all serious crashes in metropolitan Melbourne occur in 40, 50 and 60 km/h speed zones. In Melbourne’s 70, 80 and 90 km/h and 100 and 110 km/h zones, there are fewer crashes, however, the proportion of fatal crashes in these zones is higher than in lower speed zones.
In the rest of Victoria, the majority of serious casualties occurs in 100 and 110 km/h zones. Similar to the Melbourne Statistical Division, the higher travel speeds mean that a far greater proportion of casualties in the higher speed zones are fatalities.

56 Targeting speed enforcement activities
While it is possible to precisely quantify the hours and locations of fixed and mobile camera enforcement, it is not possible to know exactly how long and where police on‐road enforcement occurs, as it is often undertaken in conjunction with other duties.
However, one measure of the relative share of activity between enforcement methods is the number of speeding infringements issued. Figure 4D shows the percentage share of all speeding fines issued between the 3 detection systems.
FIGURE 4D: SHARE OF SPEEDING INFRINGEMENTS BY ENFORCEMENT METHOD
0%
10%
20%
30%
40%
50%
60%
70%
80%
90%
100%
Shar
e of s
peed
infrin
geme
nts is
sued
Police on-the-spot 29.17% 24.88% 24.37% 16.38% 20.98% 18.74%
Fixed cameras 0.00% 5.33% 11.69% 9.59% 3.09% 5.90%
Mobile cameras 70.83% 69.79% 63.95% 74.03% 75.93% 75.36%
1999-2000 2000-01 2001-02 2002-03 2003-04 2004-05
Source: Victorian Auditor‐Generalʹs Office, from the Department of Justice data.
Figure 4D shows that mobile cameras account for the majority of speeding infringements issued. While mobile cameras can be used in any speed zone, our data analysis showed that generally around 60 per cent of mobile camera hours are in 60 km/h and lower zones. This is where the greatest volume of casualty crashes occurs.
Currently, the fixed camera program accounts for the smallest percentage of infringement notices issued, although this share is likely to increase as the fixed camera program becomes fully operational.
Speeding infringements issued by Victoria Police have decreased from almost a third of all fines issued in 1999‐2000 to about a fifth in 2004‐05. This decrease has been in real as well as relative terms.
Figure 4E shows the change over time in the number of police‐recorded speeding offences against the level of enforcement effort.

Targeting speed enforcement activities 57
FIGURE 4E: TOTAL POLICE HOURS OF ENFORCEMENT EFFORT AND NUMBER OF OFFENCES RECORDED
130
140
150
160
170
180
190
200
Numb
er ('0
00)
Offences recorded 186 636 154 785 152 221 141 466
Enforcement hours 195 878 178 422 175 204 166 092
2002 2003 2004 2005
Note: Police hours refers to dedicated speed enforcement hours operating speed detection devices. Source: Victorian Auditor Generalʹs Office, from Victoria Police data.
Police‐recorded speeding offences fell by about 24 per cent from 2002 to 2005. This reduction in real terms corresponds with a 15 per cent drop in enforcement effort (i.e. total time spent operating speed detection equipment). Victoria Police advised us that enforcement effort has reduced because traffic police are spending more time on general policing duties (such as responding to domestic disputes), and more time recording and analysing data. Some police also commented that as drivers are slowing down, there are fewer drivers speeding and it is more difficult to detect speeding offenders.
4.3.2 Determining camera locations Determining the location of fixed and mobile traffic cameras and the operating hours of mobile cameras is the responsibility of Victoria Police. We expected that decisions about camera location and operating hours for mobile cameras would be made based on rigorous and transparent criteria.

58 Targeting speed enforcement activities
Mobile camera site selection
Mobile camera sites must satisfy a number of requirements which are documented in the Victoria Police Traffic Camera Office Mobile Cameras Policy Manual11. These guidelines have recently been made publicly available on the Department of Justice’s website12.
The primary consideration is that every location considered as a speed camera site “must have a significant, documented history of serious or major injury collisions within the previous 12 months ... be the subject of a validated written complaint of excessive speeds ... or be assessed by a Traffic Management Unit Sergeant or above as posing a significant risk of speed related collisions”.
In addition to the above, sites must meet physical criteria, including: • not located on a bend in the road • not located on a descending gradient or within 300 metres of the bottom
of a hill, unless the site has a significant speed‐related collision record • not located within 200 metres of a change in speed zone, applicable to
the same length of road13 • safe for the camera operators and for members of the public • not interfering with traffic flow.
Mobile camera sites must also be assessed for, and meet, certain technical requirements, so that any possible interference with the beam is eliminated.
We examined records of sites in 3 Victoria Police regions14, and found that all sites had either a crash history or had been assessed as a crash risk. In some cases, the documented crash history extended over a longer period than the 12 months required under the current guidelines.
11 Victoria Police Traffic Camera Office, Mobile Cameras Policy Manual, Victoria Police, Melbourne, 2006. 12 <http://www.justice.vic.gov.au/speedcameras>, viewed on 1 June 2006. 13 The exception to this is that a regional traffic inspector may provide written authorisation for speed camera enforcement limits at a children’s crossing or in a school zone, subject to a number of other conditions, including appropriate proactive policing and community awareness activities to encourage voluntary compliance. 14 Victoria Police divides the state into 5 regions for operational purposes.
Targeting speed enforcement activities 59
Community involvement in mobile camera site selection
The Victoria Police Mobile Cameras Policy Manual states that Traffic Management Units (TMUs) must formally consult with their local Community Road Safety Council (CRSC) executive when approving speed camera sites and developing associated enforcement strategies. All CRSCs have a police member. The CRSCs must be provided with all relevant data, including collision data and a list of existing sites, and be given the opportunity to: sponsor new sites; recommend enforcement cease at specific sites if there is evidence of community concern; and recommend enforcement strategies (for example, rank sites for attention, suggest enforcement times).
We surveyed 17 CRSCs to see if they were formally consulted on camera site issues. We found that: • only 4 formally discuss and ratify the sites at their meetings • eleven do not formally discuss sites, but do make recommendations
about sites from time‐to‐time • only one discussed camera enforcement strategies at the meeting.
The majority of the CRSCs surveyed had a very good relationship with their police TMU and felt that the TMU’s presence on the committee gave them ample opportunity to be involved in speed enforcement. They felt it was not necessary to be involved in the specifics of camera locations because: • the meetings are already large (they usually cover at least 3
municipalities) and cover many issues • the committee trusts police to handle the technical issues of siting • they are confident that their participation in a number of education
programs is a satisfactory input into the speed enforcement effort.
Committee members interviewed felt that camera issues were better directed to the local TMU which was better resourced (committee members are volunteers and do not have time to be on too many sub committees) to look at problems like camera locations.
Fixed camera site selection
Victoria Police is responsible for determining the location of fixed cameras, in collaboration with the other road safety partner agencies.

60 Targeting speed enforcement activities
The Victoria Police Speed camera site selection criteria document provides a broad statement that site selection for fixed cameras should take into account traffic volume, and whether speed is an identified problem at the site. However, the document does not have detailed criteria for selecting fixed camera sites. For example, there is no requirement to consider crash history or crash potential for fixed camera sites.
We were advised that the selection of the initial sites in 2002 and 2003 was based on advice from the road safety partner agencies and relevant research, but the documented rationale could not be made available at our request.
4.3.3 Conclusion – Statewide resource allocation Victoria’s speed enforcement program uses a mix of complementary approaches to improve compliance with the speed limit both at identified high risk locations and across the road network generally.
There is no single correct formula for deciding on the best mix of fixed and mobile camera and on‐road police enforcement. The speed enforcement program uses a mix of covert and overt detection approaches, and targets speeding behaviour across all speed zones. Statewide, the distribution of speed enforcement activity broadly aligns with distribution of trauma – there is greater activity in areas where there is the highest volume of trauma and the highest economic and social costs.
The program currently puts more emphasis on addressing specific risk areas than on promoting general deterrence across the network. This is evident in the strong emphasis being given to crash history at sites, and the shift toward more overt detection. This ensures the most efficient use of limited resources but the balance will need to be carefully monitored into the future to ensure that the general, network‐wide deterrence effects of the program are maintained.
Site selection guidelines for mobile speed cameras target areas and individual locations with high speed risks, but are also heavily weighted to ensuring that the system is seen as credible and fair. This is an important consideration for retaining confidence in the program. Victoria Police has built safeguards into the program to ensure that the more subjective selection criteria are only applied by experienced staff.
The requirement for community involvement also supports the objective of building community confidence in the program. However, we found that in practice many CRSCs did not want the level of involvement that is available under the current guidelines.

Targeting speed enforcement activities 61
Current guidelines for mobile camera sites emphasise the need for a documented history of serious or major injury collisions in the previous 12 months. This builds community confidence that the purpose of the system is to improve road safety rather than raise revenue. However, there are a number of practical difficulties with this requirement: • For sites with low traffic volumes, 12 months without a crash occurring
may not indicate that there is no speed‐related crash risk. • While crash history at a site is one predictor of risk, crash risk is
increased by excessive speed anywhere, anytime, not just at those sites that already have a crash history.
• Current guidelines indicate that a camera site should be removed from the list if its recent crash history “expires”. In practice, this means that if sites are achieving the objective of reducing speeds and crashes, they would be taken out of action.
Documented site selection guidelines for fixed cameras are far less comprehensive than those for mobile cameras. While the guidelines outline some of the principles to consider, there are no specific criteria to guide site selection or provide a rationale for the selection of one site over another. As fixed cameras do not have the flexible deployment capacity of mobile cameras, they represent a substantial investment in a single location. The consequences of getting site selection wrong are consequently greater than for mobile cameras.
We found that the current fixed camera sites could be justified, however, any future site selection should be based on a robust, documented process. This is important for efficient use of resources, and for retaining community confidence, particularly given that it is likely that infringements from fixed cameras will grow substantially in the future as the cameras come back on‐line.
Recommendations
1. That Victoria Police reviews the “crash history in the previous 12 months” provisions for site selection for mobile cameras and considers whether 12 months is an appropriate period.
2. That Victoria Police, in consultation with the Department of Justice, VicRoads and the TAC, develops and implements more detailed site selection guidelines for fixed cameras.
62 Targeting speed enforcement activities
RESPONSE provided by Chief Commissioner, Victoria Police
Recommendations 1 and 2
Agreed.
Audit comments and recommendations noted.
RESPONSE provided by Chief Executive Officer, VicRoads
Recommendation 2
Partially agreed.
VicRoads will continue to provide advice to Victoria Police and the Department of Justice on general road safety and infrastructure matters as they relate to site selection and placement of fixed safety cameras. VicRoads will not provide advice regarding the operation of fixed cameras.
4.4 Is deployment of mobile cameras based on risk?
With the large number of approved mobile camera sites, and a fixed number of camera hours to deploy, Victoria Police needs to make tactical decisions about allocating hours to sites. Victoria Police’s Road Policing Strategy, released in May 2006, highlights intelligence‐led policing as one of the 3 key focus areas to drive police enforcement activities into the future15. It states that, “intelligence‐based systems enable police to predict where trauma is most likely to occur and direct resources accordingly for preventative enforcement”.
Victoria Police uses intelligence‐based systems to assist the planning of deployment activities according to a “black‐spot approach” and “black‐time approach”.
The 7 000 camera hours per month are allocated between Victoria Police’s 5 regions by the Traffic Camera Office (TCO). In each region, TMU coordinators prepare the rosters allocating camera time to sites.
We examined patterns of deployment to approved mobile speed camera sites to test whether deployment decisions considered available intelligence and were based on maximising the deterrence effect and road safety benefits.
15 Victoria Police, Road Policing Strategy, Melbourne, 2006.

Targeting speed enforcement activities 63
4.4.1 Allocating camera hours between regions The TCO is responsible for allocating a quota of mobile camera operating hours to individual TMUs across the 5 regions. To determine the appropriate allocation, the TCO analyses recent crash locations and frequencies. The analysis is based on the premise that the proportion of camera hours should correspond with the proportion of crashes in that TMU area.
The TCO also analyses mobile camera operations in terms of the number of vehicles assessed and the number of offences detected during each camera session. While this data could be used to better assist TMU coordinators with targeted mobile camera rostering, the information is not regularly made available to them. We were told by TMU coordinators that the TCO only provides this data if specifically requested.
4.4.2 Allocating camera hours to approved sites TMU coordinators are responsible for rostering their allocation of mobile camera hours to approved sites.
We examined detailed deployment records showing the number of camera hours spent at each approved site in 3 police regions for 2004 and 2005. These records showed the site, speed zone, number of camera sessions at the site in each year, total number of hours at the site and the number of offenders.
Crash numbers at a single site were generally small, so we did not attempt a further correlation between the relative crash rates at each site and the number of hours at each site.
Generally, we found a good spread of activity across approved sites, with no more than one per cent of time spent at any one site in the larger regions.
We compared the data on the number of hours at each site with traffic volume at each site and numbers of offenders at each site. This analysis showed that the most significant predictor of site rostering was the volume of traffic at the site, followed by the number of offenders. There was no evidence that sites with the highest “hit rates” of offenders were being targeted for activity in a way that was out of proportion to traffic volumes at these sites.

64 Targeting speed enforcement activities
Responding to speeding “hot spots”
The TCO regularly reports on mobile speed camera activity, listing the number of vehicles assessed and the percentage of motorists speeding for each site. Individual “problem” sites where more than 5 per cent of vehicles are speeding are highlighted for attention.
Some TMU coordinators informed us that this type of analysis was not available to them on a regular basis.
Victoria Police and VicRoads advised us that “problem” sites are addressed through discussion between local Victoria Police and VicRoads staff. However, we found a number of sites where speeding was a persistent problem.
Statewide, the average percentage of motorists detected speeding at particular sites is around 1‐2 per cent. When we examined the records for speed camera sites for 2004 and 2005 we found a small number of sites where persistently high percentages of motorists (more than 10 per cent) were detected speeding.
Extreme examples included: • a 50 km/h speed zone in Ferntree Gully where 21 per cent of all
motorists were detected speeding in 2004. In 2005, this site was still in use, and nearly 17 per cent of motorists were speeding.
• a 50 km/h zone on The Great Ocean Road where more than 19 per cent of motorists were detected speeding in 2004 and 16 per cent in 2005.
We found that during 2005, in each region from 5‐7 per cent of sites were speeding “hot‐spots” where more than 10 per cent of motorists exceeded the legal speed limit. The sites were most likely to be 50 or 60 km/h speed zones.
We found no evidence that these “hot‐spots” were targeted for additional enforcement activity above the normal, in fact they were slightly under‐represented. While they made up 5‐7 per cent of sites, in total only 3‐4 per cent of camera hours were spent at these sites.
While in nearly all cases the percentage of motorists speeding at each site had reduced slightly between 2004 and 2005, we were concerned that significant percentages of motorists were still speeding at these sites. We were also concerned that when it became apparent that enforcement had failed to change behaviour, other ways of slowing motorists down (such as visible police presence and enforcement, increased signage and traffic calming measures) were not investigated.

Targeting speed enforcement activities 65
4.4.3 Selecting the best times to operate the cameras The State Intelligence Division (SID) of Victoria Polices analyses the times (i.e. hours of the day and days of the week) when road trauma occurs to assist TMU coordinators to proactively deploy mobile cameras to high crash risk times based on crash history.
The SID maps the frequency distribution of trauma crashes to each hour of the day. This analysis is prepared at state and local government area levels and is broken down by weekday and weekend to capture the different traffic patterns over the weekend. This trauma analysis tool is updated monthly.
Figure 4F shows an example of a trauma time analysis graph.
FIGURE 4F: TRAUMA TIME ANALYSIS GRAPH
Weekdays by hour of day
0.0%
1.0%
2.0%
3.0%
4.0%
5.0%
6.0%
7.0%
8.0%
9.0%
10.0%
01
2
3
4
5
6
7
8
9
10
1112
13
14
15
16
17
18
19
20
21
2223
Trauma

66 Targeting speed enforcement activities
Weekends by hour of day
0.0%
1.0%
2.0%
3.0%
4.0%
5.0%
6.0%
7.0%0
12
3
4
5
6
7
8
9
1011
1213
14
15
16
17
18
19
20
21
2223
Trauma
Source: Victoria Police.
The SID maps mobile camera enforcement hours in the same way, to compare the alignment between crash history and camera enforcement.
Specifically, the safety camera submission analyses show: • the distribution of the previous and current months’ rostered mobile
camera hours • the distribution of on‐road enforcement hours • the time distribution of trauma based on the past 5 years’ crash data.
The analysis can help Victoria Police regional staff to identify the best operating times but it has limitations. The major limitation is that it gives no indication of where to roster cameras.
We found that while state level analysis showed a good match of enforcement to trauma patterns, alignment at local government level was variable. In practice, there was considerable variation in how the TMU coordinators used the analysis for rostering. Some placed high reliance on it while others were conscious of its limitations and considered other factors as well.
We did not expect the mobile camera effort to exactly match the trauma time distribution because the trauma graph does not take into account: • local knowledge • speed complaints

Targeting speed enforcement activities 67
• camera operator safety issues • enforcement by police mobile patrols.
Also, the trauma graph is based on all road trauma; that is, it does not isolate trauma caused by speed. This represents a limitation for mobile enforcement because cameras can only enforce speed. However, for targeted on‐road policing operations, this does not impose such a limitation because police can enforce a number of unsafe driving behaviours.
TMU coordinators advised that occupational health and safety issues can also constrain camera rostering.
Local intelligence
At a local level, each region prepares its own analyses for preventative enforcement. Police regional and divisional intelligence management units provide local intelligence to all aspects of police operations, including traffic management. TMU coordinators and regional traffic inspectors consistently commented that crime intelligence was often given priority and that analytical resources were stretched too far to provide regular, quality traffic analyses. At best, the intelligence units could provide data but left the analysis up to the TMU coordinator or regional traffic inspector.
We found that the sophistication and quality of these analyses varied according to the skills and resources available. As a result, a variety of analytical methods are used. For example, one TMU was using a map‐based system to supplement the “trauma time analysis graph”. We were also informed that the SID is currently trialling a Geographic Information System (GIS) to map the locations of crashes and traffic.
4.4.4 Conclusion – Deployment to speed camera sites We are satisfied that targeting of mobile camera activity to sites is primarily based on reducing travel speeds and risk, rather than maximising the numbers of infringements issued.
Deployment to sites takes into account crash history, traffic volume and infringement rates. We found no evidence that deployment to sites was targeted at maximising “hit rates” of infringements. The evidence we examined showed that sites with the greatest traffic volumes were slightly more likely to be selected than sites with high infringement rates. Both indicators can be justified on safety grounds.

68 Targeting speed enforcement activities
Victoria Police has a sound process for monitoring activity at speed camera sites, and is able to identify sites where enforcement activity does not reduce the percentage of speeding motorists. However, a small number of sites have a regular and persistent problem. The high proportion of infringements at these sites (over 20 per cent at some sites) and the fact that they are predominantly 50 km/h sites suggests that there may be poor driver awareness of the legal limit at these sites, or the speed limit is inappropriate.
If the speed enforcement program is to remain credible, then Victoria Police and roads authorities need to develop a systematic process to review these “hot spots”, and implement appropriate alternative measures for slowing motorists down.
Victoria Police has several sources of intelligence on road trauma and speed enforcement distribution patterns. This intelligence is used to allocate camera hours between regions but is not always readily available to local TMUs.
We are satisfied that TMU coordinators roster camera hours to approved sites using available intelligence and a risk‐based approach. Victoria Police needs to improve the quality and accessibility of the information and ensure systematic and consistent processes are used across units.
Victoria Police also needs to ensure that the use of intelligence‐based systems to determine tactical speed enforcement does not remove the random element from the enforcement, which underpins the general perception that enforcement can occur “anywhere, anytime”.
Recommendations
3. That Victoria Police: • enhances current traffic intelligence tools • provides regional areas with better access to centralised
intelligence • trains traffic police to understand and use intelligence tools.
4. That Victoria Police and VicRoads develop formal arrangements to jointly review sites where speed remains a problem, and implement additional measures where appropriate.

Targeting speed enforcement activities 69
RESPONSE provided by Chief Commissioner, Victoria Police
Recommendations 3 and 4
Agreed.
Audit comments and recommendations noted.
RESPONSE provided by Chief Executive Officer, VicRoads
Recommendation 4
Agreed.
VicRoads and Victoria Police have close working relationships on a number of levels, the most formal being within the Road Safety Management (officials) Group and the Road Safety Executive Group. In these groups, key road safety matters are identified and addressed, or options for policy change recommended to the government.
Site‐specific issues are addressed at an operational level, often through the Community Road Safety Councils on which both VicRoads and Victoria Police are represented.
As identified in the report, sites where speed remains a compliance problem tend to be on lower speed roads, which are generally the responsibility of local government. VicRoads supports local government in addressing speed‐related problems on these roads through programs such as the Not so fast program and the use of speed awareness trailers. Additionally, VicRoads is developing Local Area Traffic Management guidelines for use on lower speed roads to help driver compliance with speed limits.

71
5. Quality assurance measures


Quality assurance measures 73
5.1 Introduction
An effective speed enforcement program must be able to sustain public confidence and withstand legal scrutiny to allow prosecution. To achieve this, the speed detection equipment must be maintained, tested and certified to ensure accuracy, and it must be used appropriately according to guidelines.
Victorian regulations and equipment manufacturers’ specifications control and guide the certification and use of speed detection equipment.
We expected to find that: • equipment maintenance, testing and certification processes comply with
relevant regulations • equipment is used in accordance with relevant regulations and
operational guidelines, and there are adequate audit or monitoring processes to ensure quality.
Primary responsibilities are shared between Victoria Police, the Department of Justice and private contractors, although some aspects such as fixed camera site selection are undertaken in consultation with other road safety agencies.
Figure 5A details the mix of responsibilities.
FIGURE 5A: SPEED DETECTION RESPONSIBILITIES
Enforcement system Victoria Police Department of Justice Private operators Fixed cameras Site selection Contract management
and quality assurance Maintenance, testing and certification Operation
Mobile cameras Training Site identification and selection Rostering
Contract management and quality assurance
Maintenance, testing and certification Operation
Police enforcement Operation Maintenance, testing and certification Training
n.a. n.a.
Source: Victorian Auditor‐Generalʹs Office.

74 Quality assurance measures
5.1.1 Speed detection devices used in Victoria Victoria’s traffic enforcement agencies use different types of automated and police‐operated speed detection equipment. Automated devices include fixed and mobile cameras which are operated by private contractors with oversight from the Department of Justice. Police‐operated devices include radar and laser devices and digitectors.
Automated speed detection devices
Fixed and mobile cameras operate as automated speed detection devices. The camera component of the device is triggered when a vehicle passes through the device’s detection field (e.g. radar beam or detector strips embedded within the road surface) at speeds greater than the “enforcement threshold” or “trigger speed” (discussed later in this part of the report).
Fixed cameras
Fixed cameras are permanently located on selected roads and intersections. Victoria has a mix of speed‐only fixed cameras operating on major highways and freeways, and red‐light and speed combined cameras1 at intersections. Fixed cameras are suitable for high‐volume traffic areas with either single or multiple lanes of traffic.
The fixed cameras currently in operation use detector strips embedded in the road with an independent infra‐red device used to verify detected speeds. The soon to be recommissioned cameras on the Western Ring Road will also use additional radar technology and the 8 sites earmarked for the Hume Highway will trial the use of point‐to‐point technology.
There are 4 private operators contracted to maintain and operate Victoria’s 117 fixed cameras2.
1 Red‐light only cameras also operate in Victoria. These cameras do not form part of the speed enforcement program. 2 At June 2006, all contracts for fixed camera had been awarded but not all had progressed to full operation.

Quality assurance measures 75
Two types of fixed camera devices used in Victoria. Left: A red‐light speed fixed camera located at an intersection. Right: A speed‐only fixed camera located on a highway and positioned on an overpass.
(Photos courtesy of the Department of Justice.)
Mobile speed cameras
Mobile cameras are operated within a stationary vehicle (mobile camera car) or from a tripod on the side of the road.
Tenix (a private contractor) operates 72 Gatsometer slant‐radar mobile cameras, in nearly 2 600 locations across the state. As discussed in Part 4 of this report, the location and times of deployment are determined by Victoria Police.
A mobile speed camera mounted inside a mobile camera car.
(Photo courtesy of the Department of Justice.)

76 Quality assurance measures
Police-operated speed detection devices
Victoria Police sworn officers use a number of speed detection devices and other tools to support speed allegations.
Hand-held laser devices
Victoria Police maintains and operates 216 hand‐held laser speed detection devices. When a hand‐held laser device is activated and aimed in the direction of a vehicle, a digital speed reading of that vehicle is displayed. Laser devices can detect speeds of motorists travelling in either direction, but must be operated while the operator is stationary.
Laser devices are most suitable in areas where traffic volumes are high, e.g. metropolitan Melbourne.
A police officer operating a hand‐held laser speed detection device.
(Photo courtesy of Victoria Police.)
Hand-held and mobile radar devices
Victoria Police maintains and operates 597 hand‐held and mobile radar devices.

Quality assurance measures 77
Similar to the hand‐held laser devices, when a hand‐held radar device is activated and aimed in the direction of a vehicle, a digital speed reading of that vehicle is displayed. Hand‐held radars can detect vehicle speeds travelling in either direction, but must also be operated while the operator is stationary.
Mobile radars, or moving mode radars (as distinct from mobile cameras, which also use radar technology), are installed in Traffic Management Unit (TMU) vehicles. Mobile radars can be operated while either stationary or moving.
Mobile radar devices are most suitable on low to medium traffic volume highways (i.e. they are not suitable for use in metropolitan areas).
Digitectors
Victoria Police maintain and operate 112 digitectors. A digitector is a device that measures the time taken for a vehicle to pass over 2 detector strips placed on top of the road, and then calculates the vehicle’s speed.
Digitectors are not commonly used because of the time taken for setting‐up the device and their poor covertness. Digitectors are most suitable on low to medium traffic volume highways.
Other speed measuring tools
Victoria Police also use speedometers and time, distance, speed (TDS) detectors for measuring vehicle speeds.
Speedometers
All 2 300 police vehicles have calibrated digital speedometers. The speed reading is taken from the police’s own speedometer while “maintaining an even distance”.
Vehicle speeds can be accurately measured by following a vehicle for a reasonable distance and “maintaining an even distance” between the 2 vehicles (in effect matching the other vehicle’s speed). Police officers commonly cite “maintaining an even distance” on infringement notices as the primary evidence to substantiate the police officer’s allegation that a motorist was speeding.
The use of speedometers is most suitable on low to medium traffic volume highways.

78 Quality assurance measures
Time, distance, speed detectors
A TDS detector incorporates both a digital speedometer and a distance/time speed calculator. The TDS detector calculates the average speed travelled over a distance determined by the operator (must be at least 300 metres).
TDS detectors are most suitable for use on low to medium traffic volume highways.
5.2 Are speed detection devices appropriately maintained, tested and certified?
Speed detection equipment must be accurate and maintained to standards that will withstand legal scrutiny to allow prosecution.
We assessed the maintenance, testing3 and certification4 systems in Victoria Police and the Department of Justice’s Road Safety Enforcement Technology unit (RSET).
The Road Safety (General) Regulations 19995 govern the testing and certification of prescribed speed detection devices6. There are no similar legal requirements for speedometers and TDS detectors.
5.2.1 Fixed cameras During the period of our audit fieldwork (September 2005‐April 2006), some of Victoria’s fixed speed cameras were being progressively re‐implemented after a period of being out of operation while problems with maintenance and accuracy of cameras at some locations were addressed.
Major changes in maintenance and monitoring controls were being implemented, and we were unable (due to timing) to assess whether the new maintenance, testing and certification procedures of the fixed camera program were operating effectively. However, we examined the early implementation of strategies to address the identified problems.
3 “Testing” includes checking whether the equipment operates correctly and is accurate to within prescribed error limits. 4 “Certification” is the formal approval of the accuracy and condition of a speed detection device by an independent, accredited testing officer. 5 Road Safety (General) Regulations 1999, Part 3, sections 301‐311. 6 Prescribed devices include 9 fixed camera types, 2 mobile cameras, radars, lasers and digitectors.

Quality assurance measures 79
Western Ring Road failure
In 2003, fixed cameras on Melbourne’s Western Ring Road were found to be producing a number of inaccurate speed readings. This failure was a significant blow to community confidence in Victoria’s speed camera program. It was also costly for government, with $13.7 million paid to refund around 90 000 speeding fines and $6 million for compensation payments.
In November 2003, following the initial identification of accuracy problems, the Department of Justice engaged independent testing consultants, SGS, to test the Western Ring Road and CityLink fixed cameras.
SGS found the primary causes of the inaccurate speed readings on the Western Ring Road were poor installation and inadequate maintenance of the fixed camera systems7. SGS also made a number of recommendations for improving the fixed camera program, which the government agreed to implement. The recommendations included: • establishing a new, dedicated unit in the Department of Justice to
manage all aspects of the automated detection devices • enhancing the maintenance and testing regime • upgrading cameras and image verification.
In May 2004, the government ordered a special investigation into the Western Ring Road contract and its management by the relevant department and agencies. This investigation acknowledged the SGS recommendations and also found8: • a lack of clear accountability between road safety agencies • a need for a new structure with clear governance protocols and
accountabilities • insufficient supervision of the contractor and contract activities • a failure to react promptly to warning signals about the system’s
reliability.
Establishment of the Road Safety Enforcement Technology unit
The SGS report recommended that consideration be given to consolidating functions such as policy and strategy coordination, technical compliance/standards/quality assurance and procurement and contract management in a unit within the Department of Justice.
7 SGS found no instances of erroneous speeding readings on CityLink that would have resulted in an infringement being incorrectly issued. 8 C Baragwanath, Inquiry into the Western Ring Road Fixed Digital Speed Camera System Contract and its management, Melbourne, 2004.

80 Quality assurance measures
In May 2004, the Department of Justice established the Road Safety Enforcement Technology Unit (RSET). The RSET unit oversees the management of the automated speed detection systems; its 3 functional areas are: • policy and strategy coordination • technical compliance and standards • operations and contract management.
Enhanced maintenance and testing regime
The RSET unit is progressively implementing an enhanced maintenance and testing regime as new fixed cameras are introduced and previously suspended cameras recommence operation. The improvements include: • monitoring of in‐road sensor signals on either a monthly or quarterly
basis9, to provide early indications of any degradation requiring maintenance
• surveying of road pavement surface conditions on a monthly or quarterly basis, to provide early warning of any deterioration requiring maintenance
• ongoing use of secondary speed measurement devices (e.g. infra‐red) at fixed camera sites to check on relative speed detection reliability (secondary devices are tested on a quarterly basis)
• continual monitoring and maintenance of all cameras.
As the maintenance and testing measures were being rolled‐out, we were unable to assess their effectiveness, however, we were advised that all operational fixed cameras are subject to the above improvements.
Camera and image verification upgrades
Following the Western Ring Road failure, the government decided in May 2004 to progressively upgrade the fixed camera program to incorporate the testing procedures used by SGS on the Western Ring Road and CityLink fixed camera systems. This involved using secondary speed measurement devices (infra‐red) at fixed camera sites to provide a secondary speed check before infringements were issued from those sites.
The government also announced its intention to upgrade fixed camera sites to include a “time over distance” secondary speed verification system. In this system, the camera captures 2 images of the speed incident, with the second image being taken after the vehicle has moved a set distance from its position in the first image. The system then calculates the speed using the time interval between the images.
9 Frequency depends on the type of system and whether it is an active site or not.

Quality assurance measures 81
Secondary speed verification for fixed camera operations was confirmed in August 2004 by the Road Safety Cabinet Committee in the lead‐up to the reactivation of the CityLink/Monash Freeway fixed camera system in December 2004 and the activation of the first of the new digital speed red‐light camera systems in January 2005.
As a result, every speed measurement from a primary fixed camera system is now verified with a speed measurement from a secondary speed detection system. Where there is a discrepancy between the first and second speed readings, the image is rejected and no infringement is issued. Currently, the secondary speed verification process is provided by means of an infra‐red (laser) speed measurement system. The time over distance “second image” method of secondary speed verification is being developed for use at intersection‐based speed red‐light sites.
We assessed the early implementation of the secondary speed verification system for fixed cameras as they recommenced operation. We found that for 2005, around 50 per cent of detections by fixed cameras were rejected before an infringement was issued because there was no secondary speed data. The RSET unit advised that this occurs when one of the speed detection systems fails to detect the speeding vehicle (generally the infra‐red laser device), and that the fixed camera system is being refined to address this issue. We found that fewer than 3 per cent of transactions were rejected because of a mismatch between speeds in cases where both detection systems detected the vehicle.
5.2.2 Mobile cameras Under the regulations, mobile speed detection devices must be tested by an authorised independent testing officer within the 12 months before use. The testing officer must ensure that the device is accurate to within a limit of error not greater than 3 km/h of true speeds. The device must also be sealed by the testing officer with a seal that effectively prevents interference without breaking the seal10. Once a device passes the testing process and is sealed, a certificate is issued for that particular device.
In September 1998, the Department of Justice outsourced the operation of the mobile camera program to LMT Australia (now Tenix Solutions) under the Civic Compliance Victoria11 contract. Tenix owns the cameras and is contracted to carry out the maintenance, testing and certification requirements in accordance with the regulations.
10 Road Safety (General) Regulations 1999, sections 306‐307. 11 “Civic Compliance Victoria” is the name of the contract for the delivery of the mobile camera operations and the administration of the penalty system.
82 Quality assurance measures
In 2004, the RSET unit was established and given the responsibility to manage the Civic Compliance Victoria contract.
We examined how the RSET unit assured itself that Tenix has complied with the regulations and what controls they have to prevent non‐compliance.
We found that the RSET unit held certification records for all mobile cameras owned and operated by Tenix, and maintained a database that alerted it when certification expiry dates approached.
Our test of mobile camera certification records found good compliance with the regulations. Records dated back to 1998 when the Department of Justice took over the management responsibility from Victoria Police. We did not find any cases when testing found equipment to be inaccurate and all equipment we examined had up‐to‐date certification.
5.2.3 Equipment used by Victoria Police Victoria Police is responsible for ensuring its equipment is independently tested and certified.
Prescribed devices
Radars, lasers and digitectors are prescribed devices under the Road Safety (General) Regulations 1999. Under this regulation, radar and laser devices must be tested by an independent authorised testing officer within the 12 months before their use. In the case of digitectors, the device must be tested within 2 years before its use. The testing officer must ensure that the devices are accurate to within a limit of error no greater than 2 km/h of true speeds.
The devices must also be sealed by the testing officer with a seal that effectively prevents interference without breaking the seal12. Once the devices pass the testing process and are sealed, a certificate is issued for those individual devices.
The Radio and Electronic Services unit of Victoria Police provides central maintenance, repair and pre‐certification testing services prior to independent testing and certification for all radar and lasers devices and digitectors. The unit also records the maintenance, repair and certification history of each prescribed speed detection device operated by Victoria Police.
12 Road Safety (General) Regulations 1999, sections 306‐310.

Quality assurance measures 83
We found that Victoria Police had rigorous and well‐documented maintenance and monitoring systems to ensure that testing and certification was conducted as required. Victoria Police also had good systems to track the location of each device and record its individual maintenance history. All equipment that we examined held a valid certification.
Other speed measuring tools
Speedometers and TDS detectors are not prescribed devices under the regulations. In the absence of maintenance, testing and certification regulations, Victoria Police follows calibration guidelines in accordance with the manufacturers’ specifications.
Speedometers
All Victoria Police vehicles have their speedometers calibrated prior to the vehicle being commissioned for service. We were advised that a calibrated speedometer ensured accuracy to within a 2 km/h error.
Vehicle manufacturers have stated that once a speedometer is calibrated there should be no need to re‐calibrate unless the wheel rim or tyres sizes are changed. Given that the average life of a police vehicle is 18 months, we are satisfied with the accuracy of police speedometers.
TDS detectors
The manufacturer’s specifications outline the calibration process for the TDS detectors. Calibration is conducted by activating the device while driving over a measured distance. Victoria Police ensure accuracy by using a certified metal tape to mark the start and finish points for the calibration measurement distance.
Operators can also verify the TDS detector’s accuracy against the vehicle’s speedometer when the TDS detector is switched to the digital speedometer mode.
5.2.4 Conclusion – Equipment maintenance, testing and certification The government has taken a number of actions to address the failures that occurred on the Western Ring Road. The establishment of the RSET unit within the Department of Justice has resulted in the consolidation of policy, standards and contract management responsibilities for fixed cameras. This effort allows closer and more effective monitoring and auditing of the contractors’ maintenance, testing and certification obligations.

84 Quality assurance measures
While we support the strengthening of the verification system, and acknowledge its implementation, we are concerned by the high number of speed incidents that are rejected because of the verification mismatch. However, we are confident that infringements will not be issued based on erroneous speed readings (rather, many speeding motorists will not receive infringements).
We are satisfied by the efforts made by the Department of Justice to upgrade its processes for monitoring mobile camera certification and are confident that the systems ensure that certification requirements are met.
We are also satisfied that Victoria Police’s maintenance, testing and certification systems are robust, that the documentation is well maintained and that certification is timely. The systems which control the accuracy of equipment used by police for speed enforcement are sound.
Recommendation
5. That the Department of Justice addresses the high rejection rate for fixed camera verification systems.
RESPONSE provided by Secretary, Department of Justice
Agreed in principle.
5.3 Is equipment operated correctly?
Even the most rigorous process of maintaining, testing and certifying equipment will be wasted if the equipment is not operated correctly. The prescribed manner for operating speed detection devices is set out in the Road Safety (General) Regulations 1999. Mobile camera operation is also subject to the TCO’s Mobile Cameras Policy Manual.
We expected all operators of mobile cameras and police equipment to be trained (and accredited) to operate equipment according to the regulations13.
We based our assessment on whether Victoria Police adequately followed the “site selection criteria” as detailed in the Mobile Cameras Policy Manual, and how Victoria Police and the Department of Justice ensure that the contractor (Tenix) adequately follows the guidelines when operating the mobile cameras.
13 This section of the report does not apply to fixed cameras because operation is fully automated.
Quality assurance measures 85
5.3.1 Mobile camera operation While mobile cameras are operated by contractors, Victoria Police is responsible for the initial identification of camera sites, ongoing site audits to ensure that sites meet technical criteria, and training of operators.
Site suitability audits
As discussed in Part 4 of this report, mobile camera enforcement can only take place at authorised sites. However, sites can change over time and may become unsuitable for enforcement. Factors that make a site unsuitable can include: • permanent physical changes that may affect the radar beam (e.g.
construction of a new metal fence) • an increase in the frequency of temporary factors that prevent mobile
camera operation (e.g. increased demand for on‐street parking) • changes to the speed zone • changes in traffic volume • changes to street names (requires an amendment to the authorised site) • an “expiry” of “recent crash history”.
In 2005, Victoria Police committed to conducting site audits on a 6‐monthly basis to verify the ongoing compliance with the site selection criteria. Sites that failed to meet all the criteria were to be deactivated14. Victoria Police advise that over 400 mobile camera sites have been deactivated since June 200515.
We tested the site audit records for compliance with the physical siting criteria and technical guidelines for 863 mobile camera sites in 3 police regions. Generally, we found that documented evidence was good, however, one TMU had deficient documentation, with only 7 records for 42 speed camera sites. This discrepancy has since been addressed, and when we subsequently retested the records we found good compliance.
Our testing also found 11 sites that did not comply with all criteria (e.g. lack of collision risk assessment, existence of items that may affect the radar beam, and within 200 metres of a change of speed zone sign). These sites have since been re‐audited and deactivated where necessary.
14 When a site is deactivated it remains on record but cannot be used for speed enforcement, unless it is reactivated. 15 Including sites that have been amended and allocated a new individual site identifier code.

86 Quality assurance measures
Daily checks of site suitability
Even when sites are regularly audited for suitability, conditions may change temporarily (e.g. vehicles may park on the line of the beam, road works may require a temporarily reduced speed limit).
Camera operators are responsible for assessing the current suitability of rostered camera sites at the beginning of their shift and continually throughout. If a site is deemed temporarily unsuitable, the camera operator is required to stop camera operation, complete a “Change of Location” form and re‐establish operations at the next closest camera site or a nominated secondary site.
We reviewed Tenix’s internal quality control processes and found its systems to ensure that the camera operator has adequately checked the site suitability before and after a camera session, were sound.
If a particular site is frequently “temporarily unsuitable” or becomes permanently unsuitable, the site should be deactivated. Only a TMU sergeant or above can approve a site deactivation, therefore, they must be aware of such sites by maintaining regular communication with the camera operator.
The TMU coordinators we interviewed all reported good communication with their camera operators.
Camera operator supervision and quality control measures
While Victoria Police sets rosters for camera operators, it is not officially responsible for their supervision. Under the terms of its contract, Tenix is responsible for the day‐to‐day supervision of camera operators. In this role, Tenix has developed a number of quality control measures and uses roving audit teams to check whether the operators are applying the equipment correctly.
Despite these measures, on a few occasions camera operators have breached the standard operating requirements and Victoria Police has had to recall or refund fines. A recent audit revealed that there were 13 such incidents during 2004 and 2005. The 1 130 infringements recalled as a result represent around 0.09 per cent of all infringements issued from mobile camera detections in 2004 and 2005.

Quality assurance measures 87
One example of incorrect camera operation occurred in October 2005, when a camera operator enforced the wrong speed limit after failing to adequately follow operational guidelines. The operator set up the mobile camera according to the roster but found significant sun glare, which can make the camera’s images unsuitable for prosecution. Instead of moving to a new site, the operator set up on the other side of the road but failed to check the speed limit that applied to traffic travelling in the opposite direction – a standard procedure required at the beginning and end of all camera sessions.
As a result, the road which has a speed limit of 80 km/h (in one direction) was enforced as a road with a 70 km/h speed limit (as was correct for the site originally rostered, on the other side of the road). A total of 41 motorists were issued infringement notices at the incorrect enforcement level. All fines and demerit points were withdrawn when Victoria Police discovered the error.
In response to the operator errors in 2004 and 2005, the RSET unit and Tenix developed a “cure plan” involving 14 quality control improvement measures to be carried out before any images are assessed.
Some of the measures implemented include: • requiring the mobile camera operator’s log statement to include more
information on speed zone and location of speed signs • checking all completed camera sessions to confirm speed zones and
correct siting according to the roster • cross‐checking the camera operator’s log statement with the Department
of Justice’s Evidence Management System (EMS) database • working with Victoria Police to identify multi‐speed zone camera sites
and sites that present a “high risk” of having reflective obstructions in the radar beam.
If any of the checks fail, the camera film is quarantined pending further investigation by Victoria Police.
During our audit fieldwork in early 2006, we observed that these quality control improvements were in place and would improve the identification of instances of human error before an infringement is issued.
Training and accreditation of camera operators
Mobile camera operators must be trained to use the mobile cameras in accordance with the Mobile Cameras Policy Manual and the Road Safety Regulations. The TCO within Victoria Police is responsible for training camera operators.

88 Quality assurance measures
The following initiatives are in place to improve the training and monitoring process: • establishing a business improvement team • providing more operator training and refresher sessions • scheduling follow‐up visits (in the field) for new operators • updating the operator training manual • introducing a mentoring program.
We reviewed the Department of Justice’s quarterly audit process that checks whether all camera operators have been accredited to operate the equipment and found it satisfactory.
5.3.2 Applying enforcement tolerances Under Victorian regulations, all speed detection devices (except mobile cameras) must be accurate to within an error limit of 2 km/h. Mobile devices must be within an error limit of 3 km/h, or 3 per cent of the true speeds (whichever is greater).
In order to ensure that enforcement is seen as fair, and to minimise challenges to infringements, enforcement authorities generally apply an “enforcement tolerance”. This allows a margin above the speed limit before an infringement is issued. This margin, or tolerance, is determined by Victoria Police. However, to prevent the creation of a “de facto speed limit” higher than the legal speed limit, it is not publicised. In a Victorian Civil Administrative Tribunal hearing, Justice Morris concluded: “if motorists are aware of the trigger speed used by police then many motorists will drive to those speeds, even though they are above the speed limit”16.
Enforcement tolerances are applied in both automated and on‐the‐spot enforcement. We assessed whether enforcement tolerances were applied correctly and consistently.
Mobile speed cameras
Camera operators set mobile speed cameras to take into account the legal speed limit plus the enforcement tolerance. The equipment is only triggered to record a vehicle as speeding if it exceeds the posted speed plus the tolerance, that is, at speeds beyond the “enforcement threshold” or “trigger speed”.
We checked several thousand instances of reported speeding from 50 separate camera operators, and found that the correct enforcement speed and tolerance had been set in each one.
16 Mulder v. Victoria Police VCAT 622, 13 April 2006.

Quality assurance measures 89
Police on-the-spot fines
Police officers also apply enforcement tolerances when issuing on‐the‐spot fines for speeding. We interviewed 13 police officers in a number of regions about their application of tolerances and found their responses were consistent with the enforcement tolerance and across regions17.
In practice, it is impossible to know how consistently individual police officers apply tolerances, as each officer has wide discretion about which offences to enforce (as they have with all enforcement activities). TMU coordinators we spoke to said that where inconsistency occurs, it is more likely officers are not enforcing lower end speed infringements rather than enforcing speeds below the enforcement threshold.
This tendency to under‐enforce rather than over‐enforce was also evident when we examined on‐the‐spot fines issued by police. We found a number of instances of “discounting” of offences, where the penalty incurred by the driver was reduced to a lower speeding offence category. That is, the penalty was less than it should have been. This practice does not appear to be widespread, but while it is not condoned by management, it is not easy to identify or monitor.
5.3.3 Conclusion – Equipment operation Controls for the use of mobile cameras are the most stringent of the 3 detection systems. This is probably a result of the high level of scrutiny the mobile camera program has received in recent years.
We support the continuation of 6‐monthly camera site audits. For this process to have value, it must follow a standardised procedure and be supported by rigorous recording. While we are satisfied that some of the early discrepancies have been addressed, continued attention will be needed to ensure the process is maintained.
Mobile camera operator errors have occurred because operating instruction have not been properly adhered to. The Department of Justice and Tenix have recently implemented a suite of improved quality control measures to address incorrect camera set‐up and operation. These measures should improve the identification of instances of human error before an infringement is issued.
17 Victoria Police disclosed the tolerance to us as part of the audit, however, we do not intend to publicly reveal this information. Public knowledge of the tolerance level can create a “de‐facto speed limit”, where motorists drive at the speed which they believe to be the enforcement limit rather than the legal speed limit.

90 Quality assurance measures
While Victoria Police provide the camera operator training, the Department of Justice ensures that all operators are appropriately trained through their quarterly audits.
We are satisfied that mobile camera tolerances are consistently applied by Tenix. In general, police apply a consistent tolerance, however, individual officers may apply wider tolerances than those given to the automated devices. We found that police are likely to under‐enforce lower end speeding infringements, rather than over‐enforce.
Recommendation
6. That Victoria Police ensures that site audits are conducted as required, and maintains documented records of these audits.
RESPONSE provided by Chief Commissioner, Victoria Police
Agreed.
Audit comments and recommendation noted.

91
6. Effectiveness of the penalty system


Effectiveness of the penalty system 93
6.1 Introduction
When speeding offences are detected, offending motorists should be penalised with a fine and loss of demerit points.
The process from detection to the point where demerit points are allocated to a licensed driver is complex. The system spans Victoria Police, the Department of Justice and VicRoads’ data systems. Several of the IT systems are operated by contractors on behalf of the responsible agency.
An overview of the penalty system process is provided in Figure 6A1:
1 There will be some changes to the system after 1 July 2006 when the Infringements Act 2006 becomes operational, such as an increased range of sanctions that can be applied by the Sheriff’s Office.

94 Effectiveness of the penalty system
FIGURE 6A: THE PENALTY SYSTEM (PRIOR TO 1 JULY 2006)
Fixed camera
Victoria Police
Evidence Management System
Road policing Mobile camera
Viking data entry program
Tenix
Victorian Infringement Management System (VIMS)
Penalty options for motorists
Infringements CourtMagistrates Court
Magistrate decidespenalty
Formal warning
Driver licensing database (VicRoads)
Driver's licence updatedwith demerit points
Motorists
Supervisor checks ticket Tenix verifies image
Information entered into Viking Data checking, entry and processing
Data transferred to VIMS
database updated
proc
ess r
esta
rts
Contest the fine (<10%)Pay the fine within28 days (>60%)
VIMS issues speedinginfringement notices
Apply for a caution (<10%)
database updated
Motorists detected speeding
VicRoads informs licenceholder of demerit points
Sheriff's Office
Do not pay the fine (10-15%)
data
base
upd
ated
Initial penalty stands
VIMS accesses motorist address details from the
VicRoads database
Nominate another driver( <10%)
Source: Victorian Auditor‐Generalʹs Office.

Effectiveness of the penalty system 95
In assessing whether the penalty system is effectively reducing the number of speeding motorists on the roads, we examined the process from the point where the offence is recorded (either by a police officer issuing an on‐the‐spot fine or an automated detection system) to the point where fines are issued and demerit points are allocated to licences. We expected that: • infringement notice issue would be accurate and timely, and where
infringements were rejected before issue this would be based on a sound process of quality assurance
• revenue from fines would be promptly collected and brought to account • demerit points for speeding would be correctly assigned to the
responsible driver and cautions would be issued in accordance with policy
• coordination across the 3 stakeholders in the infringement system would support effective operation of the system.
We also assessed the underlying data integrity across the system. This involved: • examining the entry systems for police‐issued and camera infringements • matching large amounts of data from the Department of Justice data
warehouse with data within the VicRoads’ driver licence database.
In our assessment, we tested 1.2 million transactions associated with speeding infringements for the period 1 January 2004 to 31 December 2005.
6.2 Are speeding offences recorded and verified effectively?
The penalty system relies on large amounts of data originating from 3 separate sources. For the system to be effective, infringement data must be recorded accurately and the quality of this data must be assured.
We expected to find: • quality controls for the manual entry of police‐issued infringement
notices • rigorous verification systems for the automated detection systems • a sound quality assurance process for rejected infringement records.

96 Effectiveness of the penalty system
6.2.1 Manual entry of police-issued infringement notices Around 19 per cent of speeding infringements are issued by Victoria Police. When police issue on‐the‐spot infringements they retain a duplicate copy of the traffic infringement notice (TIN) given to the driver. The duplicate is checked by a police supervisor before being forwarded to Tenix to be entered into the police data systems.
Tenix uses a proprietary software package (“Viking”) to enter police infringement data into the Evidence Management System (EMS). Viking has few data entry edit/validation controls.
At the time of our audit fieldwork (September 2005‐April 2006), an archiving error had resulted in speeding data in Viking not being effectively archived (in an electronic format). As a result, Viking data was not available for review at the time of our audit.
However, we were able to identify and assess police‐issued infringements at the point after they had been transferred to the Department of Justice system. We found that, in spite of the relatively weak system controls on data entry into Viking, overall the quality of data entered into Viking was good.
6.2.2 Verifying automated speed camera photographs All photographic images captured on automated speed cameras and processed by Tenix have to meet a range of quality requirements in order to be considered a “prosecutable image”. The following process for image quality checking is required2: • each film and frame is checked for jams, over‐exposure and other
problems which make the photographs unuseable (mobile cameras only)
• films that are cleared are converted to images and scanned (mobile cameras only)
• each image is checked by a verifier against the guidelines and either verified or rejected. Rejection reasons include, for example, an unclear numberplate, 2 cars in the image, or the vehicle is turning or too far away
• each image is then checked for quality assurance by a more experienced staff member against the guidelines and either verified or rejected
• verified images are sent on to the police and archived electronically.
2 Fixed cameras capture digital images, therefore, they are not subject to the first 2 steps of the process relating to the quality of the film.

Effectiveness of the penalty system 97
In addition, Victoria Police randomly check about 15 per cent of verified images.
After an image has been verified, Victoria Police authorise prosecution, and the infringement notice can be issued.
We examined a sample of verified images, and found good adherence to the verification guidelines. We also found that the verification process had strong quality assurance processes built in, with at least 2 separate individuals verifying each image. Where an infringement was associated with a loss of licence offence (for example, a speeding infringement for more than 25 km/h above the speed limit), additional checks were performed.
6.2.3 Prosecutability levels When cameras were first used in Victoria, the image rejection rate was high. Even in 1997‐98, when the mobile camera system was outsourced, 35 per cent of images were rejected due to: • technical deficiencies in the quality of the photograph • the vehicle not being able to be identified correctly • legal requirements (such as evidence requirements).
In September 1998, the government signed a contract with LMT Australia (now Tenix Solutions) to achieve efficiencies in the infringement process and reduce the number of image rejections within the contractor’s control (e.g. those due to poor photograph quality). The initial contract set the target prosecutability rate at 65 per cent with staggered improvements to be achieved over the life of the 5‐year contract, to reach a target of 75 per cent by 2003. In 2002, the contract was renegotiated, and a prosecutability target of 78 per cent was agreed.
We tracked the actual performance of the contractor against the targets set in the contracts. This is depicted in Figure 6B.
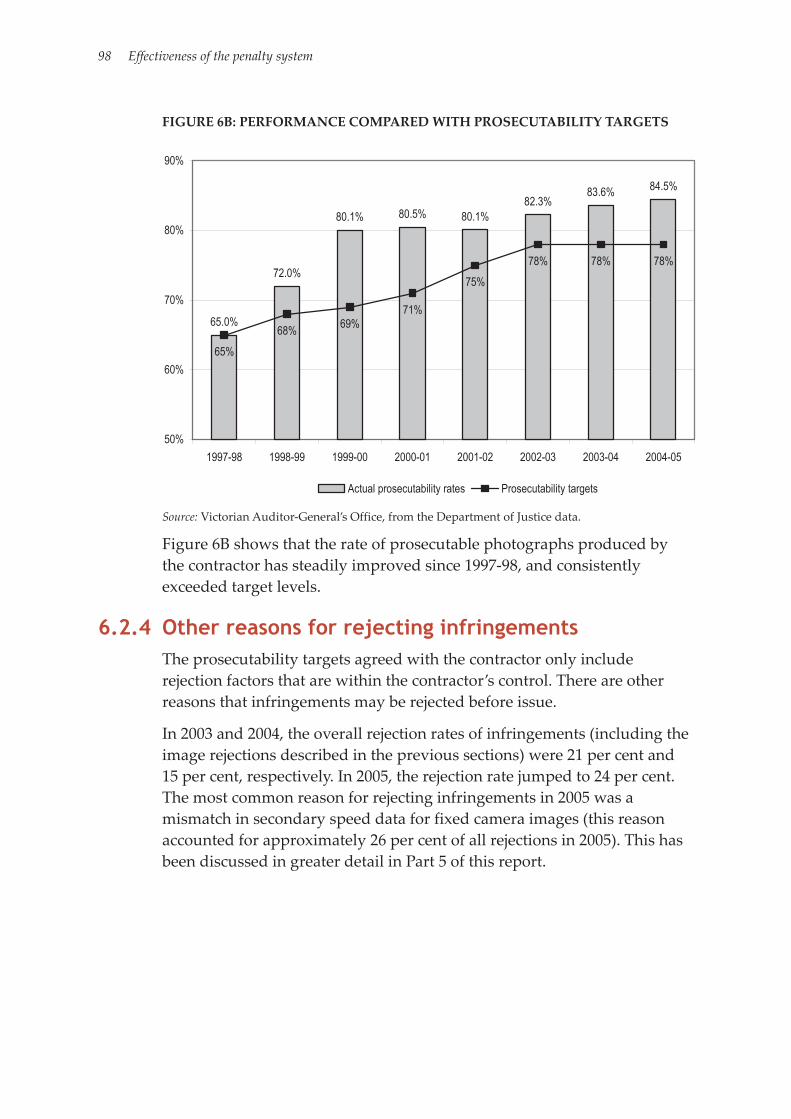
98 Effectiveness of the penalty system
FIGURE 6B: PERFORMANCE COMPARED WITH PROSECUTABILITY TARGETS
65.0%
72.0%
80.1% 80.5% 80.1%82.3%
83.6% 84.5%
65%
68% 69%71%
75%
78% 78% 78%
50%
60%
70%
80%
90%
1997-98 1998-99 1999-00 2000-01 2001-02 2002-03 2003-04 2004-05
Actual prosecutability rates Prosecutability targets
Source: Victorian Auditor‐General’s Office, from the Department of Justice data.
Figure 6B shows that the rate of prosecutable photographs produced by the contractor has steadily improved since 1997‐98, and consistently exceeded target levels.
6.2.4 Other reasons for rejecting infringements The prosecutability targets agreed with the contractor only include rejection factors that are within the contractor’s control. There are other reasons that infringements may be rejected before issue.
In 2003 and 2004, the overall rejection rates of infringements (including the image rejections described in the previous sections) were 21 per cent and 15 per cent, respectively. In 2005, the rejection rate jumped to 24 per cent. The most common reason for rejecting infringements in 2005 was a mismatch in secondary speed data for fixed camera images (this reason accounted for approximately 26 per cent of all rejections in 2005). This has been discussed in greater detail in Part 5 of this report.

Effectiveness of the penalty system 99
Analysis of other reasons for rejecting infringements and trends in rejection rates over time is difficult, as some 174 different reasons for rejections were utilised over the last 3 years (in April 2006, 85 different reason codes were active). Although the 174 codes are grouped into various categories, it is still difficult to monitor rejection issues. The bulk of rejections relate to readability issues making it difficult to conclusively identify the vehicle (for example, the registration plate was unreadable, out of focus or too far away).
Around 4 per cent of camera infringements were rejected before issue because the registration details were incorrect.
6.2.5 Conclusion – Recording and verifying offences We were unable to fully examine the effectiveness of the police infringement system because of an archiving error. We expect that this error be addressed so normal operations can recommence.
We also found relatively weak data entry controls for the police infringement system. Despite this, we found the quality of the data was reasonable. However, we are concerned that data quality cannot be assured without stronger data entry controls.
We found that there were good controls on photograph verification to ensure that infringements are not issued to the wrong driver. Since 1998, all prosecutability targets have been met and targets are frequently exceeded.
Due to the number of different rejection reason codes employed over the 3 years (many of which are very similar), we do not believe the reasons for infringement rejections can be monitored effectively. To ensure effective monitoring, the Department of Justice should review all existing rejection reason codes and aim to reduce these.
Recommendation
7. That the Department of Justice reviews the number of reject reason codes used in the Evidence Management System.
RESPONSE provided by Secretary, Department of Justice
Agreed in principle.

100 Effectiveness of the penalty system
6.3 Are penalties applied effectively?
Once infringement data has been recorded and verified, an infringement notice needs to be issued to the driver or registered operator3 of the vehicle.
Automated enforcement systems identify vehicles by registration number, and the driver then needs to be identified. Once infringement data has been entered into the system, the Victorian Infringement Management System accesses VicRoads’ driver licensing database to obtain address details for the registered operator of the vehicle, and the infringement notice is issued to that person.
On receipt of an infringement notice, the registered operator has the following options: • apply for a caution through an internal review process4 (if it is a first
offence and certain other conditions are met) • accept the infringement notice, in which case they pay the fine • contest the fine, in which case the matter is referred to the Magistrates’
Court • nominate another driver, if they were not the driver of the vehicle at the
time of the infringement. In this case, the process starts again with the person nominated.
The process pathways were mapped in Figure 6A earlier in this part of the report.
6.3.1 Issuing infringement notices When offenders receive an on‐the‐spot penalty for speeding from the police, they immediately become aware that they have broken the law. In automated detection, infringements are issued by mail, and if there is a long delay, the deterrence effect can be reduced.
We found that the average processing times and times to issue of infringements have steadily improved: • In 1999, approx 60 per cent of infringement notices were issued within
14 days. • The current performance contract with Tenix requires that 90 per cent of
infringement notices are issued within 10 days. This performance target is being met.
3 The “registered operator” is the person recorded on the registration database as the person responsible for the vehicle. 4 From 1 July 2006, formal cautions will be known as “official warnings” under the Infringements Act 2006. Motorists can apply, in writing, for an official warning through Victoria Police’s internal review process.

Effectiveness of the penalty system 101
• The average number of days to process TINs has improved from 7 days in 2003 to 5 days in 2005.
6.3.2 Use of cautions Prior to 1 July 2006, there were 2 types of cautions for speeding offences – informal cautions issued by police at the time of detection, and formal cautions instigated after the infringement notice has been issued.
Police officers have discretionary powers to issue an informal caution instead of an infringement notice. There are no firm statistics for the number of informal cautions issued, and there is no link to drivers’ licences. The police officers we spoke to said they were generally reluctant to give warnings instead of issuing fines if they have identified an offence serious enough for them to intercept a motorist.
From 1 July 2006, the law allows police to issue an “official warning” at the roadside5.
Prior to 1 July 2006, when issued with an infringement notice, motorists could apply in writing to receive a formal caution in place of a fine and loss of demerit points. In order to be eligible for a formal caution, applicants needed to meet the following criteria: • the offence has to be less than 10 km/h over the speed limit (in some
cases less than 15 km/h) • the applicant must have had a full licence for 3 years • the applicant must have had a clean driving record for 3 years,
including not having received a formal caution previously • the applicant must admit to the offence.
Victoria Police could issue a caution using their discretion, following a review of each application.
We reviewed a sample of applications for cautions and found no cases when a formal caution had been issued without meeting the criteria.
Between February 2005 and January 2006, the penalty review area in Victoria Police issued 12 376 formal cautions for speeding offences. This was approximately one per cent of speeding infringements issued.
The availability of formal cautions was communicated only through the Department of Justice’s website.
5 An “official warning” is a new legislated power introduced under the Infringements Act 2006.

102 Effectiveness of the penalty system
From 1 July 2006, motorists can apply for an “official warning” through their right to an internal review of the decision to serve the infringement. This information is communicated on traffic infringement notices, on Victoria Police’s and the Department of Justice’s websites and through Civic Compliance Victoria. However, information on the link between the right to internal review and the option to apply for an official warning is not yet clear.
6.3.3 Collection of fines Currently, the revenue from speeding fines accounts for almost half of all revenue from fines in Victoria. Figure 6C shows fine revenue from 1999‐2000 to 2004‐05.
FIGURE 6C: REVENUE FROM SPEEDING FINES ($MILLION)
Revenue from speeding fines 1999-2000 2000-01 2001-02 2002-03 2003-04 2004-05 Fixed and mobile speed cameras
77.8 84.2 113.8 167.7 118.0 129.3
On-the-spot fines 35.8 32.0 33.2 42.0 37.0 37.6 Total 113.6 116.2 147.0 209.7 155.0 166.9
Source: Victorian Auditor‐Generalʹs Office, from the Department of Justice data.
Revenue from speeding fines peaked in 2002‐03, before declining in 2003‐04 and 2004‐05. Part of this decline was the refund of fines paid on the Western Ring Road and the fact that fixed cameras were off‐line. The Department of Treasury and Finance estimates that in 2005‐06, revenue from speeding and red‐light camera fines will increase to $233.4 million.
The Better Roads Victoria trust account
In the 2005‐06 budget, the government announced that from 1 July 2005, all revenue from speed and red‐light camera fines would be directed to the Better Roads Victoria trust account.
The Better Roads Victoria trust account was established in 19936. The money in the account is used for the construction and maintenance of roads, road safety initiatives, and traffic and transport integration programs.
The trust account receives revenue from 3 streams: • a notional amount based on a 3 cents/litre petrol tax or excise • the revenue from the increase of motor vehicle registration fees in
2002‐03
6 The account was established under the Business Franchise (Petroleum Products) Act 1979.

Effectiveness of the penalty system 103
• the revenue from red‐light cameras, speed cameras and other speeding fines.
On 1 July 2005, the full payments were made into the trust account based on the projected revenue from each stream for 2005‐06. During the financial year, adjustments are made to the account to reflect the actual amounts received. The amounts paid into the account from the streams were: • $222.1 million from the notional amount of fuel excise • $72.5 million from the registration fees • $233.4 million from speeding and red‐light camera fines.
The increased payments into the Better Roads Victoria trust fund will not result in a net increase in the total amount spent on road construction and maintenance. There is a commensurate reduction in the amount of “normal” output appropriation to VicRoads to make the initiative budget neutral.
Clearance rates of fines
The Department of Justice measures the clearance rates of speeding (and other) fines according to fines that are paid or unpaid after 60 days. This marks the point where unpaid fines move into the Infringements Court7 system for further action.
Around 77 per cent of camera fines and 66 per cent of on‐the‐spot fines are paid within 60 days. However, this clearance rate increases to almost 90 per cent for camera fines and 79 per cent for on‐the‐spot fines after 365 days.
Uncollected fines
In November 2004, our Office reported that at 30 June 2004, Victoria’s uncollected fines totalled $554 million, an increase on the previous year’s total of $487 million8. We recommended that the government investigate ways to improve the collection of fines. Court orders and warrants had low clearance rates, and 75 per cent of the outstanding debt was from fines still uncollected after more than 12 months.
Since then, the Department of Justice has started the “Fairer and Firmer Fines” project, which includes a number of initiatives to improve the penalty system and fine collection.
7 The Infringements Court was formerly known as the Penalty Enforcement by Registration of Infringement Notice (PERIN) Court. 8 Victorian Auditor‐General’s Office 2004, Report on the Finances of the State of Victoria: Part 5, Revenue trends, Victorian Government Printer, Melbourne.

104 Effectiveness of the penalty system
At part of this project, the Infringements Act 2006 will introduce tougher measures on fine defaulters such as wheel clamping of vehicles, suspension of registration or driver’s licence, and wage deduction.
In the lead‐in to these measures, an amnesty period for people with unpaid fines was introduced. During this period, people with outstanding fines could apply for the fees and costs associated with fines to be waived in certain circumstances (full payment of the original fine was still required). They could also apply for instalment payment plans and extension of time.
6.3.4 Allocating demerit points to drivers Demerit points apply to all speeding offences, and a range of other traffic offences. The number of points imposed increases with the severity of the offence; ranging from one to 10.
The points accrue to a driver’s licence. If a licence builds up 12 or more demerit points in a 3‐year period, the licence holder faces either stricter conditions or may have the licence suspended. For learner or probationary drivers this also applies if they accumulate 5 or more demerit points in any 12‐month period.
In April 2006, 1.5 million, or 47 per cent of all Victoria’s full licence holders had at least one demerit point. Less than one per cent of drivers had 12 points or more.
The process for allocating demerit points usually starts when payment for the fine is received. The Department of Justice’s infringement system is updated to show that the fine has been paid, and driver details are forwarded to VicRoads.
VicRoads’ registration and licensing databases are physically located in Sydney and managed by a contractor. VicRoads sends the licence and demerit point information to the contractor, where it is matched with information in the driver licence database.
Where there is a match, letters are sent to licence holders, informing them that they have incurred demerit points. Where there is not a match, a rejections report is produced and sent back to VicRoads. Rejected transactions that involve a ban from driving are manually followed up, and the remainder are returned to the Department of Justice contractor.

Effectiveness of the penalty system 105
We assessed how effectively the current systems are allocating demerit points to driver licences by matching valid speeding infringements in the Department of Justice system9 to data in the VicRoads’ driver licensing system.
We examined 1.2 million infringements issued over the period 1 January 2004 to 31 December 2005. Our review found that for 10 per cent of infringements tested, demerit points could not be allocated to a driver in the VicRoads’ driver licence database for a number of reasons.
We reviewed these reasons in‐depth with VicRoads and the Department of Justice, however, full details are not included in this report as we do not want to facilitate demerit points avoidance. Briefly, the reasons include:
• insufficient data is provided (on either the original infringement or a driver nomination) to enable matching with a valid record in the driver licence database
• company nominations: the vehicle may be registered to a company, which is unable (or unwilling) to nominate the individual driver at a specific time
• interstate and overseas drivers.
Failure to match information in the driver licensing database
Our tests found around 53 per cent of unallocated points were for individuals, where a company was not the registered operator, and the driver was not from interstate. In these cases, the fines had been paid, however, the system was unable to allocate demerit points to a driver licence.
Demerit points were not allocated to these drivers because of problems validating the driver information provided. Current safeguards in the matching process mean that if there is any doubt about the correct licence to allocate demerit points to, then these demerit points are not allocated.
Information can be difficult to match because inadequate information was provided in good faith, or because false information is deliberately provided. It is an offence to provide false information, and the current charge for providing false information on a driver nomination is perjury, which means that a prosecution must be brought in the County Court. The severity of this charge, and the cost of such a prosecution, means that offenders are unlikely to be pursued unless in connection with other, more serious offences.
9 The data source was the EMS data warehouse, a secondary system used by the Department of Justice to provide reports.

106 Effectiveness of the penalty system
We found that the percentages of unallocated demerit points from camera infringements and from police issued infringements broadly corresponded to the percentage of TINs issued by each. This indicated that police‐issued TINs are no more likely than camera TINs to be matched, in spite of a requirement that police record the driver licence number on the TIN. Victoria Police advise that currently there is no requirement for drivers to carry a driver’s licence, and this means that the licence number is not always recorded on the traffic infringement.
Driver nominations
Under the Road Safety Act 1986 infringements detected by cameras are issued to the registered operator. If the registered operator was not driving the vehicle at the time of the offence, they may nominate another person as the driver by making a statutory declaration.
For company‐registered vehicles, the onus is on the organisation to keep sufficient log books to be able to identify the driver of the vehicle. If the organisation fails to nominate the driver, it incurs a $629 fine. We found that around 17 per cent of unallocated demerit points related to company‐registered vehicles where a driver was not nominated.
Interstate and overseas drivers
About 22 per cent of the unmatched transactions we identified were demerit points for interstate or overseas drivers. As a result, they are not included in the VicRoads’ licensing database.
Currently, demerit points are exchanged by DPX, a stand‐alone computer system which transmits offenders’ details to and from a central dispatch system in NSW.
There are a number of reasons why demerit points are not always allocated to interstate and overseas licences. These include: • under current inter‐jurisdictional agreements, only agreed offences can
be exchanged • Victoria only transfers information when a fine has been paid or upon
registration within the Infringements Court. Interstate offences that have been challenged in the Magistrates Court are not transferred, even if the court upholds the offence
• not all jurisdictions have set up mechanisms to exchange information (WA does not use DPX and the NT does not have a demerit point system).

Effectiveness of the penalty system 107
Exchange of demerit points across state borders is complex and Austroads10 has prepared a number of reports identifying problems with cross‐jurisdictional transfers of demerit points, and proposing solutions.
Interagency work to reduce unallocated demerit points
During the course of this audit, VicRoads, the Department of Justice and Victoria Police commenced an inter‐agency project to investigate issues associated with non‐allocation of demerit points, and identify options for improvement. The committee developed recommendations including: • changes to the driver nomination system – requiring the provision of a
valid driver licence number when another driver is nominated (this would require changes to regulation)
• preparing a business case for enhancing the Driver Licensing System to allow a higher rate of matching success for entries without a driver licence number. This would include improving name matching capabilities and removing duplicate entries
• improving the provision of licence numbers by police on TINs from roadside interceptions
• improved follow‐up of rejection reports.
6.3.5 Coordination across the infringement system The IT systems supporting the infringement system are highly complex for a number of reasons: • Three agencies are involved, each responsible for a part of the process.
Further, each agency uses outsourced providers, with separate IT systems, for aspects of the data management.
• Large numbers of transactions are involved. Each year about one million infringements are recorded. The many options available to drivers who are detected speeding (for example, nominating another driver, applying for a caution, applying for a 12‐month conditional bond) mean that a single speeding infringement can result in multiple transactions where obligations, fines and demerit points are allocated and withdrawn.
• The systems must support the application of complex regulations and business rules, including national requirements.
10 Austroads is the association of Australian and New Zealand road transport and traffic authorities. Austroads is made up of representatives of the 6 Australian state and 2 territory road transport and traffic authorities, the Australian Department of Transport and Regional Services, the Australian Local Government Association and Transport New Zealand.

108 Effectiveness of the penalty system
We found that these complexities meant that staff working in the responsible agencies faced challenges in changing and improving end‐to‐end system performance. We found: • individual staff in each agency had good knowledge of their parts of the
system, but none had a clear picture of all phases of the process • difficulties accessing data, and responding to queries – unable to
produce data easily • no clear process for identifying and resolving cross‐system issues or
issues between agencies.
To date, no single agency has been responsible for the infringement system as a whole. The Infringements Act will introduce measures to improve coordination between the agencies operating the different parts of the infringement system. This includes establishing a dedicated unit in the Department of Justice which will: • monitor the operation of the infringements system, and the
implementation of the Infringements Act • advise the government on infringements policy • undertake key system improvement projects such as a review of
infringement notices and associated documentation.
At June 2006, the unit had been established and had overseen the passing of the Infringements Act.
6.3.6 Conclusion – Applying penalties We are satisfied that traffic infringement notices are issued to the registered operator without undue delay.
We are satisfied that formal cautions were being applied in accordance with police policy. Currently, their availability to drivers with an otherwise clean driving record is not communicated widely. Making information on the availability of cautions and/or official warnings more widely available may support the other actions the road safety agencies are taking to build community confidence in the speed enforcement program.
Revenue from fines is projected to increase significantly in 2005‐06, although the increased payments into the Better Roads Victoria trust fund will not result in a net increase in the total amount spent on road safety because there is a commensurate reduction in output appropriation to VicRoads.
Effectiveness of the penalty system 109
The tougher measures currently being introduced for fine defaulters are likely to decrease the amount of uncollected fines in the future. The recent initiatives for ensuring that fines are paid must now be matched with increased effort to make the demerit points system effective. The demerit points system provides the major safeguard to ensure that drivers who repeatedly break road rules will ultimately lose their right to drive. However, it appears that currently more than 10 per cent of demerit points issued for speeding are not being allocated to a driver. This 10 per cent is on top of the percentages of infringements which are rejected before issue for quality control reasons.
The responsible agencies have identified many of the factors that contribute to this, and steps needed to address the issues. In the long‐term, changes to policy, such as the requirement for compulsory carriage of driver’s licence, may have to be investigated and considered. The introduction of a summary offence for the provision of false information on driver nominations would make prosecution for this activity more likely. IT system improvements are needed to improve the matching capacity within the driver licensing system.
In the short‐term, changes to business practices, and better follow‐up of mismatches should be implemented urgently.
Recommendations
8. That the Department of Justice and Victoria Police communicate the availability of, and conditions for, official warnings more widely.
9. That VicRoads, the Department of Justice and Victoria Police urgently implement steps to improve the application of demerit points to the responsible driver through: • improving the provision of licence numbers on police‐
issued traffic infringement notices • changing the driver nomination process to improve
information provision • improving the follow‐up of rejection reports • investigating possible modifications to the Driver Licensing
System to improve the matching capabilities of the system.

110 Effectiveness of the penalty system
RESPONSE provided by Secretary, Department of Justice
Recommendation 8
Agreed in principle.
RESPONSE provided by Chief Commissioner, Victoria Police
Recommendations 8 and 9
Agreed.
Audit comments and recommendations noted.
RESPONSE provided by Chief Executive Officer, VicRoads
Recommendation 9
Agreed.
111
Appendix A. Conduct of the audit


Appendix A. Conduct of the audit 113
Method
This audit assessed whether Victoria’s speed detection and enforcement strategy effectively contributes to safer travel on our roads by: • examining the quality of, and changes in, a variety of time series data
held by the audited agencies, including data for: • the number and severity of crashes • changes in free travel speeds • hours of speed enforcement, revenue from speed enforcement,
prosecutability levels and clearance rates of fines issued • assessing the quality of the evidence base for speed enforcement as a
road safety strategy by reviewing the research underpinning arrive alive! and road safety/speed enforcement research from other Australian jurisdictions and overseas
• assessing the compliance of a sample of mobile speed camera sites against site selection criteria from the Traffic Camera Office’s Mobile Cameras Policy Manual
• examining the quality of the cost‐benefit assessments underpinning investment in the program
• reviewing the maintenance, testing and certification requirements for a variety of speed enforcement equipment, and testing 50 devices for compliance with these requirements
• examining a sample of infringement records from the Department of Justice and VicRoads’ databases to ensure that they were appropriately recorded
• reviewing the administration of cautions, fines and demerit points • assessing controls over, and the performance of, the contractor under
the “Civic Compliance Victoria” contract (the government’s contract with Tenix Solutions to administer the penalty system).
The audit was performed in accordance with the Australian auditing standards applicable to performance audits and, accordingly, included such tests and procedures considered necessary.
The cost of the audit was $600 000. This cost includes staff time, overheads, expert advice and printing.
114 Appendix A. Conduct of the audit
Assistance to the audit team
Mr Chris Brooks, Senior Adviser, Road Safety at the Australian Transport Safety Bureau and Mr Ray Shuey, Director at Strategic Safety Solutions Pty Ltd provided specialist assistance and advice to the audit team.
We appreciate the support and assistance of management and staff at the agencies listed below.
Organisations participating in the audit
Audited agencies
Victoria Police
Department of Justice
VicRoads
Transport Accident Commission
Organisations interviewed
Monash University Accident Research Centre
Municipal Association Victoria
Road Safety Committee, Parliament of Victoria
Royal Automobile Club of Victoria
Surveyed Community Road Safety Councils
Barwon, Central Murray, Central Victoria, Colac, East Gippsland, Frankston and Mornington Peninsula, Inner Eastern, Inner Melbourne, Inner Northern, Inner South East, Melbourne Eastern Ranges, Mildura, North Western, Outer South East, Western District, Westgate and Wimmera.

115
Appendix B. Glossary and acronyms

Appendix B. Glossary and acronyms 117
Glossary
arrive alive!
Victoria’s key planning and coordination document for road safety for 2002‐2007. The strategy aims to reduce annual death and serious injury from crashes on Victorian roads by 20 per cent by 2007.
Authorised speed camera sites
Sites that meet Victoria Police’s guidelines for safety camera speed enforcement. There are 9 criteria for the siting of cameras, which aim to cover technical, legal and community acceptance requirements for siting. There are approximately 2 600 authorised sites in Victoria. Mobile speed camera enforcement can only be undertaken at authorised speed camera sites.
Black-spot/black-length
A site or a section of road where at least 3 casualty crashes have occurred in the past 3 years.
Casualty
A person who can be defined as either an injury or fatality.
Casualty crash
A road crash that results in at least one injury or fatality.
Demerit points
Demerit points are a form of penalty imposed when certain traffic offences are committed. Demerit points range from one to 10 points per offence. Demerit points are valid for 3 years from the date of the offence. If 12 or more demerit points are accumulated over a 3‐year period, a licence may be suspended. A key purpose of demerit points is to deter repeat traffic offenders.

118 Appendix B. Glossary and acronyms
Deterrence effect
There are 2 types of deterrence effects. A general deterrence is provided when the public has a high awareness of the threat of enforcement. A specific deterrence is provided when people incur a penalty for an offence. In speed enforcement, the desired outcome of the combined deterrence effect is that people should travel within the speed limit.
Digitector
A speed detection device, used by Victoria Police, that measures the time taken for a vehicle to pass over 2 detector strips placed on top of the road surface, and which calculates the vehicle’s speed.
Enforcement tolerance
In order to ensure that enforcement is seen as fair, and to minimise challenges to infringements, enforcement authorities generally apply an “enforcement tolerance”. This allows a margin above the speed limit before an infringement is issued. This margin, or tolerance, is determined by Victoria Police.
Fatality
Any person who was killed outright or who died within 30 days as a result of the accident.
Fixed speed cameras
Speed cameras that are permanently located at a fixed location. In Victoria, there are fixed camera locations on CityLink/Monash Freeway, Western Ring Road, Hume Highway, Westgate Bridge, Geelong Road and 82 sites at 78 intersections. Fixed cameras are an example of “overt” detection. The cameras are not hidden and the aim is to deter speeding at a specific location. For example, the cameras in the CityLink tunnels are placed there because the consequence of a crash in the tunnel would be severe.
Free travel speed
Free travel speed is the speed of a vehicle in free‐flowing traffic, unimpeded by other vehicles. It is a good indicator of the speed at which drivers choose to travel.
Appendix B. Glossary and acronyms 119
Infringement
Summary or less serious offences are capable of being dealt with by an infringement notice. There are 2 major categories: parking infringements and traffic infringements. Traffic infringements include speeding infringements.
Mobile speed cameras
Speed enforcement cameras that can be moved and operate on authorised sites all over Victoria. The mobile cameras are operated by Tenix, under the Civic Compliance Victoria contract. The cameras can operate almost “anywhere, anytime”, without warning motorists, and are an example of “covert” detection.
Non-prosecutable image
An image that, in the view of Victoria Police, will not provide sufficient evidence to support the issue of an infringement notice for a traffic offence.
Prosecutability
Under the Civic Compliance Victoria contract, a “prosecutable” image is one that meets the necessary quality requirements (set under legislation, policy and guidelines) so that an infringement notice may be issued.
Radio and Electronic Services unit
The unit within Victoria Police responsible for maintaining and testing police speed detection equipment.
Road Safety Enforcement Technology unit
A business unit within the Department of Justice established in 2004, to develop, procure, implement, operate, maintain and manage the stateʹs road safety enforcement technology systems and assets. The unit is not responsible for the speed detection equipment used by police.
Road crash
A crash involving a road vehicle (motor vehicles, bicycles and trams) on a public road.

120 Appendix B. Glossary and acronyms
Road policing
Victoria Police undertake a variety of “road policing” duties, aimed at curbing a range of unsafe road behaviours (like dangerous driving, drink driving, drug driving and speeding). Road policing includes using speed detection equipment and issuing on‐the‐spot fines for speeding.
Road toll
The number of people killed in road crashes, usually counted in a specific jurisdiction during one calendar year. The definition of a person killed in a road crash under the 1968 Convention of Road Traffic, is: “Any person who was killed outright or who died within 30 days as a result of the accident”.
Serious casualty
A person who is killed or seriously injured.
Serious injury
In Victoria, defined as a person who is taken to hospital as a result of a road crash (and who does not die as a result of those injuries within 30 days of the crash).
Serious injury crash
A non‐fatal crash in which at least one person is seriously injured.
Traffic Camera Office
A business unit within Victoria Police, in charge of the effective operation of the Safety Camera Program and the timely issue of infringement notices to motorists detected speeding.
Appendix B. Glossary and acronyms 121
Acronyms
ATSB
Australian Transport Safety Bureau
BTRE
Bureau of Transport and Regional Economics
CRSC
Community Road Safety Council
EMS
Evidence Management System
MUARC
Monash University Accident Research Centre
PERIN Court
The Penalty Enforcement by Registration of Infringement Notice Court (now renamed the Infringements Court)
RSET
Road Safety Enforcement Technology unit (Department of Justice)
TCO
Traffic Camera Office (Victoria Police)
TINs
Traffic Infringement Notices
TMU
Traffic Management Unit (Victoria Police)
VIMS
Victorian Infringement Management System

Auditor-General’s reports 2005-06
Report title Date issued
Managing stormwater flooding risks in Melbourne (2005:8) July 2005
Managing intellectual property in government agencies (2005:9) July 2005
East Gippsland Shire Council: Proposed sale of Lakes Entrance property (2005:10) July 2005
Franchising Melbourne’s train and tram system (2005:11) September 2005
Results of special reviews and other investigations (2005:12) October 2005
Health procurement in Victoria (2005:13) October 2005
Community planning services in Glenelg Shire Council (2005:14) October 2005
Follow-up of selected performance audits tabled in 2002 and 2003 (2005:15) October 2005
Auditor-General’s Report on the Finances of the State of Victoria, 2004-05 (2005:16) November 2005
Results of 30 June 2005 financial statement and other audits (2005:17) December 2005
Planning for a capable Victoria Police workforce (2006:1) May 2006
Access to specialist medical outpatient care (2006:2) June 2006
Results of financial statement audits for agencies with other than 30 June 2005 balance dates, and other audits (2006:3)
June 2006
Protecting our environment and community from failing septic tanks (2006:4) June 2006
Review of major public cemeteries (2006:5) July 2006
Vocational education and training: Meeting the skill needs of the manufacturing industry (2006:6)
July 2006
The Victorian Auditor‐General’s Office website at <www.audit.vic.gov.au> contains a more comprehensive list of all reports issued by the Office. The full text of the reports issued is available at the website. The website also features “search this site” and “index of issues contained in reports and publications” facilities which enable users to quickly identify issues of interest which have been commented on by the Auditor‐General.

Availability of reports Copies of all reports issued by the Victorian Auditor‐Generalʹs Office are available from:
• Information Victoria Bookshop 356 Collins Street Melbourne Vic. 3000 AUSTRALIA
Phone: 1300 366 356 (local call cost) Fax: (03) 9603 9920 Email: <[email protected]>
• Victorian Auditor‐Generalʹs Office Level 34, 140 William Street Melbourne Vic. 3000 AUSTRALIA
Phone: (03) 8601 7000 Fax: (03) 8601 7010 Email: <[email protected]> Website: <www.audit.vic.gov.au>