malaria - nao.org.uk · malaria report by the comptroller and auditor general hc 534 session...
TRANSCRIPT

Malaria
REPORT BY THE COMPTROLLER AND AUDITOR GENERAL
HC 534 SESSION 2013-14
3 JULY 2013
Department for International Development

The National Audit Office scrutinises public spending for Parliament and is independent of government. The Comptroller and Auditor General (C&AG), Amyas Morse, is an Officer of the House of Commons and leads the NAO, which employs some 860 staff. The C&AG certifies the accounts of all government departments and many other public sector bodies. He has statutory authority to examine and report to Parliament on whether departments and the bodies they fund have used their resources efficiently, effectively, and with economy. Our studies evaluate the value for money of public spending, nationally and locally. Our recommendations and reports on good practice help government improve public services, and our work led to audited savings of almost £1.2 billion in 2012.
Our vision is to help the nation spend wisely.
Our public audit perspective helps Parliament hold government to account and improve public services.
Report by the Comptroller and Auditor General
Ordered by the House of Commons to be printed on 1 July 2013
This report has been prepared under Section 6 of the National Audit Act 1983 for presentation to the House of Commons in accordance with Section 9 of the Act
Amyas Morse Comptroller and Auditor General National Audit Office
26 June 2013
Department for International Development
HC 534 London: The Stationery Office £16.00
Malaria

This report examines whether the Department has made well-informed and cost-effective choices in the way it supports the sustained reduction of malaria, through programmes to prevent, detect and treat the disease.
© National Audit Office 2013
The text of this document may be reproduced free of charge in any format or medium providing that it is reproduced accurately and not in a misleading context.
The material must be acknowledged as National Audit Office copyright and the document title specified. Where third party material has been identified, permission from the respective copyright holder must be sought.
Links to external websites were valid at the time of publication of this report. The National Audit Office is not responsible for the future validity of the links.
Printed in the UK for The Stationery Office Limited on behalf of the Controller of Her Majesty’s Stationery Office
2572094 07/13 PRCS

The National Audit Office study team consisted of: Neil Carey, Neil Casey, Richard Clarke, Elliot Dallen, Helen Hodgson, Danielle Linggood under the direction of Phil Gibby.
This report can be found on the National Audit Office website at www.nao.org.uk/malaria-2013
For further information about the National Audit Office please contact:
National Audit Office Press Office 157–197 Buckingham Palace Road Victoria London SW1W 9SP
Tel: 020 7798 7400
Enquiries: www.nao.org.uk/contact-us
Website: www.nao.org.uk
Twitter: @NAOorguk
Contents
Key facts 4
Summary 5
Part OneThe malaria burden 12
Part TwoMaking cost-effective choices 19
Part ThreeDelivering interventions efficiently 25
Part FourSustaining the progress made 38
Appendix OneOur audit approach 45
Appendix TwoOur evidence base 47
Endnotes 50

4 Key facts Malaria
Key facts
660,000 estimated number of deaths caused by malaria in 2010
US$2.8 billion the gap between the $5.1 billion estimate by the World Health Organization of required annual funding to tackle malaria and the $2.3 billion offered by international donors and governments in 2011
£494 million the Department’s forecast expenditure on malaria in 2014-15
$150 international benchmark for cost-effectiveness in health programmes, measured by the cost of gaining one year of healthy life, through averting chronic illness or death
$8–$110 the estimated costs of gaining one year of healthy life through bed nets, based on published research. Range reflects local context and performance
25 million the number of bed nets the Department’s bilateral (country to country) programme has helped to fund since 2010
$89 the estimated cost of gaining one year of healthy life through the use of a drug subsidy funded by the Department
By end 2013 planned publication of the Department’s mid-term assessment of progress on malaria
17countries in which the Department funds programmes against malaria
£252m estimated total spend by the Department on malaria in 2011-12
3rdlargest global donor for tackling malaria by 2014-15

Malaria Summary 5
Summary
1 In 2010, there were an estimated 219 million cases of malaria worldwide. Symptoms include fever, headache and vomiting. Left untreated, malaria can become severe, cause anaemia and make people more vulnerable to other life-threatening diseases. The World Health Organization estimated malaria to have caused 660,000 deaths in 2010, representing progress on the estimated 755,000 deaths in 2000, particularly since 2007. Malaria particularly affects low-income countries with weak public health systems, constraining their economic growth. Of all deaths, 80 per cent occur in just 14, mainly African, countries.
2 With no effective vaccine, tackling malaria requires interrupting the cycle whereby mosquitoes draw infected blood from one person and transmit it to others. The main interventions to prevent malaria include bed nets and insecticide spraying, and diagnostic tests and drugs are used to identify and treat people infected. As the malaria parasites and mosquito behaviour differ across regions, the prevention and treatment measures need to be tailored to local contexts.
3 The Department for International Development (the Department) aims to contribute to at least halving malaria deaths in at least ten countries with high malaria prevalence by 2014-15. It is seeking international agreement on a standard method of measuring progress before reporting against this target. Total departmental spend on malaria increased from £138 million in 2008-09 to £252 million in 2011-12 (3.4 per cent of the Department’s budget). The Department currently estimates that it will spend £494 million in 2014-15 (4.8 per cent of its aid budget) through bilateral programmes (aid provided directly to some 17 countries), funding to multilateral organisations (such as United Nations agencies), and commissioned research.
4 This report examines whether the Department has made well-informed and cost-effective choices in the way it supports the sustained reduction of malaria, through programmes to prevent, detect and treat the disease. Assessing value for money is challenging in international development, given the numerous agencies affecting progress, gaps in key data and the difficulties in establishing counterfactuals showing what progress would have been without the intervention. While our examination (Appendix One), covered the Department’s overall approach, we have also drawn on detailed fieldwork in Sierra Leone, Tanzania, Nigeria and Burma, where the Department has important anti-malaria programmes, for deeper insight.

6 Summary Malaria
Key findings
On the allocation of resources
5 The Department gives high priority to tackling malaria, as it recognises that the disease is a serious threat to development and needs a sustained effort to tackle it. The absence of a fully effective vaccine, high levels of prevalence and low health system capacity make eradication unfeasible in the near future. Worldwide, there has been a significant increase in total funds to fight malaria since 2008. However, global funding from donors and host governments is levelling off at less than half of the US$5.1 billion annual requirement estimated by the World Health Organization. There is a need to complete coverage of malaria prevention and treatment. In April 2013, the Global Fund estimated that a more concerted effort would save a further 196,000 lives a year. Research into previous malaria elimination campaigns show that gaps or delays in funding lead to rapid and severe resurgence of the disease, with increased deaths in communities that have not maintained immunity through exposure to it over time (paragraphs 1.4 to 1.7, Figures 3 and 4, paragraph 4.1 and Figure 15).
6 The Department’s allocation of bilateral aid through a review process to different country programmes was reasonable given the time and capacity then available. The Department’s bilateral aid review in 2010 invited country teams to bid for resources for malaria. The Department had previously issued an extensive summary of research on ‘what works’ in malaria control, and guidance on how to demonstrate value for money in each bid. The approved bids were for types of interventions that studies have shown to be cost-effective, compared with a World Bank benchmark of $150 per year of healthy life gained. However, the global evidence indicates very wide ranges in cost-effectiveness according to local contexts and the efficiency of health delivery in each country; bed net cost-effectiveness ranges between $8 and $110 per year of full health gained. Bids did not capture this variation. Deeper analysis of cost-effectiveness at country level, such as approaches being developed by the Department’s team in Nigeria, would help direct resources to where they should have most benefit (paragraphs 2.4 to 2.13 and Figure 9).
7 More choice, between a wider range of bids from country teams, would provide greater assurance that those selected represent best value for money. The Department’s aid review aimed to provide alternative proposals and stimulate innovation through a ‘market in ideas’. In the event, there was limited choice between alternative bids on health relative to the increasing resources available, and 83 per cent of health bids by value were accepted. The Department approved malaria bids in 17 countries, extending beyond its target of contributing to halving malaria deaths in at least ten high-burden countries. One constraint on the bilateral aid review was a shortage of advisers in some countries. The Department has increased the number of its health advisers in countries from 37 in 2010 to 46 in 2013. Our visits confirmed the importance of in-country advisers’ local knowledge for identifying and monitoring programmes and influencing partners (paragraphs 2.7, 2.8 and 4.7).

Malaria Summary 7
8 The Department’s planned increase in malaria funding from £252 million in 2011-12 to some £494 million in 2014-15 includes increasing its financial support to, or channelled through, multilateral organisations. The Department’s plans, if fully implemented, suggest its annual malaria expenditure through multilaterals, principally through the Global Fund, will increase by 71 per cent from £46 million to £79 million over the period, whereas its country programmes would increase by 56 per cent from £70 million to £110 million. The largest increases are for non-country-specific malaria spending, which although officially classified as bilateral comprises mainly spending through multilateral organisations, such as the Global Fund and UNITAID. Current plans are for this to increase from £36 million in 2011-12 to £114 million in 2014-15.
9 In 2010-11, the Department reviewed its multilateral aid programme. It rated the Global Fund and UNITAID as respectively ‘very good’ and ‘good’ value for money for UK aid. Our September 2012 report concluded that the review did not always test the cost-effectiveness of multilaterals against alternatives. We recommended that the Department should make more systematic comparisons between multilateral and bilateral aid, informed by clear criteria and using a range of quantitative and qualitative information. In particular, the Department should continue to press multilaterals to provide higher-quality data on results and costs (paragraphs 2.2 to 2.3 and Figure 7).
10 Directly-funded programmes can give added insight into cost-effectiveness achieved through multilaterals. The Department has so far committed £129 million to the Global Fund’s Affordable Medicines Facility – malaria, an innovative subsidy scheme to increase the affordability and availability of quality-assured malaria drugs. This recognises that private retailers are an important source of medication in developing countries. However, problems including insufficient drug supply, caused by an underestimate of demand compared with funds, and shortfalls in supporting training and marketing interventions meant performance across the eight pilot countries was mixed. Although modelling suggests that this scheme is already cost-effective compared with global benchmarks, the Department needs to work with the Global Fund to get better information to enable it to monitor the cost-effectiveness of the subsidy and compare it with alternative delivery models. So far, the cost-effectiveness of the first year of the operational pilot stands at $89 per year of healthy life gained. The original technical design for a completed five-year global scheme was estimated at $33–$56 (paragraphs 3.12 to 3.16).

8 Summary Malaria
On securing sustained impact
11 Although the Department’s bilateral programmes are well chosen, there are areas where it can improve. The key challenges it faces are achieving consistently good implementation of bed net programmes and sufficient pace of change in increasing diagnosis, specifically:
• The Department has provided 5.3 million bed nets since 2010 in our case study countries, helping increase the number of households owning a bed net by an average of 23 percentage points across three of the four countries with data. However, bed net usage increased much less (by just six percentage points) in targeted groups such as young children. The Department’s programmes include education to encourage use of nets, but these are not yet consistently well coordinated with net distribution (paragraphs 3.3 to 3.5 and Figure 10).
• The Department has funded the introduction of rapid diagnostic tests in public health services in five countries to increase the number of people diagnosed before receiving treatment, therefore reducing unnecessary drug consumption. But coverage was incomplete in the countries we visited, and so the full benefits have yet to be realised (paragraphs 3.8 to 3.9 and Figure 11).
• Although the Department supports subsidies for private sector drug distribution, it does not yet support diagnostic tests on the same scale. Trials in several countries show that tests can be used successfully by private sector retailers given appropriate training, oversight and incentives. We did not find private sector testing on a national scale in countries we visited, or specific targets for achieving it. However, the Department said that it plans to support trials in Nigeria and Burma (paragraph 3.10).
12 International donors, including the Department, have made limited progress in mobilising domestic resources for tackling malaria in developing countries:
• International donors provide some 73 per cent of dedicated anti-malaria resources, and a higher proportion still in highly malarial Africa. African governments have missed Abuja Declaration targets they set in 2001 to raise spending on health. The Department usually seeks to influence governments through dialogue without directly linking its own funding to increased local funding (paragraphs 4.4 to 4.8 and Figure 16).
• Free distributions of imported bed nets reduce incentives for households to purchase nets from retailers. We found no evidence that the mass distributions the Department had supported in Nigeria were accompanied by effective measures to stimulate weak commercial markets. The Department now supports market development, which it expects to stimulate sales (paragraphs 4.10 to 4.12 and Figure 17).

Malaria Summary 9
13 The Department is active in shaping the international response to malaria, both globally and within assisted countries. In our case study countries, the Department coordinated well with other donors through stakeholder groups sharing information and pooling resources to reduce duplicated efforts. Its presence and activity in-country is valued by partners. We welcome, for example, the World Health Organization’s acknowledgement of the Department’s leadership in areas such as reaching the private sector with essential malaria services, and support for global programmes. Its influence globally includes pressing for greater value for money, such as in reducing the amount of undiagnosed treatment. The Department is likely to become the third-largest provider of malaria support by 2014-15, behind the United States and the multilateral Global Fund. It is important that it uses this position to encourage ongoing global support (paragraphs 1.8 and 3.20).
14 To maintain international support in tackling malaria, it is important that the Department works with other donors to measure impacts more effectively. The infrequency of good data on malaria prevalence makes it difficult to measure progress against targets and to assess programmes’ relative cost-effectiveness. The Department should accelerate its joint work with other donors to mitigate these problems. It currently relies too much on output indicators to measure progress, such as the number of bed nets distributed, rather than the number used (paragraphs 3.3, 3.17 to 3.18 and Figure 13).
15 The Department has a robust process to identify research priorities that complement what other donors are doing and commissions research through open competition. However, decisions to allocate funding are typically judgements unsupported by quantified estimates of the effect on levels of disease. The Department’s network of advisers gives it a comparative advantage in identifying the need for research on operational issues within countries, to improve programme effectiveness. However, there is little research activity in this area (paragraphs 4.14 to 4.18 and Figure 18).
Conclusion on value for money
16 Malaria represents a serious health risk which constrains the development of low-income countries. In the absence of a vaccine, tackling the disease is a long-term challenge. Insufficient global support raises the risk of resurgence, undermining the cost-effectiveness of progress already made. Progress requires the Department to leverage more developing country resources while obtaining the best value from its own bilateral programmes and from the support it channels through multilaterals.
17 This report shows that donor contributions are peaking, despite the increase in the UK’s allocation. Further progress will depend on international aid being complemented by a growth in recipient country commitment and capacity. Developing countries do not yet have the systems and infrastructure needed to tackle the disease themselves. It is important, therefore, that the Department pursues visible increases in country government resources to expand local capacity and effort, in order that the UK effort contributes to continuous improvement.
10 Summary Malaria
18 The Department’s bilateral programmes to tackle the disease use proven interventions which compare favourably with global benchmarks for cost-effectiveness in health. While this is encouraging, the Department still has further to go to demonstrate that it has fully secured value for money. Sustained impact depends as much on changing attitudes and behaviours of populations at risk, as it does on distributing nets and drugs. Addressing gaps in data on actual costs and outcomes would give the Department better information to compare cost-effectiveness between alternative programmes and enable it to demonstrate progress more clearly.
19 An increasing proportion of the UK malaria aid is channelled through multilateral agencies, where it is more difficult for the Department to gather reliable comparable data on cost-effectiveness. As we have reported previously, we would also expect to see clearer evidence of a sustained campaign to work with other donor countries to improve the cost-effectiveness of spend channelled through multilateral agencies.
Recommendations
20 Recognising the steps the Department has already taken to better understand value for money, our recommendations focus on the need to use improved information on cost-effectiveness to direct its investments, and to step up the pace and consistency of implementation. The Department should:
a Increase the informed choice it has when selecting between proposals. The approach used in 2010 has the potential to obtain increased value for money if in future exercises country teams submit a wider range of proposals accompanied with country-specific data on cost-effectiveness. The Department should make comparisons with delivery through key multilaterals where possible.
b Ensure that country teams adopt the following lessons from implementing programmes:
• Ensure that net supply is more consistently supported by timely information campaigns to increase net usage.
• Specify milestones and targets to reduce unnecessary treatment by focusing drug consumption on positively tested cases, in public and private sectors.
• When supporting free net distributions, ensure that plans are also in place to sustain local commercial markets. Large-scale free distributions of imported nets produce quick progress, but can also reduce capacity for future net replacement.
• Obtain more frequent data to reveal trends on malaria prevalence as its programmes progress.
• Ensure that more operational research is completed, in sufficient time and volumes to identify and address the key local barriers to commodity use.

Malaria Summary 11
c The Department should extend the range of its key progress indicators beyond output measures to include better predictors and indicators of outcomes. It should capture how far the number of nets it distributes are used and complete its work with partners to agree a measure of deaths averted.
d The Department should more consistently influence country governments, where appropriate, to match its own rising investment in health in general and malaria control, in particular by increasing its use of matched funding where this can attract additional contributions and grow national ownership, especially in lower-middle income countries.
e On its support for subsidised drugs, the Department should:
• Ensure that the lessons of the Affordable Medicines Facility – malaria pilot stage are reflected in future practice. It should closely monitor the Global Fund’s new arrangements to balance drug supply and demand, and the coordination of supporting training and marketing with drug supply and with rapid diagnostic tests.
• Ensure that the Global Fund compares subsidy cost-effectiveness with alternative ways to reach consumers.
12 Part One Malaria
Part One
The malaria burden
1.1 Malaria is a disease caused by a parasite transmitted to people via the bites of infected mosquitoes. Symptoms include fever, headache and vomiting. Left untreated, malaria can lead to severe anaemia, vulnerability to other diseases and death, with pregnant women and young children at highest risk. In 2010, there were an estimated 219 million cases of malaria globally and 660,000 deaths, representing progress on the estimated 755,000 deaths in 2000.
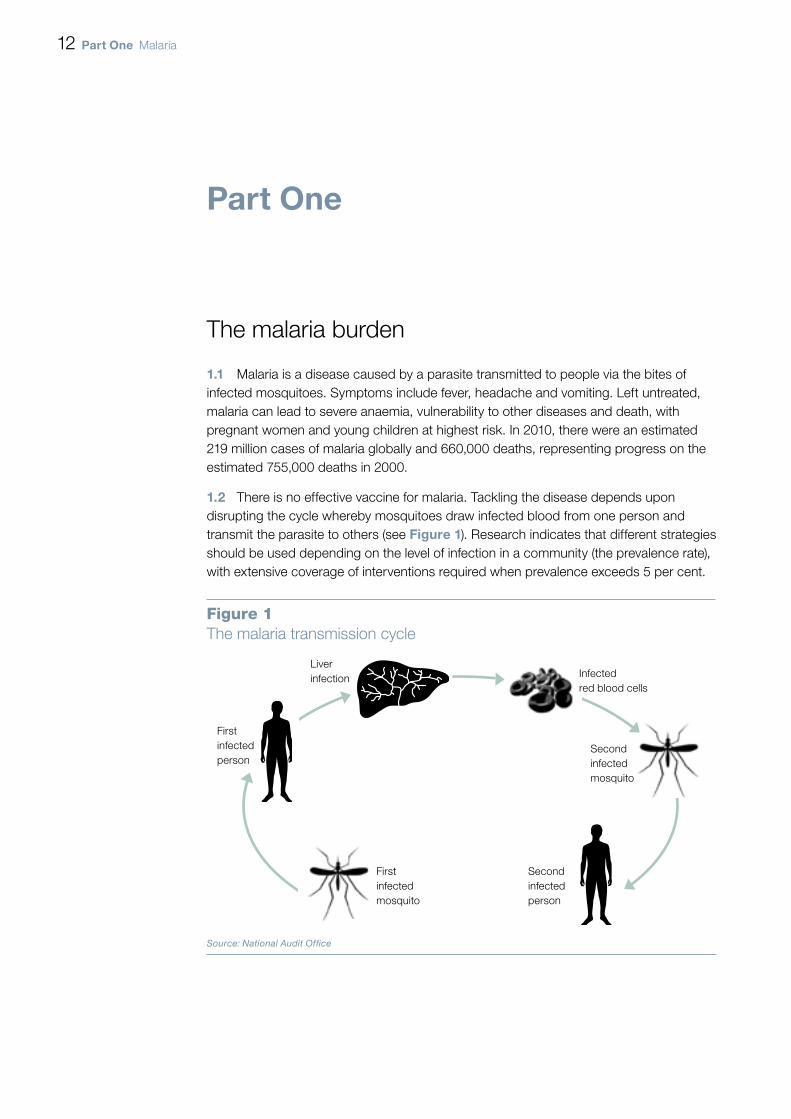
1.2 There is no effective vaccine for malaria. Tackling the disease depends upon disrupting the cycle whereby mosquitoes draw infected blood from one person and transmit the parasite to others (see Figure 1). Research indicates that different strategies should be used depending on the level of infection in a community (the prevalence rate), with extensive coverage of interventions required when prevalence exceeds 5 per cent.
Figure 1The malaria transmission cycle
First infected mosquito
First infected person
Liver infection Infected
red blood cells
Second infected person
Second infected mosquito
Source: National Audit Offi ce

Malaria Part One 13
1.3 The main interventions available to tackle malaria are based upon preventing mosquitoes from spreading the disease and case management to diagnose and treat those who have been infected (Figure 2). The malaria parasite, and the species and behaviour of carrying mosquitoes, differs between and within regions, making the disease and its treatment specific to local contexts.
There is a global commitment to tackle the disease
1.4 Malaria is strongly associated with poverty (Figure 3 overleaf). Low income countries1 experience higher rates of malaria mortality. Malaria-related deaths and sickness constitute a severe economic burden, with high-prevalence countries growing 1.3 per cent less per person per year than countries which have eliminated the disease. Some 80 per cent of all malaria deaths are in 14 countries, with Nigeria and the Democratic Republic of Congo accounting for more than half. In Africa, malaria causes direct losses of at least £8 billion annually.
Figure 2Key malaria interventions
Category Intervention Description
Prevention Insecticide-treated bed nets Sleeping under nets prevents mosquito bites. Nets come in different sizes, shapes and colours. Newer nets have longer-lasting insecticide.
Indoor residual spraying Spraying of inside walls, typically twice-yearly, with insecticide to kill mosquitoes.
Case management
Diagnosis – microscopy Blood samples examined under a microscope, by trained clinicians, to identify presence of the parasite.
Diagnosis – rapid diagnostic tests Blood deposited in a plastic receptacle confirms if malaria is present. Clinician or laboratory is not required and results are immediate.
Treatment – a course of tablets for uncomplicated malaria
Recommended treatment is artemisinin-based combination therapy. Older drugs, including single-compound drugs called monotherapies, are less effective. Artemisinin monotherapies risk spreading resistance and are being phased out.
NOTE1 Artemisinin is a compound from the plant sweet wormwood, and is the most effective active ingredient in
malaria medication.
Source: National Audit Offi ce

14 Part One Malaria
1.5 There has been a significant increase in global funds to fight malaria since 2008. However, funding is well short of that required. The World Health Organization estimates that US$5.1 billion is needed annually to cover all populations at risk. In 2011, global funding from donors and host governments totalled $2.3 billion, leaving a $2.8 billion gap (Figure 4). Global funding for malaria control is forecast to broadly level off below $2.7 billion,2 making more effective use of resources essential if the progress of the last decade is to be sustained.
1.6 The last decade has seen increased distribution of bed nets in many countries, coupled with increased supply of combination therapy drugs. Research and development efforts have significantly increased. However, threats are emerging: predominantly parasite resistance to artemisinin-based drugs, and mosquito resistance to insecticides. Evidence on the extent of resistance is incomplete, but many authorities consider it a serious threat to the effectiveness of the main anti-malarial tools, which have few available alternatives.
Average malaria incidence rate per 100,000 of the population
Countries economic status
Malaria is strongly associated with poverty
Figure 3A comparison of the average malaria incidence rate for countries at each level of economic status
NOTE1 Malaria incidence rates are estimates from 2009.
Source: The World Health Organization’s World Health Statistics Report 2012
0 2,000 4,000 6,000 8,000 10,000 12,000 14,000
Low Income
Lower-Middle Income
Upper-Middle Income
High Income
12,653
5,068
56

Malaria Part One 15
The Department’s response
1.7 Reducing malaria is a development priority of the UK government. The Department for International Development (the Department) has bilateral malaria programmes in 17 of its 28 priority countries3 (Figure 5 overleaf), and also funds multilateral organisations, principally the Global Fund to Fight Aids, Tuberculosis and Malaria (Global Fund). Additionally, the Department committed to improve the effectiveness and efficiency of the global response through international institutions and partnerships. In 2010, it brought together global evidence on malaria to help inform decision-making within the Department and its partners.4 It focuses on control and containment of malaria and reducing deaths, rather than eradication, reflecting high levels of the disease in most priority countries. The World Health Organization acknowledged to us the Department’s leadership in areas such as reaching the private sector with essential malaria services, and support for global programmes.
Global funding for malaria control is projected to level off, short of estimated requirements to cover all populations at risk
6
5
4
3
2
1
0
Figure 4Past and projected global funding for malaria control, 2005 to 2015
2005 2007 2008 2010
NOTES1 Funding figures include estimated international donor and domestic government spending. Projections of funds available for malaria control between 2012
and 2015 are from formal commitments made by funding agencies or, if data is unavailable, from pledges, as reported in the World Malaria Report 2012.
2 Global funding requirements taken from the Global Malaria Action Plan report 2008.
3 Values are in nominal terms, rounded to the nearest $100 million.
Source: National Audit Office interpretation of World Malaria Report 2012
Global malaria funding ($ billion)
2006 2009 20122011 2013 20152014
0.81.0
1.2
1.6
2.2 2.3 2.32.5
2.7 2.7 2.6
Estimated global requirements per year 2011–2020 ($5.1 billion)
Estimated global funding (donor and host government)
Estimated $2.8 billion funding gap between global funding (donor and host government) and global funding requirements

16 Part One Malaria
Figure 5The Department’s priority countries containing a malaria programme
NOTES1 The Department’s 28 priority countries are those where it supports sustainable poverty reduction through development programmes.
2 Dark green countries represent the Department’s priority countries that have a bilateral malaria programme; light green indicates priority countries that do not.
3 OPT represents Occupied Palestinian Territories.
Source: National Audit Offi ce
1 34
6
7
5
9
8
11
13
12
14 16
17
15
25 28
2
18
19
20 21
24
22
23
26
27
1 Sierra Leone2 Liberia3 Ghana4 Nigeria5 DR Congo6 Sudan7 South Sudan
8 Uganda9 Ethiopia10 Rwanda11 Somalia12 Kenya13 Tanzania14 Zambia
15 Malawi16 Mozambique17 Zimbabwe18 South Africa19 Yemen20 OPT21 Afghanistan
22 Tajikistan23 Kyrgyzstan24 Pakistan25 India26 Nepal27 Bangladesh28 Burma
10

Malaria Part One 17
1.8 The Department’s total spend on malaria increased from £138 million in 2008-09 to £252 million in 2011-12 (Figure 6 overleaf), equivalent to 3.3 per cent of its aid budget. It has committed to spending up to £500 million by 2014-15, by when it is projected to be the third-largest donor, behind the Global Fund and the United States of America. Aid to tackle malaria is delivered in three main ways:
• Bilateral programmes, where support is provided directly to a country.
• Funding and influencing multilateral organisations (organisations, such as the United Nations, typically established by inter-governmental agreement) to deliver programmes.
• Commissioning research.
1.9 The Department committed, in its 2010 malaria Framework for Results,5 to contribute to at least halving malaria deaths in at least ten high-burden countries by 2014-15. It is working internationally to agree a standard method of measuring progress before reporting against this target.
1.10 The Department plans to undertake a mid-term review of its malaria programme by the end of 2013. The results of our examination should be taken into account in this exercise.
Scope of our study
1.11 We examined whether the Department has made well-informed and cost-effective choices in the way it supports the sustained reduction of malaria, through programmes to prevent, detect and treat the disease. Assessing value for money is challenging in international development, given the large number of agencies affecting progress, gaps in key data and the difficulties in establishing counterfactuals showing what progress would have been without intervention. Our examination (Appendix One) covered the Department’s overall approach, drawing on detailed fieldwork in Sierra Leone, Tanzania, Nigeria and Burma, where the Department has important anti-malaria programmes costing a projected £117 million from 2011-12 to 2014-15.
1.12 We assessed value for money against the following criteria:
• Whether the Department has made well-informed choices (Part Two).
• Whether its choices are being delivered efficiently and effectively (Part Three).
• Whether it is taking appropriate steps to safeguard the sustainability of the benefits of its interventions (Part Four).

18 Part One Malaria
Figure 6The Department’s total spend on malaria, 2008-09 to 2011-12
£ million
The Department’s spend on malaria increased from £138 million in 2008-09 to £252 million in 2011-12
Multilateral malaria 21 50 90 46
Non-country-specific malaria 8 20 75 36
Bilateral malaria research 7 8 7 8
Bilateral indirect spend 67 82 86 92
Country programmes malaria 35 34 45 70
Total 138 194 303 252
NOTES1 Total malaria spend fell between 2010-11 and 2011-12 due to the UK bringing forward payments to the Global Fund,
classified as multilateral spend, and UNITAID, classified as bilateral spend (shown here in non-country-specific malaria).
2 ‘Bilateral indirect spend’ includes a proportion of spending on other health interventions that have strong links to malaria, including health systems and systems strengthening, maternal health, and water and sanitation.
3 Research and development of new drugs by the Medicines for Malaria Venture is recorded here as ‘non-country-specific malaria’ rather than research.
4 Non-country-specific malaria comprises mainly funding through organisations for work across numerous countries. This includes the Affordable Medicines Facility – malaria, which although administered by a multilateral (the Global Fund), is currently classified as bilateral aid under official definitions.
Source: Department’s analysis, May 2013
2008-09 2009-10 2010-11 2011-120
50
100
150
200
250
300
350
Malaria Part Two 19
Part Two
Making cost-effective choices
2.1 The Department for International Development’s (the Department’s) overall allocation of its development resources since 2010-11 has been based on two major reviews:
• a multilateral aid review of core funding to 43 multilateral organisations; and
• a bilateral aid review in which the Department invited and evaluated bids from its country teams, stating indicative results that could be achieved over the period 2011-12 to 2014-15.
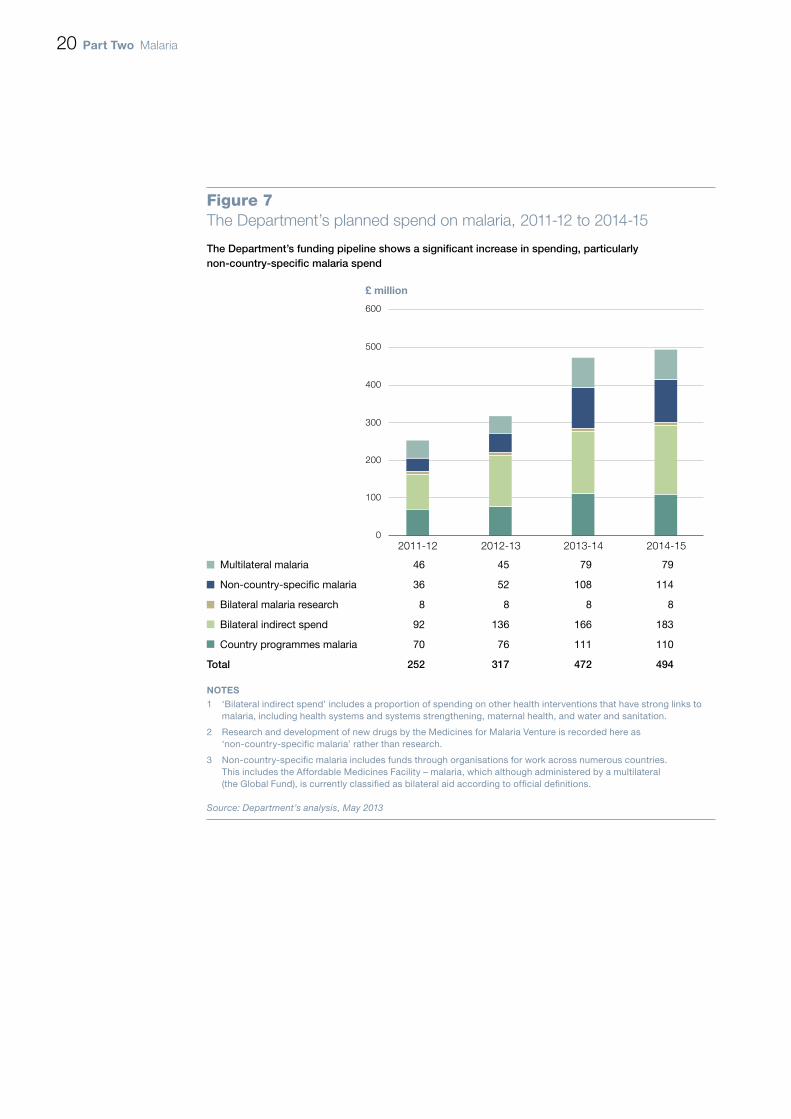
2.2 Based on current plans, the Department estimates that it will spend £494 million on malaria in 2014-15 (4.8 per cent of its aid budget), with multilateral expenditure increasing by 71 per cent from £46 million in 2011-12 to £79 million, and country programmes increasing by 56 per cent from £70 million to £110 million (Figure 7 overleaf).6 The largest increases are projected to be non-country-specific malaria, which although classified as bilateral is mainly through the Global Fund and UNITAID. The Department’s multilateral aid review rated them as respectively ‘very good’ and ‘good’ value for money for UK aid. Current plans are for this to increase from £36 million in 2011-12 to £114 million in 2014-15. The figures are provisional and subject to re-assessment in 2013.
2.3 Our previous report on the multilateral aid review focused on the extent to which the Department had made informed choices to secure value for money from its core funding of multilateral organisations.7 Our report noted insufficient data to compare the value for money of multilateral funding with that of bilateral aid. Core funding of organisations is also not earmarked for particular programmes, and attributions to specific issues such as malaria are estimates. We have therefore examined whether the Department’s allocation of bilateral country programme funding:
• was based on the evidence available; and
• has subsequently sought to address gaps in the evidence in advance of the next review.
20 Part Two Malaria
Figure 7The Department’s planned spend on malaria, 2011-12 to 2014-15
£ million
The Department’s funding pipeline shows a significant increase in spending, particularly non-country-specific malaria spend
Multilateral malaria 46 45 79 79
Non-country-specific malaria 36 52 108 114
Bilateral malaria research 8 8 8 8
Bilateral indirect spend 92 136 166 183
Country programmes malaria 70 76 111 110
Total 252 317 472 494
NOTES1 ‘Bilateral indirect spend’ includes a proportion of spending on other health interventions that have strong links to
malaria, including health systems and systems strengthening, maternal health, and water and sanitation.
2 Research and development of new drugs by the Medicines for Malaria Venture is recorded here as ‘non-country-specific malaria’ rather than research.
3 Non-country-specific malaria includes funds through organisations for work across numerous countries. This includes the Affordable Medicines Facility – malaria, which although administered by a multilateral (the Global Fund), is currently classified as bilateral aid according to official definitions.
Source: Department’s analysis, May 2013
2011-12 2012-13 2013-14 2014-150
100
200
300
400
500
600
Malaria Part Two 21
The allocation of bilateral aid across country programmes
2.4 Figure 8 overleaf shows the relationship between the malaria funding allocated by the Department to 17 country programmes in 2011-12 and the estimated death rate from the disease. The relationship is not exact, partly because in some instances the approved bids reflected special circumstances, such as in Burma where there is a strategic threat of disease resistance, or Zambia and Rwanda where there is a risk of malaria rebounding after decreasing. Also, in very large and challenging countries, such as DR Congo and Nigeria, the Department targets specific areas, taking into account local capacity, so overall spend per capita is lower. In this context, we also examined the robustness of the process used by the Department for allocating funding to each country.
2.5 In preparation for the bilateral aid review, the Department issued to its country teams an extensive summary of research on ‘what works’ in malaria control. It also issued guidance on the criteria for assessing bids, emphasising value for money. Guidance encouraged country bids to demonstrate factors such as cost–benefit and other value-for-money measures, such as unit costs against comparators, and the effects of increased scale on costs. It noted that cost-effectiveness of most health interventions critically depends on how well each health system performs, and that global averages estimating the cost per disease year averted fails to capture this.
2.6 Bids received considered cost-effectiveness, although with only limited quantification:
• Country teams generally cited generic global evidence that the Department supplied to them on cost-effectiveness of malaria interventions, with little evidence on levels of cost-effectiveness achieved or achievable in their countries. Global evidence indicates wide variations in cost-effectiveness according to local contexts, such as costs per year of full health gained by bed nets varying by a factor of up to ten. Cost-effectiveness ranges overlap between different interventions (Figure 9 on page 23). The country bids did not indicate where, relative to these ranges, their proposals fell.
• The Department’s own reviewers also identified the lack of comparable cost-effectiveness data, and of unit costs, as factors reducing the scope to compare bids.
• Although cost-effectiveness was assessed using global ranges rather than country-specific data, these nevertheless provided assurance that the chosen interventions should be ‘cost-effective’ compared with World Bank benchmarks for health spending, below US$150 per year of full health gained.

22 Part Two Malaria
Figure 8Comparison of malaria mortality and the Department’s bilateral spend in its 17 priority countries, 2011-12
Department’s bilateral spend on malaria per 1,000 population, 2011-12 (£)
There is a relationship between the Department’s allocation of spend and death rates in each country
NOTES1 Bubble sizes indicate the relative size of the Department’s bilateral malaria spend in country.
2 Bilateral spend includes both that spent directly on malaria projects and that attributed through indirect spend on wider health systems projects, and is taken from spend in the financial year 2011-12.
3 Population data taken from 2010.
Source: National Audit Office summary of data from: the Department’s Statistics for International Development, 2012; C Murray et al., ‘Global malaria mortality between 1980 and 2010: a systematic analysis’, Lancet, vol. 379 issue 9814, February 2012, p.p 413-31
Burma
Ghana
MalawiIndia
NigeriaSomalia
Rwanda
DR Congo
UgandaMozambique
Sudan
Sierra LeoneZimbabwe
Tanzania
200
300
400
500
600
700
0 20 40 60 80 100 120 140 160 180 200
Malaria mortality per 1,000 population (2010)
Department’s total spend bilateral, 2011-12 (£)
100
0
Ethiopia
Kenya
Zambia

Malaria Part Two 23
2.7 The Department’s guidance on health bids aimed to stimulate innovation through a ‘market in ideas’ and providing alternative proposals. In practice, each country team’s ability to generate alternative options was constrained by the one-month timetable for developing bids and where countries lacked existing malaria programmes to build on or full-time specialist health staff to prepare bids. Overall, some 92 per cent of the value of malaria bids, and 83 per cent of health bids, were taken forward into subsequent planning and business cases. We found no quantitative evidence that those health sector bids rated weakest on evidence of value for money attracted lower funding than other offers. In practice, other factors, such as disease burden and country fragility, determined allocations and the value-for-money assessment was used to set a minimum standard.
Cost-effectiveness varies greatly between contexts
Figure 9Published research estimates for cost per one year of healthy life gained of main malaria interventions
Insecticidetreated net
Indoor residualspraying
Intermittentpreventivetreatment
Artemisinincombination
therapy
NOTES1 Data is from a systematic review capturing 43 studies, 78 per cent of which were undertaken in
Sub-Saharan Africa, particularly Tanzania, Kenya and the Gambia.
2 A disability-adjusted life year is a measure of overall disease burden, calculated from the number of years lost due to disability or early death.
3 Intermittent preventive treatment is a drug given to prevent malaria in infants, children and pregnant women.
Source: M White et al., Costs and cost-effectiveness of malaria control interventions – a systematic review, Malaria Journal, vol. 10 issue 337, 2011
Cost per disability-adjusted life year averted ($)
0
20
40
60
80
100
120
140
Median
Top 25%
Maximum
Bottom 25%
Minimum
Guide to interpreting chart:

24 Part Two Malaria
2.8 A wider range of alternative bids would have given the Department a stronger basis to demonstrate that its choices were the best available. More widely, the Department recognises the need to increase choice and contestability in its allocation processes and sees this as one of the key mechanisms to increase value for money.8 It is considering how to increase competition for resources such that true trade-offs take place.
Assessing cost-effectiveness since the bilateral aid review
Steps by country offices to strengthen the evidence base
2.9 In view of the limited country-specific data available to support earlier bids, we examined what progress the Department had since made in strengthening assessment in Burma, Nigeria, Sierra Leone and Tanzania.
2.10 The Department’s adoption of more rigorous business cases since 2011 has increased the use of cost–benefit analysis in programme design. However, the extent to which this has led to more robust judgements appears mixed.
2.11 In Sierra Leone, the Department retained specialist consultants to compare the relative efficiency and effectiveness of delivery options. This allowed a well-informed judgement about which options would provide the greatest benefits for given resources. In Tanzania, the Department’s malaria programme considered country-specific bed net delivery costs, but relied on global, not local, cost-effectiveness data.
2.12 Information on cost-effectiveness was weakest in Burma. In part this reflected the particular political challenges of operating there, with only restricted government permission to undertake research, limited choices of implementing partners and poor data on malaria prevalence and targeting. An important area demanding better information is the relative cost-effectiveness of nets and alternative protection measures. Although still worthwhile and relatively easily supplied, nets tend not to interdict the peak hours of mosquito biting in the region. In December 2012, the Department approved trials of alternative protection methods, such as repellent sprays or clothing.
2.13 In Nigeria, the Department’s large malaria programme had made the clearest progress in analysing variations in unit costs between states. It had also started to model local data on effectiveness, incorporating factors such as net coverage and net usage. To this extent, the Nigeria programme had moved beyond reliance on broad international averages. The Department’s programme had provided for local research to inform malaria programmes, although only one report had been produced within its five-year duration.
Malaria Part Three 25
Part Three
Delivering interventions efficiently
3.1 This part examines the Department for International Development’s (the Department’s) malaria intervention delivery performance against whether it:
• demonstrates clearly attributable impacts from its bilateral aid interventions for prevention and case management; and
• understands the costs of its bilateral aid interventions, and how these relate to programme outcomes.
The impact of the Department’s bilateral aid interventions
3.2 We examined the Department’s management of its prevention and case management interventions, and their impact on reducing the risk of malaria.
Prevention measures
3.3 The Department reports in its business plan the number of bed nets distributed with its support, nearly 25 million since 2010, with some 45 million nets expected to be distributed by 2015. This headline indicator ensures that a measure of malaria programme outputs is regularly monitored at corporate level. However, currently the Department does not routinely report at that level how results across its programmes relate to the amount spent, progress against project milestones, or the extent to which distributed nets last or are actually used, which would give greater insights into value for money. The Department has some of this information on individual projects, although not on a sufficiently complete or consistent basis to be readily aggregated.
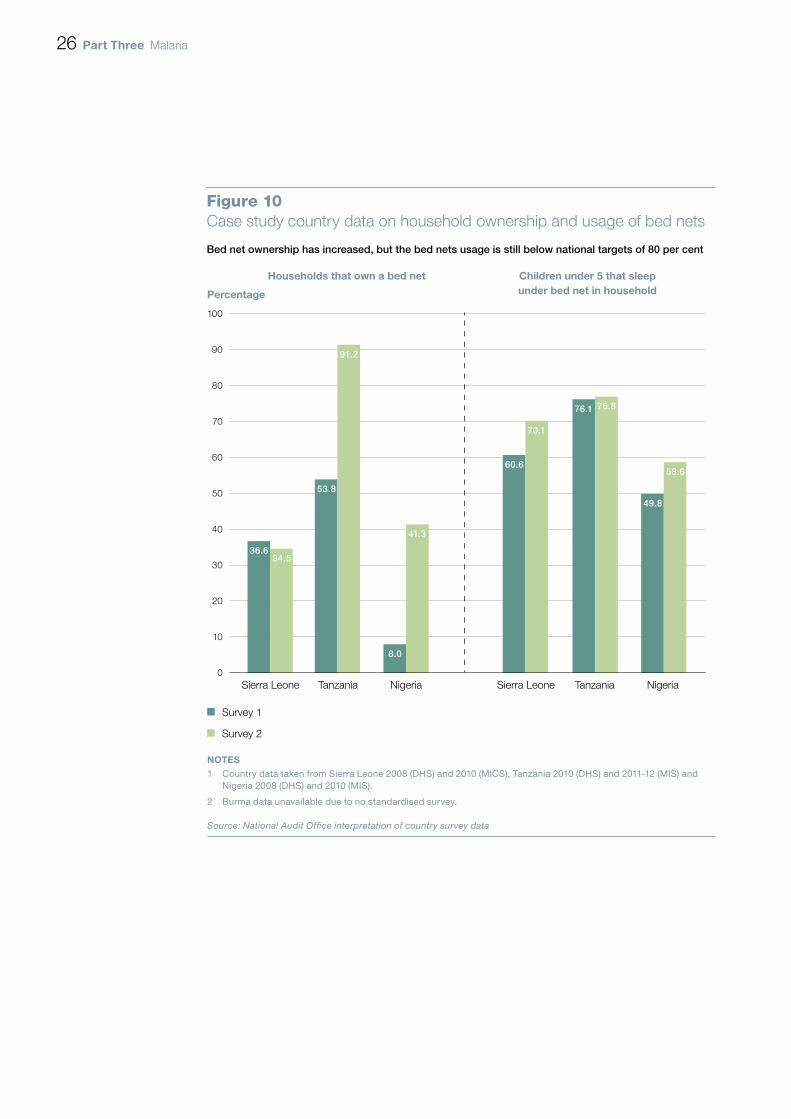
3.4 The Department has contributed to an increase in the number of households with access to a bed net in two of our three case study countries with data (Figure 10 overleaf). However, the distribution of nets does not necessarily mean that people will use them. Nets trap heat, can cause rashes, often come in international sizes unsuited to local preferences and can be difficult to hang in many homes. Country-level plans aim for 80 per cent of target groups, including children under five years of age, to be sleeping under a bed net by 2015. But usage rates even among households who own a bed net have not yet reached these levels (Figure 10).
26 Part Three Malaria
Bed net ownership has increased, but the bed nets usage is still below national targets of 80 per cent
100
90
80
70
60
50
40
30
20
10
0
Figure 10Case study country data on household ownership and usage of bed nets
Sierra Leone Tanzania Nigeria
Survey 1
Survey 2
NOTES1 Country data taken from Sierra Leone 2008 (DHS) and 2010 (MICS), Tanzania 2010 (DHS) and 2011-12 (MIS) and
Nigeria 2008 (DHS) and 2010 (MIS).
2 Burma data unavailable due to no standardised survey.
Source: National Audit Office interpretation of country survey data
Households that own a bed net
Percentage
Children under 5 that sleepunder bed net in household
Sierra Leone Tanzania Nigeria
36.634.5
53.8
91.2
8.0
41.3
60.6
70.1
76.1 76.8
49.8
58.6

Malaria Part Three 27
3.5 The Department’s normal approach is to accompany the provision of bed nets with information campaigns to change attitudes and encourage use. In the countries we visited, campaigns existed but had not yet resulted in sufficient behaviour change:
• In Tanzania, for example, the Department funded a follow-up campaign to visit households after a mass distribution exercise. This increased the number of distributed nets actually hung by 21 percentage points. However, the exercise had limited effect on overall bed net usage because logistical problems delayed the follow-up campaign reaching parts of the country soon after the net distribution, and the Department’s appointed agent lacked capacity to ensure consistent roll-out.
• In Nigeria, the Department included increasing awareness about malaria prevention as an element of its programme, for which bed net usage is an indicator. However, progress did not meet expectations, as the managing agent had mainly focused on increasing bed net coverage, limiting work on creating a demand for bed nets that increases usage.
Case management
3.6 Our examination of case management focused on initiatives to improve the extent of diagnosis and increase the availability and affordability of effective drugs. Since April 2010, the Department has directly provided 19 million treatments, although only 4 million rapid diagnostic tests.
Diagnosis
3.7 Reliable diagnosis of malaria cases reduces unnecessary treatment and if results are collated they can yield information to target high-risk areas. Patients with non-malaria fevers also have a better chance of getting appropriate treatment. Existing health facilities in developing countries frequently lack adequate laboratory facilities and trained staff to diagnose cases reliably. We directly observed a clinic in Tanzania, for example, where the laboratory slides were so contaminated they undermined test reliability.
3.8 The development of inexpensive rapid diagnostic tests – small, lightweight disposable blood tests sealed in sterile packets – allows accurate diagnosis of cases without access to microscopes. In Senegal, the introduction of tests in 2007 increased the number of people tested for malaria from 4 per cent to 86 per cent over a three-year period, reducing the number of fever cases prescribed with malaria drugs by 57 per cent over a three-year period, saving 500,000 courses of treatment.9

28 Part Three Malaria
3.9 The Department directly funds treatment in six countries (Burma, Kenya, Nigeria, Somalia, Uganda, Zambia). However, the levels of testing before treatment in the four countries we visited showed that programmes had not secured levels of diagnosis approaching those reported in Senegal. We observed two main barriers:
• A lack of availability of testing kits. Funding was often insufficient for nationwide coverage, despite other donors providing most diagnostic tests. In Nigeria and Tanzania, less than 50 per cent of public health facilities have malaria diagnostic tests available (Figure 11). Improved coverage requires a balanced supply of tests alongside drugs, particularly through influencing multilaterals such as the Global Fund to fund tests consistently alongside treatments. In Sierra Leone, a Global Fund programme increased the availability of malaria diagnostic tests by 56 percentage points at public health facilities between 2011 and 2012.
• Health workers not adhering to guidelines. In 2010, the World Health Organization recommended that all suspected malaria cases be confirmed by blood test,10 reflecting evidence that tests are far more reliable than diagnosis based on symptoms. In practice, however, some medics do not adhere to negative results from diagnostic tests, when visual symptoms lead them to assume that malaria might be present. We observed such attitudes during our visits in Africa.
3.10 There is much less diagnostic testing in the private sector than the public sector (Figure 11), although typically 60 to 80 per cent of treatment is dispensed by private retailers in developing countries. The Department recognises the need to expand diagnosis in the private sector. Current evidence already suggests that affordable tests, when combined with good marketing, regulation of safe practices and the right incentives for suppliers and patients, can lead to better targeting of drugs on confirmed cases, particularly in the formal private retail sector such as pharmacies. However, progress on the ground has so far been limited, with no national-scale test programmes for the private retail sector under way or quantified targets for transition in the countries we visited. Progress requires influencing country authorities to allow testing by retailers, since national guidelines sometimes restrict who is allowed to conduct and dispose of blood tests. The Department’s general approach is to build an improved evidence base, such as from trials it is funding in Burma. We consider that the Department should move as quickly as possible to specific plans with quantified targets for national-scale implementation.

Malaria Part Three 29
Percentage of outlets with any diagnostic tests for malaria
Malaria diagnosis is more available in public sectors than private sectors
Figure 11Comparison of rapid diagnostic test availability in public and private settings in pilot countries for the Affordable Medicines Facility – malaria subsidy
Ghana Kenya Madagascar Niger Nigeria Tanzania Uganda Zanzibar
Public health facilities
Private health facilities
Source: National Audit Office analysis using data from the subsidy evaluation
0
10
20
30
40
50
60
70
80
90
100
41
4
14
94
66
29
11
48
75
98
21
32
46
56
30 Part Three Malaria
Treatment
3.11 The most effective treatment for non-severe malaria is a course of artemisinin combination therapy tablets.
3.12 The Department has been instrumental in establishing and funding a pilot initiative in eight countries to increase the access, availability and affordability of quality malaria drugs. The Affordable Medicines Facility – malaria provides a ‘co-payment’ to manufacturers, substantially reducing the price that distributors in pilot countries pay11 and lowering retail prices to consumers. Modelling by leading health economists in 2007, which informed the design of the scheme, suggested that a global subsidy should be cost-effective, with an estimated cost per year of healthy life gained of US$33 to $56.
3.13 By the end of 2012, the initiative, managed by the Global Fund, had committed £213 million in co-payments and freight and insurance costs for 341 million treatments. The Department contributed £93 million (43 per cent) of the cost of the pilot, and is also contributing an additional £36 million in 2013 towards a continued scheme.
3.14 An evaluation for the Global Fund in October 201212 concluded that the subsidy was a “game changer in the private-for-profit sector” for most countries, although overall progress against objectives was mixed, indicating that effectiveness can be improved further. Of the eight pilot countries, success benchmarks were achieved in five for drug availability, five for price relative to inferior drugs and four for improved market share. Following expert advice, evaluators set benchmarks at levels that could “realistically be expected” by the end of the first year rather than the levels of $0.20 to $0.50 targeted in the original technical design for a completed five-year scheme. The average retail prices were more expensive than recommended retail prices in five countries (Figure 12), and ranged from $0.51 in Madagascar to $1.96 in Uganda. Higher prices make it more likely that people will buy cheaper inferior drugs. Oxfam questioned the affordability and economic burden of these retail prices to the poorest groups.
3.15 Although the scheme is likely to have saved many lives by increasing access to treatment at much reduced prices, its cost-effectiveness could be improved further. So far the cost-effectiveness of the first year of the operational pilot stands at $89 per year of healthy life gained. The original technical design for a completed five-year global scheme was estimated at $33 to $56. Two main issues affected performance: demand for drugs far exceeded forecasts and available funding, and supporting interventions, such as marketing, were generally not well implemented. The initiative struggled to match drug supply with demand, and countries such as Nigeria experienced drug price hikes during times of shortage. Demand from Nigeria came to represent half of the total from all eight countries, reflecting its large malaria burden. The Department provided extra funds in 2012 towards covering the shortfall, and subsidy managers introduced rationing of drug supply. The external evaluation also highlighted a need for better integrated supply, training and marketing, which may be helped by the planned integration of the drug subsidy into the main operations of the Global Fund from 2014.

Malaria Part Three 31
3.16 The 2012 evaluation did not examine the costs of the programme in detail, and so could not conclude on its operational cost-effectiveness. Although there are technical challenges in finding appropriate comparators and comparing costs, the lack of such data shows weaknesses in the design of the pilot. An improved understanding of how costs relate to performance within supported countries would provide a better basis for more informed choices between the subsidy and other malaria interventions.
Price ($)
Subsidised drug prices are lower in all markets except Uganda. Only Ghana and Kenya achieved recommended retail prices
Figure 12Comparison of retail prices of subsidised drugs compared with equivalent non-standardised drugs
Ghana Kenya Madagascar Niger Nigeria Tanzania Uganda Zanzibar
Source: National Audit Office analysis using data from the subsidy evaluation
9.0
8.0
7.0
6.0
5.0
4.0
3.0
2.0
1.0
0
Median price of non-subsidised 7.51 0.92 7.90 1.98 2.95 1.00 1.96 7.00ACT at AMFm evaluation ($)Median price of subsidised ACT 0.94 0.52 0.51 1.19 1.48 0.94 1.96 1.17at AMFm evaluation ($)Recommended retail price ($) 0.93 0.46 Not set 0.69 0.59 0.62 0.47 0.58

32 Part Three Malaria
Measuring the impact of the Department’s interventions
3.17 There is a shortage of reliable, timely data on death rates or prevalence rates of malaria across developing countries to assess the impact of the Department’s interventions. Records of treatment include fevers misdiagnosed as malaria and exclude untreated cases. Treatments in the private sector often do not feature in public health statistics. National surveys which test for malaria rarely coincide with the start, mid-term reviews and end of the Department’s programmes (Figure 13), making it still harder to discern programme impacts.
3.18 The main source of data on health outcomes in most countries, including blood-tested malaria levels, is a five-yearly, sample-based demographic and health survey, often funded by donors. In most countries, gaps between survey results weaken decision-making:
• In Sierra Leone, the last demographic and health survey was in 2008. The Department needed to fund a health programme between 2010 and 2012 before national data on the levels of prevalence for malaria became available, in 2013.
• In Burma, there was no consistent and comprehensive data survey after 2005-06, reflecting in part its political isolation until recently. Development partners started to address this gap in 2012 with surveys in specific localities, to support better-informed decisions.
• There are, however, solutions to gaps between major surveys. In Tanzania, the Department supports the Ifakara Health Institute, a specialist research institution, which has set up sentinel monitoring sites around the country to capture health data. The approach has improved the availability of data in Tanzania and should be applicable in other countries.
3.19 In 2010, the Department proposed a regional project to help improve robust data across Africa. The proposal recognised the lack of robust in-country data for malaria deaths, resulting in weak management, minimal accountability and lack of sustained political commitment to address the issue. The proposal envisaged work with regional and national institutions to ensure consistent methodology and agree measures which would be respected. In May 2013, ministers approved this project for implementation.
3.20 We found good levels of coordination between the Department and other donors on project management in our case study countries. In Sierra Leone, the government and its partners, including the Department, set out aims and intervention plans in a rolling three-year joint health compact, which costed the interventions required to meet strategic aims and allocated resources to priority areas. In Burma, the Department was engaged in developing a similar plan covering malaria. In Nigeria, the Department worked alongside other donors to agree a division of labour across the states.

Malaria Part Three 33
Figure 13The frequency of data surveys and the Department’s programmes in four case study countries
Data surveys rarely coincide with the start and end of the Department’s programmes
2005 2006 2007 2008 2009 2010 2011 2012 2013
Burma2,3
Nigeria1
Sierra Leone1,2
Tanzania1
Survey
Programme start
Programme end
NOTES1 All surveys are nationally representative and carried out by trained in-country teams. Financing and technical support comes from the United States
Agency for International Development (Demographic Health Survey and Malaria Indicator Survey) and the Roll-Back Malaria Initiative (Malaria Indicator Survey).
2 UNICEF conducts a Multiple Indicator Cluster Survey (MICS), which is also nationally representative and records malaria measures but does not include a measure of malaria prevalence based on a blood sample. MICS surveys were conducted in Burma (2006, 2010), Nigeria (2007) and Sierra Leone (2005, 2010).
3 A survey in Burma in 2012 included a measure of malaria prevalence based on a blood sample, but it was not nationally representative.
Source: National Audit Offi ce
Improving Reproductive, Maternal and Newborn Health
Three Disease Fund
ACT Drug Subsidy
Three MDG Fund
SuNMaP
SunMaP Extension
Malaria Outreach Initiative
Support to Mass Bed Net Distribution
Medicines and Medical Supplies
Bed Net Hang-Up Campaign
Tanzania National Voucher Scheme

34 Part Three Malaria
Managing the cost of malaria interventions
3.21 We assessed the Department’s management of costs against the following criteria:
• procurement and distribution costs should be kept to a minimum;
• supplies are targeted where they are needed; and
• the risk of leakage or fraud is minimised.
Procurement and distribution costs
3.22 The Department is working at two levels: globally with other agencies to help reduce global prices for the main anti-malarial commodities, and to buy effectively for its own bilateral programmes.
Global prices
3.23 The Department’s contribution is one among many in this field, but the overall trend in recent years has been positive. Global price data (Figure 14) shows:
• Average bed net prices have fallen as a result of price negotiation through the Global Fund and UNICEF, reflecting increased capacity and competition among suppliers.
• In 2010 the Affordable Medicines Facility – malaria initiative significantly reduced manufacturers’ sales prices for quality assured drugs for the private sector to the levels obtained by the public sector through price negotiation. However, prices subsequently rose, in part due to constrained supply of raw artemisinin to meet rising (often undiagnosed) demand.13 There are indications that prices have started to fall back.
3.24 Further reductions in drug costs will depend in part on increased competition. Only nine drug manufacturers worldwide are accredited by the World Health Organization, compared with an estimated 240 that are not. The Department is providing technical assistance to some manufacturers seeking accreditation for their products. However, the World Health Organization process is lengthy and challenging for suppliers to complete. The Department has provided funding to help expand the capacity of the accreditation system.

Malaria Part Three 35
Commodity costs incurred by the Department
3.25 We obtained from Crown Agents, one of the Department’s main buyers, evidence that bed net prices to the Department had also fallen over the last three years, consistent with the global trends (Figure 14). In Burma, the Department’s agents went further, benchmarking the prices they had obtained to demonstrate that these had fallen and were within comparative UNICEF prices. However, the Department does not regularly compare prices paid against external benchmarks across its network. In early 2013, the Department collected evidence from country offices for the first time and has committed to analysing the results going forward.
3.26 Distribution costs include freight, clearance at the port of entry, warehouse storage and distribution around the country. These costs can be relatively high given the geographical size of many developing countries and their limited infrastructure. In Sierra Leone, distribution costs accounted for 41 per cent of the average cost of a delivered bed net.14 We did not find routine analysis of such costs by the Department in our four case study countries. In practice, the costs tend to be monitored by the Department’s agents – at that level we noted some evidence of comparison of distribution costs between states in Nigeria and of changes to reduce warehouse costs in Burma. However, the Department did not collate clear, up-to-date information demonstrating that these costs are regularly reviewed.
Figure 14Pooled pricing of bed nets and artemisinin combination therapies
‘Market shaping’ Bed nets Artemisinin combination therapies
Price paid to manufacturer
2009-10
($)
2011-12
($)
Price beforefirst negotiation
(2009)
($)
Price following first negotiation in 2010 (maximum price)
($)
Price following2nd and 3rd
negotiation in2011 and 20122
(maximum price)($)
Price following4th negotiation
in 2013
($)
Public sector4.55 3.79
1.30 1.40 1.59 1.51
Private sector 3.001 1.43 1.62 1.54
NOTES1 Average price paid to manufacturers per treatment.
2 These are the current Affordable Medicines Facility – malaria maximum prices.
3 Data on bed nets from the Department’s Annual Report 2011-12, based on UNICEF and Global Fund data.
4 Data on artemisinin combination therapies from Affordable Medicines Facility – malaria, supplied by the Department.
5 Prices in 2012 for artemisinin combination therapies are unchanged on 2011 levels.
Source: National Audit Offi ce analysis of publicly available data

36 Part Three Malaria
Targeting of supplies
3.27 Efficient health systems require timely and reliable management information on performance in supplying and targeting malaria commodities to where they are needed. However, in our case study countries, we observed manual and unreliable local supply systems, increasing the risk of stock-outs, expiry of unused drugs or leakage of Department funded supplies:
• In Sierra Leone, the Department directly supports the supply chain through which it provides free healthcare, including bed nets and anti-malarials. Incorrect and late reporting of the quantity of drugs dispensed by health facilities led to insufficient replenishment and frequent stock-outs. The Department plans to support a new national procurement unit to improve the system.
• In Burma, a similar partly manual stock system shows limited ability to move stocks from low–prevalence malaria areas to high-prevalence malaria areas.
3.28 In the minority of countries where malaria incidence is low or localised, quicker and more precise information on outbreaks is needed to ensure prompt and well-targeted treatment. Sophisticated malaria control in low–prevalence areas can be expensive on a cost per case basis but avoids higher total costs should outbreaks spread. As other countries start to evolve strategies for decreasing prevalence, examples of good practice should be incorporated. The islands of Zanzibar (in Tanzania), where only 0.2 per cent of children under the age of five had confirmed cases in 2011-12, have a highly capable mobile phone-based surveillance system, helping direct the deployment of mobile treatment teams to contain disease spread and eliminate hotspots. In Burma, where overall malaria prevalence is higher but still localised, the need to contain transmission means that cases are also mapped down to village level. This informs levels of intervention intensity, although to date mapping is manual and too infrequent to support a system of response teams.
Leakage and fraud
3.29 The Department’s anti-corruption strategies highlight the need to have adequate controls and measures in place to mitigate the risk of supplies or money being lost. Mitigating actions should include rigorous risk assessments and monitoring requirements for all projects and programmes. The strategies state that where there is suspicion of corruption and fraud the Department will always follow up; and if fraud or corruption is uncovered the Department will take action to recover UK taxpayers’ money.

Malaria Part Three 37
3.30 The distribution of drugs, diagnostic tests and bed nets carries risks, and we noted instances of fraud and leakage in our case study countries:
• In Sierra Leone, an independent audit of the free healthcare drugs supply chain highlighted 6 per cent of stock was unaccounted for in 2011. The exact level of leakage within the unaccounted stock was difficult to ascertain because of weaknesses in the supply chain management system. The Department necessarily suspended its funding, for six months, until sufficient risk and control measures were introduced. But the suspension resulted in a prolonged stock-out of most drugs, including anti-malarials.
• During our visit to Burma, we observed donor-funded packs of diagnostic tests intended for private clinics that were being sold in the retail market. The Department has investigated and is taking steps to improve controls.
• In Tanzania, the Department supports part of a voucher scheme for bed nets, which is managed by a management company. The company is incentivised to meet net distribution targets. Its systems proactively monitor for fraud, showing fraud levels to be within 2 to 3 per cent. The figures were routinely reported to the Department, which had not analysed the data.
3.31 These instances of suspected fraud or leakage appear unlikely to be on a large scale, and indicate that the Department responds appropriately when cases are brought to its attention. But they also illustrate the importance of actively monitoring markets for evidence of ‘diverted’ supplies. It is important that the Department’s implementation of new anti-corruption strategies in 2013 includes this aspect.
38 Part Four Malaria
Part Four
Sustaining the progress made
The importance of sustainability
4.1 Past experience shows that delays or gaps in malaria control leads to rapid resurgence of the disease, reflecting the reduced natural immunity of previously protected populations. The global malaria eradication programmes of the 1960s ended in 1969, resulting in a resurgence of malaria by 1972.15 On Zanzibar in Tanzania this has happened twice previously (Figure 15). The value for money of the Department for International Development’s (the Department’s) aid therefore depends on ensuring it has a longer-term impact. Sustaining progress depends upon:
• strengthening the capability of public health systems to control malaria;
• the need for donors to leverage developing country resources for health, rather than substitute for them;
• sustaining commercial markets for anti-malarials without crowding them out; and
• enabling appropriate research and development to sustain the effectiveness of control measures, particularly against disease resistance.
Strengthening public health services
4.2 In our case study countries, public health facilities focus on maternal and child health, with limited provision for the wider population. The Department’s support to those facilities directly benefits mothers and children, which is justifiable in terms of malaria because disease mortality is highest for the young. However, breaking the cycle of transmission requires reaching the wider population. Generally, we found that outreach services, typically using volunteer community health workers, were less well developed and resourced.
4.3 Within public health facilities, we observed programmes focused on integrating malaria interventions within child and maternal health services, reducing the duplication of effort that occurs when individual diseases are treated in isolation. Conversely, we saw a range of issues hindering the effectiveness of health services, such as poorly functioning hospital referral systems hindered by lack of fuel or maintenance for ambulances. These issues will take time to resolve.

Malaria Part Four 39
Leveraging government ownership
4.4 Globally, international donors provide some 73 per cent of dedicated anti-malaria resources.16 Although governments contributed some US$625 million for malaria control in 2011, barely a quarter of this was in Africa where the malaria problem, and the Department’s investment, is concentrated.
4.5 In April 2001, 46 African governments signed the Abuja Declaration undertaking to devote 15 per cent of government spending to health services. Ten years on, 26 countries have increased their proportion of health spend, but even with donor support just three of the Department’s 18 priority countries consistently met the target. Levels of health spending in the four case study countries appear low, with the exception of Tanzania, where spending levels include general budget support from donors, including the UK (Figure 16 overleaf).
Figure 15Time series of malaria prevalence in Zanzibar
Malaria resurged rapidly when historical control programmes ended
80
70
60
50
40
30
20
10
0
1955 1960 1970 1980 1985
Source: Cohen et al., ‘Malaria resurgence: a systematic review and assessment of its causes’, Malaria Journal, 2012
Parasite prevalence (%)
1965 1975 1995 20001990
Programme starts
Programme ends
Programme starts
Programme ends

40 Part Four Malaria
4.6 The Department recognises that it has a role in leveraging additional developing country resources for health from public, private and voluntary sources rather than simply to substitute for it. We identified some positive examples of influencing in our case study countries:
• In Nigeria, the Department advised us of success in leveraging more health resources in one state, Kano. However, although Nigeria became a lower-middle income country in 2011, health spending remains generally low and is variable across its 37 states. Commitment varies according to the interest shown in health by individual state governors and the Department has more to do to replicate the Kano example across the ten states in which it supports health.
• In Burma, health has not been an evident priority for previous administrations, but the Department has encouraged change and we heard in-country of the government’s announcement of a four-fold health budget increase between 2011-12 and 2012-13, albeit from a very low base. It is not yet clear how far such resources would be directed to combating malaria, and to poor populations.
Figure 16Health spending as a proportion of general government expenditure in case study countries
Proportion of total government expenditure spent on health (%)
African countries have not met Abuja Declaration targets of 15 per cent of government expenditure
Source: The World Health Organization’s World Health Statistics Report 2013
Sierra Leone 14.2 14.2 14.2 14.2 14.2 14.33 11.65 11.95 10.87 12.44 11.69 11.69
Tanzania 10.18 11.13 11.07 11.81 8.46 8.74 16.86 16.00 16.03 15.13 11.13 11.13
Burma 8.09 6.97 10.29 1.6 1.65 0.99 1.35 1.09 1.24 1.3 1.3 1.3
Nigeria 4.22 3.2 3.11 5.11 7.83 6.41 7.06 9.19 7.63 7.41 5.73 7.51
0
2
4
6
8
10
12
14
16
18
2000 2001 2002 2003 2004 2005 2006 2007 2008 2009 2010 2011

Malaria Part Four 41
4.7 The Department usually seeks to influence host governments through dialogue. Its specialist advisers in assisted countries play an important role. We have previously recommended that the Department put sufficient experienced advisers in place to exercise oversight on its increased spending and to advise ministries.17 The Department has increased the number of health advisers allocated to countries from 37 in 2010 to 46 in 2013 and has essentially addressed the key problem of country teams lacking a full-time health adviser.
4.8 The increase in advisers should help the Department extend its influence on country governments, for example through exploring opportunities to directly link its own increased funding to increased local funding. The health advisers bring directly relevant expertise – most of the 23 working on malaria reported relevant expertise such as qualifications in public health or experience as a doctor. However, it is important that they focus their time on programme-facing tasks such as oversight and influencing. The main concern reported to us by health advisers was that they did not have enough time to get into the field to identify and help address problems in implementation.
Sustaining commercial markets
4.9 The overall challenge is to build bed net use, including through commercial markets that are sustainable and can co-exist alongside free distributions targeted on the poor and high-risk groups, such as children and pregnant women. Bed nets, for example, typically only last three years, so sustaining coverage requires specific plans for replacement. However, we observed a need for greater and earlier planning for the impact of free mass net distributions on commercial sales.
4.10 In Nigeria, donors have almost met their aim to provide some 60 million free nets nationwide – broadly two per household. The Department has contributed some 2.7 million nets, and plans distributing a further 5.3 million by 2015. The first free nets issued in 2010 are already reaching the end of their expected life and replacement is becoming a critical issue. We found no evidence that a clear and resourced strategy for replacement of all nets was in place when the mass distribution was planned.
4.11 The Department predicts a need for up to eight million nets in Nigeria annually to be replaced through commercial sales in addition to free distributions (Figure 17 overleaf). The free distribution has increased public awareness of nets, but also raised expectations that nets are a ‘free good’. Retailers now find their nets to be slow-moving stock. Commercial firms indicated a decline in their retail sales in the wake of the mass campaign, and firms unwilling or unable to change production to longer-lasting nets left the industry.

42 Part Four Malaria
4.12 Recognising little donor or government appetite or capacity for another mass distribution in Nigeria, the Department’s agents have designed several interventions to stimulate private sector provision, although by late 2012 some work-streams were at early stages and others addressed niche markets such as hotels and boarding schools. In part, progress reflected difficulties in recruiting suitably experienced staff for commercial work. The Department acknowledges that mass net campaigns may have suppressed the retail market in the short term, but it intends to work with other partners and the government to ensure that any future free or subsidised net distributions are well controlled, predictable and well targeted on the poorest and most vulnerable people.
Household net coverage (%)
100
90
80
70
60
50
40
30
20
10
0
Figure 17The estimated requirement for replacing bed nets through commercial suppliers in Nigeria, following a free mass distribution campaign
2011 2012 2013 2014 2015 2016 2017
NOTES1 Routine distribution through antenatal and immunisation services.
2 Based on Nigeria national malaria control target of 80 per cent coverage of prevention interventions.
Source: National Audit Office interpretation of NETCALC model
2018
The targeted net coverage to stop malaria transmission is 80 per cent of households
Coverage of effective nets through free distributions to targeted groups (assuming life of 3 years)
Estimated replacement requirement through commercial purchases

Malaria Part Four 43
4.13 In Sierra Leone from 2006 to 2009, the Department piloted a social marketing programme selling larger bed nets, which increased both coverage and usage, but this was overtaken by the mass free distribution, which replaced commercial markets. In Tanzania, the Department supports a voucher scheme enabling consumers to pay commercial suppliers a supplement in return for a greater choice of nets, but the impact of this is not yet evaluated.
The Department’s research portfolio
4.14 In 2011, an estimated £348 million was spent globally on malaria research, of which 89 per cent was for malaria vaccines, drug development and basic research.18 The Department’s split within its £20 million spend is similar, although arguably its country network gives it a natural niche for commissioning operational research into delivery in the field (Figure 18).
Figure 18The Department’s key research areas
Research type 2011-12 funding as a percentage of total
malaria research funding
Description Main role of Department in commissioning research and monitoring arrangements
Product development partnerships
77 New drugs, nets, diagnostic tests etc., which are tested and brought to market if successful.
Partnerships are commissioned through open competition.
The Department reviews targets annually against a performance framework set by the partnership.
Clinical trials, methods and basic science
9 Joint collaboration with research funders such as the Wellcome Trust and the Medical Research Council to fund trials looking at efficacy and effectiveness of new interventions.
The Department reviews annually its relationship with the research funder.
The research funder commissions research on individual projects.
Operational research 14 Testing the effectiveness of interventions in real situations.
Operational research is typically commissioned through open competition.
The Department reviews targets annually.
NOTE1 Total malaria research funding in 2011-12 was £20.2 million, which includes funding to the Medicines for Malaria Venture.
Source: National Audit Offi ce analysis

44 Part Four Malaria
4.15 The Department has a robust process for identifying research priorities, based on a peer-reviewed malaria evidence paper and aligned with its wider health priorities, such as health systems and communicable diseases. This includes artemisinin resistance and the development of new treatments and technologies. The Department’s research priorities are well-based, and other donors we met considered them sensible.
4.16 For product development and basic science, the Department relies on other organisations to define research questions for its funding. This is a sensible approach, taking advantage of their specialist skills. The Department uses this approach predominantly in its efforts towards resistance to treatment, where it has commissioned operational research to track resistance in south-east Asia, while funding drug development through others.
4.17 Although the priorities are well-founded, the balance of the portfolio (Figure 18) is open to question. The Department’s network of advisers gives it a comparative advantage in commissioning and responding to research on operational issues, as its presence in-country allows it to observe challenges in implementation. However, the Department’s central commissioning team has limited capacity to fund small, short-term, responsive research projects at country level. Research at country level is typically country office-led, but a fund for country offices to commission work on policy-relevant questions has rarely been used in the health sector. In some countries, local research output lags behind schedule.
4.18 The Department mainly commissions research through open competition, with selection criteria based on alignment with the Department’s strategic priorities, perceived effectiveness of the research organisation, and value for money. However, decisions over funding levels were typically judgements not based on quantified estimates of the levels of disease averted. We found limited evidence of economic appraisals including cost–benefit analysis in the five research programmes we examined, although the programmes were initiated before the Department adopted new, more rigorous business cases in 2011. Quantification of research impacts relied on a UK-based study looking at the rate of return for health research. Quantification is open to uncertainty given the typical five- to ten-year duration for impact. But the cost–benefit analysis for the subsidy programme in Burma demonstrates that it is possible to quantify global benefits from delaying resistance.

Malaria Appendix One 45
Appendix One
Our audit approach
1 We examined whether the Department for International Development (the Department) is securing value for money in its support for reducing the malaria burden across its priority countries, by considering whether the Department:
• has made cost-effective choices when allocating its resources for malaria;
• is delivering malaria interventions efficiently, optimising cost and demonstrating impact; and
• has taken steps to safeguard the sustainability of outcomes.
2 We developed an analytical framework to assess value for money, which considers what arrangements would be optimal for reducing the malaria burden. We base our assessment of value for money on an evaluation of the approach the Department has adopted as well as what is known of outcomes. The assessment of outcomes in international development is restricted by factors including the large number of agencies affecting country progress, gaps in key data and lack of clear counterfactuals showing what progress would have been without interventions.
3 Our audit approach is summarised in Figure 19 overleaf. Our evidence base is described in Appendix Two.

46 Appendix One Malaria
The objective of government
This will be achieved by
Our study
Our evaluative criteria
Our evidence
(see Appendix Two for details)
Our conclusions
We:
• analysed funding data for the Department’s malaria portfolio; and
• reviewed the Department’s papers related to the bilateral aid review process.
We:
• reviewed the Department’s plans, strategies and actions for addressing future issues; and
• analysed funding data for the Department’s research portfolio and by country governments on health.
Has the Department made well-informed and cost-effective choices at corporate level as to how best to allocate its resources for malaria?
Is the Department taking appropriate steps to safeguard the sustainability of the outcomes from its interventions?
Has the Department made well-informed choices for the cost-effective delivery of the country-level programmes that it supports for prevention, detection and treatment of malaria?
We:
• conducted a review of academic and wider stakeholder literature;
• reviewed the Department’s papers relating to specific programmes; and
• assessed the Department’s processes for capturing results.
The Department’s main objective is to reduce global poverty through supporting the Millennium Development Goals. It aims to play a full part in helping to achieve the international targets for malaria by 2015 and has committed to helping halve the number of malaria-related deaths in at least ten of the worst-affected countries.
• working within countries to provide the right mix of good-quality prevention, diagnosis and treatment;
• removing barriers obstructing support and care to the poor in particular;
• investing in the future, through new treatments and prevention approaches; and
• focusing on results, publishing information to demonstrate value for money.
This study examined whether the Department is securing value for money through its support for reducing the malaria burden across its priority countries.
Malaria represents a serious health risk which constrains the development of low income countries. The Department’s bilateral programmes to tackle the disease use proven interventions which compare favourably with global benchmarks for cost-effectiveness in health. However, given insufficient information to compare cost-effectiveness between programmes, the limitations in comparing multilateral and bilateral spend and gaps in data on actual costs and outcomes, the Department needs to do more to demonstrate that it has fully secured value for money.
We used the following methods to inform all areas of the study:
• Conducted case studies for four of the Department’s priority countries.
• Consulted wider stakeholders including academics and other non-government organisations.
• We interviewed the Department staff responsible for malaria-specific policies and programmes.
• We conducted a web survey with the Department’s health adviser cadre.
Figure 19Our audit approach

Malaria Appendix Two 47
Appendix Two
Our evidence base
1 We formed our independent conclusions on whether the Department for International Development (the Department) is securing value for money in its support of programmes to reduce the malaria burden across its priority countries. Our conclusions were reached from the evidence we collected, for which fieldwork took place between September 2012 and January 2013.
2 We applied an analytical framework with evaluative criteria, which considers what arrangements would be most cost-effective for reducing the malaria burden. Our audit approach is outlined in Appendix One.
3 We assessed whether the Department made cost-effective choices when allocating resources.
• We analysed data on funding for the Department’s malaria portfolio including spend to date on malaria activities and estimated planned spend from the Department’s operational planning from 2011–2015. We assessed the Department’s model for monitoring malaria-related spend, how elements of projected spend were expected to increase going forward, and how spend varied across its priority countries. These comparisons allow us to draw high-level conclusions about spending, although we recognise that the data in operational plans is not at the same level of detail as actual spend figures.
• We reviewed Department papers, including its evidence paper and Framework for Results. We examined papers related to the bilateral aid review, including guidance issued by the Department, health sector bids from country offices, and technical review appraisals of the bids by Department staff. We used this to form our conclusions about the extent to which cost-effectiveness (e.g. relationship between inputs, outputs and outcome, cost per DALY,19 unit costs of outputs) was used in a consistent manner across countries. We also examined business cases and annual reviews from programmes in our case study countries to assess the extent to which cost-effectiveness data are used in decision-making in operational programming.
48 Appendix Two Malaria
4 We assessed whether the Department is delivering its malaria programmes efficiently, actively monitoring costs to secure value and demonstrating impact.
• We reviewed academic and wider stakeholder literature, including the World Health Organization’s World Malaria Reports20 and published country-level health surveys. We used academic literature to assess potential delivery options for malaria interventions. We used stakeholder literature to inform our assessment of the impact of the Department’s interventions, in collaboration with others, in our case study countries.
• We reviewed Department papers relating to specific programmes, including business cases, annual reviews and other programme-specific documents and evaluations. We reviewed documentation relating to key decisions, and the quality of operational data and processes for their robustness. This included examining procurement for the main anti-malarial commodities against local and international cost benchmarks. We also reviewed the findings of independent external evaluations where the Department is working in collaboration with others, such as for the Affordable Medicines Facility – malaria and the Three Diseases Fund in Burma. We assessed the extent to which the information collected on costs facilitated comparative insights into the relative cost-effectiveness of bilateral and multilateral delivery routes.
• We reviewed the Department’s processes for monitoring results, including the robustness and data quality of indicators that feature in its Annual Report, and its systems for monitoring the results set out in its Framework for Results across its country network, and the extent to which these comparative insights were used to assess performance and guide improvements.
5 We assessed whether the Department is taking appropriate actions to safeguard the sustainability of its outcomes.
• We reviewed the Department’s plans, strategies and activities to see how they are addressing key issues, such as market dynamics and resistance. We assessed the extent to which the Department was aware of risks to sustainable progress, and what actions it was taking to mitigate them.
• We analysed data on funding for the Department’s research portfolio and health spending by governments in our case study countries. We assessed the extent to which the Department had been able to secure additional domestic resources from governments, triangulating with evidence from in-country interviews. We also examined the balance of the Department’s research portfolio by research type.

Malaria Appendix Two 49
6 We used the following methods to inform all areas of the study:
• We conducted case studies of four countries where the Department has important malaria programmes: Burma, Nigeria, Sierra Leone and Tanzania. We selected these countries based on disease burden, the Department’s presence, longevity and materiality in-country, and geographic coverage. For each case study, we: reviewed relevant programme documents; interviewed country representatives from the Department, service agents, other donors and multilateral organisations in-country, the host government, health facility workers and beneficiaries; and collected funding information.
7 We interviewed the Department staff responsible for malaria-specific policies and programmes to assess the evidential basis for strategy, bilateral aid review and research and development allocation decisions, portfolio management and guidance between country teams. This included the chief scientific adviser, Chris Whitty.
• We conducted a web survey with the Department’s health adviser cadre across its country network, in both case study and non-case study countries. We received responses from 58 of 73 health advisers, a response rate of 79 per cent. We used a standard template to promote consistency in responses. We summarised and analysed the responses, and collated any additional comments made.
• We consulted wider stakeholders, including academics and non-governmental organisations. These included members of the London School of Hygiene and Tropical Medicine, Malaria No More, Crown Agents, Medicines for Malaria Venture, Wellcome Trust, Gates Foundation and Mahidol Oxford Tropical Medicine Research Unit. We sought their views on the key barriers to securing value for money and the quality of the Department’s response.
50 Endnotes Malaria
Endnotes
1 Defined as those countries with annual income per head not exceeding US$1,026, using the World Bank classification, 2011.
2 Forecast in the World Health Organization’s World Malaria Report 2012, taking into account likely host government contributions.
3 Department for International Development, Breaking the Cycle: Saving Lives and Protecting the Future, The UK’s Framework for Results for malaria in the developing world, December 2010.
This list was originally 18 (Burma, Ghana, Malawi, India, Nigeria, Somalia, Rwanda, Democratic Republic of Congo, Zambia, Uganda, Ethiopia, Burundi, Mozambique, Kenya, Sudan, Sierra Leone, Zimbabwe, Tanzania), but the Department has now graduated from Burundi as planned at the start of the Spending Review.
4 Department for International Development, Malaria: Burden and Interventions, Evidence Overview, A Working Paper (Version 1.0), December 2010, p.5.
5 Department for International Development, Breaking the Cycle: Saving Lives and Protecting the Future, The UK’s Framework for Results for malaria in the developing world, December 2010.
6 The Department’s analysis, May 2013.
7 Comptroller and Auditor General, Department for International Development: The multilateral aid review, Session 2012-13, HC 594, National Audit Office, September 2012.
8 HM Treasury minute responding to Committee Report on Department for International Development Financial Management, 2 January 2013.
9 S Thiam et al., ‘Major Reduction in Anti-Malarial Drug Consumption in Senegal after Nation-Wide Introduction of Malaria Rapid Diagnostic Test’, PLoS ONE, vol. 6, Issue 4, April 2011.
10 World Health Organization, Guidelines for the Treatment of Malaria (2nd Edition), 2010.
11 Price reduction by 90 per cent, to $0.15 (£0.09) for an adult treatment.
12 ICF International and London School of Hygiene and Tropical Medicine, Independent Evaluation of Phase 1 of the Affordable Medicines Facility – malaria (AMFm) – Multi-Country Independent Evaluation Report: Final Report, September 2012, p. 392.
Malaria Endnotes 51
13 Roll-Back Malaria, Updated ACT Prices Under the Affordable Medicines Facility – malaria, 1 March 2011.
14 The total cost per bed net was $6, of which $3.55 the net cost, $0.36 freight, $0.14 clearance from port, $0.18 warehousing and $1.78 distribution. Data was supplied by UNICEF.
15 J M Cohen et al., ‘Malaria resurgence: a systematic review and assessment of its causes’, Malaria Journal, vol. 11, Issue 122, 2012.
16 Calculation based on numbers presented in the World Health Organization’s World Malaria Report 2012, donor contributions of $1.66 billion versus government contributions of $0.625 billion is equivalent to 72.6 per cent for 2011.
17 Comptroller and Auditor General, Department for International Development: Bilateral Support to Primary Education, Session 2010-11, HC 69, National Audit Office, June 2010.
18 Basic research is defined as “Studies that increase scientific knowledge and understanding about the disease, disease processes, pathogen or vector, but which are not yet directed towards a specific product”.
19 The disability-adjusted life year (DALY) is a measure of disease burden, expressed as the number of years lost due to ill health, disability, or early death.
20 World Health Organization, World Malaria Report, 2012.

Design and Production by NAO Communications DP Ref: 10181-001
This report has been printed on Evolution Digital Satin and contains material sourced from responsibly managed and sustainable forests certified in accordance with the FSC (Forest Stewardship Council).
The wood pulp is totally recyclable and acid-free. Our printers also have full ISO 14001 environmental accreditation, which ensures that they have effective procedures in place to manage waste and practices that may affect the environment.
Published by TSO (The Stationery Office) and available from:
Online www.tsoshop.co.uk
Mail, telephone, fax and email TSO PO Box 29, Norwich NR3 1GN Telephone orders/general enquiries: 0870 600 5522 Order through the Parliamentary Hotline Lo-Call 0845 7 023474 Fax orders: 0870 600 5533 Email: [email protected] Textphone: 0870 240 3701
The Houses of Parliament Shop 12 Bridge Street, Parliament Square, London SW1A 2JX Telephone orders/general enquiries: 020 7219 3890 Fax orders: 020 7219 3866 Email: [email protected] Internet: http://www.shop.parliament.uk
TSO@Blackwell and other accredited agents
£16.00
9 780102 983760
ISBN 978-0-10-298376-0