maldives and samoa - united nations · maldives and samoa by the secretariat ... extended the...
TRANSCRIPT

CDP2015/PLEN/8
1
Monitoring of Graduated Countries from
the Category of Least Developed Countries as
a complement to the 2015 triennial review:
Maldives and Samoa
By
The Secretariat of the Committee for Development Policy
March 2015
Committee for Development Policy
UN Headquarters, New York
23 – 27 March 2015

CDP2015/PLEN/8
2
I. Background
General Assembly resolution 67/221 of 21 December 2012 requests the Committee for Development
Policy (CDP) to monitor the development progress of countries that graduated from least developed
country (LDC) category. The monitoring is to be conducted, in consultation with the Governments of
those countries, on a yearly basis for a period of three years after graduation becomes effective, and
triennially thereafter, as a complement to two triennial reviews of the category of least developed
countries. CDP has also been requested to include its findings in its annual report to the Economic and
Social Council (ECOSOC). Resolution 67/221 strengthens a similar provision contained in resolution
59/209 of 20 December 2004 which, among other things, requested CDP to monitor graduated
country’s development progress as a complement of the triennial review and with the assistance and
support of relevant organizations. General Assembly also requested, in its outcome document of third
International SIDS Conference in 2014, requested the CDP to continue to give due consideration to
the unique and particular vulnerabilities of SIDS and to continue to monitor regularly, together with
their Governments, the progress of SIDS that have graduated from LDC status.1
Guidelines on how such progress is to be monitored were first outlined in the 2008 CDP Report to the
Council.2
The procedures relating to the reporting requirements of graduated (together with
graduating) countries were further clarified in the 2013 CDP Report to the ECOSOC,3 which was
endorsed by Council resolution E/RES/2013/20 (25 October 2013). The main objective of the
monitoring provision is to identify any signs of reversal in the development progress of the graduated
country and bring them to the attention of the ECOSOC.
Annex table 1 shows scores of GNI-per capita, HAI and EVI of graduated and graduating countries
from the LDC category at the times of the 2012 and 2015 triennial reviews.
Monitoring time lines for Maldives and Samoa
Maldives graduated from the LDC category on 1 January 2011, on the basis of its high GNI per capita
and human asset index (see the table 1).4 The first CDP monitoring report was prepared as a
complement of the triennial review of the list of LDCs in 2012 and submitted to the ECOSOC in that
year, in accordance to resolution 59/209. No monitoring report was submitted in 2013, as resolution
1 A/CONF.223/3.
2 See paragraphs 34 and 35 in Committee for Development Policy, Report on the tenth session (17-20 March
2008), Economic and Social Council, Official Records, 2008, Supplement No. 13. 3 Committee for Development Policy, Report on the fifteenth session (18-22 March 2013), Economic and Social
Council, Official Records, 2013, Supplement No. 13, chapter V. 4 For history of the country’s graduation, see CDP (2012), “Monitoring of graduated countries from the category
of lease developed countries: Maldives”, a report presented at the CDP Expert Group Meeting on Review of the
List of LDCs, 16-17 January.
CDP2015/PLEN/8
3
67/221 was adopted after the CDP plenary meeting in that year. The second monitoring report
(corresponding to the last of the three “annual” reports under the resolution 67/221) was submitted to
the Committee in 2014. The present report is the third in the monitoring exercise and the first to have
been prepared as a complement to triennial review. The last report will be submitted to the CDP as a
complement to the triennial review in 2018.
In 2006, the CDP recommended to ECOSOC that Samoa be graduated from the LDC category, on the
basis of its high GNI per capita and human asset index.5 ECOSOC endorsed the recommendation in
July 2007 and, subsequently, the GA adopted the resolution on the graduation of Samoa, which was
scheduled to take place in December 2010. But, in September 2009, Samoa was hit by a devastating
tsunami. As a result, the GA adopted a resolution on 7 September 2010 (A/RES/64/295), which
extended the transition preparatory period by three years. Accordingly, Samoa graduated from the
LDC category in January 2014. The present report is the first in the monitoring exercises for Samoa as
a graduated country.
5 Committee for Development Policy, Report on the eighth session, 2006 (E/2006/33).

CDP2015/PLEN/8
4
Table 1. Maldives and Samoa: Time lines for monitoring reports
Date Maldives Samoa Relevant
resolution
January 2011 Graduated A/60/30
March 2012 Report submitted as a
complement to triennial
review
A/59/209 and
A/65/286
December 2012 Current reporting system
introduced
Current reporting system
introduced
A/67/221
adopted
December 2013 Monitoring report to CDP Monitoring report to CDP
(graduating country)
A/ 67/221
January 2014 Graduated A/ 64/295
March 2014 CDP annual monitoring
report to ECOSOC
CDP annual monitoring
report to ECOSOC
E/ 2013/20
January 2015 Monitoring report
submitted to CDP as a
complement to triennial
review (#1)
Monitoring report
submitted to CDP as a
complement to triennial
(graduated country, #1)
A/ 67/221
March 2015 CDP annual monitoring
report to ECOSOC
CDP annual monitoring
report to ECOSOC
A/ 67/221
December 2015 Monitoring report to CDP
(graduated country, #2)
A/ 67/221
March 2016 CDP annual monitoring
report to ECOSOC
A/ 67/221
December 2016 Monitoring report to CDP
(graduated country, #3)
A /67/221
March 2017 CDP annual monitoring
report to ECOSOC
A /67/221
December 2017 Monitoring report
submitted to CDP as a
complement to triennial
review (#2)
Monitoring report
submitted to CDP as a
complement to triennial
review (#1)
A /67/221
March 2018 CDP annual monitoring
report to ECOSOC
CDP annual monitoring
report to ECOSOC
A /67/221
December 2020 Monitoring report as a
complement to triennial
review (#2)
A /67/221
March 2021 CDP annual monitoring
report to ECOSOC
A /67/221
Source: Secretariat of the Committee for Development Policy.
II. Monitoring development progress of the Maldives since graduation
Recent macroeconomic developments
Economic activities of the Maldives have been relatively buoyant since 2013, largely owing to
increased tourist arrivals from Asian countries, pushing real GDP growth rates to over 8 per cent both
in 2013 and 2014 (see table 2). Lower global inflation helped the country achieve subdue domestic
inflation rate. The Government forecasts that economic growth will accelerate in 2015, due to

CDP2015/PLEN/8
5
continuing strong performance of the tourism and transport industries, supported and supplemented by
the on-going infrastructure investment.6
Despite the relatively robust economic performance and higher fiscal revenues, a sharply increased
public spending in 2014 led to only minor improvement in fiscal deficits, further worsening already
high external public debts. It stood at $789.5 million in 2014, increased by $41.6 million from the
2013 level.7 The ratio of fiscal deficit to GDP declined to 26.1 per cent because of the improved
economic performance, as mentioned before. The Government of Maldives will target reduction in
fiscal deficit in 2015 by introducing a green tax and streamlining duty structures, as well as by better
targeting public subsidies and control over public-sector employment, while preserving social safety
net. The IMF has stated that the focus on expenditure control will be crucial in 2015 to ensure that
targets are adhered to and public sector wage bill is contained. The stock of external public debts is
projected to be $796.6 million, about 23.5 per cent of GDP, at the end of 2015.
6 See Maldives Monetary Authority. Monthly Economic Review, Vol. VII, No. 12 (December 2013).
7 Maldives Monetary Authority, Monthly Statistics 2014, vol. 15, issue 12, December 2014.

CDP2015/PLEN/8
6
Table 2: Maldives: Selected socio-economic indicators, 2009-2015.
2009 2010 2011 2012 2013 2014a/ 2015b/
GDP growth rate (per cent, constant price) -5.5 7.1 12.6 3.0 8.8 8.5 10.5
Inflation rate (per cent) 4.5 6.1 11.3 10.9 4.0 .. ..
Government revenues (Millions of MVR) 5,735 6,547 9,905 10,138 11,901 14,907 21,268
Government expenditures (Millions of MVR) 10,953 10,815 12,265 13,110 13,531 16,386 22,868
Government balance (Millions of MVR) -5,129 -4,258 -2,350 -2,972 -1,766 -1,581 -1,576
Government balance as per cent of GDP -18.8 -14.3 -6.6 -7.6 -4.2 -3.4 -3.0
Gross ODA received (Millions of dollars) 51.39 120.76 55.72 69.84 33.92 .. ..
Balance of Payments (Millions of dollars)
Current Account -220.8 -19.6 -422.8 -269.6 -176.1 -290.0 -214.7
Goods, Credit (Exports) 169.0 197.5 346.4 314.4 331.0 325.5 347.2
Goods, Debit (Imports) 1,081.7 1,241.8 1,716.8 1,575.8 1,703.0 1,988.4 2,182.0
Balance on Goods -912.7 -1,044.3 -1,370.4 -1,261.4 -1,372.0 -1,663.0 -1,834.8
Services, Credit (Exports) 1,543.2 1,809.9 2,087.3 2,105.8 2,504.1 2,867.3 3,277.6
Services, Debit (Imports) -398.3 -451.4 -589.4 -575.4 -652.5 -749.9 -835.7
Balance on services 1,144.8 1,358.6 1,497.9 1,530.4 1,851.6 2,117.4 2,441.9
Balance on Goods and Services 232.2 314.2 127.5 269.0 479.6 454.4 607.1
Balance on income -272.4 -311.2 -308.4 -279.5 -369.7 -412.3 -451.6
Balance on current transfers -180.6 -199.1 -241.8 -259.1 -286.0 -332.1 -370.2
Capital Account 29.3 9.3 28.5 17.4 9.8 14.9 26.4
Financial Account 173.1 153.4 449.8 197.5 132.7 477.4 438.9
Direct investment (net) 158.0 216.5 423.5 228.0 360.8 355.0 372.6
Portfolio investment (net) 12.0 12.2 0.1 53.1 -53.3 .. ..
Other investment (net) -27.2 -50.8 26.1 -83.4 -174.8 122.4 66.3
Memorandum items:
Reserves (Millions of dollar) 261.0 350.2 334.9 304.5 368.3 444.6 460.3
Reserves (months of imports) 3.3 3.9 2.7 2.4 2.5 3.3 c/ ..
Source: CDP Secretariat, based on national and international sources.
In the external front, current account deficit is estimated to have widened in 2014, largely due to
increased merchandize trade deficit, adding to the external debt. Total exports declined slightly due to
the fall of fish exports (discussed later). The growth in imports of petroleum products contributed to
the about 17 per cent increase in imports in 2014, compared with the 2013 level. As of November
2014, the latest date for which data are available at the time of this writing, foreign reserves were
sufficient to cover 3.3 months of imports compared to 2.5 months at the end of 2013, reflecting the
increase in foreign currency transfers by commercial banks.
Developments related to indicators in the LDC criteria
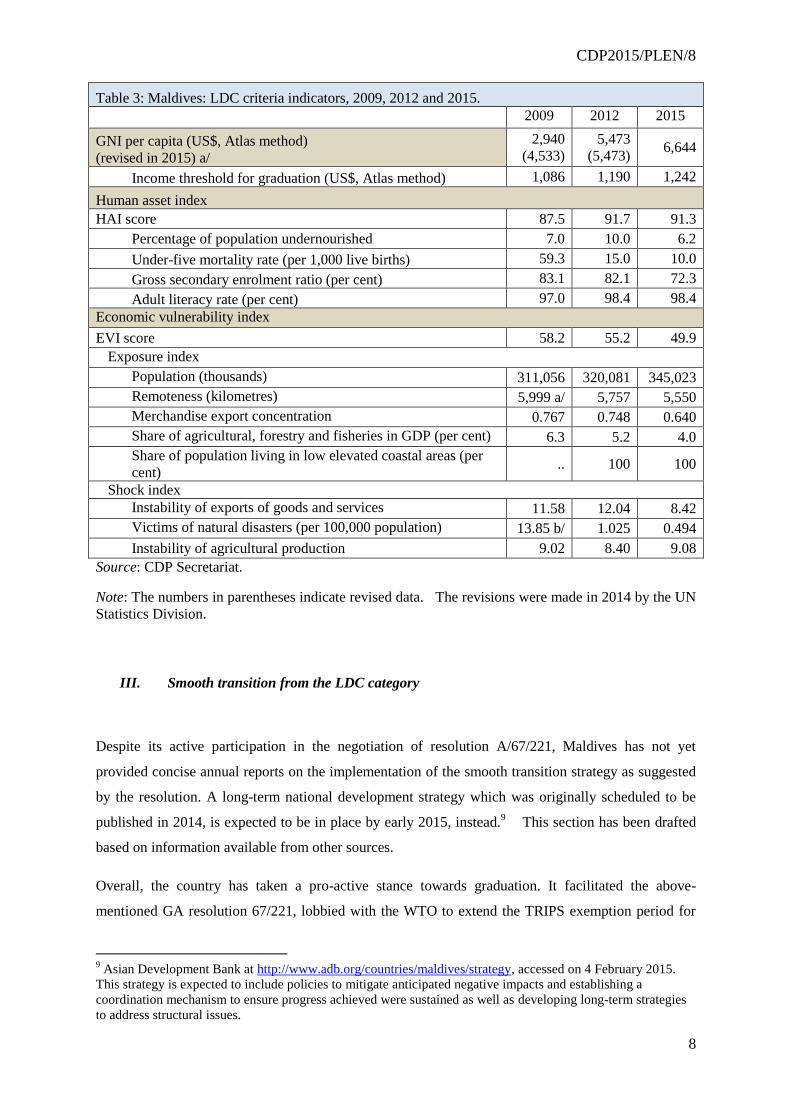
Table 3 shows time series data of GNI per capita and values of HAI and EVI, and their indicators.
The GNI per capita of the Maldives exceeded 5 times as much as the income graduation threshold in

CDP2015/PLEN/8
7
2015 ($1,242), compared with 4.6 times in 2012. Two component indicators of the HAI – percentage
of population undernourished and under-five mortality rate – continued to improve over time, while
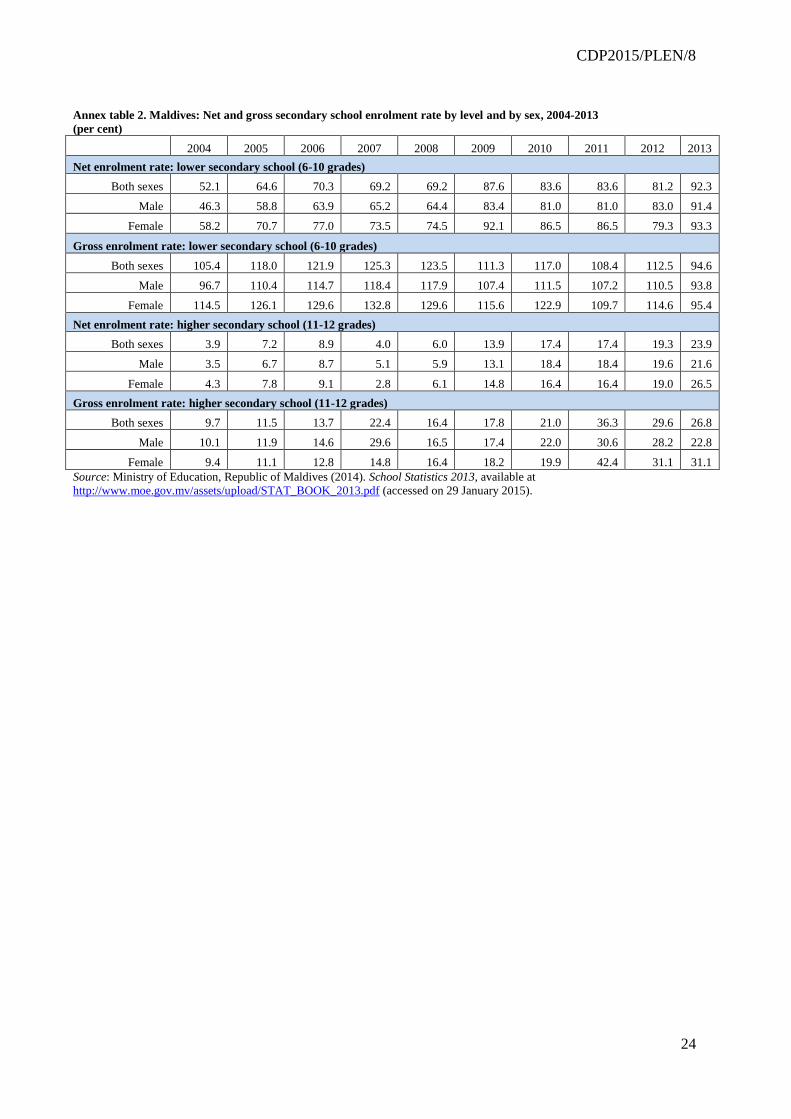
adult literacy rate stayed at a high level of 98.4 per cent. Gross secondary enrolment ratio continues to
decline, not because the national education system has deteriorated, but because the Government of
the Maldives succeeded to reduce over-aged enrolment and grade repetition. In fact, gross enrolment
ratio at lower secondary education level (grades 6 -10) significantly declined from 125.3 in 2007, the
peak year, to 94.6 in 2013, the latest for which data are available, while net enrolment ratio at the
same education level increased from 69.2 to 94.6 during the same period (see annex table 2).8 Thus,
while the HAI score of the Maldives is now slightly lower than in 2012, because of the lower gross
secondary, this is not cause for concerns. Maldives enjoys one of the highest HAI scores among
developing countries.
The country, on the other hand, continues to be vulnerable as indicated by the EVI. While the country
has reduced its vulnerability marginally to 49.9 in the present triennial review by improving all 8 EVI
indicators, the country is still well below the EVI graduation threshold of 32.
In sum, the country continues to progress in both HAI and GNI, the two criteria that made possible for
the country graduate from the LDC category. Moreover, progress on EVI is noted, though Maldives
continues to experience high economic vulnerability.
8 Ministry of Education, Maldives (2013). School Statistics 2013, available at
http://www.moe.gov.mv/assets/upload/STAT_BOOK_2013.pdf.
CDP2015/PLEN/8
8
Table 3: Maldives: LDC criteria indicators, 2009, 2012 and 2015.
2009 2012 2015
GNI per capita (US$, Atlas method)
(revised in 2015) a/
2,940
(4,533)
5,473
(5,473) 6,644
Income threshold for graduation (US$, Atlas method) 1,086 1,190 1,242
Human asset index
HAI score 87.5 91.7 91.3
Percentage of population undernourished 7.0 10.0 6.2
Under-five mortality rate (per 1,000 live births) 59.3 15.0 10.0
Gross secondary enrolment ratio (per cent) 83.1 82.1 72.3
Adult literacy rate (per cent) 97.0 98.4 98.4
Economic vulnerability index
EVI score 58.2 55.2 49.9
Exposure index
Population (thousands) 311,056 320,081 345,023
Remoteness (kilometres) 5,999 a/ 5,757 5,550
Merchandise export concentration 0.767 0.748 0.640
Share of agricultural, forestry and fisheries in GDP (per cent) 6.3 5.2 4.0
Share of population living in low elevated coastal areas (per
cent) .. 100 100
Shock index
Instability of exports of goods and services 11.58 12.04 8.42
Victims of natural disasters (per 100,000 population) 13.85 b/ 1.025 0.494
Instability of agricultural production 9.02 8.40 9.08
Source: CDP Secretariat.
Note: The numbers in parentheses indicate revised data. The revisions were made in 2014 by the UN
Statistics Division.
III. Smooth transition from the LDC category
Despite its active participation in the negotiation of resolution A/67/221, Maldives has not yet
provided concise annual reports on the implementation of the smooth transition strategy as suggested
by the resolution. A long-term national development strategy which was originally scheduled to be
published in 2014, is expected to be in place by early 2015, instead.9 This section has been drafted
based on information available from other sources.
Overall, the country has taken a pro-active stance towards graduation. It facilitated the above-
mentioned GA resolution 67/221, lobbied with the WTO to extend the TRIPS exemption period for
9 Asian Development Bank at http://www.adb.org/countries/maldives/strategy, accessed on 4 February 2015.
This strategy is expected to include policies to mitigate anticipated negative impacts and establishing a
coordination mechanism to ensure progress achieved were sustained as well as developing long-term strategies
to address structural issues.

CDP2015/PLEN/8
9
all LDCs and, after graduation, applied to join the EU’s GSP (discussed below). Maldives has been
continually exploiting the viability of the category of “small and vulnerable economies” at the United
Nations, which, the country believes, will acknowledge the special but common needs of countries
based on their small-scale economies and inherent geographical realities.
Yet, according to the Ambassador of the Maldives to the UN, their efforts have not born any fruits.
Accordingly, “the Maldives decided to take our development path into our own hands” by
“consistently employing good policies”.10
IV. New developments in the implementation of the special measures extended to Maldives
There have been three notable developments in the area of international support measures extended to
Maldives as a former least developed county. As these events have been recorded in 2014 and early
2015, it is too soon to measure the exact extent of their impacts on future course of the country’s
development. But their impact needs to be examined at the time of the final monitoring report on the
Maldives at the 2018 triennial review.
Maldives has been concerned about: (i) loss of preferential market access made possible by LDC
specific special and differential treatment provisions under WTO/GATT; (ii) loss of other preferential
treatment in WTO legal texts; (iii) possible decline in official development assistance, including
development financing and technical corporation; and (iv) loss of other forms of special support
measures given to LDCs, such as support for travel expenses to participate in international meetings
(including the UN General Assembly).
In these four areas, the present report has identified three noticeable developments:
(1) The travel-related benefits to participate in international conferences extended to Maldives
terminated at the end of 2014. The UN Assembly adopted resolution 65/286, extending travel-
related benefits for a period of at most 3 years, which Maldives was instrumental in facilitating
the phasing out of the travel benefits offered by the UN.
(2) ODA flows to Maldives declined significantly in 2013 to $33.9 million, less than 50 per cent of
the 2012 level (see table 2). Part of the decline was due to the completion of major infrastructure
projects, as such port and sewage systems, supported by the EU and Japan. Moreover, with its
reclassification to upper-middle-income country by the World Bank, “concessional aid has dried
up significantly.”11
In fact, the major source for the decline in 2013 came from the Asian
10
Sareer, op.cit. 11
Asian Development Bank (2014). “Asian Development Bank & Maldives: Fact Sheet” (April), available at
http://www.adb.org/sites/default/files/publication/27779/mld_1.pdf (accessed on 5 February 2015),

CDP2015/PLEN/8
10
Development Bank (ADB) that uses the World Bank income criteria when deciding allocations
of concessional lending. As a result, net flows from ADB Special Funds (with the Asian
Development Fund being the largest) turned to a negative $1 million in 2013 from (positive)
$17.0 million in 2012.
Despite the reduction in total ODA inflows in 2013, the Government estimated to have received
larger inflows of grants in 2014, a trend that it anticipates to continue in 2015. Inflows of grants
declined to MVR118 million in 2013 (about $7.7 million) from MVR 367 million in 2012 (about
$24 million). The Government estimates grant flows to have reached MVR415 million MVR in
2014 and expects to receive MVR1, 473 million in 2015. In general, grants inflows to the
Maldives have fluctuated in tandem with total ODA flows. If the trend continues, this may imply
that ODA flows regained momentum in 2014 and may continue to do so in 2015. Nonetheless,
CDP is advised to continue to monitor trends in ODA flows to the country.
(3) The Maldives ceased to benefit from the GSP preferences extended by the European Union at the
beginning of 2015, and is now facing average tariff rates between 4.4 and 11 per cent on its tuna
exports to the Union. As reported last year, when the country graduated in January 2011, the EU
granted an extension of 3 years duty-free, quota-free access to the EU area under the Everything-
But-Arms (EBA) Initiative until the beginning of 2014. During the course of 2014, the country
still enjoyed the standard GSP preference, with average duties on its tuna exports between 0 to
9.25 per cent. But Regulation (EU) No.1421/2013 (30 October 2013) established that, since
Maldives had been classified as an upper-middle income country for 3 consecutive years by the
World Bank, it ceased to benefit from the GSP preferences altogether at the beginning of 2014.
Japan already applied MFN tariff rate of 3.5 per cent to its tuna imports from Maldives starting
in July 2011, immediately after the country’s graduation.
The tuna industry is one of the largest employers of the county, and there have been concerns
that the industry could collapse due to the loss of preferential access, particularly to the EU
market,12
one of the major destinations of the country’s tuna exports, in particular canned and
processed tuna (but not frozen tuna).13
If higher tariffs imposed by the EU severely affected
exports of tuna-related products, one should expect a significant decline of total volume or
values of processed and canned tuna exports to the EU. Unfortunately, commodity-trade data is
not yet available for 2014; one needs to infer the impact by examining “indirect” evidence. Table
12
See, for example, Permanent Mission of the Republic of Maldives to the United Nations (2000),
“Memorandum containing observations and comments of the Government of the Republic of Maldives on the
recommendation by the Committee for Development policy to graduate the Maldives from the list of LDCs”
(July), para. 15. 13
Thailand and Sri Lanka are the two major exporters of frozen tuna from Maldives.

CDP2015/PLEN/8
11
4 shows exports of tuna-related products (in metric tons) and the direction of exports of all goods
(in millions of dollars) in the first 11 months in 2014.14
Total exports of fresh, chilled or frozen tuna in the first 11 months of 2014 declined by 7.1 per
cent from the level recorded in the corresponding period in 2013. Meanwhile, exports of canned
and processed tuna increased by 14.2 and 57.4 per cent, respectively, during the same period. If
the rise was due to increased exports of tuna to regions other than Europe, the direction in trade
in all goods should show a major shift in export direction away from Europe, s historically,
processed or canned tuna have comprised a significant share of European imports from Maldives.
Direction of exports of all goods in table 4 shows otherwise; it does not exhibit any major shifts
of direction of exports away from Europe. Conversely, it shows increased share of Europe in
total export value in the first 11 months in 2014. One can thus argue that, as of November 2014,
the higher tariffs applied by the EU on tuna products from Maldives have not had a major impact
on the country’s tuna industry.
Table 4. Maldives: Volume of fish exports and direction of total merchandise exports, 2008-
November 2014.
Year 2008 2009 2010 2011 2012 2013
Memo
item
2013
a/
2014
a/
Fish exports (metric tons)
Total 65124 39776 33451 38195 40601 49590 47784 44413
Fresh, chilled or frozen tuna 56266 30657 25195 31906 35417 44656 43310 38249
Canned or pouched 1940 1843 1355 1463 2062 2354 2111 2410
Processed fish, nes. 6572 6796 6328 4058 2204 1907 1787 2812
Direction of total exports
(millions of dollars)
Total 125.9 76.4 73.9 127.4 161.6 166.5 157.2 131.7
Of which; Asia 85.2 41.0 56.8 67.3 81.3 94.6 91.6 66.4
Europe 39.1 32.8 26.2 56.6 73.4 63.2 58.0 53.2
Source: Maldives Monetary Authority, Monthly Statistics 2015, vol. 16, issue 1, January 2015
Note: a/ January to November.
14
Production of tuna in values and direction of exports in volume are not available for 2014.

CDP2015/PLEN/8
12
V. Conclusions (Maldives)
The present monitoring report did not find any sign of significant reversal in socio-economic
development of Maldives since graduation in January 2011. If anything different, the country seems
to have accelerated its economic growth and widen the gap between its per-capita GNI and the
income graduation threshold. The country will, however, continue to face the twin deficits in fiscal
and current accounts.15
Because of chronic fiscal deficits, the domestic debt of the Government
remains high.
Fiscal consolidation, particularly expenditure control, should be implemented while the economy
enjoys robust growth, making any fiscal adjustment less painful for those affected. The HAI score
worsened marginally because of the decline in gross secondary enrolment ratio. But this is a result
from the fact that the Government succeeded to reduce over-aged enrolment and grade repetition and,
thus, the lower HAI score is not a cause for concerns. The country also managed to lower the EVI
score, but is still above the graduation threshold of 32 due the small population size, production and
exports structures and a high portion of low lying areas in the country.
The loss of the EBA status at the end of 2013 did not lead to the collapse of the tune industry in 2014.
The Committee, however, needs to monitor carefully how the complete loss of trade preferences
extended by the EU to Maldives at the beginning of 2015 affects the fish industry over the course of
2015 and beyond. Perhaps the major concern is about the drying up of access to concessional loans.
When borrowing in the capital market at non-concessional terms, the Government is required to pay
higher interested rates with stricter terms of conditions (e.g., lack of a grace period and shorter
maturity). The Government is further required to manage prudently fiscal balance and public debts.
Though there have been no natural calamity reported, a level of EVI is likely to continue to be high
due to the export structure of the country, a high portion of low lying areas in country’s total land,
and the small population size.. Besides tackling its structural vulnerabilities, the country needs to
address challenges related to the sustainability of the fiscal balance and to control current account
deficits. At the fiscal front, higher level of GST and business profits taxes contributed to the
narrowing of the deficits, but the Government needs to continue its efforts to control current
expenditure. To reduce current account deficits, the international community needs to strengthen its
assistance to the country in the areas of industrial diversification, as feasible, and in strengthening the
trade capacity of the country.
15
Asian Development Bank (2014). Maldives: Economic Analysis (Summary): Asian Development Bank
Outlook.
CDP2015/PLEN/8
13
VI. Monitoring development progress of Samoa
Recent macroeconomic developments
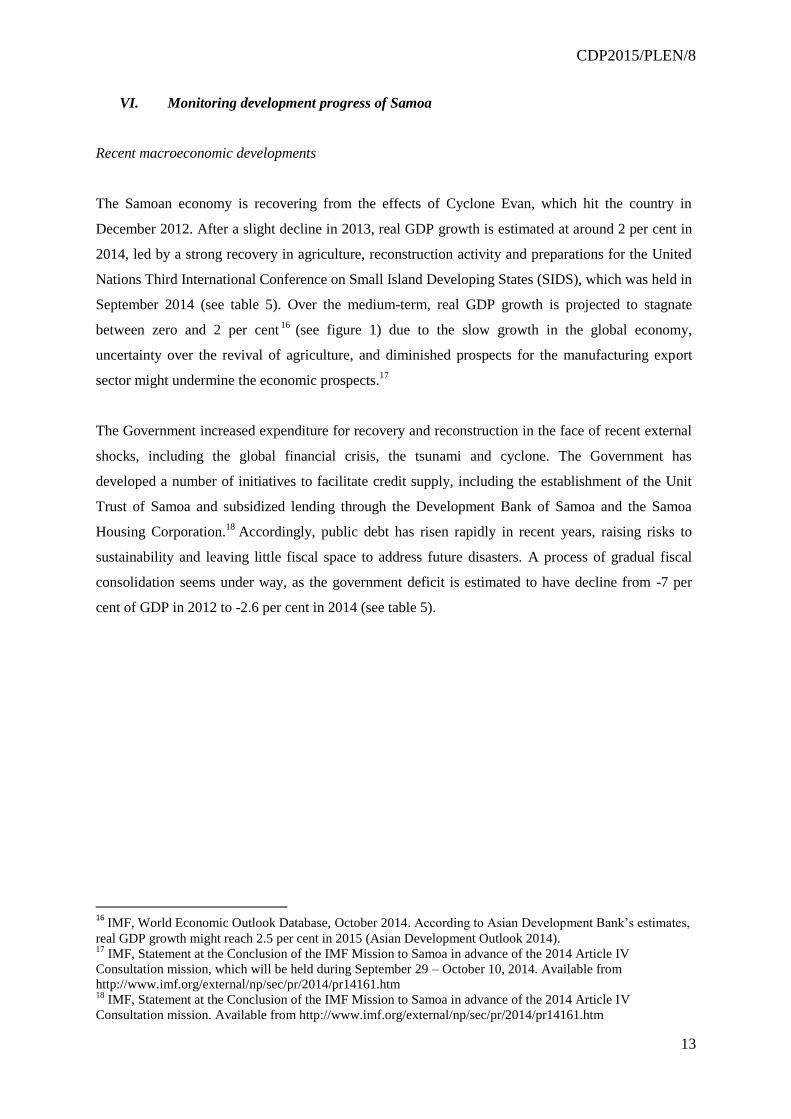
The Samoan economy is recovering from the effects of Cyclone Evan, which hit the country in
December 2012. After a slight decline in 2013, real GDP growth is estimated at around 2 per cent in
2014, led by a strong recovery in agriculture, reconstruction activity and preparations for the United
Nations Third International Conference on Small Island Developing States (SIDS), which was held in
September 2014 (see table 5). Over the medium-term, real GDP growth is projected to stagnate
between zero and 2 per cent16
(see figure 1) due to the slow growth in the global economy,
uncertainty over the revival of agriculture, and diminished prospects for the manufacturing export
sector might undermine the economic prospects.17
The Government increased expenditure for recovery and reconstruction in the face of recent external
shocks, including the global financial crisis, the tsunami and cyclone. The Government has
developed a number of initiatives to facilitate credit supply, including the establishment of the Unit
Trust of Samoa and subsidized lending through the Development Bank of Samoa and the Samoa
Housing Corporation.18
Accordingly, public debt has risen rapidly in recent years, raising risks to
sustainability and leaving little fiscal space to address future disasters. A process of gradual fiscal
consolidation seems under way, as the government deficit is estimated to have decline from -7 per
cent of GDP in 2012 to -2.6 per cent in 2014 (see table 5).
16
IMF, World Economic Outlook Database, October 2014. According to Asian Development Bank’s estimates,
real GDP growth might reach 2.5 per cent in 2015 (Asian Development Outlook 2014). 17
IMF, Statement at the Conclusion of the IMF Mission to Samoa in advance of the 2014 Article IV
Consultation mission, which will be held during September 29 – October 10, 2014. Available from
http://www.imf.org/external/np/sec/pr/2014/pr14161.htm 18
IMF, Statement at the Conclusion of the IMF Mission to Samoa in advance of the 2014 Article IV
Consultation mission. Available from http://www.imf.org/external/np/sec/pr/2014/pr14161.htm
CDP2015/PLEN/8
14
Table 5. Samoa: selected socio-economic indicators, 2009-2014
2009 2010 2011 2012 2013 2014
GDP growth rate (per cent, constant price in local
currency) -6.4 -1.7 5.2 1.5 -1.1 2.0
Inflation rate (per cent) 14.6 -0.2 2.9 6.2 -0.2 -1.2
Government revenue (in local currency, millions) 492 552 543 533 608 714
Government expenditure (in local currency,
millions) 553 646 636 665 681 762
Government balance (in local currency, millions) -61 -94 -93 -132 -73 -48
Government balance as per cent of GDP -3.6 -5.8 -5.3 -7.2 -4.0 -2.6
Gross ODA received (Millions of dollars) 46.5 89.4 61.4 86.0 67.3 ..
Balance of Payments (Millions of dollars)
Current Account -12.7 -43.4 -65.9 -30.8 -46.1 ..
Goods, Credit (Exports) 11.6 23.1 24.7 31.2 23.9 ..
Goods, Debit (Imports) 207.9 280.0 318.7 308.4 325.4 ..
Balance on Goods -196.3 -256.9 -294.0 -277.3 -301.4 ..
Services, Credit (Exports) 162.1 180.5 187.1 211.0 201.2 ..
Services, Debit (Imports) 79.6 81.7 78.1 100.9 89.3 ..
Balance on services 82.5 98.8 109.0 110.1 111.9 ..
Balance on Goods and Services -113.8 -158.1 -185.0 -167.2 -189.5 ..
Balance on income -24.6 -17.9 -31.6 -36.1 -30.4 ..
Balance on current transfers 125.7 132.6 150.8 172.5 173.9 ..
Capital Account 48.3 82.4 72.7 58.4 37.4 ..
Financial Account 35.9 24.5 -20.3 33.6 8.5 ..
Direct investment (net) -8.9 -1.0 -14.6 -12.2 -24.1 ..
Portfolio investment (net) 1.6 1.7 0.4 9.9 1.7 ..
Other investment (net) .. .. .. .. .. ..
Memorandum item:
Reserves (Millions of dollar) 165.8 209.4 166.8 168.7 170.9 ..
Reserves (months of imports) 6.2 6.5 4.6 4.4 .. ..
Source: World Bank, World Development Indicators; IMF, World Economic Outlook 2015; OECD,
OECDStat, accessed 2 February 2015

CDP2015/PLEN/8
15
Figure 1. Samoa: annual growth rate of real GDP, 2009-2019 (per cent)
Source: IMF, World Economic Outlook Database, October 2014, accessed 2 February 2015. Data
from 2013 are estimates.
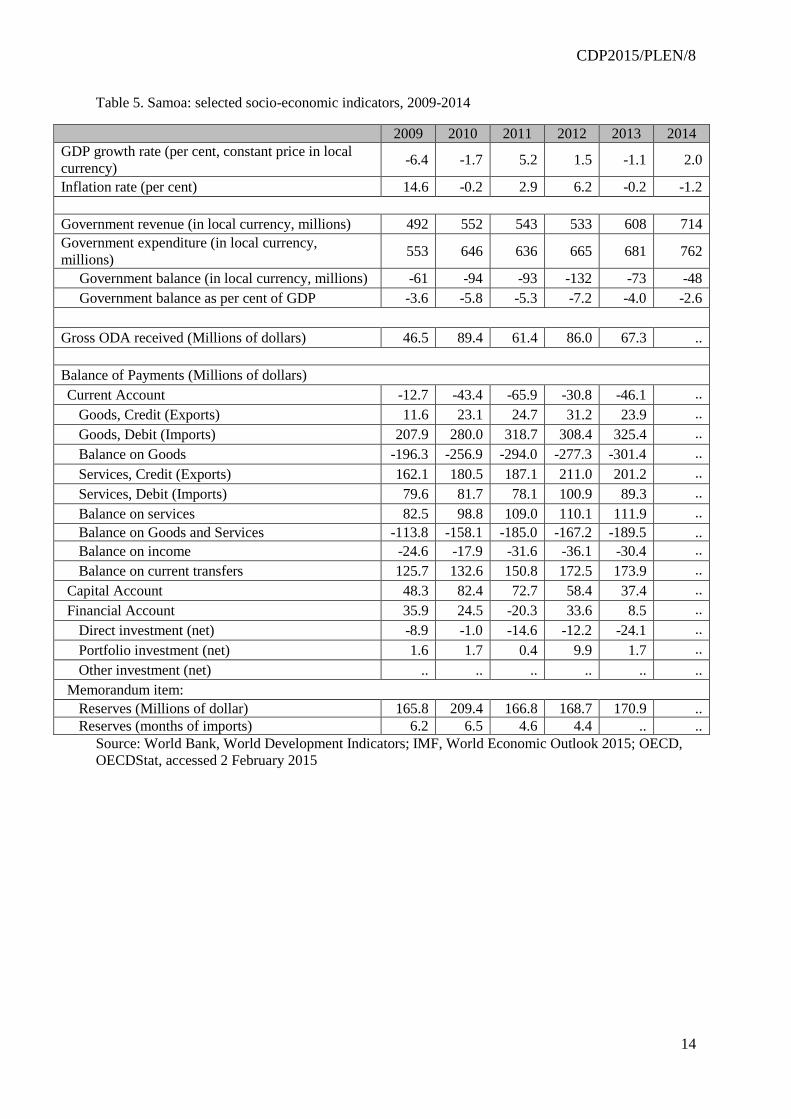
As presented in table 5, Samoa’s balance of payment is characterized by a large deficit in the balance
of goods and a significant surplus in the balance of services, as well as a substantial transfer inflow.
Current account deficit is projected to widen to 16.2 per cent of GDP in 2014, before falling to 15.6
per cent in 2015.19
Expanding remittances and tourism earnings have been key to the economy.
Remittances increased significantly by 13 per cent or more annually in 2011 and 2012 to support
recipients to recover from the damages inflicted by the cyclone (see table 6). Visitor arrivals reached a
pre-cyclone level in 2014, helped by reconstruction of some tourism facilities after the cyclone, rising
incomes in Australia and New Zealand (two major countries of origin of tourists), and the weak
currency.20
Table 6. Samoa: selected indicators on tourism, 2009-2013.
2009 2010 2011 2012 2013 2014
Remittances (annual rate of growth) 9.6 2.2 14.0 13.4 0.2 ..
Tourism earnings (annual rate of
growth) 2.7 7.8 8.9 9.6 ..
..
Visitor arrivals (thousands) 129 130 128 135 125 131
Source: World Bank, World Development Indicators, accessed 2 February 2015; Samoa Bureau
of Statistics, International Arrival Statistics, December 2014
19
Asian Development Bank, Asian Development Outlook 2014. 20
Economic Intelligence Unit, Samoa: Country report, February 2015
-8
-6
-4
-2
0
2
4
6
2009 2010 2011 2012 2013 2014 2015 2016 2017 2018 2019

CDP2015/PLEN/8
16
Developments related to indicators in the LDC criteria
Samoa achieved substantial income growth over the period of last three triennial reviews (see table 7).
Preliminary estimates suggest that GNI per capita of Samoa in the 2015 review is $3,319, almost three
times higher than the graduation threshold established at the 2015 triennial review ($1,242).21
The
income data in table 7 are not comparable because the data source changed from World Bank to
United Nations in the 2015 review. Using only the United Nations data, the GNI per capita increased
steadily from $1,953 in 2004 to $3,503 in 2013, by 6.8 per cent annually, on average (see figure 2).
As mentioned above, over the medium-term, real GDP growth is forecast to be slow but positive,
suggesting that the income is likely to be sustained at the current level.
Figure 2. Samoa: GNI per capita, Atlas Method (Current US$), 2004-2013
Source: United Nations Statistics Division.
Additionally, preliminary estimates by UN/DESA for the 2015 triennial review suggest that Samoa
continued to maintain high levels of human capital as measured by the HAI. In principle, HAI
indicators in table 7 are not comparable across years, because there are some changes in data sources
and treatment of raw data used for the 2015 review. When the data sources and methodology are kept
consistent, using the same approaches adopted for the 2015 review, the HAI scores of Samoa
continued to remain high at 93.7, 94.8 and 94.4 in the triennial reviews in 2009, 2012 and 2015,
respectively.
21
Committee for Development Policy Secretariat. The graduation threshold in 2015 triennial review was
established based on 2011-2013 data.
0
500
1000
1500
2000
2500
3000
3500
4000
2004 2005 2006 2007 2008 2009 2010 2011 2012 2013
CDP2015/PLEN/8
17
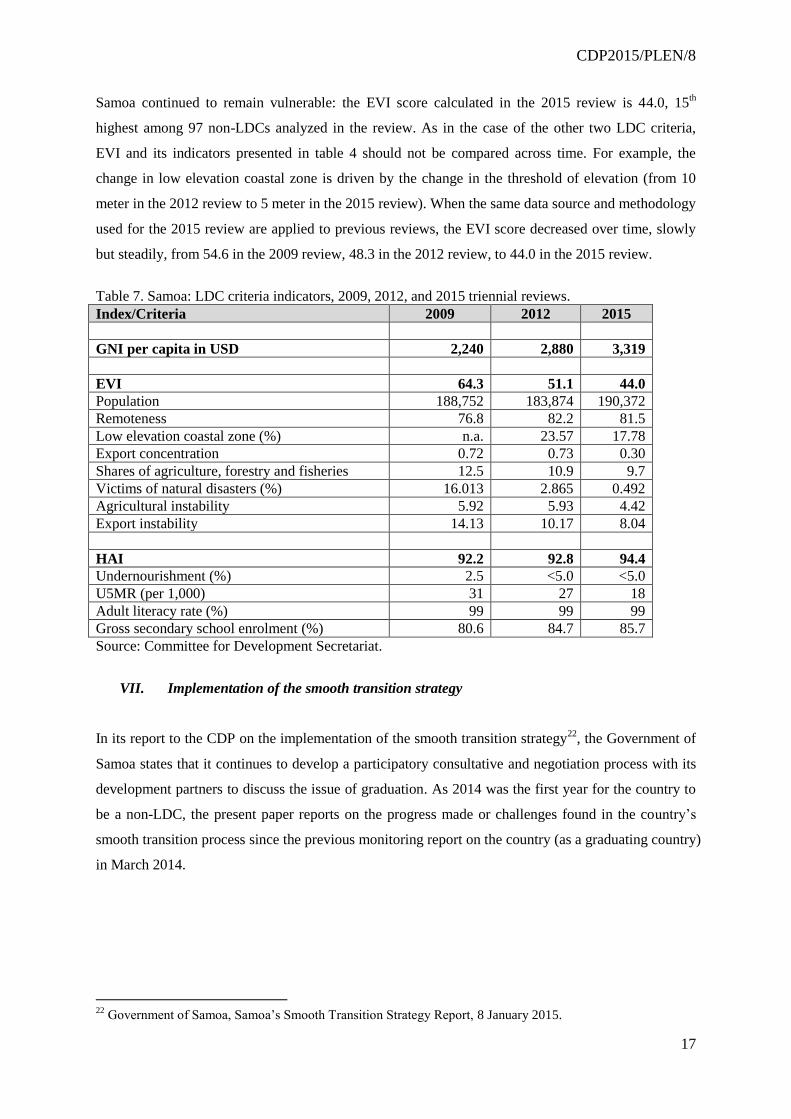
Samoa continued to remain vulnerable: the EVI score calculated in the 2015 review is 44.0, 15th
highest among 97 non-LDCs analyzed in the review. As in the case of the other two LDC criteria,
EVI and its indicators presented in table 4 should not be compared across time. For example, the
change in low elevation coastal zone is driven by the change in the threshold of elevation (from 10
meter in the 2012 review to 5 meter in the 2015 review). When the same data source and methodology
used for the 2015 review are applied to previous reviews, the EVI score decreased over time, slowly
but steadily, from 54.6 in the 2009 review, 48.3 in the 2012 review, to 44.0 in the 2015 review.
Table 7. Samoa: LDC criteria indicators, 2009, 2012, and 2015 triennial reviews.
Index/Criteria 2009 2012 2015
GNI per capita in USD 2,240 2,880 3,319
EVI 64.3 51.1 44.0
Population 188,752 183,874 190,372
Remoteness 76.8 82.2 81.5
Low elevation coastal zone (%) n.a. 23.57 17.78
Export concentration 0.72 0.73 0.30
Shares of agriculture, forestry and fisheries 12.5 10.9 9.7
Victims of natural disasters (%) 16.013 2.865 0.492
Agricultural instability 5.92 5.93 4.42
Export instability 14.13 10.17 8.04
HAI 92.2 92.8 94.4
Undernourishment (%) 2.5 <5.0 <5.0
U5MR (per 1,000) 31 27 18
Adult literacy rate (%) 99 99 99
Gross secondary school enrolment (%) 80.6 84.7 85.7
Source: Committee for Development Secretariat.
VII. Implementation of the smooth transition strategy
In its report to the CDP on the implementation of the smooth transition strategy22
, the Government of
Samoa states that it continues to develop a participatory consultative and negotiation process with its
development partners to discuss the issue of graduation. As 2014 was the first year for the country to
be a non-LDC, the present paper reports on the progress made or challenges found in the country’s
smooth transition process since the previous monitoring report on the country (as a graduating country)
in March 2014.
22
Government of Samoa, Samoa’s Smooth Transition Strategy Report, 8 January 2015.

CDP2015/PLEN/8
18
(i) Smooth transition and the National Development Strategy
Samoa’s smooth transition strategy has been an integral part of its national development strategy, the
Strategy for the Development of Samoa (SDS) which provides an overarching framework in planning
and implementing policies to sustain economic growth and human capital development. A mid-term
review for the SDS has been started to be implemented in 2014 in 14 different sectors. Investments
have been focused on infrastructural development, in particular transportation, and securing cost
effective renewable energy options by 2017. With focus on the tourism and agriculture/fisheries
sectors, extensive programs to revitalize agricultural and fisheries exports were launched in 2014.
Market opportunities for primary produce are explored, by making improvement in compliance to
product requirements in importing countries. An agribusiness facility was also launched in 2014 to
provide support for commercial agriculture as well as subsistence farmers.
In November 2014, Samoa became a signatory of the Tokelau Arrangement, along with Australia,
New Zealand, Niue, the Cook Islands, Tokelau, Tonga, Tuvalu, and Vanuatu, which aims to set catch
limits and develop sustainable commercial fisheries for tuna species in the exclusive economic zones
of Pacific nations.23
Most of Samoa's tuna catch is exported and a large proportion of households rely
on fisheries income to some degree. Under the Tuna Management and Development Plan 2011-15,
the Government is attempting to boost exports by encouraging private-sector development and joint
ventures with foreign firms in the fishing sector, looking to add value by promoting local processing.
The Government also plans to improve the local regulatory regime to encourage sustainable tuna
exports to the EU.24
In the long run, however, promoting fisheries sector heavily depends on the
sustainability of fish stocks.
(ii) Trade related measures
The Government continues to engage in consultation with the private sector on the compliance
obligations following WTO accession in 2012. The Diagnostic Trade Integration Study conducted in
2010 pointed out that there might be significant adjustment costs in agriculture, food-processing, and
manufacturing sectors, related to issue of intellectual property rights, sanitary and phytosanitary
systems, subsidies and countervailing measures, and technical barriers to trade.25
It is still not feasible
to measure those impacts in the present report due to the lack of necessary data.
23
The Pacific Islands Forum Fisheries Agency, Explanatory note on the Tokelau Arrangement, 2014. Available
from https://www.ffa.int/system/files/WCPFC11-2014-
DP05b%20Tokelau%20Arrangement%20Explanatory_Note.pdf 24
Economic Intelligence Unit, Samoa: Country report, February 2015 25
Government of Samoa, Diagnostic Trade Integration Study, 2010.

CDP2015/PLEN/8
19
The Government has successfully negotiated with some of its export trading partners on the
continuation of DFQF schemes beyond graduation. China has agreed to extend zero tariff treatment
on noni juice and other agro-processing products until 2017. Discussions are still ongoing with the
Government of Japan on a similar arrangement for noni juice, fish exports and organic products such
as honey, vanilla and cocoa.
Samoa continues to receive preferential market access to Australia under the Australian system of
Tariff Preferences as well as the South Pacific Regional Trade and Economic Co-operation
Agreement (SPARTECA). For New Zealand, Samoa retains preferential market access under
SPARTECA and WTO arrangements. Negotiation is ongoing on the free trade agreements in the
region such as The Pacific Island Countries Trade Agreement (PICTA), Pacific Agreement on Closer
Economic Relations (PACER), and PACER plus. Most recent meeting on PACER plus was held in
May 2014, and negotiations on PACER plus may be concluded in 2015, while further delays are
possible.26
As the country graduated in January 2014, it is too early to measure the exact extent of the impacts of
graduation on trade, because necessary data are not yet available. Just to highlight the most recent
trend in export (see table 8), preliminary estimates of values and share of main exports, reported by
the Samoa authority, are presented in table 5. Since the data is available only up to July 2014, we
compare the export value of the first half of 2013 (from January to July), and the first half of 2014.
The value of exports (and the share to the total exports) decreased significantly for fresh fish, while
noni juice and taro exports expanded between those two periods. While it is difficult to determine
which factors are driving these changes in the export, the changes are not likely to have been caused
by a loss of preferential market access in some countries, such as Japan, after graduation, because
more than 95 per cent of fish export was destined to Australia and New Zealand in 2013. Both
countries, as discussed above, provide the country with preferential market access under SPARTECA
after the country’s graduation.
26
Government of Australia, Department of Foreign Affairs and Trade, Pacific Agreement on Closer Economic
Relations (PACER) Plus, : 2014 Forum Trade Ministers' meeting outcomes. Available from
http://dfat.gov.au/trade/agreements/pacer/Pages/pacific-agreement-on-closer-economic-relations-pacer-
plus.aspx

CDP2015/PLEN/8
20
Table 8. Samoa: Export by product, value and share, Jan-July 2013, and Jan-July 2014
Products Export value (thousand USD) Share (per cent of the total
export)
Jan-July 2013 Jan-July 2014 Jan-July 2013 Jan-July 2014
Fresh Fish 9022 5154 47.9 30.5
Noni Juice 2307 3919 12.2 23.2
Beer 3233 2993 17.2 17.7
Coconut oil 2325 2369 12.3 14.0
Taro 950 1461 5.0 8.6
Coconut 211 402 1.1 2.4
Spring water 407 351 2.2 2.1
Copra meal 382 269 2.0 1.6
Total 18837 16918 100 100
Source: Central Bank of Samoa, Foreign Trade Report, July 2014.
(iii) Financing for Development including ODA
In 2011, the majority of Samoa’s development partners agreed to working with the Government on a
Joint Policy matrix (JPM) which would be the basis for delivery of performance linked aid. Year 2014
was the third year of the JPM and the assistance provided has helped meet Samoa’s budgetary
deficits. The Government of Samoa reported that most of the financial support by multilateral
financial institutions has been delivered in the form of grants in 2014. It is likely, though, further
assistance in the future will be composed of grant and loan, due to the improved economic
performance of the country.
There seems no significant impact of Samoa’s graduation on aid programmes of major donors in 2014.
Australia is Samoa’s leading aid donor, accounting for 30 per cent of net ODA disbursement to
Samoa in 2013, followed by New Zealand (19 per cent), Japan (6 per cent), and the EU (3 per cent).27
Australia’s total official development assistance to Samoa was $38.3 million in 2013-2014, including
$23.1 million in bilateral aid and $15.2 million delivered through regional programs.28
Australia’s
2014/15 aid budget for Samoa is estimated to remain at a similar level, $37.6 million.
New Zealand’s aid allocation to Samoa has not changed much: the total allocation was $12 million in
2014, slight down from $13 million in 2013, and in 2012.29
27
OECD, Aid at a glance: Samoa. Available from http://www.oecd.org/dac/stats/documentupload/WSM.JPG 28
Government of Australia, Department of Foreign Affairs and Trade, Overview of Australia's aid program to
Samoa. Available from http://www.dfat.gov.au/geo/samoa/development-assistance/Pages/development-
assistance-in-samoa.aspx 29
Government of New Zealand, Ministry of Foreign Affairs and Trade, Indicative programme allocations
2012/13 - 2014/15. Available from http://www.aid.govt.nz/about-aid-programme/aid-statistics/aid-allocations-
201213-201415

CDP2015/PLEN/8
21
EU continues to support Samoa after its graduation, with an indicative amount of €20 million
provided under the 11th European Development Fund, with focus on the water and sanitation sector,
within the framework of the National Indicative Programme signed on 2 September 2014 in Samoa.30
Japan’s aid strategy for Samoa has not been updated, but its multi-year rolling plan does not seem to
be affected by Samoa’s graduation.31
Countries in the Pacific region, including Samoa, receive assistance and attention increasingly from
the emerging donors. India and China both held Pacific summits in November 2014 in Fiji and
commitments were made for additional grants injections and increased concessional financing as well
as strategic technical assistance. In fact, the Exim Bank of China holds 36 per cent of Samoa’s
external debt portfolio, and the debt to China increased further with loans for the national medical
center and national broadband projects. Chinese assistance to the region has increasingly moved from
grants and interest-free loans toward loans with concessional interest rates.32
Large loans borrowed from multilateral and bilateral donors have led to a substantial rise in public
debt in recent years.33
For example, World Bank approved in 2014 a contribution of $25 million to a
project to upgrade airport infrastructure and improve aviation safety.34
Such loans, together with
increasing budget deficits, the reduction in grant aid and the slow economic growth, are likely to raise
external debt further from about 54 % of GDP in 2014 according to Samoa Bureau of Statistics.35
Because of Samoa’s classification as a country being at high risk of debt distress by the IMF36
, the
Government has continued with ongoing reforms including the implementation of Medium Term debt
strategy and a Debt reform plan over the next 8 years. The IMF informed the Government of Samoa
30
Samoa-EU, National Indicative Programme for the period 2014-2020. Available from
http://eeas.europa.eu/development-cooperation/docs/national-indicative-programme_2014-2020/2014-
2020_national-indicative-programme_samoa_en.pdf 31
Government of Japan, Ministry of Foreign Affairs, Japan's ODA: Rolling Plan for the Independent State of
Samoa, April 2013. Available from http://www.nz.emb-
japan.go.jp/samoa/resources/Samoa.RollingPlan.April2013.pdf 32
Economic Intelligence Unit, Samoa: Country report, February 2015 33
IMF, Statement at the Conclusion of the IMF Mission to Samoa in advance of the 2014 Article IV
Consultation mission. Available from http://www.imf.org/external/np/sec/pr/2014/pr14161.htm 34
World Bank, Samoa - Samoa Aviation Investment Project, May 2014. Detailed information is available from
http://www.worldbank.org/projects/P143408/samoa-aviation-investment-project?lang=en 35
External debt amounted to $984.8 million at the end of September 2014. Samoa Bureau of Statistics,
Government Finance Statistics, September 2014. Available from
http://www.sbs.gov.ws/index.php?option=com_advlisting&view=download&fileId=1427&Itemid=164 36
IMF, Samoa: Request For Disbursement under the Rapid Credit Facility—Debt Sustainability Analysis, May
2013. Available from https://www.imf.org/external/pubs/ft/dsa/pdf/2013/dsacr13162.pdf

CDP2015/PLEN/8
22
that the country may progress to a medium debt distress status following a change in the methodology
adopted for debt sustainability analysis.37
VIII. Conclusions (Samoa)
During the monitoring period, no signs of an additional significant deterioration in Samoa’s
development progress have been observed. Recovery from the adverse impacts caused by Cyclone
Evan is near completion. While the Government is having difficulties in balancing between increasing
public investments for income growth and reducing fiscal deficit, Samoa has managed to maintain
high levels of human capital and national income.
However, Samoa will continue to be highly vulnerable to external shocks due to the export structure
of the country, a high portion of low lying areas, and its small population size. While the Government
of Samoa has been implementing policies to promote the agriculture and fisheries sectors to diversify
its economic structure, the sustainable development of these sectors is threatened by natural disasters
and declining fish stocks.
Implementation of smooth transition strategy seems well under way. Samoa has been able to negotiate
continued support from China on extending DFQF scheme, while discussion is still ongoing with
Japan. It is too early to identify causes of recent export fluctuations in 2014, but such changes are
unlikely to have been caused by the loss of preferential market access following the country’s
graduation from LDC category.
Samoa managed to secure most of the aid flows in grant form in 2014, but the increasing loans from
multilateral financial institutions and emerging bilateral donors raised concerns on the level of
country’s external debt. In this regard, international community should pay particular attention to the
possible debt problems of Samoa, in order to support the country’s smooth transition, as emphasized
in the outcome document of third international SIDS Conference. 38
37
Government of Samoa, Samoa’s Smooth Transition Strategy Report, 8 January 2015. 38
Member States of General Assembly reaffirm the need for the smooth transition of SIDS that have recently
graduated, and emphasize that a successful transition needs to be based on the national smooth transition
strategy elaborated as a priority by each graduating country, which can, inter alia, mitigate the possible loss of
concessionary financing and reduce the risks of falling heavily into debt. A/CONF.223/3.

CDP2015/PLEN/8
23
ANNEX
Annex table 1. Selected data for graduated and graduating countries
Country Status Year of
graduation
LDC criteria
Indicator 2012 reviewa/b 2012 review
consistentc 2015 reviewa
Botswana Graduated 1994
GNI per capita 6,513
(>1,190)
5,597 7,410
(>1,242)
EVI 43.0
(<32.0)
41.6 43.4
(<32.0)
HAI 73.5
(>66.0)
73.5 75.9
(>66.0)
Cabo Verde Graduated 2007
GNI per capita 3,110
(>1,190)
3,421 3,595
(>1,242)
EVI 35.2
(<32.0)
37.0 38.8
(<32.0)
HAI 86.8
(>66.0)
87.4 88.6
(>66.0)
Maldives Graduated 2011
GNI per capita 5,473
(>1,190)
5,675 6,645
(>1,242)
EVI 55.2
(<32.0)
50.4 49.9
(<32.0)
HAI 91.7
(>66.0)
89.3 91.3
(>66.0)
Samoa Graduated 2014
GNI per capita 2,880
(>1,190)
2,830 3,319
(>1,242)
EVI 51.1
(<32.0)
48.3 44.0
(<32.0)
HAI 92.8
(>66.0)
94.8 94.4
(>66.0)
Equatorial
Guinea Graduating 2017
GNI per capita 15,090
(>1,190)
11,627 16,089
(>1,242)
EVI 43.7
(<32.0)
43.1 39.3
(<32.0)
HAI 43.0
(>66.0)
51.3 54.8
(>66.0)
Vanuatu Graduating 2017
GNI per capita 2,540
(>1,190)
2,600 2,997
(>1,242)
EVI 46.8
(<32.0)
45.1 47.7
(<32.0)
HAI 77.7
(>66.0)
81.5 81.3
(>66.0)
Tuvalu Recommended 2012d
GNI per capita 4,993
(>1,190)
4,911 5,788
(>1,242)
EVI 63.9
(<32.0)
58.3 54.0
(<32.0)
HAI 88.1
(>66.0)
87.2 88.8
(>66.0)
Note: a Graduation thresholds are in the parentheses. Bold indicate that the graduation criterion is met; b 2012 data based on
the 2012 data sources and methodology; c 2012 data based on the 2015 data sources and methodology; d Year of graduation recommendation by CDP.
CDP2015/PLEN/8
24
Annex table 2. Maldives: Net and gross secondary school enrolment rate by level and by sex, 2004-2013
(per cent)
2004 2005 2006 2007 2008 2009 2010 2011 2012 2013
Net enrolment rate: lower secondary school (6-10 grades)
Both sexes 52.1 64.6 70.3 69.2 69.2 87.6 83.6 83.6 81.2 92.3
Male 46.3 58.8 63.9 65.2 64.4 83.4 81.0 81.0 83.0 91.4
Female 58.2 70.7 77.0 73.5 74.5 92.1 86.5 86.5 79.3 93.3
Gross enrolment rate: lower secondary school (6-10 grades)
Both sexes 105.4 118.0 121.9 125.3 123.5 111.3 117.0 108.4 112.5 94.6
Male 96.7 110.4 114.7 118.4 117.9 107.4 111.5 107.2 110.5 93.8
Female 114.5 126.1 129.6 132.8 129.6 115.6 122.9 109.7 114.6 95.4
Net enrolment rate: higher secondary school (11-12 grades)
Both sexes 3.9 7.2 8.9 4.0 6.0 13.9 17.4 17.4 19.3 23.9
Male 3.5 6.7 8.7 5.1 5.9 13.1 18.4 18.4 19.6 21.6
Female 4.3 7.8 9.1 2.8 6.1 14.8 16.4 16.4 19.0 26.5
Gross enrolment rate: higher secondary school (11-12 grades)
Both sexes 9.7 11.5 13.7 22.4 16.4 17.8 21.0 36.3 29.6 26.8
Male 10.1 11.9 14.6 29.6 16.5 17.4 22.0 30.6 28.2 22.8
Female 9.4 11.1 12.8 14.8 16.4 18.2 19.9 42.4 31.1 31.1
Source: Ministry of Education, Republic of Maldives (2014). School Statistics 2013, available at
http://www.moe.gov.mv/assets/upload/STAT_BOOK_2013.pdf (accessed on 29 January 2015).