malignant pleural effusion cells show aberrant glucose
TRANSCRIPT

Malignant pleural effusion cells show
aberrant glucose metabolism gene
expressionC-C. Lin*,#, L-C. Chen", V.S. Tseng", J-J. Yan+, W-W. Lai1, W-P. Su*,#, C-H. Line,C-Y.F. Huang** and W-C. Su*,#
ABSTRACT: Malignant pleural effusion (MPE) accompanying lung adenocarcinoma indicates
poor prognosis and early metastasis. This study aimed to identify genes related to MPE formation.
Three tissue sample cohorts, seven from healthy lungs, 18 from stage I–III lung adenocarcin-
oma with adjacent healthy lung tissue and 13 from lung adenocarcinomas with MPE, were
analysed by oligonucleotide microarray. The identified genes were verified by quantitative real-
time PCR (qRT-PCR), immunohistochemical staining, and immunofluorescence confocal micro-
scopy.
20 up- or down-regulated genes with a two-fold change in MPE cancer cells compared to
healthy tissues were differentially expressed from early- to late-stage lung cancer. Of 13 genes
related to cellular metabolism, aldolase A (ALDOA), sorbitol dehydrogenase (SORD), transketo-
lase (TKT), and tuberous sclerosis 1 (TSC1) were related to glucose metabolism. qRT-PCR
validated their mRNA expressions in pleural metastatic samples. Immunohistochemical staining
confirmed aberrant TKT, ALDOA, and TSC1 expressions in tumour cells. Immunofluorescence
confirmed TKT co-localisation and co-distribution of ALDOA with thyroid transcription factor 1-
positive cancer cells. TKT regulated the proliferation, vascular endothelial growth factor secretion
in vitro and in vivo vascular permeability of cancer cell.
Glucose metabolic reprogramming by ALDOA, SORD, TKT and TSC1 is important in MPE
pathogenesis.
KEYWORDS: Glucose metabolism genes, lung adenocarcinoma, malignant pleural effusion
Lung cancer is the leading cause of cancerdeath in both males and females in theUSA, Europe and Taiwan [1]. Its incidence
is increasing and females are more likely thanmales to have an adenocarcinoma subtype [2],which is often complicated by malignant pleuraleffusion (MPE) [3]. A recent study reports thatthe majority of 136 patients with lung adenocar-cinoma and MPE were female (61%) [4]. Patientswith MPE have been previously classified asstage IIIB but recent data from the InternationalAssociation for the Study of Lung Cancerpropose that the staging of lung cancers withconcomitant MPE should be reclassified as earlymetastasis (M1a) [5].
Unlike other solid cancers with surroundingvascular structures to provide conduits for traveland nutrient delivery, cancer cells in MPE prolif-erate autonomously and have a high metastatic
potential. Due to their specific biological properties,malignant cells within MPE are uniquely capable ofsurviving and proliferating without a solid-phasescaffolding [6]. Another important mediator is thevascular endothelial growth factor (VEGF), whichcontributes to the formation of malignant effusionsby increasing vascular permeability [7]. Some genesin MPE may be so specific in maintaining thesurvival of cancer cells in MPE and VEGF secre-tions that MPE remains intractable and resistant tochemotherapy [8]. A previous study reveals thatthe interleukin-6/signal transducer and activator oftranscription 3/VEGF pathway [9] plays a key rolein MPE formation. A connection between EGFRgene mutation and MPE has also been reported [4]but the specific genes or pathways dysregulatedremain unexplored.
This study aimed to identify specific genes orpathways of adenocarcinoma with MPE and
AFFILIATIONS
*Graduate Institute of Clinical
Medicine, College of Medicine,
National Cheng Kung University,"Dept of Computer Science and
Information Engineering, College of
Engineering, National Cheng Kung
University,
Depts of #Internal Medicine,+Pathology,1Surgery, Hospital and College of
Medicine, National Cheng Kung
University, Tainan,eInstitute of Microbiology and
Immunology, and
**Institute of Clinical Medicine,
National Yang-Ming University,
Taipei, Taiwan.
CORRESPONDENCE
W-C. Su
Division of Hematology/Oncology
Dept of Internal Medicine
Hospital and College of Medicine
National Cheng Kung University
College
138 Sheng-Li Road
Tainan 704
Taiwan
E-mail: [email protected]
Received:
Jan 29 2010
Accepted after revision:
Sept 16 2010
First published online:
Sept 30 2010
European Respiratory Journal
Print ISSN 0903-1936
Online ISSN 1399-3003This article has online supplementary material available from www.erj.ersjournals.com
EUROPEAN RESPIRATORY JOURNAL VOLUME 37 NUMBER 6 1453
Eur Respir J 2011; 37: 1453–1465
DOI: 10.1183/09031936.00015710
Copyright�ERS 2011
c

investigate their significance in MPE cancer cell survival andformation. It focused on female lung adenocarcinoma patientswith MPE.
MATERIALS AND METHODS
MPE cancer cells, healthy normal lung tissue, and stageI–III lung cancer for microarray analysisFirst, to identify differently expressed genes in MPE cancer celland normal lung tissue, two cohorts for microarray analysiswere collected. The institutional review board approved thestudy and all patients provided written informed consent. Thefirst cohort of MPE was obtained from 13 females whounderwent thoracentesis or thoracotomy at the NationalCheng Kung Hospital (Tainan, Taiwan) from 2002 to 2005.Cytological analysis or pathological proof from pleural biopsywas used to verify each lung adenocarcinoma-associated MPEspecimen. The methods used for collection of cancer cells fromMPE [10], RNA extraction, Affymetrix array hybridisation, andimage processing are shown in the online supplementarymaterial. A second cohort of healthy lung tissue microarraywas provided by C-H. Lin (National Yang-Ming University,Taipei, Taiwan).
Secondly, the study aimed to show that MPE-specific geneswere not only different from health lung tissue but alsorelatively up- or down-regulated compared to the primarytumour. The identified genes were MPE-specific and moremetastatic and invasive than the primary tumour. However,the primary pulmonary tumour of MPE was often notavailable and no pairing analyses (primary tumour andMPE) could be done. Thus, a third cohort microarray databaseset (National Center for Biotechnology Information geneexpression omnibus accession number: GSE7670) [11], whichincluded samples from 18 females with lung adenocarcinomawith adjacent healthy tissue. The basic and clinical character-istics of these three cohorts are listed in table 1.
Statistical analysis of microarray dataUsing the Golub criteria to identify differentially expressedgenes between MPE and healthy normal lung tissue [13], thetop 500 differential genes corresponding to 631 microarrayprobes were identified. These 500 discriminative genes (MPE-specific genes) were further analysed using the third cohortmicroarray database set. The first and the third cohorts werepooled and classified as a fourth group including samplesfrom 18 subjects with adjacent normal lung tissue, nine with
stage I lung cancer, nine with stage III, and 13 with MPE cancercells, representing normal tissue to early stage lung cancer tolate-stage (or pre-metastatic) stage.
After using robust multi-array analysis normalisation [11], the631 probes were further restricted by adding the criterion thatthe genes show a tendency to be expressed at higher or lowerlevels between the adjacent healthy, stage I, stage III and MPEsamples. First, the identified genes had to be differentiallyexpressed between the four groups. One-way ANOVA wasused to search for genes that were expressed statisticallydifferently among these four groups (p,0.05). Moreover, theexpressions of these genes had to be higher in MPE comparedwith the tumour part of stage III cancer, higher in the tumourpart of stage III cancer compared with that of stage I cancer,and higher in the tumour part of stage I cancer than theadjacent normal lung tissue. Otherwise, the expression of thesegenes had to be lower in MPE compared with the tumour partof stage III cancer, lower in the tumour part of stage III cancercompared with that of stage I cancer, and lower in the tumourpart of stage I cancer than the adjacent normal lung tissue.
The identified up- or down-regulated genes in MPE cancercells were also expressed differentially as the cancer pro-gressed from early stage to MPE. Using these supervised andstrict set of criteria among the four groups, 71 genes wereidentified from 500 genes. These 71 genes were furtherrestricted to the expression level at least two-fold higher inMPE samples than normal lung tissue, with p,0.001 toexclude false significant results [14]. The workflow for theanalysis is shown in figure 1a.
RNA extraction and quantitative RT-PCRRNA extraction and quantitative RT-PCR were done by WelgeneBiotech Co., Ltd (Taipei, Taiwan), while total RNA purificationwas done by TRIzol reagent combined spin columns. All sam-ples were PCR-amplified (LightCycler-FastStart DNA MasterSYBR Green I kit; Roche Diagnostics Corporation, RocheApplied Science, Indianapolis, IN, USA) with constitutivelyexpressed b-actin. The primers designed for the identified geneswere listed in table 2.
Immunohistochemistry and immunofluorescent imagesImmunohistochemistry and immunofluorescence analysis vali-dated the gene expression in clinical specimens. The basic andclinical characteristics of the three validation cohorts werelisted in table 3. The MPE cell blocks were produced using theAgarCyto cell block method [15]. The methods and theantibodies used for immunohistochemistry and immunofluor-escence are shown in the online supplementary material.
Cell lines, cell lysates and Western blotThe PC14PE6/AS2 (AS2) cell line was from ascites generatedfrom intraperitoneal injection with PC14PE6 in the metastaticanimal model [9]. The normal bronchial cell line (NL-20), lungadenocarcinoma cell line A549, and H1650 were purchasedfrom American Type Culture Collection (Rockville, MD, USA).The CL1-0 clonal cell line was provided by P-C. Yang (NationalTaiwan University College of Medicine, Taipei, Taiwan).
Total protein from healthy lung lysates and cancer cell lineswere extracted, blotted and detected using antibodies against
TABLE 1 Characteristics of the three female cohorts forarray analysis
Variable Stage# Age yrs
Normal healthy females 58 (48–72)
18 lung cancer 9 stage I (3 IA and 6 IB) 60 (48–73)
9 stage III (5 IIIA and 4 IIIB)
13 MPE 5 IIIB 58 (43–79)
8 IV
Age values are given as mean (range). MPE: malignant pleural effusion.#: stage according to American Joint Committee on Cancer [12].
THORACIC ONCOLOGY C-C. LIN ET AL.
1454 VOLUME 37 NUMBER 6 EUROPEAN RESPIRATORY JOURNAL

7 femalesNormal lung
631 probe
71 genes
a)
b)
20 gene
Adjacent normal Stage 1 Stage 3 MPE
TCF7L1
PANK2
ECHDC2
TSC1CALCOCO1
TSC22D1C3orf24MAPK13MRPL15
NME1MTX2
SORD
C20orf24
P4HA1ALDOA
POLE3SLBP
BZW1CNIHTKT
18 adjacentNormal chip
9 stage I(3 IA and 6 IB)
9 stage III(5 IIIA and 4 IIIB)
13MPE
13 femalesMPE
Two-group comparative analysisTop 500 by Golub method
ANOVA analysis and post hoc multiplecomparisons–Bonferroni method
MPE > stage III > stage I > normalor MPE < stage III < stage I < normal
MPE versus normal p<0.001 Relative change >2-fold
0.25 1.0
Relative expression to median
4.0
FIGURE 1. a) Flow chart for the collection of three different cohorts for microarray analysis. b) Gene expression profiles clustered hierarchically based on final 20 genes.
MPE: malignant pleural effusion.
C-C. LIN ET AL. THORACIC ONCOLOGY
cEUROPEAN RESPIRATORY JOURNAL VOLUME 37 NUMBER 6 1455

human transketolase (TKT), aldolase A (ALDOA; ProteintechGroup, Chicago, IL, USA), tuberous sclerosis 1 (TSC1; Cell Signal-ing Technology, Inc., Beverly, MA, USA), and glyceraldehyde-3-phosphate dehydrogenase (Santa Cruz Biotechnology, Inc, SantaCruz, CA, USA). Antibody binding was detected by electro-chemiluminescence (Amersham Biosciences, Piscataway, NJ,USA) based on the manufacturer’s instructions.
TKT inhibitor and MTT testOxythiamine was purchased from Sigma Chemical Co. (StLouis, MO, USA). A 3-(4,5-dimethylthiazol-2-yl)-2,5-diphenyl-tetrazolium bromide (MTT) test was used to evaluate the anti-proliferation effect of oxythiamine.
Transfection with siRNA, proliferation analysis, colonyformation assay, in vitro VEGF secretion and in vivovascular permeability assayOligonucleotides representing small interfering (si)RNA againsthuman TKT expression (TKT siRNA) and mismatch controloligonucleotides (scramble siRNA) were used (Invitrogen-LifeTechnologies, Carlsbad, CA, USA). The siRNA sequence thattargeted TKT was 59-AAAGAGGACAGCCAUGAUCUCUGCG-39, while the scramble siRNA was the negative control.The PC14PE6/AS2 cells were transfected with siRNA for a finalconcentration of 50–100 nM by MicroPorator MP-100 (NanoEnTek, Seoul, South Korea).
The cell proliferation of PC14PE6/AS2 after transfection wasdetected by flow cytometry analysis with proliferation-asso-ciated antigen Ki-67 and cell colony formation assay (onlinesupplementary material).
Transfected PC14PE6/AS2 cells were maintained in 60 mmultra-low attachment plate (50,000 cells per plate; Corning,Lowell, MA, USA) for 48 h to evaluate cell morphology, VEGFsecretion in vitro and in vivo permeability assay (Milespermeability assay; online supplementary material) [9].
Statistical analysisData were analysed using Prism 4 (GraphPad Software, Inc.,La Jolla, CA, USA). Differential expressions of specific genesbetween different stages were assessed by one-way analysis ofvariance (ANOVA) and by Bonferroni post hoc multiplecomparisons. The area grade of immunohistochemistrybetween tumour and healthy samples was determined by theMann–Whitney U-test. Paired t-test was used to determinedifferences between TKT siRNA and scramble-transfectedPC14PE6/AS2 cells. Statistical significance was set at p,0.05.
RESULTS
Glucose metabolism regulatory genes were aberrantlyregulated in MPE cancer cells20 differentially expressed genes were identified between MPEand healthy adjacent lung tissue. 14 genes were up-regulatedand six were down-regulated in the MPE group comparedwith the healthy controls (fig. 1b). Their relative changes andannotation are listed in table 4. Functional annotation andpathway interaction of these genes was done using theBABELOMICS platform [16] and ingenuity pathways analysis(IPA) [17]. Gene ontology annotation of three of the 20 genesremained unestablished.
Combining IPA canonical pathway analysis and functionaldefinitions with gene ontology and KEGG pathway analysisin the BABELOMICS platform, 13 of the 17 well-known genes(76%) were related to metabolic processes. Further studies ofthe 13 genes showed that three, ALDOA, sorbitol dehydro-genase (SORD) and TKT, were directly related to glucosemetabolism (fig. 2a and b). Of the down-regulated genes,TSC1 was involved in the insulin pathways, according to theKEGG database.
Whether these genes are differentially expressed from healthyto early stage lung cancer to MPE were further investigated.The difference between stage I cancer and MPE wasstatistically significant (fig. 2c; p,0.01 in SORD and p,0.05in ALDOA and TKT, all by Bonferroni multiple comparisons).
TABLE 2 RT-PCR primers of selected genes for theLightcycler
Gene symbol Sense primer Antisense primer
TSC1 TGGGAATTGGAATCAAAAGAG ACAAGCAACTGCCTTGACATT
SORD TGACCACCGTACCCCTACTG CAGACTTGGACGCAAGCAT
ALDOA GGCCTCCGTCTGGATTTC GGGCATGGTGCTGGTAGTAG
TKT ATGCCATTGCACAAGCTG CACACTTCATACCCGCCCTA
PANK2 GGTCTTGGCAATCATCTGTG CCCTTCCAAAAACTGCTTGT
TABLE 3 Characteristics of three cohorts for validation
Variable Sex Stage Age yrs
Immunohistochemistry of normal lung tissue and adjacent 28 males 11 stage IA, 8 stage IB 57 (30–92)
20 females 7 stage IIA, 6 stage IIA
6 stage IIIA, 2 stage IIIB
8 stage IV
10 metastatic pleurae 6 females 4 stage IIIB 57 (26–85)
4 males 6 stage IV
8 MPE block 4 females 1 stage IIIB 63 (46–75)
4 males 7 stage IV
Age values are given as mean (range). MPE: malignant pleural effusion.
THORACIC ONCOLOGY C-C. LIN ET AL.
1456 VOLUME 37 NUMBER 6 EUROPEAN RESPIRATORY JOURNAL

The expression levels were also significantly different betweenthe healthy and stage III samples in the three genes (p,0.01 inALDOA, and p,0.05 in SORD and TKT). Expression levels ofTSC1 were lower in the MPE samples than in the stage I(p,0.01) and III (p,0.05) samples.
To verify these gene expression data, RNA was extracted fromnine metastatic pleurae lung adenocarcinoma and adjacentnormal lung tissue. Samples were then analysed usingquantitative RT-PCR. ALDOA and TKT expressions weresignificantly higher, while TSC1 and pantothenate kinase 2(PANK2; a non-glucose-metabolism gene) expressions weresignificantly lower in tumour than in healthy samples (fig. 2d;p,0.05 by t-test). SORD expression was also higher in tumoursamples, but the difference was not statistically significant(p50.05).
TKT and ALDOA protein expression was higher and TSC1protein expression was lower in tumour cells than inhealthy cellsWestern blotting was used to test the protein expression levelsof TKT, ALDOA and TSC1 in four lung cancer cell lines: A549,PC14PE6/AS2, H1650 and CL1-0. TKT and ALDOA expressionwere higher and TSC1 expression was lower in lung cancer celllines than in healthy lung lysates (fig. 2e) and normal bronchialcell line (NL-20; online supplementary material). Immuno-histochemical staining validated the protein expression inclinical samples of lung cancer tissue, adjacent healthy tissue,tumours invading the pericardium, and cancer cells frompatients with MPE. TKT was located predominantly in thenucleus (fig. 3a and b) and was more abundantly expressed intumour cells that invaded the pericardium (fig. 3c), andtumour tissue than in adjacent healthy bronchial epithelium.
Cancer cells from MPE were used to make AgarCyto cellblocks and to study TKT expression in MPE cancer cells.Cancer cells in MPE expressed high levels of TKT (fig. 3d).ALDOA expression, located predominately in cytoplasm, washigher in tumour cells than in adjacent healthy bronchialepithelial cells (fig. 3e and f). Tumour cells that invaded thepericardium also expressed high ALDOA levels (fig. 3g).Conversely, TSC1, located primarily in the cytoplasm andnuclei, was expressed mainly in healthy pneumocytes, butbarely or not at all in tumour cells (fig. 3h and i).
Immunohistochemical analyses of 48 lung adenocarcinomaspecimens showed that 19 were stage I, 13 stage II, eight stageIII and eight stage IV. The percentage of immunoreactivecancer cells was scaled using a four-tiered area grade andsemi-quantitative system [18]. Using the area grade, thestaining scores for TKT (fig. 3j; p,0.001) and ALDOA(p,0.01) were significantly higher in tumour tissue than inadjacent healthy tissue, and the staining score for TSC1 wassignificantly lower in tumour tissue (p,0.001) than in adjacenthealthy tissue. A limited number of samples for each stageprevented further correlation studies of staining scores andcancer stages.
Cancer cell in MPE and pleural metastasis expressed highTKT and ALDOAThyroid transcription factor 1 (TTF-1) served as a good markerof lung cancer cells in MPE [19, 20]. To verify TKT and ALDOAexpressions in lung cancer cells from MPE, eight MPE blocksfrom eight patients who underwent thoracocentesis and cancercells were examined by cytology (table 2). Triple immuno-staining using DAPI, TTF-1, TKT or ALDOA and recordingunder confocal microscope were used to investigate the
TABLE 4 List of differentially expressed genes between malignant pleural effusion and normal lung tissue#
Clone Symbol Description Relative change
201563_at SORD Sorbitol dehydrogenase 4.48
200776_s_at BZW1 Basic leucine zipper and W2 domains 1 4.11
208699_x_at TKT Transketolase 3.38
201577_at NME1 Non-metastatic cells 1, protein (NM23A) 3.29
219288_at C3orf14 Chromosome 3 open reading frame 14 3.25
200966_x_at ALDOA Aldolase A 3.14
218027_at MRPL15 Mitochondrial ribosomal protein L15 2.78
210058_at MAPK13 Mitogen-activated protein kinase 13 2.61
206052_s_at SLBP Stem-loop (histone) binding protein 2.58
217835_x_at C20orf24 Chromosome 20 open reading frame 24 2.48
207543_s_at P4HA1 Procollagen-proline, 2-oxoglutarate 4-dioxygenase (proline 4-hydroxylase) 2.42
208828_at POLE3 Polymerase (DNA directed), epsilon 3 (p17 subunit) 2.31
201653_at CNIH Cornichon homologue 2.19
203517_at MTX2 Metaxin 2 2.02
221016_s_at TCF7L1 Transcription factor 7-like 1 0.47
209390_at TSC1 Tuberous sclerosis 1 0.45
209002_s_at CALCOCO1 Calcium binding and coiled-coil domain 1 0.44
218552_at ECHDC2 Enoyl coenzyme A hydratase domain containing 2 0.40
218809_at PANK2 Pantothenate kinase 2 0.36
215111_s_at TSC22D1 TSC22 domain family, member 1 0.23
#: relative change .2- or ,0.5-fold; p,0.001.
C-C. LIN ET AL. THORACIC ONCOLOGY
cEUROPEAN RESPIRATORY JOURNAL VOLUME 37 NUMBER 6 1457

a)
Biological process; Level 3
Canonical pathway analysis -log(p-value)
Ratio
KEGG pathway
Cellular metabolic process Fructose and mannose metabolism
Fructose and mannose metabolism
Pyrimidine metabolism
Pyrimidine metabolism
Parkinson’s signalling
Pantothenate and CoA biosynthesis
Purine metabolism
Purine metabolism
Carbon fixationPentose phosphate pathway
Pentose phosphate pathway
Macromolecule metabolic processPrimary metabolic process
b)
c)
d) e)
0
0.00
0.00
33
4 2
1
0
3
2
1
0
2
1
0
TSC1
SORD
ALDOA ALDOA
GAPDHTKT
TKT
TSC1
GAPDH
AS2
AS2
A549
A549 CL1-0
H1650 CL1-0Lung lysates
Lung lysatesPANK2
Nor
mal
ised
ex
pres
sion
val
uelo
g 2 c
hang
e (r
elat
ive)
2
1
Normal
SORD ALDOA TKT TSC1
Stage 1Stage 3 MPE Normal Stage 1 Stage 3 MPE Normal Stage 1 Stage 3 MPE Normal Stage 1Stage 3 MPE0
4
2
0 **
**
***
***
-2
0.01 0.02 0.03 0.04 0.05 0.06 0.07 0.08 0.09 0.10 0.11 0.12 0.13 0.14 0.15
0.25 0.50 0.75 1.00
Threshold
1.25 1.50 1.75 2.00 2.25 2.50 2.75 3.00
20 40 60 80 100 0 20 40 60 80 10076.47% 10.53%
10.53%10.53%10.53%10.53%
70.59%
70.59%
FIGURE 2. Analysis of all genes and selected gene expression in different stages of lung cancer via bioinformatics platform, qRT-PCR of tissue samples and Western
blotting of lung cancer cell lines. a) The BABELOMICS platform revealed that most genes were associated with cell metabolism, according to the gene ontology database.
The axis indicates the percentage of well-known genes associated with a specific biological function or pathway. b) Ingenuity pathways analysis of all genes was displayed by
canonical pathway. The axis indicates the significance (-log p-value; threshold p,0.05) of the pathway association. c) Gene expression values of glycolysis-associated genes
(tuberous sclerosis 1 (TSC1), sorbitol dehydrogenase (SORD), aldolase A (ALDOA) and transketolase (TKT)) from healthy controls and lung cancer patients at different stages
(using robust multi-array analysis normalisation). *: p,0.05; **: p,0.01; ***: p,0.001. d) Quantitative real-time PCR analysis of TSC1, SORD, ALDOA, TKT and
pantothenate kinase 2 (PANK2) from four lung cancer and adjacent healthy lung tissue samples. e) Western blotting was used to detect TKT, ALDOA (PC14PE6/AS2, A549,
H1650 and CL1-0) and TSC1 (PC14PE6/AS2, A549, CL1-0) expressions in the lysates from healthy lung and lung cancer cell lines. GAPDH: glyceraldehyde phosphate
dehydrogenase.
THORACIC ONCOLOGY C-C. LIN ET AL.
1458 VOLUME 37 NUMBER 6 EUROPEAN RESPIRATORY JOURNAL

a) b) c)
d) e) f)
g)
j)
4
TKT
TumourNormal
3
2
Are
a gr
ade
1
0
1.5
1.0
0.5
0.0
ALDOA
TumourNormal
Are
a gr
ade
h) i)
1.5
1.0
0.5
0.0
TSC1
TumourNormal
Are
a gr
ade
FIGURE 3. Immunohistochemical staining of transketolase (TKT), aldolase A (ALDOA) and tuberous sclerosis 1 (TSC1) in clinical specimens. a) TKT intensity in healthy
bronchiole epithelium (arrows, 206 objective). b) Nucleus immunoreactive TKT predominantly expressed in the lung adenocarcinoma adjacent to healthy bronchiole
epithelium (arrowheads, 206 objective). c) TKT expression in lung cancer cells invading the pericardium (406 objective). d) TKT intensity of cancer cells in malignant pleural
effusion (406 objective). e) Cytoplasmic localisation of predominant ALDOA in lung adenocarcinoma (arrowhead, 206 objective) adjacent to the healthy bronchiole
epithelium (arrows, 206 objective). f) ALDOA intensity in lung adenocarcinoma. g) ALDOA expression in lung cancer cells invading the pericardium (406 objective). h)
Nuclear and cytoplasmic expression of TSC1 in pneumocytes (arrowheads, 206 objective). i) No expression of TSC1 in adjacent tumour tissue (206 objective). Scale
bars510 mm. j) Immunohistochemical analysis of TKT, ALDOA, and TSC1 expression in tumour and adjacent healthy tissue specimens from 48 patients (semi-quantitative
area scores: 0, no stained tumour cells; 1, 0–25% of tumour cells stained; 2, 26–50% tumour cells stained; 3, 51–75% tumour cells stained; 4, 76–100% tumour cells stained).
**: p,0.01; ***: p,0.001 (paired t-test). Higher TKT, higher ALDOA, and lower TSC1 expression was observed in tumour tissue compared to the adjacent healthy area.
C-C. LIN ET AL. THORACIC ONCOLOGY
cEUROPEAN RESPIRATORY JOURNAL VOLUME 37 NUMBER 6 1459
expression and distribution of TKT and ALDOA in the TTF-1-positive cells from MPE blocks. TTF-1 expression waspredominant in the nucleus of cancer cells from MPE blockwhile TKT immunoreactivity was detected in the nucleilocated within TTF-1-positive cancer cells (fig. 4a).
The continuous section showed that ALDOA expression wasdetected in the cytoplasm and cell membrane within TTF-1-positive cells (fig. 4b). Co-localisation of TKT and co-expressionof ALDOA in TTF-1-positive cancer cells were also observedunder lower power field with the acinar type (fig. 4c). Furtherquantitative analysis of ALDOA and TKT expression in theeight MPE cell blocks showed that the co-localisation ratios ofTKT and TTF1 were .70% (fig. 4d; using pixel-by-pixelanalysis through by FV-1000 software) [21]. Defining co-expression of ALDOA as the distribution of ALDOA stainingin more than one-third of the plasma membrane of TKT positivecells [21], the co-expression ratios were .75% (fig. 4d).
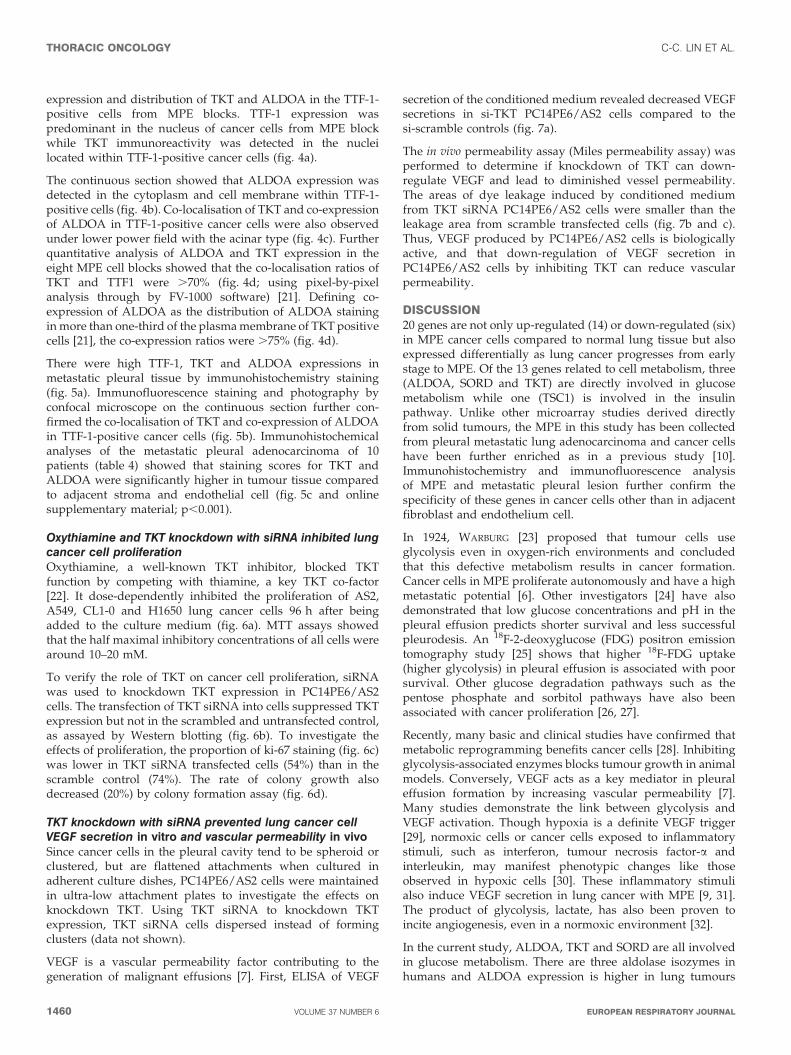
There were high TTF-1, TKT and ALDOA expressions inmetastatic pleural tissue by immunohistochemistry staining(fig. 5a). Immunofluorescence staining and photography byconfocal microscope on the continuous section further con-firmed the co-localisation of TKT and co-expression of ALDOAin TTF-1-positive cancer cells (fig. 5b). Immunohistochemicalanalyses of the metastatic pleural adenocarcinoma of 10patients (table 4) showed that staining scores for TKT andALDOA were significantly higher in tumour tissue comparedto adjacent stroma and endothelial cell (fig. 5c and onlinesupplementary material; p,0.001).
Oxythiamine and TKT knockdown with siRNA inhibited lungcancer cell proliferationOxythiamine, a well-known TKT inhibitor, blocked TKTfunction by competing with thiamine, a key TKT co-factor[22]. It dose-dependently inhibited the proliferation of AS2,A549, CL1-0 and H1650 lung cancer cells 96 h after beingadded to the culture medium (fig. 6a). MTT assays showedthat the half maximal inhibitory concentrations of all cells werearound 10–20 mM.
To verify the role of TKT on cancer cell proliferation, siRNAwas used to knockdown TKT expression in PC14PE6/AS2cells. The transfection of TKT siRNA into cells suppressed TKTexpression but not in the scrambled and untransfected control,as assayed by Western blotting (fig. 6b). To investigate theeffects of proliferation, the proportion of ki-67 staining (fig. 6c)was lower in TKT siRNA transfected cells (54%) than in thescramble control (74%). The rate of colony growth alsodecreased (20%) by colony formation assay (fig. 6d).
TKT knockdown with siRNA prevented lung cancer cellVEGF secretion in vitro and vascular permeability in vivoSince cancer cells in the pleural cavity tend to be spheroid orclustered, but are flattened attachments when cultured inadherent culture dishes, PC14PE6/AS2 cells were maintainedin ultra-low attachment plates to investigate the effects onknockdown TKT. Using TKT siRNA to knockdown TKTexpression, TKT siRNA cells dispersed instead of formingclusters (data not shown).
VEGF is a vascular permeability factor contributing to thegeneration of malignant effusions [7]. First, ELISA of VEGF
secretion of the conditioned medium revealed decreased VEGFsecretions in si-TKT PC14PE6/AS2 cells compared to thesi-scramble controls (fig. 7a).
The in vivo permeability assay (Miles permeability assay) wasperformed to determine if knockdown of TKT can down-regulate VEGF and lead to diminished vessel permeability.The areas of dye leakage induced by conditioned mediumfrom TKT siRNA PC14PE6/AS2 cells were smaller than theleakage area from scramble transfected cells (fig. 7b and c).Thus, VEGF produced by PC14PE6/AS2 cells is biologicallyactive, and that down-regulation of VEGF secretion inPC14PE6/AS2 cells by inhibiting TKT can reduce vascularpermeability.
DISCUSSION20 genes are not only up-regulated (14) or down-regulated (six)in MPE cancer cells compared to normal lung tissue but alsoexpressed differentially as lung cancer progresses from earlystage to MPE. Of the 13 genes related to cell metabolism, three(ALDOA, SORD and TKT) are directly involved in glucosemetabolism while one (TSC1) is involved in the insulinpathway. Unlike other microarray studies derived directlyfrom solid tumours, the MPE in this study has been collectedfrom pleural metastatic lung adenocarcinoma and cancer cellshave been further enriched as in a previous study [10].Immunohistochemistry and immunofluorescence analysisof MPE and metastatic pleural lesion further confirm thespecificity of these genes in cancer cells other than in adjacentfibroblast and endothelium cell.
In 1924, WARBURG [23] proposed that tumour cells useglycolysis even in oxygen-rich environments and concludedthat this defective metabolism results in cancer formation.Cancer cells in MPE proliferate autonomously and have a highmetastatic potential [6]. Other investigators [24] have alsodemonstrated that low glucose concentrations and pH in thepleural effusion predicts shorter survival and less successfulpleurodesis. An 18F-2-deoxyglucose (FDG) positron emissiontomography study [25] shows that higher 18F-FDG uptake(higher glycolysis) in pleural effusion is associated with poorsurvival. Other glucose degradation pathways such as thepentose phosphate and sorbitol pathways have also beenassociated with cancer proliferation [26, 27].
Recently, many basic and clinical studies have confirmed thatmetabolic reprogramming benefits cancer cells [28]. Inhibitingglycolysis-associated enzymes blocks tumour growth in animalmodels. Conversely, VEGF acts as a key mediator in pleuraleffusion formation by increasing vascular permeability [7].Many studies demonstrate the link between glycolysis andVEGF activation. Though hypoxia is a definite VEGF trigger[29], normoxic cells or cancer cells exposed to inflammatorystimuli, such as interferon, tumour necrosis factor-a andinterleukin, may manifest phenotypic changes like thoseobserved in hypoxic cells [30]. These inflammatory stimulialso induce VEGF secretion in lung cancer with MPE [9, 31].The product of glycolysis, lactate, has also been proven toincite angiogenesis, even in a normoxic environment [32].
In the current study, ALDOA, TKT and SORD are all involvedin glucose metabolism. There are three aldolase isozymes inhumans and ALDOA expression is higher in lung tumours
THORACIC ONCOLOGY C-C. LIN ET AL.
1460 VOLUME 37 NUMBER 6 EUROPEAN RESPIRATORY JOURNAL

a) DAPI
b) DAPI
c)
d) e)100 100
80
60
40
20
75
50
Co-
loca
lisat
ion
of T
KT
with
TT
F-1
%
TTF-
1+ c
ell w
ith A
LDO
A ce
ll m
embr
ane
dist
ribut
ion
%
25
0
DAPI TTF-1 TKT TTF-1+TKT
TTF-1+ALDOAALDOATTF-1DAPI
TTF-1 ALDOA TTF-1+ALDOA
TTF-1 DAPI+TTF-1 TTF-1+DIC TKT TTF-1+TKT
MP
E1
MP
E2
MP
E3
MP
E4
MP
E5
MP
E6
MP
E7
MP
E8
MP
E1
MP
E2
MP
E3
MP
E4
MP
E5
MP
E6
MP
E7
MP
E8
FIGURE 4. Immunofluorescent analysis detected the expression and distribution of transketolase (TKT), aldolase A (ALDOA) and thyroid transcription factor 1 (TTF-1) at
malignant pleural effusion (MPE) lung cancer cells. a) Confocal image under higher power field (606 objective ) showed the immuno-detection of TTF-1 at nucleus
demonstrated by DAPI stain for nucleus, TTF-1 stain, merge of DAPI stain and TTF-1 stain and merge of TTF-1 and DIC (differential interference contrast) images. The co-
localisation of TTF-1 and TKT was verified by TKT stain and merge of TTF-1 and TKT stain. b) Continuous section showed simultaneous immunodetection of TTF-1 and
ALDOA (cytoplasma and cell membrane) by DAPI stain, TTF-1 stain, ALDOA stain and merge of TTF-1 and ALDOA stain. c) Representative confocal images under low power
field (206 objective) showed co-localisation of TKT and TTF-1 in nucleus and cytoplasm distribution of ALDOA in TTF-1-positive MPE cancer cells. Scale bars510 mm.
d) Immunofluorescent analysis was used to detect the co-localisation ratio between TTF-1 and TKT (pixel-by-pixel analyses), and ratio of cytoplasm co-distribution of ALDOA
in TTF-1-positive cancer cell from eight patients’ MPE cell blocks.
C-C. LIN ET AL. THORACIC ONCOLOGY
cEUROPEAN RESPIRATORY JOURNAL VOLUME 37 NUMBER 6 1461
a)
b)
c)4
Tumour
Fibroblast
Endothelial cell3
2
Are
a gr
ade
1
0
4Tumour
Fibroblast
Endothelial cell3
2
Are
a gr
ade
1
0
DAPI TTF-1 TKT TTF-1+TKT
DAPI TTF-1 ALDOA TTF-1+ALDOA
HE stain TTF-1 TKT ALDOA
TKT ALDOA
FIGURE 5. Distribution of transketolase (TKT), aldolase A (ALDOA) and thyroid transcription factor 1 (TTF-1) at metastatic pleurae tumour. a) Immunohistochemical
analysis was used to detect the expression of TKT, ALDOA and TTF-1 in metastatic pleurae tumour (area of dashed line, 206 objective) compared to adjacent normal pleurae
tissue. b) Continuous section for immunofluorescence analysis and confocal image showed co-localisation of TKT and TTF-1 in nucleus and cytoplasmic distribution of
ALDOA in TTF-1-positive cancer cells in metastatic pleurae tumour (area of dashed line, 206 objective). Scale bars520 mm. c) Immunohistochemical analysis was used to
detect the expression of TKT and ALDOA in the metastatic pleurae tumour of 10 patients. Higher expression of TKT and ALDOA was found in tumour tissue compared with the
adjacent fibroblast and endothelial cell (semi-quantitative area scores: 0, no stained tumour cells; 1, 0–25% of tumour cells stained; 2, 26–50% tumour cells stained; 3, 51–
75% tumour cells stained; 4, 76–100% tumour cells stained). ***: p,0.001.
THORACIC ONCOLOGY C-C. LIN ET AL.
1462 VOLUME 37 NUMBER 6 EUROPEAN RESPIRATORY JOURNAL

100a)
b)
c)
d)
0.0%
0.2%
0.1%
99.7%
73.7%
26.3%
55.2%
44.3%
0.0%
0.0%
0.1%
0.5%
Ki67(+)
Ki67(-)
103
104
102
FL1-
H
101
100
80100
80
60
40
20
0
60
AS2-siRNA-control
Ki-67(+) cell % Colony % of control
AS2-siRNA-TKT
AS2-siRNA-control
AS2-siRNA-TKT
40
20
0
80
100
60
40
20
0
0 1023FSC-H
0 1023
Forward scatter
FSC-H0 1023
FSC-H
80
60
40
20
2.5
Control Mock Scramble siRNA-TKT
5 10 20 40 2.5 5 10 20 40 2.5 5 10 20 40 2.5 5 10Oxythiamine mMOxythiamine mMOxythiamine mMOxythiamine mM
20 400
TKT
Actin
AS2 A549 CL1-0 H1650
IgG control Scramble siRNA-TKT
Ki67(+)%
FIGURE 6. Inhibition of transketolase (TKT) blocked the viability or proliferation of lung cancer cells. a) Oxythiamine, a TKT inhibitor, blocked the viability of lung cancer
cells. The viability rate was detected using MTT test. b) The knockdown of TKT with TKT siRNA inhibited the proliferation of PC14PE6/AS2 cells. Western blotting analyses
showed the expression of TKT of PC14PE6/AS2 cells transfected or untransfected with siRNA-scramble control, siRNA-TKT. c) Histograms showed Ki-67 staining of TKT
siRNA and scramble-transfected PC14PE6/AS2 cells compared to the isotype control. Ig: immunoglobulin. d) Proportions of Ki-67 positive and colony formation in TKT siRNA
or scramble-transfected PC14PE6/AS2 cells. **: p,0.01 (paired t-test).
C-C. LIN ET AL. THORACIC ONCOLOGY
cEUROPEAN RESPIRATORY JOURNAL VOLUME 37 NUMBER 6 1463

than in healthy tissue [33]. The mechanism for this up-regulation remains unknown. SORD is involved in the sorbitolpathway of glucose metabolism and although no studies havelinked SORD to tumourigenesis, blocking the sorbitol pathwaysuppresses colon cancer cell proliferation [27]. TKT, the keyenzyme in the pentose phosphate pathway, which mediatesthe conversion of glucose to ribose phosphate, is used in thebiosynthesis of nucleic acids and nucleotides. The pentosephosphate pathway is up-regulated in cells with anchorage-independent cell growth phenotype [34], which have highmetastatic potential. Cancer cells that proliferate in MPE arealso anchorage independent.
TKT expression is not only higher in MPE in microarray analysisbut also verified in primary lung cancer tissue, metastaticpleural tumour, and malignant pleural effusion. Using the TKTinhibitor, oxythiamine, or transfecting lung cancer cell withsmall interfering RNA against TKT, inhibiting TKT suppresseslung cancer cell proliferation. Therefore, up-regulating TKT incancer cells from MPE may facilitate their survival by activatingthe pentose phosphate pathway. Using an ultra-low attachmentplate, the knockdown of TKT prevents cell aggregation, which isrelated to colony formation in soft agar [35]. TKT also controlsthe secretions of VEGF and vascular permeability in vitro and invivo. A recent study in a diabetic animal model also verifies thatthe TKT activator benfotiamine stimulates the activity ofpentose phosphate pathway enzymes, leading to phosphoryla-tion/activation of VEGF receptor-2 [36]. Taken together, TKT isinvolved not only in MPE cancer cell proliferation but also inVEGF secretion in MPE formation.
The TSC1/TSC2 complex is associated with the development oftuberous sclerosis, and mutations in either gene are responsiblefor both the familial and sporadic forms. Although not directlyinvolved in glucose metabolism, TSC1 modulates the mamma-lian target of rapamycin (mTOR) pathway and receives inputfrom the PI3K-Akt and LKB1-AMPK pathways. Hyperactivationof mTOR alone is sufficient to drive hypoxia-inducible factor-dependent transcription of glycolytic and angiogenesis-relatedgenes [37]. The LKB1 gene is inactivated in lung cancer cells andrelated to tumourigenesis and metastasis [38]. Moreover, TSC1regulates VEGF expression via the mTOR pathway [39]. Con-sidering all of these, the AMPK-LKB1-TSC1 pathway is a poten-tial target for lung cancer therapy.
In conclusion, a panel of genes from MPE may contribute tolung cancer progression. Glucose metabolism is important notonly in tumourigenesis but also in cancer cell proliferation andVEGF secretion in MPE. This study increases the under-standing of underlying mechanisms of MPE, which may facilitatethe development of new treatment strategies for MPE-associatedlung adenocarcinoma.
SUPPORT STATEMENTThis work was supported by the Department of Health (DOH99-TD-C-111-003, DOH99-TD-B-111-102), and by grants NSC 97-2314-B-006-014-MY2 and NHRI93A1-NSCBS04-2-5.
STATEMENT OF INTERESTNone declared.
ACKNOWLEDGEMENTSThe authors thank I. J. Fidler (MD Anderson Cancer Center, Houston, TX,USA) for the human lung adenocarcinoma cell line PC14PE6, and P-C.Yang (National Taiwan University College of Medicine, Taipei, Taiwan)for the human lung adenocarcinoma cell line CL1-0. The authors thankthe Microarray and Gene Expression Analysis Core Facility of theNational Yang-Ming University VGH Genome Research Center (Taipei)for technical support and E.Y. Chuang (Bioinformatics and BiostatisticsCore, National Taiwan University, Taipei) for help with the ingenuitypathway analysis. The authors also thank G. Alzona Nisperos for editing.
REFERENCES1 Spiro SG, Silvestri GA. One hundred years of lung cancer. Am J
Respir Crit Care Med 2005; 172: 523–529.
a)
b)
c)
100
siRNA-scramble siRNA-TKT
AS2-siRNA-control
AS2-siRNA-TKT
AS2-siRNA-control
AS2-siRNA-TKT
75
50
VE
GF
% o
f scr
ambl
e co
ntro
lR
elat
ive
leak
age
area
25
15
10
5
0
0
FIGURE 7. Inhibition of transketolase (TKT) in PC14PE6/AS2 cells reduced
vascular endothelial growth factor (VEGF) secretion and vascular permeability.
a) Secretion of VEGF of PC14PE6/AS2 was calculated after transfection with
scramble siRNA or TKT siRNA and maintained in ultra-low attachment plate (n54).
**: p,0.01. b) Biological activity of VEGF secreted by PC14PE6/AS2 cells after
transfection with scramble siRNA or TKT siRNA was measured by the Miles
permeability assay. The dye leakage areas are marked by dashed red circles.
c) The areas of dye leakage were calculated for each injection site (n54). *: p,0.05.
THORACIC ONCOLOGY C-C. LIN ET AL.
1464 VOLUME 37 NUMBER 6 EUROPEAN RESPIRATORY JOURNAL

2 Coscio AM, Garst J. Lung cancer in women. Curr Oncol Rep 2006; 8:248–251.
3 Trompezinski S, Denis A, Schmitt D, et al. IL-10 is unable todownregulate VEGF expression in human activated keratinocytes.Arch Dermatol Res 2002; 294: 377–379.
4 Wu SG, Gow CH, Yu CJ, et al. Frequent EGFR mutations inmalignant pleural effusion of lung adenocarcinoma. Eur Respir J
2008; 32: 924–930.
5 Postmus PE, Brambilla E, Chansky K, et al. The IASLC Lung
Cancer Staging Project: proposals for revision of the M descriptorsin the forthcoming (seventh) edition of the TNM classification oflung cancer. J Thorac Oncol 2007; 2: 686–693.
6 Kassis J, Klominek J, Kohn EC. Tumor microenvironment: what
can effusions teach us? Diagn Cytopathol 2005; 33: 316–319.
7 Zebrowski BK, Yano S, Liu W, et al. Vascular endothelial growthfactor levels and induction of permeability in malignant pleural
effusions. Clin Cancer Res 1999; 5: 3364–3368.
8 Walker-Renard PB, Vaughan LM, Sahn SA. Chemical pleurodesisfor malignant pleural effusions. Ann Intern Med 1994; 120: 56–64.
9 Yeh HH, Lai WW, Chen HH, et al. Autocrine IL-6-induced Stat3activation contributes to the pathogenesis of lung adenocarcinomaand malignant pleural effusion. Oncogene 2006; 25: 4300–4309.
10 Chen YM, Tsai CM, Whang-Peng J, et al. Double signal stimulationwas required for full recovery of the autologous tumor-killing effectof effusion-associated lymphocytes. Chest 2002; 122: 1421–1427.
11 Su LJ, Chang CW, Wu YC, et al. Selection of DDX5 as a novelinternal control for Q-RT-PCR from microarray data using a blockbootstrap re-sampling scheme. BMC Genom 2007; 8: 140.
12 American Joint Committee on Cancer. Manual for Staging ofCancer. 5th Edn. Philadelphia, JB Lippincott, 1997.
13 Golub TR, Slonim DK, Tamayo P, et al. Molecular classification ofcancer: class discovery and class prediction by gene expressionmonitoring. Science 1999; 286: 531–537.
14 Landsittel D, Donohue-Babiak N. Effect of adding fold-changecriteria to significance testing of microarray data. J Statist Comput
Simul 2010; 80: 89–97.
15 Kerstens HM, Robben JC, Poddighe PJ, et al. AgarCyto: a novelcell-processing method for multiple molecular diagnostic analysesof the uterine cervix. J Histochem Cytochem 2000; 48: 709–718.
16 Al-Shahrour F, Minguez P, Tarraga J, et al. BABELOMICS: a systemsbiology perspective in the functional annotation of genome-scaleexperiments. Nucleic acids research 2006; 34: W472–W476.
17 Jimenez-Marin A, Collado-Romero M, Ramirez-Boo M, et al.
Biological pathway analysis by ArrayUnlock and IngenuityPathway Analysis. BMC Proc 2009; 3: Suppl. 4, S6.
18 Barnes DM, Harris WH, Smith P, et al. Immunohistochemicaldetermination of oestrogen receptor: comparison of differentmethods of assessment of staining and correlation with clinicaloutcome of breast cancer patients. Brit J Cancer 1996; 74: 1445–1451.
19 Gomez-Fernandez C, Jorda M, Delgado PI, et al. Thyroidtranscription factor 1: a marker for lung adenoarinoma in bodycavity fluids. Cancer 2002; 96: 289–293.
20 Szczepulska-Wojcik E, Langfort R, Roszkowski-Sliz K. [A compara-tive evaluation of immunohistochemical markers for the differentialdiagnosis between malignant mesothelioma, non-small cell carcinoma
involving the pleura, and benign reactive mesothelial cell prolifera-tion]. Pneumonol Alergol Pol 2007; 75: 57–69.
21 Chen YF, Chou CY, Wilkins RJ, et al. Motor protein-dependentmembrane trafficking of KCl cotransporter-4 is important forcancer cell invasion. Cancer Res 2009; 69: 8585–8593.
22 Rais B, Comin B, Puigjaner J, et al. Oxythiamine and dehydro-epiandrosterone induce a G1 phase cycle arrest in Ehrlich’s tumorcells through inhibition of the pentose cycle. FEBS Lett 1999; 456:113–118.
23 Warburg O. On the origin of cancer cells. Science 1956; 123: 309–314.24 Sanchez-Armengol A, Rodriguez-Panadero F. Survival and talc
pleurodesis in metastatic pleural carcinoma, revisited. Report of125 cases. Chest 1993; 104: 1482–1485.
25 Duysinx B, Corhay JL, Larock MP, et al. Prognostic value ofmetabolic imaging in non-small cell lung cancers with neoplasicpleural effusion. Nucl Med Commun 2008; 29: 982–986.
26 Langbein S, Zerilli M, Zur Hausen A, et al. Expression oftransketolase TKTL1 predicts colon and urothelial cancer patientsurvival: Warburg effect reinterpreted. Brit J Cancer 2006; 94: 578–585.
27 Tammali R, Ramana KV, Srivastava SK. Aldose reductaseregulates TNF-alpha-induced PGE2 production in human coloncancer cells. Cancer Lett 2007; 252: 299–306.
28 Kroemer G, Pouyssegur J. Tumor cell metabolism: cancer’sAchilles’ heel. Cancer Cell 2008; 13: 472–482.
29 Ryan HE, Lo J, Johnson RS. HIF-1 alpha is required for solidtumor formation and embryonic vascularization. EMBO J 1998; 17:3005–3015.
30 Lutz NW, Tome ME, Cozzone PJ. Early changes in glucose andphospholipid metabolism following apoptosis induction by IFN-c/TNF-a in HT-29 cells. FEBS Lett 2003; 544: 123–128.
31 Stathopoulos GT, Kollintza A, Moschos C, et al. Tumor necrosisfactor-alpha promotes malignant pleural effusion. Cancer Res 2007;67: 9825–9834.
32 Hunt TK, Aslam R, Hussain Z, et al. Lactate, with oxygen, incitesangiogenesis. Adv Exp Med Biol 2008; 614: 73–80.
33 Ojika T, Imaizumi M, Watanabe H, et al. [An immunohistochem-ical study on three aldolase isozymes in human lung cancer].Zasshi J 1992; 40: 382–386.
34 Mori S, Chang JT, Andrechek ER, et al. Anchorage-independentcell growth signature identifies tumors with metastatic potential.Oncogene 2009; 28: 2796–2805.
35 Zhang X, Xu LH, Yu Q. Cell aggregation induces phosphorylationof PECAM-1 and Pyk2 and promotes tumor cell anchorage-independent growth. Mol Cancer 2010; 9: 7.
36 Katare R, Andrea C, Emanueli C, et al. Benfotiamine improvesfunctional recovery of the infarcted heart via activation of pro-survival G6PD/Akt signaling pathway and modulation ofneurohormonal response. J Mol Cell Cardiol 2010; 49: 625–638.
37 Kwiatkowski DJ, Manning BD. Tuberous sclerosis: a GAP at thecrossroads of multiple signaling pathways. Hum Mol Genet 2005;14: R251–R258.
38 Ji H, Ramsey MR, Hayes DN, et al. LKB1 modulates lung cancerdifferentiation and metastasis. Nature 2007; 448: 807–810.
39 Lee DF, Kuo HP, Chen CT, et al. IKK beta suppression of TSC1links inflammation and tumor angiogenesis via the mTOR path-way. Cell 2007; 130: 440–455.
C-C. LIN ET AL. THORACIC ONCOLOGY
EUROPEAN RESPIRATORY JOURNAL VOLUME 37 NUMBER 6 1465