malnutrition and poverty in guatemala - world...
TRANSCRIPT
w4' MDat
POLICY RESEARCH WORKING PAPER 2967
Malnutrition and Poverty in Guatemala
Alessandra Marini
Michele Gragnolati
The World Bank
Latin America and the Caribbean Region
Human Development Sector UnitJanuary 2003
I POLICY RESEARCH WORKING PAPER 2967
Abstract
The objective of this paper is to document the extent and impact of income and of intergenerational effects.distribution of child and adult malnutrition in Education of adults in the household and the availabilityGuatemala; to analyze the relationship between selected of infrastructure are other important determinants ofchild, maternal, household and community children's growth attainment. Finally, even controllingcharacteristics and children's nutritional status; and to for income and other household and communityoutline the implications of the most important findings characteristics, ethnicity remains an importantfor nutritional policy. determinant of child nutritional status. The study also
The prevalence of chronic malnutrition among reveals an increasing prevalence of excess weights andGuatemalan children in 2000 was the highest in Latin obesity among children and adults. Overnutrition tendsAmerica and among the highest in the world. The data to be higher among individuals living in urban areas andshow very strong socioeconomic and geographic among non-poor and non-indigenous households.inequality. The econometric analysis reveals a strong
This paper-a product of the Human Development Sector Unit, Latin America and the Caribbean Region-is part of a largereffort in the region to study poverty and human development processes. Copies of the paper are available free from theWorld Bank, 1818 H Street NW, Washington, DC 20433. Please contact Michele Gragnolati, room MC11-234, telephone202-458-5287, fax 202-522-2955, email address [email protected]. Policy Research Working Papers are alsoposted on the Web at http://econ.worldbank.org. Alessandra Marini may be contacted at [email protected]. January2003. (54 pages)
The Policy Research Working Paper Series disseminates the findings of work ti progress to encourage the exchange of ideas about
development issues. An objective of the series is to get the findings out quickly, even if the presentations are less than fully polished. Thepapers carry the narmes of the authors and should be cited accordingly. The findings, interpretations, and conclusions expressed in thispaper are entirely those of the authors. They do not necessarily represent the view of the World Bank, its Executive Directors, or thecountries they represent.
Produced by the Research Advisory Staff
Malnutrition and Poverty in Guatemala
Alessandra Marini and Michele GragnolatiWorld Bank
The authors would like to thank Kathy Lindert (Task Manager of the Guatemala Poverty Assessment) forexceptional direction and for important comments and insights. Additional helpful comments andinsights were received by: Harold Alderman (World Bank), Caridad Araujo (U.C. Berkeley), ChrisBarrett (Comell University), Carlos Becerra (INE), Giuliano Caloia (World Bank), Carlos Cifuentes(INE), Joanne Csete (Human Rights Watch), Heidi Deman (INCAP), Hilda Fanny (INCAP), MaggieFisher (INCAP), Vivien Foster (World Bank), Ana Maria Ibanez (World Bank), Jerry La Forgia (WorldBank), Judy McGuire (World Bank), Adam Montes (INCAP), Patricia Reynoso (World Bank), DavidSahn (Comell University), Carlos Sobrado (World Bank), Eduardo Somensatto (World Bank), DianeSteele (World Bank), Emil Tesliuc (World Bank), Maurizia Tovo (World Bank), Renos Vakis (WorldBank).

Executive Summary
Some progress has been made towards understanding the causes and consequences of child malnutntionin the development of poor countries. Nevertheless, substantial gaps remain in our knowledge about thesize and distribution of health and nutrition problems, the determinants of health and nutnent status, theimpact of health and nutrition on socioeconomic development, and how to design appropriate nutritionalpolicies.
This document has two objectives. The first is to provide up-to-date information on the characteristics andpatterns of the nutritional status of children and adults in Guatemala using data from the ENCOVI/INEsurvey that was carried out in 2000. The second goal is to provide some guidelines and a set of concretepolicy recommendations for future action based on these findings.
The Prevalence of Chronic Child Malnutrition
Guatemala has among the worst indicators in the world m terms of child growth attainment. Not only isthe prevalence of chronic malnutrition in Guatemala (44 percent in 2000) much higher than in any othercountry in the Latin American and the Caribbean region, but it is also among the highest among allcountnes in the world for which reliable information is available. Although the prevalence of stuntedchildren in Guatemala has declined from 59 percent m 1987 to 44 percent m 2000, the percentage yearlyrate of change (less than 2 percent) has been the slowest in the Latin American and the Caribbean region.For example, between 1986 and 1996, Brazil (with a yearly rate of change of more than 6 percent)reduced chronic malnutrition three times faster than Guatemala.
Inequalitv
Our analysis shows very large differentials in the prevalence of child malnutrition among children ofdifferent socioeconomic and geographic groups. Malnutrition is concentrated among the poor, the leasteducated households, the rural population, and indigenous people. Only 16 percent of children in therichest quintile of households (in terms of per capita consumption) are chronically malnourished. Thecorresponding proportion is 62 percent among children in the poorest quintile. Only 20 percent ofchildren whose mother or father have more schooling than primary education are stunted. Thecorresponding figure is three times as high among children whose parents did not complete pnmaryeducation (60 percent). The prevalence of stunting is 31 and 50 percent in urban and rural areasrespectively. The prevalence of chronic malnutntion is almost twice as high among children ofindigenous families (58 percent) as among children of non-indigenous families (32 percent).
Determinants
Malnutrition is the product of the interaction of many factors, including individual and householddecisions, community infrastructures, the cultural and natural environment in which individuals live,national policies, and international economic conditions.
Poverty. High rates of malnutrition jeopardize future economic growth by reducing the mtellectual andphysical potential of the population. Malnutrition, therefore, contributes to creating poverty. Conversely,poverty boosts malnutntion by reducing an individuals' access to food and increasing their exposure todisease. In Guatemala, 64 percent of extremely poor and 53 percent of all poor children are stunted,while the corresponding figure for the non-poor is 28 percent.
2
Disease. Morbidities, especially diarrhea and respiratory infections, are both causes and consequences ofmalnutrition. Stunting rates are much higher among children with frequent exposure to diarrhea orrespiratory infections. Disease prevention and treatment, together with increasing the availability andimproving the quality of water and sanitation are critical for fighting chronic malnutrition.
Education and Literacy. The level of education attained by adults m a household is among the mostimportant determinants of children's growth attainment. The positive impact of parents' education onchild height can operate through different mechanisms, which are normally unrelated to the schoolcurriculum. Education can reflect a greater ability to acquire information (obtained through readingnewspapers, watching television, or listening to the radio) or a previous investment made by the family ofthe child's parents. Education can also have indirect effects by bringing an individual more income andgreater self-confidence.
Family Planning. Guatemala is characterized by a very high fertility rate and very low knowledge of birthcontrol methods, especially among the poor. Pregnancies at a young age, high numbers of children, andshort intra-birth intervals are associated with child deficient growth patterns.
Breastfeeding. Breastfeeding is one of the most important household actions that influence children'snutritional outcomes and that can be modified through policies and programs. Exclusive breastfeeding forat least the first six months of life provides a baby with an adequate source of nutrients and antibodies andeliminates the risks of illnesses associated with the use of infected utensils to feed formula. Moreover, ina country where contraceptive use is as low as in Guatemala, breastfeeding plays a major role inrepressing fertility by extending the duration of post-partum amenorrhoea.
Community Infrastructure. The availability of infrastructure such as piped water, flushable toilets,television, and garbage collection systems contribute to improving the nutritional status of chlldren.
Micronutrients
Although Guatemala is a pioneer in Central America in terms of in adopting micronutrient fortificationprograms, very few of its programs are successful, mostly because of interruptions in the service, weakregulation, and poor targeting. Up-to-date information is not available on the outcomes of such programs,and an in-depth and rigorous nationally representative evaluation of the impact of such programs shouldbe a priority for the government.
The Guatemalan people receive very little supplementation of iodine through salt and of folic acidthrough wheat flour. The percentage of women affected by anemia (35 percent in 1995) is the secondhighest in the Central Amencan region. Malnutrition among women is of particular concern because ofthe potential consequences for babies' birth weight and infant mortality.
Only 16 percent of Guatemalan infants surveyed in 1999 met the daily caloric requirement, and onlyabout one-third received an adequate intake of protein. Only 2 percent of the children in the sample haddiets that provided the recommended intake of iron. Most chlldren, however, did meet vitamin Arequirements.
Adult Undemutrition
The ENCOVI/NE collected anthropometric information for all individuals in the surveyed households,thus making it possible to do a complete study of the growth attainment of the entire Guatemalanpopulation.
3
Adult under-nutrition does not constitute a senous health concern in Guatemala. Less than 1 percent ofadults are classified as severe or moderate malnounshed, while 2 percent are mildly malnourished.Disaggregated figures indicate that urban adults tend to be fatter than rural individuals regardless of theireconomic status. There is no significant difference in Body-Mass Index (BMI), which is the preferredindicator of adult nutntional status, between indigenous and non-indigenous people. Adult mildmalnutrition is twice as high among extremely poor adults than among non-poor adults. Moderate andsevere malnutntion do not vary significantly with poverty status.
Obesity
Several studies document an increasing prevalence of excess weights and obesity among children inindustrialized countries, while less information is available for developing countries. ENCOVI/INE dataindicate that the prevalence of obese children in Guatemala increased from 2.7 to 5.4 percent between1987 and 2000. Obesity tends to be higher among children living in urban areas and among non-poor andnon-indigenous households. Guatemala is undergoing a rapid nutntional transition, charactenzed by theadoption of Western diets that are higher in saturated fats, sugar, and refined foods, which may explamthe observed pattern.
Adult over-nutrition constitutes a serious health concern in Guatemala. Guatemalan women have thehighest prevalence of obesity and excess weight in the Latin American region (16 and 32 percentrespectively). Moreover, both excess weight and obesity have increased in Guatemala over the last fewyears. Obesity has almost doubled between 1995 and 2000, increasing from 8.1 to 16.0 percent.
Recommendations
Because of the many causal mechanisms that are involved in promoting the growth of children, chronicmalnutrition is mostly mitigated by generally improving the living conditions of families. However,mcreasing household income is not enough to guarantee a reduction in malnutrition. Similarly, simplyaugmenting food production does not necessarily improve nutritional status; poor health and a lack ofaccess to basic health services could put children who have an adequate caloric intake at risk.
In countries like Guatemala, where almost half of all children are malnourished, it is vital that thegovernnent should take targeted and concerted actions in the areas of health, access to basic services,education, and specific nutntional interventions with the support of donors and the participation of civilsociety. These actions are needed to accelerate the decline in the prevalence of chronic malnutntion.Although it is not part of our study to analyze the government's strategy and programs addressing thedifferent aspects of malnutrition, we can make some comments on the existing framework andrecommendations on future actions. For many years, the government has tried to integrate its actions indifferent sectors with the aim of guaranteeing access to adequate amounts of food and ensuring theconditions necessary for a healthy lifestyle. However, so far, these different programs have only had avery limited effect.
Evidence shows that the following types of interventions are likely to be most successful in tackling thecauses of malnutntion among Guatemalan adults and children:
* Community-based Programs. A lack of appropriate nutrition information and mcorrect feedingpractices for infants and young children are key causes of child malnutntion. A person's nutritionalstatus improves largely due to changes in his or her behavior. Yet Guatemala has introduced very fewcommunity-based programs, which have proven to be successful in producing this change Inawareness and behavior In many countnes of Latin America. Analysis of different programs in other
4
parts of the world has also shown that community-based programs are the most cost-effectiveinterventions for child malnutrition.
* Mothers' Nutritional Status and Child Growth Monitoring. The government's current nutritionalstrategy focuses on feeding programs and school-based programs, which are not directly addressingthe most vulnerable groups, in other words, children under the age of two and pregnant women.
* Micronutrient Supplementation Programs. Guatemala's initial commitment to mucronutnentsupplementation programs and the relative success of the fortification of sugar with Vitamin A showthat the country's is capable of addressing the problem of malnutrition among the most vulnerablegroups. However, the failure of most of the other supplementation programs signals a need forproper monitoring of micro-nutritional programs and policies to bring Guatemala up to speed withinternational recommendations. In particular, the starting point should be the implementation of aninformation system to collect periodic and consistent data on micronutrient deficiency.
The following are the key groups that these programs should target:
* Preschool Children and Pregnant Women. Preschool children should be directly targeted, in contrastto most of the existing programs that only target children in school. Malnutrition does its greatestharm to children under 24 months old, which is the period of greatest brain development and greatestvulnerability. Children's malnutrition can be partly traced back to low birth weight (and, therefore, tomatemal malnutrition). Another critical period is between 6 and 24 months when infants make thetransition from being exclusively fed with breast milk (which provides all the nutrient and antibodiesneeded by the infant) to a diet of solid and liquid foods (often contaminated and of poor quality).
* Household-level Programs. Nutritional education programs are needed at the household level. Byemphasizing the importance of a more balanced diet, they could address both children's under-nutrition and the increasingly worrying phenomenon of adult over-nutrition.
At the moment there is no individual to whom the President, the Congress, Ministers, or donors can tumto for authoritative advice on nutrition. This lack of leadership and vision means that there is a lack ofdirection and prioritization among programs and that there are significant overlaps and gaps and muchinconsistency. It is necessary to address the leadership and organizational gap at the national level as soonas possible and to build into the process a system of oversight by civil society so that the overall direction,resources, and priorities do not change with each change of govemment.
Guatemala has the highest rate of chronic malnutrition in Latin America. Yet the govermnent's strategicframework appears to have no guiding vision on nutrition, no clear division of labor across ministries, noadequate control of resources, and no accountability. Nor is there a mechanism for assessing howprograms perform. Functional leadership is absent, and the lack of a clear vision about nutrition shared bygovemment and stakeholders alike means that nutrition is neglected in terms of both the mobilization andthe deployment of resources.
5
Introduction
"El Estado velara porque la alimentacion reuna los requisitos minimos de salud. Lasinstituciones especializadas del Estado deberan coordinar sus acciones entre si, o con
organismos internacionales dedicados a la salud, para lograr un sistema nacional efectivo. '
This paper was prepared as background for the World Bank's Poverty Assessment for Guatemala. Thefindings presented m the report are based on the Guatemalan Living Standard Measurement Survey(ENCOVI 2000/lNE), a nationally representative, multipurpose household survey carried out during theperiod from July to December 2000. ENCOVI 2000 data are available for 7,276 households (37,771individuals) located in urban and rural areas of 22 departments in eight regions all over Guatemala.
The objective of the present analysis is to document the presence and distribution of malnutrition amongchildren and adults, to analyze the relationship between selected child, maternal, household, andcommunity characteristics and children's nutritional status, and to outline the implications of the mostimportant findings for nutritional policy.
Guatemala is a very diverse country: demographically, geographically, ethnically, economically, andsocially. The total population of Guatemala in 1999 was approximately 11 million people, implying anaverage density of 96 people per square kilometer. Elevations range from sea level to about 3,800 meters.Despite the fact that one-fifth of the population lives in Guatemala City and that the country as a wholehas had a relatively high rate of population growth (2.6 percent between 1994 and 1999), Guatemala isthe least urbanized country in Central America, with only 39 percent of the people living in urban areas.Guatemala is divided into 22 administrative departments, each of which is divided into municipalities,which are comprised of individual communities. While Guatemala is the most populous country and thelargest economy in Central America, its rural and Mayan population still faces great difficulties, beingexcluded socially, economically and politically due to language and geographical barriers and to a lack ofeducation and economic opportunities.
Compared with other countries, Guatemala stands out as having an inordinately high rate of poverty forits level of per capita GDP. According to the most recent estimates, 56 percent of Guatemalan familieslived below the poverty line in 2000, which is defined as having msufficient income to purchase a basicbasket of goods and services. Among these, 16 percent were in extreme poverty, which means that theycould not afford a simple basic basket of food. These two figures are higher for the indigenous sub-population-76 percent and 27 percent respectively. 2
The poverty of Guatemalans is revealed indirectly by the anthropometric outcomes of their children. TheENCOVI 2000/INE, based on nationally representative cross-sectional data, gathered anthropometric dataon all individuals. It reveals that the prevalence of stunting (low height-for-age) among Guatemalanchildren under the age of three in 2000 (44 percent) was the highest in Latin America. Moreover, amongall countries for which there is reliable and comparable information, only Bangladesh and Yemen have a
"'The nation will make sure that food meets the minimum health requirements. The national institutions mustcoordinate their actions and cooperate with the international organizations that are working on health m order toachieve an effective national system", Constituci6n Politica de la RepObihca de Guatemala, Titulo II Derechos Humanos,Capitulo 11. Derechos Sociales, Seccion Septima "Salud, seguridad y Asistencia social", articulo 99. Alimentaci6n yNutricz6n
2 World Bank estimates based on ENCOVI 2000/NE.
6
higher prevalence of stunting-55 percent and 52 percent respectively. In addition, the prevalence ofunderweight children (low weight-for-age) in Guatemala was 22 percent, the highest in Latin America.The prevalence of wasting (low weight-for-height), however, was very low (2.8 percent). We presentthese findings, together with the analysis of pattems of under-nutrition by geographical area, children'sages, households' poverty status, and the ethnicity and education of the parents, in Part I. Part I alsocontains the results of our multiple linear regressions of the determinants of malnutntion in the populationand an analysis of the characteristics and pattems of micronutrient deficiency as well as the country'smost important supplementation programs. In Part II, we analyze adult malnutrition in Guatemala. Thefact that the ENCOVI/INE collected anthropometric information for all individuals in the surveyedhouseholds allowed us to make a complete study of the growth attainment of the entire Guatemalanpopulation, using the Body-Mass Index (BMI) as the preferred indicator of adult nutritional status. In PartIII, we explore the issue of excess weight and obesity among both children and adults, and in Part IV, wepresent our recommendations. Finally, in an appendix, we present the main indicators (bothanthropometrics and based on micronutrients) and the methodology that we used in the study.
I: Child Malnutrition in Guatemala
Malnutrition in young age carries sernous long-term consequences. Malnutrition increases the rnsks ofdeath and impairs cognitive development in children, affecting their future productivity and eamings.Often, malnourished children also lack essential micronutrients such as iodine, iron and vitamin A, whosedeficiency has serious consequences on health and leaming ability. The study will use bothanthropometric and mnicronutrient deficiency indicators to analyze the prevalence of malnutrition mGuatemala.
Anthropometrv
Based on the anthropometric measures (weight and height) collected by the ENCOVI/INE 2000, threenutritional indicators were calculated to assess children (less than 5 years old) malnutrition: (i) height forage (HFA), a measure of "stunting", or chronic malnutrition; (ii) weight for age (WFA), a measure ofunderweight; (iii) weight for height (WFH), a measure of "wasting" or acute malnutrition3 . The followingsections analyze the prevalence of child malnutrition in Guatemala using those anthropometric indicators.
Regional Comparisons. The prevalence of malnutrition is much higher in Guatemala than in itsneighboring Central American countries and than in any other country in Latin America (Table 1.1).4Also, malnutrition, as measured by the prevalence of stunting among children under the age of five,appears to be higher in Guatemala than in most of the other developing countries for which DHS data areavailable5. Moreover, acute malnutrition and underweight rates in Guatemala are higher than theprevalent rates in any other Central and Latin American country but are much lower than in other regionsof the world.
3For more details on the different mdicators of malnutrition, see Appendix 1.
4 The countries were selected based on available comparable data.
5 The Demographic and Health Surveys (DHS) are nationally representative household surveys that provide data for a wide rangeof monitoring and impact evaluation mdicators in the areas of population, health, and nutrtion. Two features of theENCOVI/INE 2000 differentiate it substantially from the DHS survey. First, detailed mformation was collected on householdexpenditure pattems in order to be able to construct an appropriate indicator of household resource availability. Second, theENCOVI collected anthropometric information for all household members, not just on preschool children and pregnant women.
7
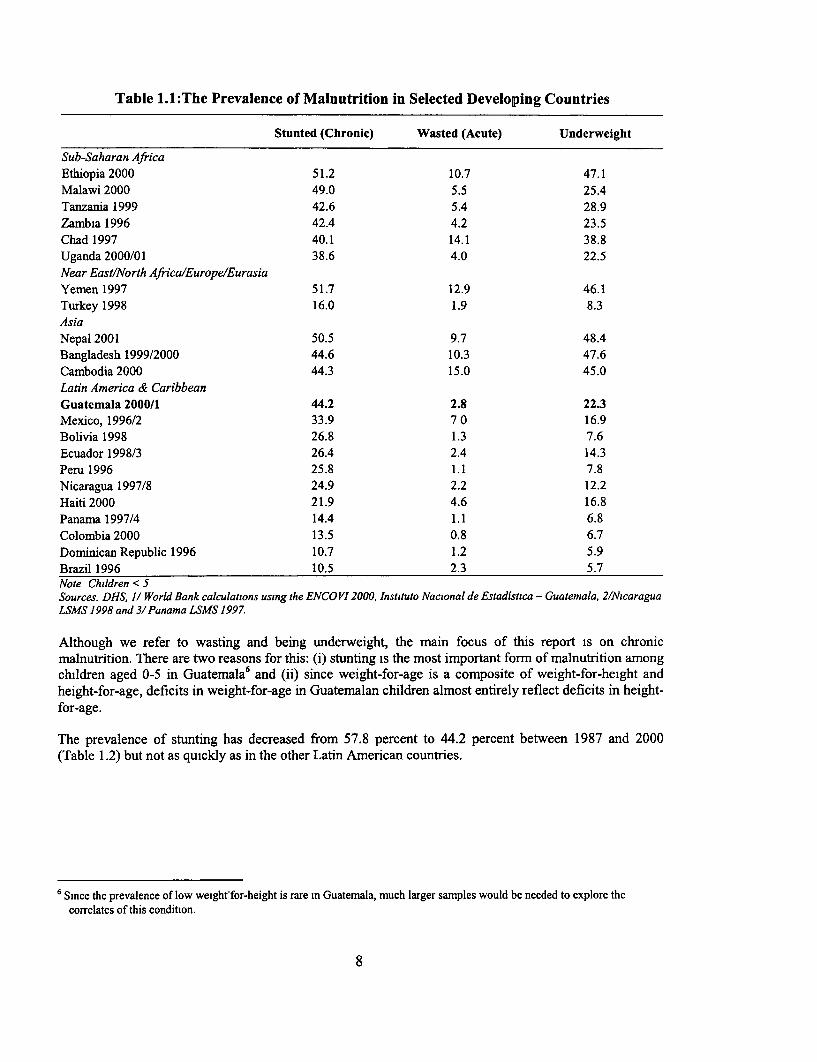
Table 1.1:The Prevalence of Malnutrition in Selected Developing Countries
Stunted (Chronic) Wasted (Acute) Underweight
Sub-Saharan AfricaEthiopia 2000 51.2 10.7 47.1Malawi 2000 49.0 5.5 25.4Tanzania 1999 42.6 5.4 28.9Zambia 1996 42.4 4.2 23.5Chad 1997 40.1 14.1 38.8Uganda 2000/01 38.6 4.0 22.5Near East/North Africa/Europe/Eurasia
Yemen 1997 51.7 12.9 46.1Turkey 1998 16.0 1.9 8.3AsiaNepal 2001 50.5 9.7 48.4Bangladesh 1999/2000 44.6 10.3 47.6Cambodia 2000 44.3 15.0 45.0Latin America & CaribbeanGuatemala 2000/1 44.2 2.8 22.3Mexico, 1996/2 33.9 7 0 16.9Bolivia 1998 26.8 1.3 7.6Ecuador 1998/3 26.4 2.4 14.3Peru 1996 25.8 1.1 7.8Nicaragua 1997/8 24.9 2.2 12.2Haiti 2000 21.9 4.6 16.8Panama 1997/4 14.4 1.1 6.8Colombia 2000 13.5 0.8 6.7Dominican Republic 1996 10.7 1.2 5.9Brazil 1996 10.5 2.3 5.7Note Children < 5Sources. DHS, 1/ World Bank calculations using the ENCO VI 2000, Instituto Nacional de Estadistica - Guatemala, 2/NicaraguaLSMS 1998 and 3/Panama LSMS 1997.
Although we refer to wasting and being underweight, the main focus of this report is on chronicmalnutrition. There are two reasons for this: (i) stunting is the most important form of malnutrition amongchildren aged 0-5 in Guatemala6 and (ii) since weight-for-age is a composite of weight-for-height andheight-for-age, deficits in weight-for-age in Guatemalan children almost entirely reflect deficits in height-for-age.
The prevalence of stunting has decreased from 57.8 percent to 44.2 percent between 1987 and 2000(Table 1.2) but not as quickly as in the other Latin American countries.
6 Since the prevalence of low weight-for-height is rare in Guatemala, much larger samples would be needed to explore thecorrelates of this condition.
8
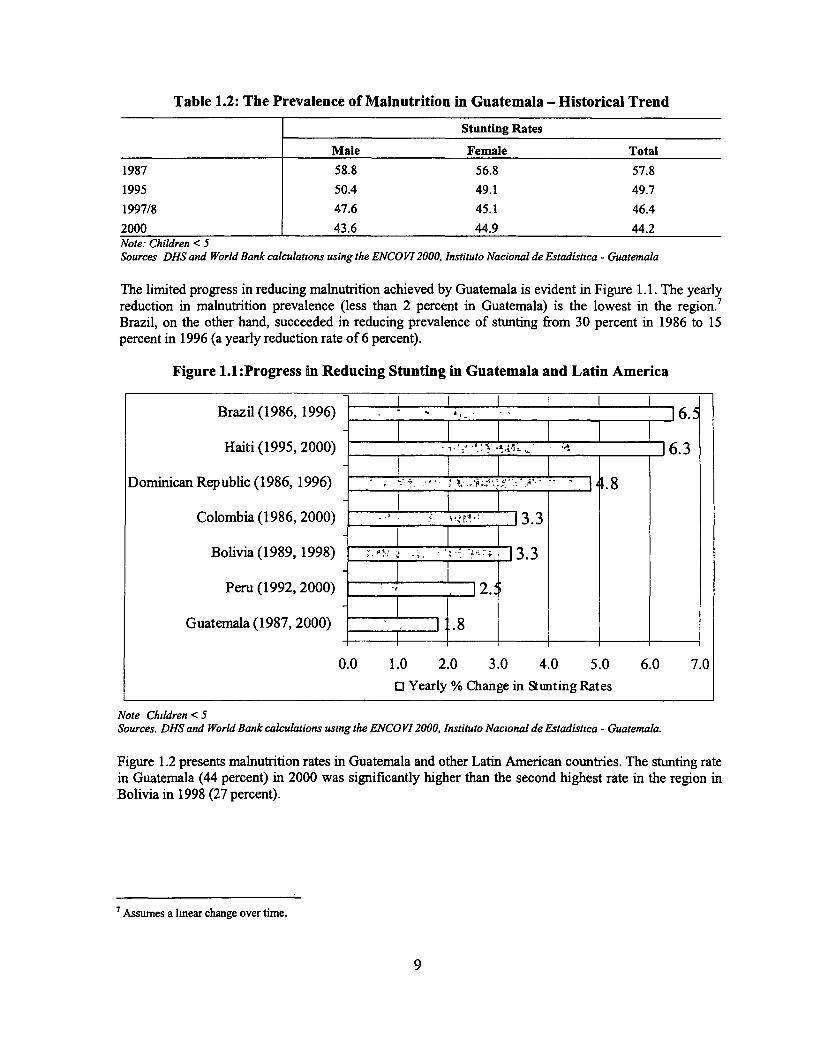
Table 1.2: The Prevalence of Malnutrition in Guatemala - Historical Trend
Stunting Rates
Male Female Total
1987 58.8 56.8 57.8
1995 50.4 49.1 49.7
1997/8 47.6 45.1 46.4
2000 43.6 44.9 44.2Note: Children < 5Sources DHS and World Bank calculations using the ENCO VI 2000, Instituto Nacional de Estadistica - Guatemala
The limited progress in reducing malnutrition achieved by Guatemala is evident in Figure 1.1. The yearlyreduction in malnutrition prevalence (less than 2 percent in Guatemala) is the lowest in the region.'Brazil, on the other hand, succeeded in reducing prevalence of stunting from 30 percent in 1986 to 15percent in 1996 (a yearly reduction rate of 6 percent).
Figure 1.1 :Progress in Reducing Stunting in Guatemala and Latin America
Brazil(1986, 1996) 16.
Haiti (1995, 2000) 16.3
Dominican Republic (1986, 1996) 4-. 8w7"'s-
Colombia (1986, 2000) 3.3
Bolivia (1989, 1998) '" ; ,'- 1.3
Peru (1992, 2000) 2..
Guatemala (1987, 2000) .8
0.0 1.0 2.0 3.0 4.0 5.0 6.0 7.0
o Yearly % Change in Stmting Rates
Note Children < 5Sources. DHS and World Bank calculations using the ENCO VI 2000, Instituto Nacional de Estadistica - Guatemala.
Figure 1.2 presents malnutrition rates in Guatemala and other Latin American countries. The stunting ratein Guatemala (44 percent) in 2000 was significantly higher than the second highest rate in the region inBolivia in 1998 (27 percent).
7 Assumes a lmear change over time.
9
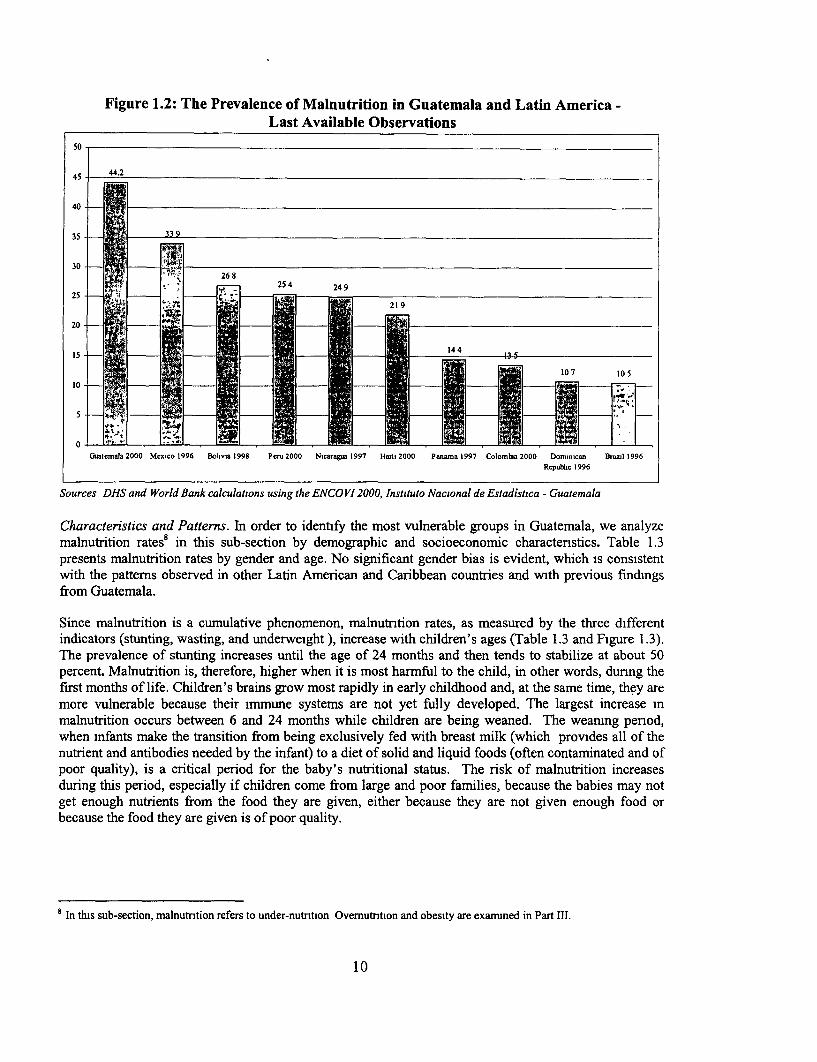
Figure 1.2: The Prevalence of Malnutrition in Guatemala and Latin America -Last Available Observations
so
45 442
40
35 _ 9
30
! 6 '-'; fi - ~~~~25 4 24 9
10
Guatemnals 2000 Mexico 1996 Bolivia 1998 Peru 2000 Nicaragua 1997 Haiti 2000 Panma 1997 Colombia 2000 Dominican Brazil 1996Republic 1996
Sources DHS and World Bank calculations using the ENCO VI 2000, Instituto Nacional de Estadistica - Guatemala
Characteristics and Patterns. In order to identify the most vulnerable groups in Guatemala, we analyzemalnutrition rates8 in this sub-section by demographic and socioeconomic characternstics. Table 1.3presents malnutrition rates by gender and age. No significant gender bias is evident, which is consistentwith the pattems observed in other Latin American and Caribbean countries and with previous findingsfrom Guatemala.
Since malnutrition is a cumulative phenomenon, malnutrition rates, as measured by the three differentindicators (stunting, wasting, and underweight ), increase with children's ages (Table 1.3 and Figure 1.3).The prevalence of stunting increases until the age of 24 months and then tends to stabilize at about 50percent. Malnutrition is, therefore, higher when it is most harmful to the child, in other words, dunng thefirst months of life. Children's brains grow most rapidly in early childhood and, at the same time, they aremore vulnerable because their immune systems are not yet fully developed. The largest increase inmalnutrition occurs between 6 and 24 months while children are being weaned. The weanig pernod,when infants make the transition from being exclusively fed with breast milk (which provides all of thenutrient and antibodies needed by the infant) to a diet of solid and liquid foods (often contaminated and ofpoor quality), is a critical period for the baby's nutritional status. The risk of malnutrition increasesduring this period, especially if children come from large and poor families, because the babies may notget enough nutrients from the food they are given, either because they are not given enough food orbecause the food they are given is of poor quality.
8 In this sub-section, malnutntion refers to under-nutntion Ovemutntion and obesity are examined in Part III.
10
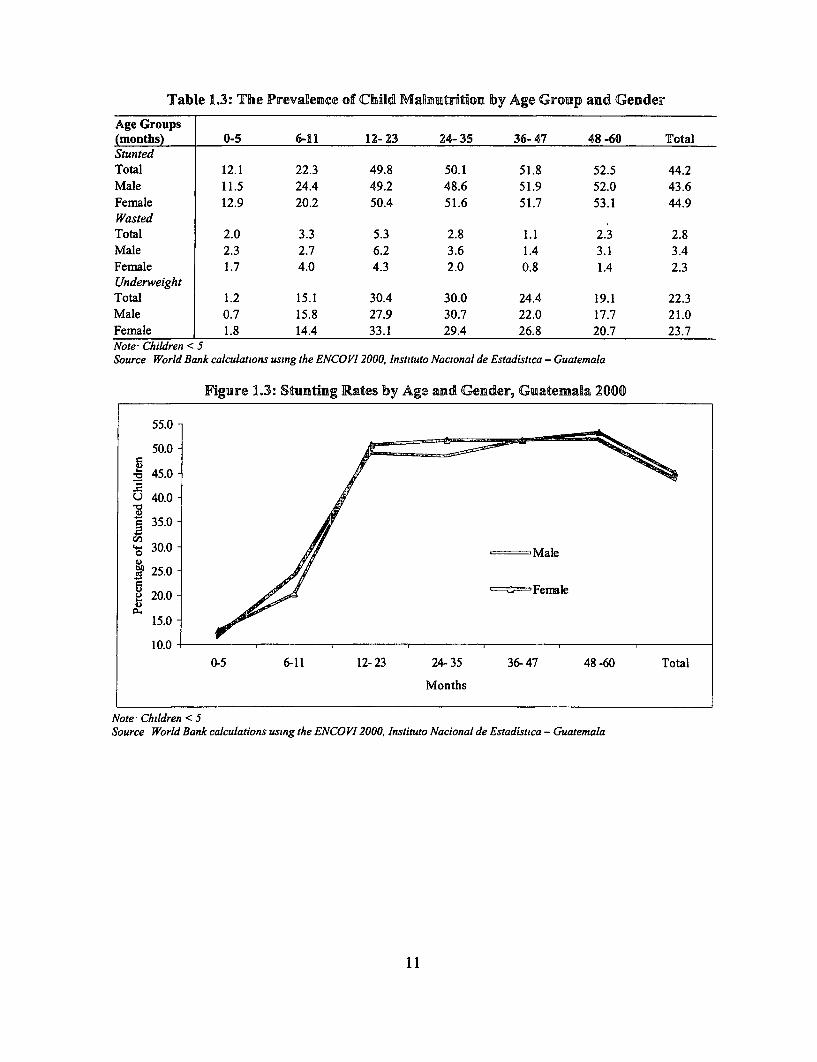
Table 1.3: The Prevalence of Child MaRmutrition by Age Group andl Gender
Age Groups(months) 0-5 6-11 12- 23 24- 35 36- 47 48 -60 TotalStuntedTotal 12.1 22.3 49.8 50.1 51.8 52.5 44.2Male 11.5 24.4 49.2 48.6 51.9 52.0 43.6Female 12.9 20.2 50.4 51.6 51.7 53.1 44.9WastedTotal 2.0 3.3 5.3 2.8 1.1 2.3 2.8Male 2.3 2.7 6.2 3.6 1.4 3.1 3.4Female 1.7 4.0 4.3 2.0 0.8 1.4 2.3UnderweightTotal 1.2 15.1 30.4 30.0 24.4 19.1 22.3Male 0.7 15.8 27.9 30.7 22.0 17.7 21.0Female 1.8 14.4 33.1 29.4 26.8 20.7 23.7Note Children < 5Source World Bank calculations using the ENCOVI12000, Instituto Nacional de Estadistica - Guatemala
Figure 1.3: Stunting Rates by Age and Gender, Guatemala 2000
55.0
50.0-
. 45.0 -
U 40.0-
350.0-
30.0 - Male
25.0-
20.0 -5 -=;-,-Fenale
15.0-
10.00-5 6-11 12- 23 24- 35 36- 47 48 -60 Total
Months
Note Children < 5Source World Bank calculations using the ENCOVI 2000, Instituto Nacional de Estadisuica - Guatemala
11
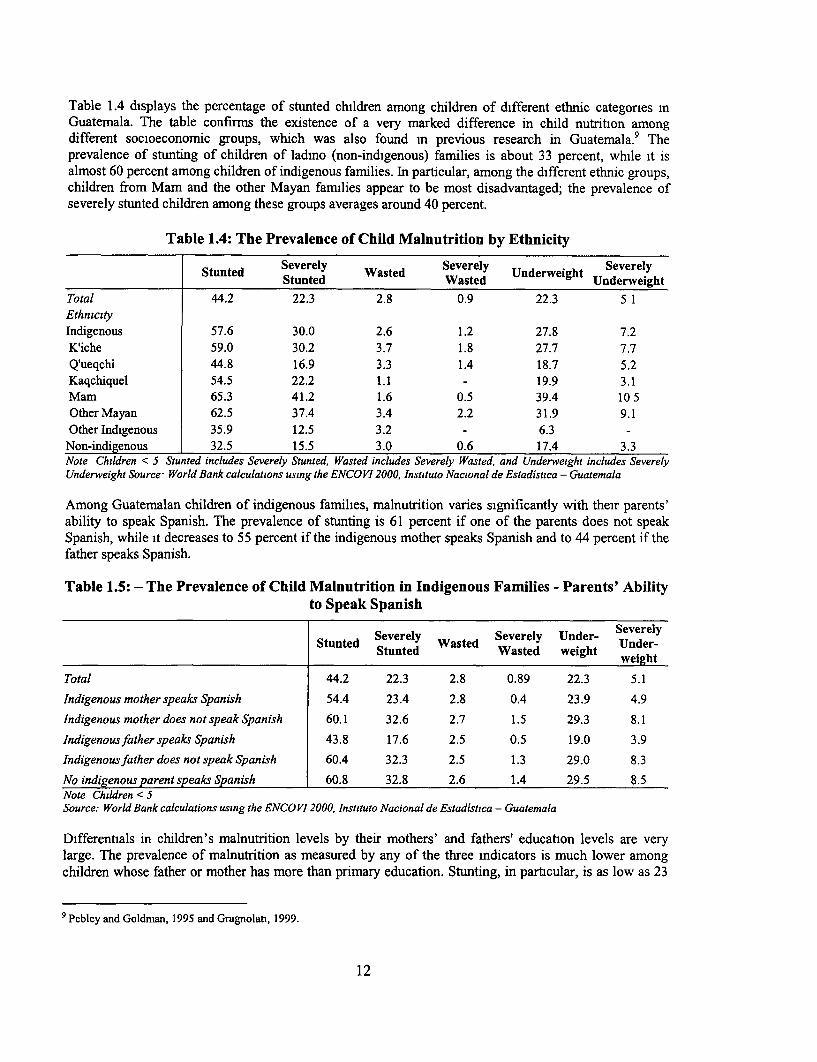
Table 1.4 displays the percentage of stunted children among children of different ethnic categones mGuatemala. The table confirms the existence of a very marked difference in child nutrition amongdifferent socioeconomic groups, which was also found m previous research in Guatemala. 9 Theprevalence of stunting of children of ladmo (non-indigenous) families is about 33 percent, while it isalmost 60 percent among children of indigenous families. In particular, among the different ethnic groups,children from Mam and the other Mayan families appear to be most disadvantaged; the prevalence ofseverely stunted children among these groups averages around 40 percent.
Table 1.4: The Prevalence of Child Malnutrition by Ethnicity
Stunted Severely Wasted Severely Underweight Severely________________ ~~Stunted Wasted Underweightunewgt
Total 44.2 22.3 2.8 0.9 22.3 5 1EthnicityIndigenous 57.6 30.0 2.6 1.2 27.8 7.2
K'iche 59.0 30.2 3.7 1.8 27.7 7.7Q'ueqchi 44.8 16.9 3.3 1.4 18.7 5.2Kaqchiquel 54.5 22.2 1.1 - 19.9 3.1Mam 65.3 41.2 1.6 0.5 39.4 10 5Other Mayan 62.5 37.4 3.4 2.2 31.9 9.1Other Indigenous 35.9 12.5 3.2 - 6.3 -
Non-indigenous 32.5 15.5 3.0 0.6 17.4 3.3Note Children < 5 Stunted includes Severely Stunted, Wasted includes Severely Wasted, and Underweight includes SeverelyUnderweight Source* World Bank calculations using the ENCO VI 2000, Instituto Nacional de Estadistica - Guatemala
Among Guatemalan children of indigenous families, malnutrition varies significantly with their parents'ability to speak Spanish. The prevalence of stunting is 61 percent if one of the parents does not speakSpanish, while it decreases to 55 percent if the indigenous mother speaks Spanish and to 44 percent if thefather speaks Spanish.
Table 1.5: - The Prevalence of Child Malnutrition in Indigenous Families - Parents' Abilityto Speak Spanish
Stunted Severely Wasted Severely Under- SUedrelyStunted Wasted weight weight
Total 44.2 22.3 2.8 0.89 22.3 5.1
Indigenous mother speaks Spanish 54.4 23.4 2.8 0.4 23.9 4.9
Indigenous mother does not speak Spanish 60.1 32.6 2.7 1.5 29.3 8.1
Indigenousfather speaks Spanish 43.8 17.6 2.5 0.5 19.0 3.9
Indigenous father does not speak Spanish 60.4 32.3 2.5 1.3 29.0 8.3
No indigenous parent speaks Spanish 60.8 32.8 2.6 1.4 29.5 8.5Note Children < 5Source: World Bank calculations using the ENCO VI 2000, Instituto Nacional de Estadistica - Guatemala
Differentials in children's malnutrition levels by their mothers' and fathers' education levels are verylarge. The prevalence of malnutrition as measured by any of the three mdicators is much lower amongchildren whose father or mother has more than primary education. Stunting, in particular, is as low as 23
9 Pebley and Goldman, 1995 and Gragnolati, 1999.
12

percent. Note also that mothers' primary education is associated with lower child malnutrition rates thanfathers' primary education (40 percent and 45 percent respectively). If both parents are illiterate, then theprevalence of malnutrition as defined by any of the three indicators (stunting, wasting, and underweight)reaches the highest levels (60 percent, 3 percent, and 32 percent respectively).
Table 1.6: The Prevalence of Child Malnutrition by Parents' Education
Stunted Severely Wated Severely Under- Severely Under-Stnted Stunted Wasted weight weight
Total 44.2 22.3 2.8 0.89 22.3 5.1Mother has no education 56.5 32.3 3.5 1.2 30.4 8.7Mother has primary education 39.9 16.9 2.5 0.8 18.4 3.1Mother has more than primary education 22.6 10.8 2.0 0.2 10.6 1.0Father has no education 58.1 31.9 2.9 0.9 31.6 7.9Father has primary education 45.2 22.4 2.6 1.0 22.7 5.0Father has more than primary education 23.3 8.5 2.6 0.5 7.0 1.3Both parents have no education 60.4 34.1 3.4 1.2 32.2 9.5Note: Children < SSource World Bank calculations using the ENCOVI 2000, Instituto Nacional de Estadistica - Guatemala.
Figures in Table 1.7 confirm the existence of a very marked gradient in the nutritional status of childrenfrom families with different compositions. In particular, children of households with many siblingsyounger than five years old are worse off. The prevalence of stunting reaches 76 percent if there are sixchildren in the household, whereas it is only 33 percent in households with only one child. In contrast, ahigher number of adult women in the household is associated with lower levels of children malnutrition,which indicates that children receive extra care and assistance in households with many women members.The prevalence of chronic malnutrition is slightly lower for children living m households headed bywomen than in those headed by men
13
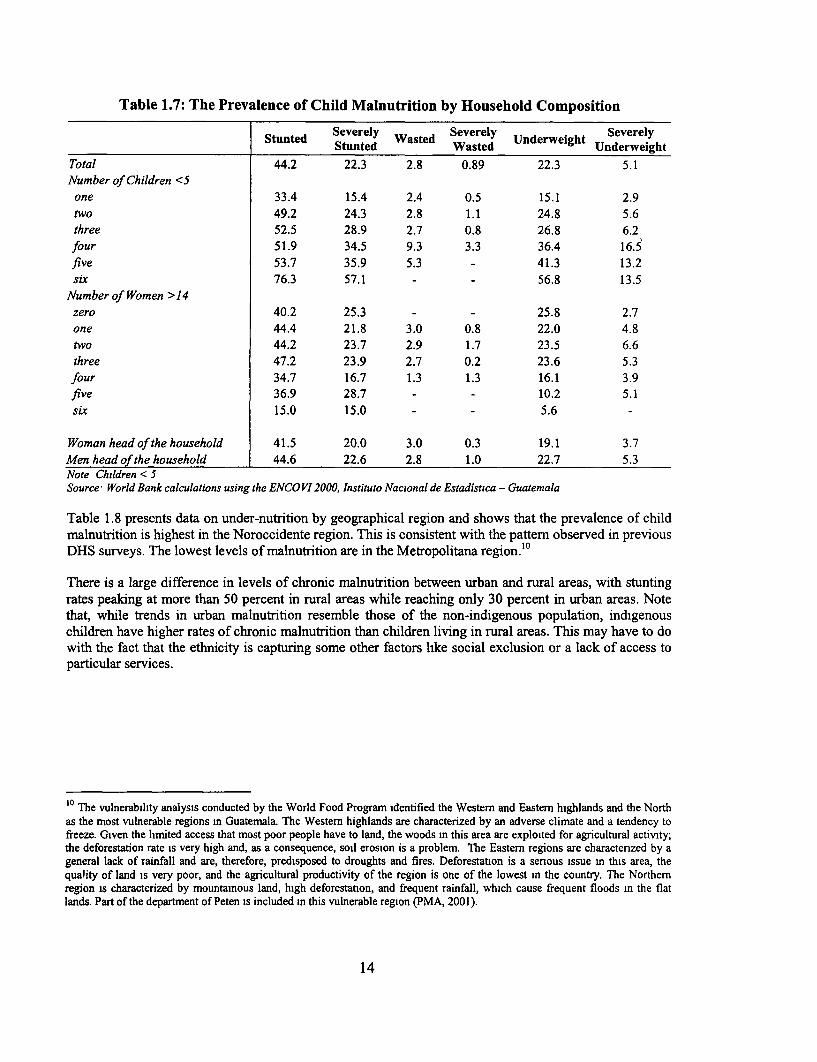
Table 1.7: The Prevalence of Child Malnutrition by Household Composition
Stunted Severely Wasted Severely Underweight SeverelyStunted Wasted Underweight
Total 44.2 22.3 2.8 0.89 22.3 5.1Number of Children <S
one 33.4 15.4 2.4 0.5 15.1 2.9two 49.2 24.3 2.8 1.1 24.8 5.6three 52.5 28.9 2.7 0.8 26.8 6.2four 51.9 34.5 9.3 3.3 36.4 16.5five 53.7 35.9 5.3 - 41.3 13.2six 76.3 57.1 - - 56.8 13.5
Number of Women >14zero 40.2 25.3 - - 25.8 2.7one 44.4 21.8 3.0 0.8 22.0 4.8two 44.2 23.7 2.9 1.7 23.5 6.6three 47.2 23.9 2.7 0.2 23.6 5.3four 34.7 16.7 1.3 1.3 16.1 3.9five 36.9 28.7 - - 10.2 5.1six 15.0 15.0 - - 5.6 -
Woman head of the household 41.5 20.0 3.0 0.3 19.1 3.7Men head of the household 44.6 22.6 2.8 1.0 22.7 5.3Note Children < 5Source World Bank calculations using the ENCOVI 2000, Instituto Nacional de Estadistica - Guatemala
Table 1.8 presents data on under-nutrition by geographical region and shows that the prevalence of childmalnutrition is highest in the Noroccidente region. This is consistent with the pattern observed in previousDHS surveys. The lowest levels of malnutrition are in the Metropolitana region.'°
There is a large difference in levels of chronic malnutrition between urban and rural areas, with stuntingrates peaking at more than 50 percent in rural areas while reaching only 30 percent in urban areas. Notethat, while trends in urban malnutrition resemble those of the non-indigenous population, indigenouschildren have higher rates of chronic malnutrition than children living in rural areas. This may have to dowith the fact that the ethnicity is capturing some other factors like social exclusion or a lack of access toparticular services.
10 The vulnerability analysis conducted by the World Food Program identified the Western and Eastern highlands and the Northas the most vulnerable regions m Guatemala. The Westem highlands are characterized by an adverse climate and a tendency tofreeze. Given the limited access that most poor people have to land, the woods in this area are exploited for agricultural activity;the deforestation rate is very high and, as a consequence, soil erosion is a problem. The Eastern regions are charactenzed by ageneral lack of rainfall and are, therefore, predisposed to droughts and fires. Deforestation is a senous issue in this area, thequality of land is very poor, and the agricultural productivity of the region is one of the lowest in the country. The Northernregion is characterized by mountainous land, high deforestation, and frequent rainfall, which cause frequent floods in the flatlands. Part of the department of Peten is included in this vulnerable region (PMA, 2001).
14
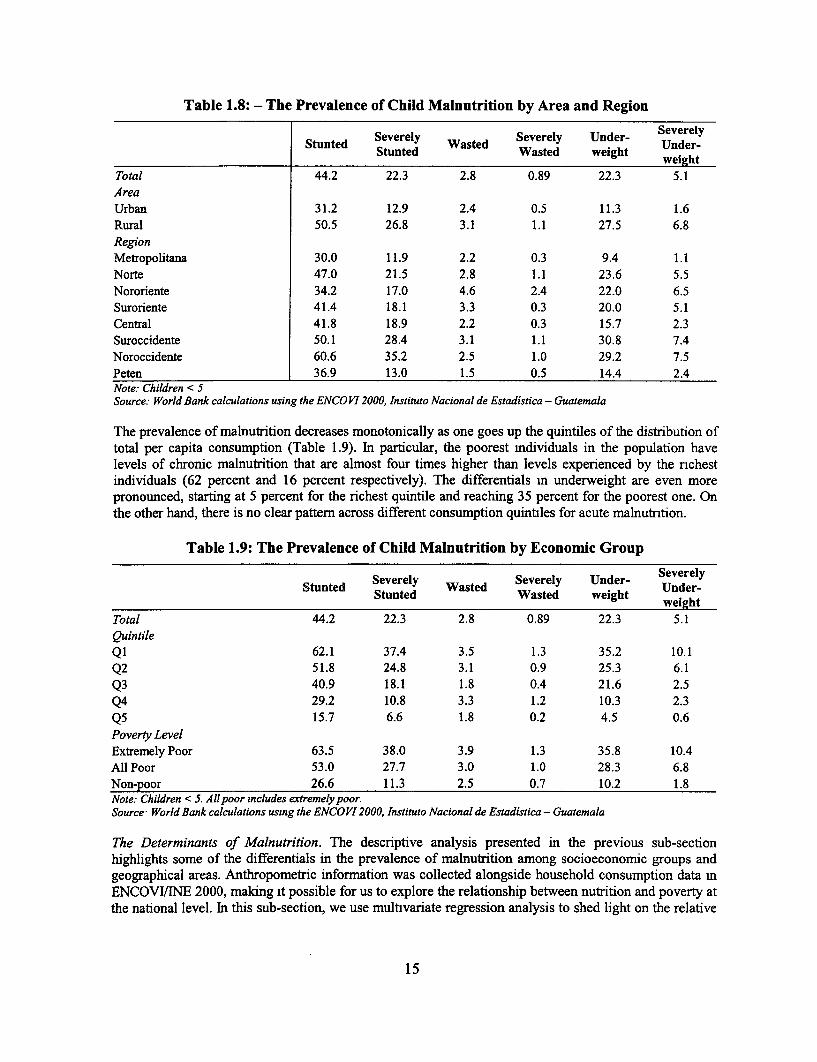
Table 1.8: - The Prevalence of Child Malnutrition by Area and Region
Severely Severely Under- Severelytunted SSed asted W Sed wer- Under-Stunted Wasted weight weight
Total 44.2 22.3 2.8 0.89 22.3 5.1AreaUrban 31.2 12.9 2.4 0.5 11.3 1.6Rural 50.5 26.8 3.1 1.1 27.5 6.8RegionMetropolitana 30.0 11.9 2.2 0.3 9.4 1.1Norte 47.0 21.5 2.8 1.1 23.6 5.5Nororiente 34.2 17.0 4.6 2.4 22.0 6.5Suroriente 41.4 18.1 3.3 0.3 20.0 5.1
Central 41.8 18.9 2.2 0.3 15.7 2.3Suroccidente 50.1 28.4 3.1 1.1 30.8 7.4Noroccidente 60.6 35.2 2.5 1.0 29.2 7.5Peten 36.9 13.0 1.5 0.5 14.4 2.4Note: Children < 5Source: World Bank calculations using the ENCO VI 2000, Instituto Nacional de Estadistica - Guatemala
The prevalence of malnutrition decreases monotonically as one goes up the quintiles of the distribution oftotal per capita consumption (Table 1.9). In particular, the poorest mdividuals in the population havelevels of chronic malnutrition that are almost four times higher than levels experienced by the nchestindividuals (62 percent and 16 percent respectively). The differentials In underweight are even morepronounced, starting at 5 percent for the richest quintile and reaching 35 percent for the poorest one. Onthe other hand, there is no clear pattern across different consumption quintiles for acute malnutrition.
Table 1.9: The Prevalence of Child Malnutrition by Economic Group
Severely Severely Under- Severelytunted Sasted W. Under-Stunted Wasted weight weight
Total 44.2 22.3 2.8 0.89 22.3 5.1QuintileQl 62.1 37.4 3.5 1.3 35.2 10.1Q2 51.8 24.8 3.1 0.9 25.3 6.1Q3 40.9 18.1 1.8 0.4 21.6 2.5Q4 29.2 10.8 3.3 1.2 10.3 2.3Q5 15.7 6.6 1.8 0.2 4.5 0.6Poverty LevelExtremely Poor 63.5 38.0 3.9 1.3 35.8 10.4All Poor 53.0 27.7 3.0 1.0 28.3 6.8Non-poor 26.6 11.3 2.5 0.7 10.2 1.8Note: Children < 5. All poor includes extremely poor.Source World Bank calculations using the ENCOVI 2000, Instituto Nacional de Estadistica - Guatemala
The Determinants of Malnutrition. The descriptive analysis presented in the previous sub-sectionhighlights some of the differentials in the prevalence of malnutrition among socioeconomic groups andgeographical areas. Anthropometric information was collected alongside household consumption data mENCOVITiNE 2000, making it possible for us to explore the relationship between nutrition and poverty atthe national level. In this sub-section, we use multivariate regression analysis to shed light on the relative
15
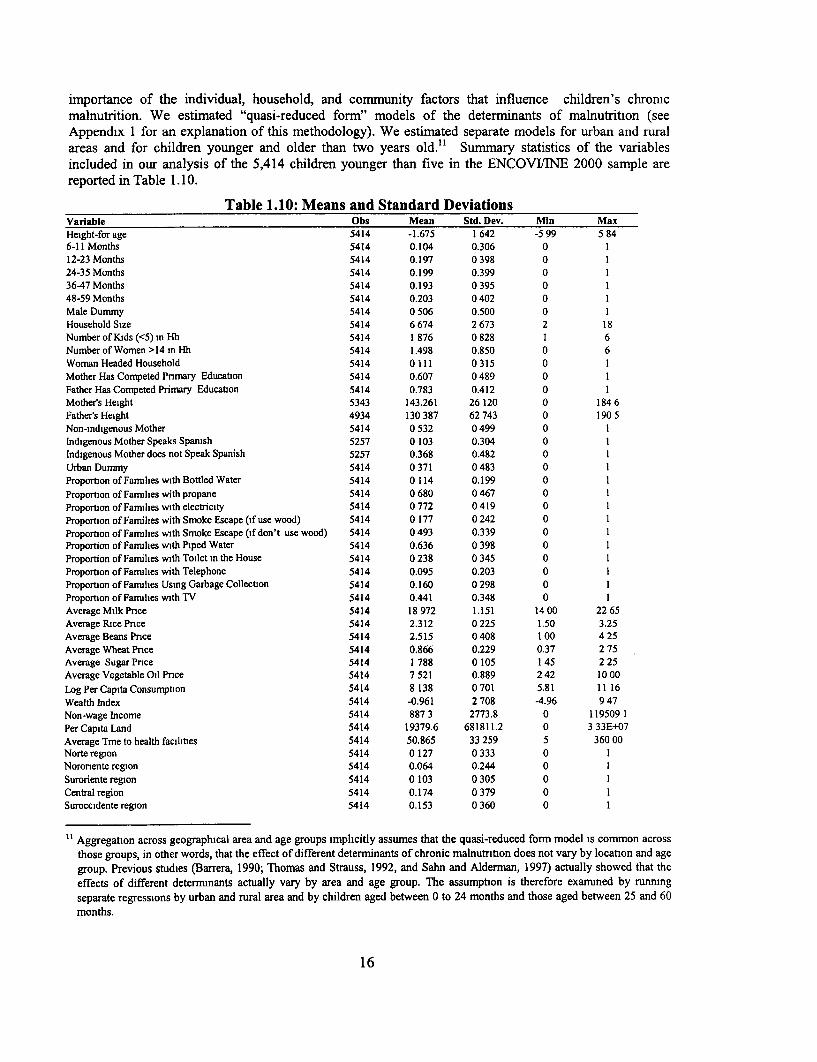
importance of the individual, household, and community factors that influence children's chronicmalnutrition. We estimated "quasi-reduced form" models of the determinants of malnutrition (seeAppendix 1 for an explanation of this methodology). We estimated separate models for urban and ruralareas and for children younger and older than two years old." Summary statistics of the variablesincluded in our analysis of the 5,414 children younger than five in the ENCOVI/INE 2000 sample arereported in Table 1. 10.
Table 1.10: Means and Standard DeviationsVariable Obs Mean Std. Dev. Min MaxHeight-for age 5414 -1.675 1 642 -5 99 5 846-11 Months 5414 0.104 0.306 0 112-23 Months 5414 0.197 0 398 0 124-35 Months 5414 0.199 0.399 0 136-47 Months 5414 0.193 0 395 0 148-59 Months 5414 0.203 0 402 0 1Male Dummy 5414 0 506 0.500 0 1Household Size 5414 6 674 2 673 2 18Number of Kids (<5) in Hh 5414 1 876 0 828 1 6NumberofWomen>14inHh 5414 1.498 0.850 0 6Woman Headed Household 5414 0111 0315 0 1Mother Has Comnpeted Pnmary Education 5414 0.607 0489 0 1Father Has Competed Primary Education 5414 0.783 0.412 0 1Mother's Height 5343 143.261 26 120 0 184 6Father's Height 4934 130 387 62 743 0 190 5Non-indigenous Mother 5414 0 532 0 499 0 1Indigenous Mother Speaks Spanish 5257 0 103 0.304 0 1Indigenous Mother does not Speak Spanish 5257 0.368 0.482 0 1Urban Dummy 5414 0 371 0 483 0 1Proportion of Families with Bottled Water 5414 0 114 0.199 0 1Proportion of Families with propane 5414 0 680 0 467 0 1Proportion of Families with electricity 5414 0772 0419 0 1Proportion of Families with Smoke Escape (if use wood) 5414 0 177 0 242 0 1Proportion of Famulies with Smoke Escape (if don't use wood) 5414 0 493 0.339 0 1Proportion of Farmlies with Piped Water 5414 0.636 0 398 0 1Proportion of Families with Toilet in the House 5414 0 238 0 345 0 1Proportion of Families with Telephone 5414 0.095 0.203 0 1Proportion of Families Using Garbage Collection 5414 0.160 0 298 0 1Proportion of Families with TV 5414 0.441 0.348 0 1Average Milk Pnce 5414 18 972 1.151 14 00 22 65Average Rice Pnce 5414 2.312 0225 1.50 3.25Average Beans Pnce 5414 2.515 0 408 1 00 4 25Average Wheat Pnce 5414 0.866 0.229 0.37 2 75Average Sugar Pnce 5414 1 788 0 105 1 45 2 25Average Vegetable Oil Pnce 5414 7 521 0.889 2 42 10 00
LogPerCapita Consumption 5414 8 138 0 701 5.81 11 16Wealth Index 5414 -0.961 2 708 -4.96 9 47Non-wage Income 5414 887 3 2773.8 0 119509 1Per Capita Land 5414 19379.6 681811.2 0 3 33E+07Average Tme to health facilities 5414 50.865 33 259 5 360 00Norte region 5414 0 127 0 333 0 1Noronente region 5414 0.064 0.244 0 1Suroriente region 5414 0 103 0 305 0 1Central region 5414 0.174 0 379 0 1Suroccidente region 5414 0.153 0 360 0 1
Aggregation across geographical area and age groups implicitly assumes that the quasi-reduced form model is common acrossthose groups, in other words, that the effect of different determinants of chronic malnutntion does not vary by location and agegroup. Previous studies (Barrera, 1990; Thomas and Strauss, 1992, and Sahn and Alderman, 1997) actually showed that the
effects of different determnants actually vary by area and age group. The assumption is therefore examined by running
separate regressions by urban and rural area and by children aged between 0 to 24 months and those aged between 25 and 60
months.
16

Noroccidente region 5414 0195 0396 0 1Peten region 5414 0.099 0.299 0 1
Note: Children < 5Source World Bank calculations using the ENCOV12000, Instituto Nacional deEstadistica - Guatemala, Expanded sample
The children included in the analysis are between 0 and 59 months old. There are about the same numberof boys and girls in the sample, and the average age is 29 months. Sahn and Alderman (1997) highlightedthe fact that there are cohort-specific differences in how different practices affect nutritional outcomes.Specifically, the impact of household resources, education, and other factors on nutritional outcomes maybe hidden and the results may be misleading if heterogeneous age groups are aggregated. Therefore, inexamining the determinants of nutrition, we controlled for six different age groups (0-6, 7-12, 13-24, 25-36, 37-48, 49-59). We also included gender to determine if malnutrition is worse among girls thanamong boys, which is typical in Asian countries but which, as mentioned before, is not a common patternin Latin America.
Including household size in the model permitted us to assess the extent to whlch children of largerhouseholds are more vulnerable to malnutrition. We also included three other household structurevariables in the model. First, we included the number of children underfive years old to control for thecompetition among siblings for matemal care and for nurturing time among preschool siblings. Second,we mcluded the number of women older than 14 years to account for potential additional attention thatchildren might receive. Third, we mcluded the headship of the household variable to explore thehypothesis that children living in households headed by women are better nourished.
The findings of previous studies provide strong evidence on the importance of parents' height onchildren's growth attainment.' 2 In addition to capturing genetic mfluences, the variable parents' heighthas been interpreted as representing unobserved family background characteristics.' 3 Mother's height isexpected to have a stronger effect than father's height since the mother is recognized to have anenvironmental effect through the womb. Household surveys typically collect anthropometric informationonly about children and mothers and, therefore, only a few studies have also controlled for fathers' height.The ENCOVINE 2000 collected information on all household members, meaning that we could includedata on the height of both parents in our regression, which allowed us to control for both genetic factorsand other human capital and environmental factors.
Many past studies have examined the effect of parents' educational attainment, especially the mother's,on children's nutrntional status. Dummy variables for either parent having completed primary educationare included in our model.
In order to control for the availability of household resources, we included instrumented per capitahousehold consumption. We used non-wage income, ownership of household assets, and land asidentifying instruments.' 4
The proportion of households with access to safe water andflush toilets is included to proxy the sanitaryconditions of the community in which the child grew up.15 In urban communities, 50 percent of the
12 Horton (1986) and Barrera (1990).
'3 Thomas, Strauss, and Henriques (1990).
14 The predicting equation explains three-quarters of the variation in per capita consumption (R2= 0.74). The t- statistics for
household assets is 36.2, for non-wage income it is 9.5, and for land it is -0 6. Parents' education is also an important predictorof per capita consumption. The results of the first-stage regressions are available upon request from the authors.
'5 Individuals' access to basic services (such as water and sanitation) is not included in the model as it is considered endogenousto nutitional status, in other words, it is believed that parents decide jomtly on access to basic services and on their children's
17

households have flush toilets16 and 87 percent have piped water (either in the household or outside thehousehold), while less than I percent and 50 percent respectively have these amenities m rural areas. Theproportion of households that use bottled water is included to account for individuals' awareness ofhygienic and sanitation issues as well as for the access of the community to the market distributionsystem. The proportion of households with access to private or public garbage collection systems is alsoincluded to reflect the general hygienic conditions of the community. The proportion of households with atelephone and a television is included to account for the fact that households vary in terns of their accessto information. Households' access to health services in the community is approximated by the travel timeto the nearest health center. Note that in urban areas the average travel time to any health center is 38minutes, while it is 59 minutes in rural areas. Finally, we included food prices because price levelsmfluence the type of products that individuals can afford and, therefore, indirectly affect the population'snutritional status.17 Due to the fact that there was a lot of missing information on prices at the clusterlevel"', we used rural and urban departmental averages. The prices included refer to the most commonstaples-milk, beans, rice, wheat, cooking oil, and sugar.
The parameter estimates for the different models are reported in Table 1.11.
Table 1.11:Parameter Estimates of Reduced-form ModelsIndependent Variables (1) (2) (3) (4) (5)
Total Urban Rural <24 months >24 monthsLog per capita consumption 0.69317 027357 1.19135 0.30365 1 00187
(7.11)*** (2.16)* (7.93)*** (1.91)* (8 18)***6-11 months -1 01547 -0.85117 -1 11537 -I 00322
(II 23)*** (5.57)*** (9 85)*** (10 38)***12-23 months -1 83484 -1.50801 -2.02700 -I 80397
(23 46)*** (11 92)*** (20 26)*** (21 60)*** -24-35 months -1.79383 -1.26729 -2.05850 - 0.13613
(22.97)*** (9.89)*** (20.80)*-* - (2 12)**36-47 months -1.93175 -1.50925 -2 15033 - 0 00000
(24 40)e** (II 34)*** (21.66)** - (0.00)***48-59 months -1.86781 -1.30637 -2 14750 - 0 03236
(24.19)*** (10 35)*** (21.82)*** - (0 51)Male Dummy -0 04225 -0.13620 0 01204 -0.05733 -0.03136
(1.02) (1.97)* (0.23) (0.83) (0.61)Household Size -0 00362 -0 05525 0 02957 -0 02828 0 00906
(027) (2.29)** (1.74)* (I 24) (055)Number of Kids (<5) in the Household -0.04627 0 09457 -0.07183 -0.00696 -0 05816
(I 57) (1.70)* (1.98)** (0.14) (I 63)Numberof Women >14 in the Household 010563 012713 007510 012025 010550
(3 03)*** (2.14)** (I 68)* (2 04)** (2 45)**Woman Headed Household 0.21049 0 27778 0.05618 -0 06260 0 37629
(2.46)** (2 23)** (0.47) (0 42) (3.60)***Mother Has Completed Pnmary Education 0 04590 0.32436 -0 02933 0.10764 -0 02921
(0.89) (2 99)*** (0.48) (1.27) (0 45)Father Has Completed Pnmary Education 0.08645 020619 0.01506 0 18270 003741
(1.51) (1.59) (0 22) (I 85) (0 54)Mother's Height 001509 0 01676 0.01340 0 01778 0 01501
(6 49)5** (3.33)*** (4.94)*** (3 72)*** (5.76)***
health. Therefore, information on the availability of community-level infrastructure is included, here proxied by the proportionof households in the cluster with access to specific facilities.
16 Flush toilets were defined as "inodoro conectado a red de drenaje or a fosa septica," in other words, toilets connected to adrainage system or septic tank.
" Alderman (2000).
IS The data are charactenzed by two levels of sampling: children are grouped within households and households are groupedwithin clusters, or census-segment Census segments are 50-60 contiguous households, i.e. the amount of work that one censusworker can accomplish in the designated penod of time.
18
Father's Height 0.00103 000317 -0.00105 0 00025 0 00155(2.27)** (4 80)*** (I 67) (0.32) (2.80)***
Indigenous Mother Speaks Spanish -0 24665 -0.29121 -0 26497 -0.23774 -0 22586(3.31)*** (2.68)*** (2.56)** (I 93)* (2 43)**
Indigenous Mother Does Not Speak Spanish -0.30460 -0 27612 -0 26616 -0 16726 -0 37572(4.90)*** (2.21)0* (3.51)0*4 (I 59) (4 91)***
Urban Dummy -014848 -2 49220 0.00000 -019293 -0.12713(2.00)** (1.32) (0 00)*** (I 56) (1.38)
Proportion of Families with Bottled Water 0.20226 0.38155 0.19361 0 50462 0 00000(I 26) (1.96)** (067) (I 83)* (000)
Proportion of Families with Propane 0 16391 0.28704 0.04793 0 19610 0 10717(2.49)** (0.99) (0.63) (I 79)* (1 31)
Proportion of Families with Electricity -0.12197 -0.40228 -0.14200 -0 01375 -0.18701(1.86)* (0 61) (1.97)** (0.13) (2 28)**
Proportion of Fam. with Smoke Escape (if Use Wood) -0.10148 0.00987 -0.11958 0 09530 -0.17055(0.83) (0 03) (0 80) (0.45) (1.14)
Proportion of Fam w/o Smoke Escape (if Use Wood) 0 10222 0 06600 0 13277 0 27161 -0.01447(0 94) (0.31) (0.95) (1.51) (0.11)
Proportion of Families with Piped Water 0.01811 0.45983 -0 01171 0.08544 -0.03309(0.28) (2.69)*** (0 16) (0 80) (0 41)
Proportion of Families with Toilet in the House 0.04172 -0 27286 0.14485 -0 22228 0 26342(0.35) (1.80)* (0.61) (I 12) (I 74)*
Proportion of Families with FLxed Telephone 0 09679 0.32968 0.00537 0 05573 0.10959(0.53) (I 62) (0.01) (0.19) (0.48)
Proportion of Fam. using Garbage Collection -0 01029 0.04811 -0.43885 0 51495 -0 39854(008) (0.31) (I 31) (2.35)** (2.40)*
Proportion of Families with Tv 0.12864 0.35413 -0.03723 0.13261 005873(1.02) (I 53) (0 22) (0.63) (0.38)
Average Quotation of Milk Pnce -0 02646 -0 01623 -0.04556 -0 03328 -0 02606(1.29) (0 45) (I 76)* (1.03) (O 99)
Average Quotation of Rice Pnce -0 19462 -0 51298 -0 00344 -0 28292 -0 14472(1.79)* (2.63)ee (0 03) (1.63) (I 04)
Average Quotation of Beans Price -0 08362 0.20631 -0 14327 -0.19851 -0.02689(1.22) (1.47) (1.71)* (I 72)* (032)
Average Quotation of Wheat Pnce 0 14316 0 38412 -0.02982 0 30488 0 05637(1.61) (2.27)** (0.25) (1.92)* (0 53)
Average Quotation of Sugar Price -0.20374 -1.83935 0.23321 0.30705 -0 68803(0.78) (3.39)*** (0.74) (0.70) (2 II)**
Averge Quotation of Vegetable Oil Pnce -0.01003 -0 01715 -0 01948 -0.02687 -0 01150(0.41) (0.34) (0 64) (0.65) (0 38)
Average Travel Time to Health Facilities 0.00063 -0 00032 0.00052 0 00110 0 00006(0.89) (0.18) (0.64) (0 91) (0.07)
Norte region 0 70615 0 73045 0 46470 0 88232 0 52181(5.93)*** (3.41)*** (2 34)** (4 56)*** (3.47)***
Noronente region 0 64318 0.52651 0.41698 0 80086 0 49146(6 22)*** (2.92)*** (2 29)** (4 66)*** (3 79)***
Suronente region 0.42287 0.32302 0.27281 0 44567 0.35864(3.86)*** (1.73)* (1.44) (2.45)** (2 63)***
Central region 0.30171 0 01308 014237 0 27839 0.27682(3.15)*** (0.10) (078) (1.75)* (2.33)**
Suroccidente region 0.27316 -0.03070 0 11917 0 36594 0 13243(2.61)*** (0 21) (0 62) (2.08)** (I 02)
Noroccidente region 0 27126 0.25159 0.03067 0.34802 0 16527(2.49)** (1.34) (0.16) (1.94)* (1.21)
Peten region 0.77960 1.00927 0 38877 1 06978 0.54033(5.63)*** (3 91)*** (1.78)* (4 70)** (3 12)***
Constant -7.17773 0.00000 -10.60430 -5 08103 -10 58764(6.78)*** (0.00)*** (6 95)*** (2 95)*** (7.94)***
Observations 4723 1737 2986 1953 2770R-squared 0.28 0.26 0 28 0.28 0 23Note: Absolute value of t-statistics in parentheses;* significant at 5% level; ** significant at 5% level, * significant at 1%levelSource- World Bank calculations using the ENCOVI 2000, Instituto Nacional de Estadistica - Guatemala
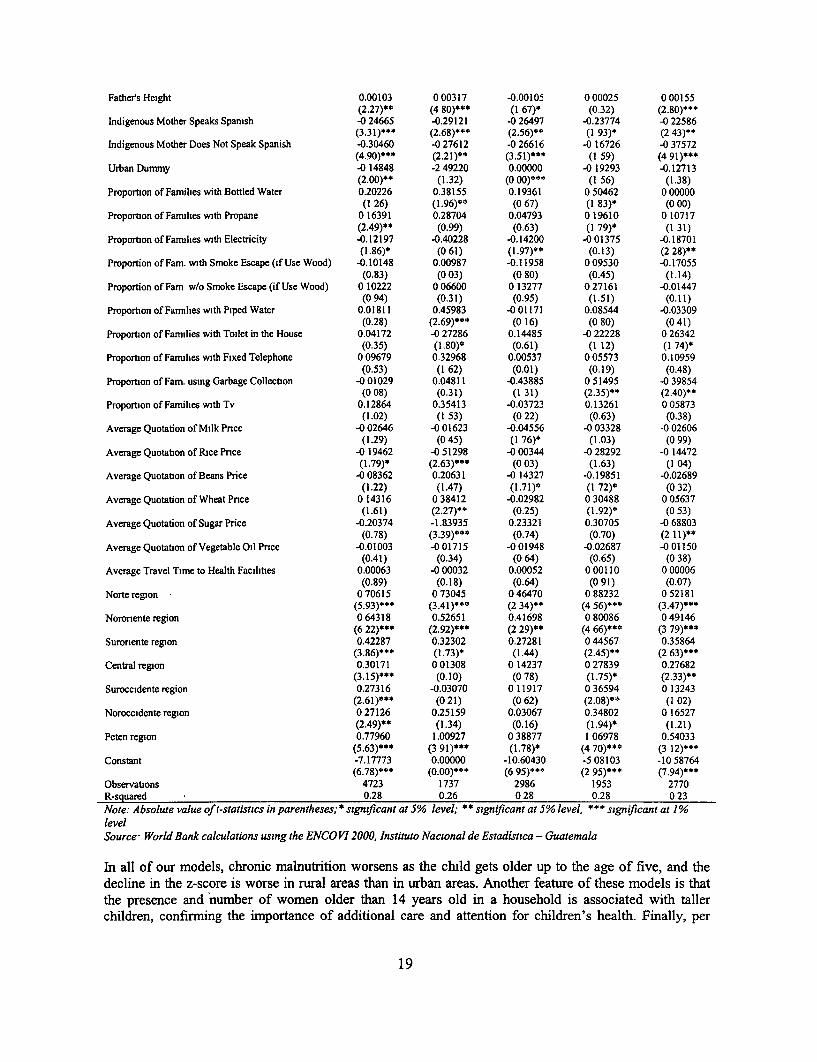
In all of our models, chronic malnutrition worsens as the child gets older up to the age of five, and thedecline in the z-score is worse in rural areas than in urban areas. Another feature of these models is thatthe presence and number of women older than 14 years old in a household is associated with tallerchildren, confirming the importance of additional care and attention for children's health. Finally, per
19
capita (predicted) consumption has a very significant and positive effect on chlldren's nutntional status,signaling the importance of the availability of resources and confirming the stnct relationship betweenpoverty and malnutrition.
Indigenous children are significantly smaller than non-indigenous children, even after controlling forincome, education, and infrastructure, all of which the indigenous population has less of than the non-indigenous population. Large differentials m chronic malnutrition by ethnicity may reflect socialexclusion or other forms of differential access to services that are not captured in this model.'9 Moreover,the ability of indigenous women to speak Spanish is associated with better nutritional outcomes for theirchildren. Not being able to speak Spamsh often precludes indigenous families from using health facilitiesas, in some health centers, nurses and doctors do not speak any language but Spanish.20
There is a strong relationship between a mother's height and that of her child. As expected, the mfluenceof a father's height is significant but is less than the influence of the mother's height because of themother's additional effect on her children's nutritional status through the womb.
The distance to the nearest health facility is also included to measure access to health care services.However, this variable does not capture the quality of such services, which might explain its lack ofexplanatory power.
Note that when the effect of most exogenous vanables is controlled for, living in the Metropolitan region(the excluded regional dummy) is not associated with better nutritional outcomes.
Some coefficients differ by age group and by geographical area. For example, having access to a flushtoileel has a significant positive effect on the nutritional outcome of older children but has no significantimpact on children younger than two years old. A possible explanation is that little children do not usetoilets very much, and therefore their growth patterns are not likely to be affected by the presence of aflush toilet in the household.
Parental education has a positive and significant effect on children's nutritional status. On the one hand,education helps parents' (especially mothers') to understand how to manage nutrition, disease, andsanitation most effectively. On the other hand, education influences other socioeconomic characteristicslike the age at which women marry, the number of children they have, and their status withm thecommunity. Different patterns are observed for mothers and fathers when exogenous factors arecontrolled for. In urban areas, children of educated mothers have a significantly better growth pattern thanchildren of mothers with no schooling, while in rural areas education seems not to matter as much asother factors such as income or the presence of women in the household. There are significant differencesin growth patterns between young children of educated fathers and children of fathers with no education.
No gender bias is observed apart from in urban areas where boys have worse nutntional outcomes thangirls. This may be explained by the fact that, in urban areas, more boys than girls work outside the home,and working children no only have higher nutritional needs but they are also away from home where theyhave access to food, for most of the day. The absence of any significant gender effect is consistent withfindings for other Latin American countries and, in general, for all countries except those in the Asianregion.
19 See Part II for an analysis of the nutritional gap between indigenous and non-indigenous children.
20 See QPES, section 5 on Basic Services, "Percepciones de Servicios e Infraestructura Gubemamnentales."
21 Flush toilet was defined as "inodoro conectado a red de drenaje" or "inodoro conectado afosa septuca"
20
In urban areas, large households negatively affect children's long-term nutritional status, while in ruralareas, it is specifically the number of children in the household that has a negative effect on children'sheight. The parents' attention matters more for older children for whom living in a household headed by awoman has a positive influence.
The proportion of households with access to piped water is positively correlated with long-termimprovements in nutritional status in urban areas, while it has no effect in rural areas. The combination ofthe positive effect of being connected to piped water with the negative effect of bad water quality mayexplain the lack of significance of having piped water in rural area. There is evidence that, when theconnection to piped water is established, individuals immediately stop treating the water, because theyassociate the new piped water connection with safe and drinkable water, which is not often the case. Theproportion of households using bottled water is positively associated with growth in children's height inurban areas and in the case of older children. A limited distribution system in rural areas and the limitedaccess that rural dwellers have to marketed goods may explain why bottled water has no effect on peopleliving in rural areas. At the same time, prolonged breastfeeding prevents younger children from beingaffected one way or the other by the use of bottled water.
Indigenous children are significantly more malnourished than non-indigenous children. Indigenouschildren have a variety of characteristics that may lower their height relative to non-indigenous children,in particular the fact that they tend to live in low-income households but also they tend to live in ruralareas and have less-educated parents, for example. Even after controlling for income and other householdand individual characteristics, ethnicity is still an important determinant of child growth attainment.
The difference in stunting rates between indigenous and non-indigenous children can, therefore, reflectdifferences in their endowments but also differences in their access to services (exclusion),discrimination, and unobserved factors. Here we use the Oaxaca-Blinder technique to determine theproportion of the nutrition gap in height-for-age z scores that is due to the two potentialsources-endowments and unobserved factors including discrimination. Using the Oaxaca decomposition,the difference between average z scores for indigenous and non-indigenous children can be decomposedas follows:
HAZi - HAZni = [(Bi - Bni)*Xni] + [Bi*(Xi - Xni)].
The first term on the right-hand side is the difference in the value of endowments between indigenous andnon-indigenous children multiplied by the average endowment of non-indigenous children. It representsthe "unexplained" difference in malnutrition, which in part can be interpreted as evidence ofdiscrimination. The second term is the difference in the average levels of human capital and otherendowments between indigenous and non-indigenous children, multiplied by the value of one unit of Xfor indigenous children. This portion is normally referred to as the "explained" difference or difference inendowments.22
Our analysis of the z-score differential in Guatemala using the Oaxaca decomposition reveals that therewas a significant gap in children's malnutrition in 2000. Thirty-five percent of this nutritional gap isexplained by the different characteristics of indigenous and non-indigenous children and their households,and the remaining 65 percent is due to unobserved characteristics, including discrimination. The resultsare very different if different weights are employed, in other words, the difference in endowment explains89 percent of the nutritional differential when the non-indigenous coefficients are used instead of the
22 The Oaxaca decomposition is a valuable and easy tool, but it has some limitations and the results must therefore be mterpretedcarefully. Omitting some relevant variables could yield an underestimation of the portion of the gap that is due to difference tnendowments.
21
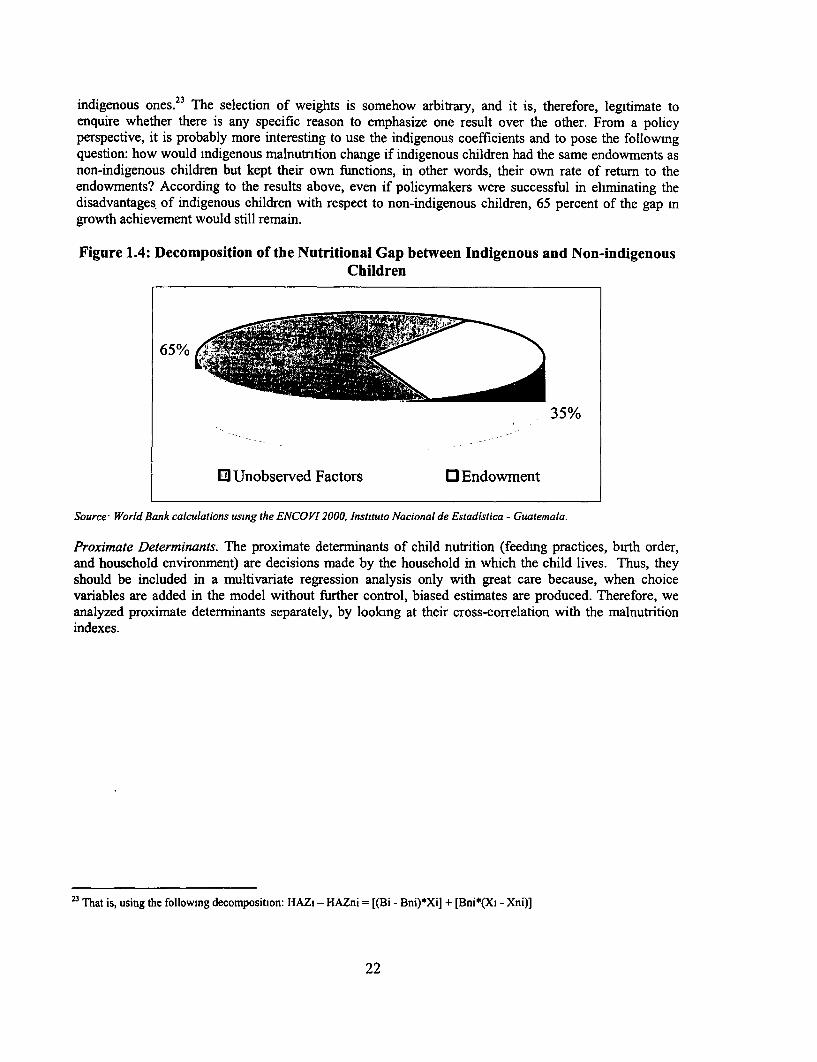
indigenous ones.23 The selection of weights is somehow arbitrary, and it is, therefore, legitimate toenquire whether there is any specific reason to emphasize one result over the other. From a policyperspective, it is probably more interesting to use the indigenous coefficients and to pose the followingquestion: how would indigenous malnutntion change if indigenous children had the same endowments asnon-indigenous children but kept their own functions, in other words, their own rate of return to theendowments? According to the results above, even if policymakers were successful in eliminating thedisadvantages of indigenous children with respect to non-indigenous children, 65 percent of the gap mgrowth achievement would still remain.
Figure 1.4: Decomposition of the Nutritional Gap between Indigenous and Non-indigenousChildren
65%%
35%
0) Unobserved Factors O Endowment
Source World Bank calculations using the ENCOVI 2000, Instituto Nacional de Estadistica - Guatemala.
Proximate Determinants. The proximate determinants of child nutrition (feedmg practices, birth order,and household environment) are decisions made by the household in which the child lives. Thus, theyshould be included in a multivariate regression analysis only with great care because, when choicevariables are added in the model without further control, biased estimates are produced. Therefore, weanalyzed proximate determinants separately, by looking at their cross-correlation with the malnutritionindexes.
23 That is, using the followmng decomposition: HAZi - HAZni = [(Bi - Bni)*Xi] + [Bni*(XI - Xni)]
22
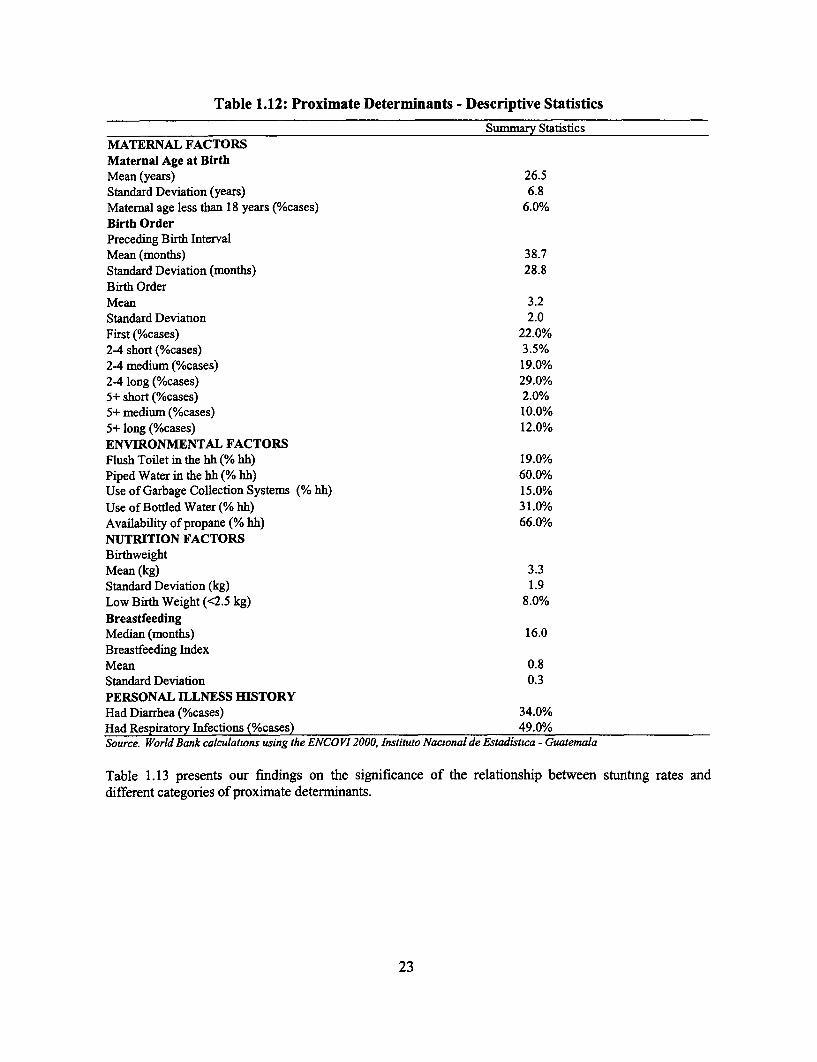
Table 1.12: Proximate Determinants - Descriptive Statistics
Summary StatisticsMATERNAL FACTORSMaternal Age at BirthMean (years) 26.5Standard Deviation (years) 6.8Maternal age less than 18 years (%cases) 6.0%Birth OrderPreceding Birth IntervalMean (months) 38.7Standard Deviation (months) 28.8Birth OrderMean 3.2Standard Deviation 2.0First (%cases) 22.0%2-4 short (%cases) 3.5%24 medium (%cases) 19.0%24 long (%cases) 29.0%5+ short (%cases) 2.0%5+ medium (%cases) 10.0%5+ long (%cases) 12.0%ENVIRONMENTAL FACTORSFlush Toilet in the hh (% hh) 19.0%Piped Water in the hh (% hh) 60.0%Use of Garbage Collection Systems (% hh) 15.0%Use of Bottled Water (% hh) 31.0%Availability of propane (% hh) 66.0%NUTRITION FACTORSBirthweightMean (kg) 3.3Standard Deviation (kg) 1.9Low Birth Weight (<2.5 kg) 8.0%BreastfeedingMedian (months) 16.0Breastfeeding IndexMean 0.8Standard Deviation 0.3PERSONAL ILLNESS HISTORYHad Diarrhea (%cases) 34.0%Had Respiratory Infections (%cases) 49.0%Source. World Bank calculations using the ENCOVI 2000, Instituto Nacional de Estadistica - Guatemala
Table 1.13 presents our findings on the significance of the relationship between stuntmg rates anddifferent categories of proximate determiinants.
23
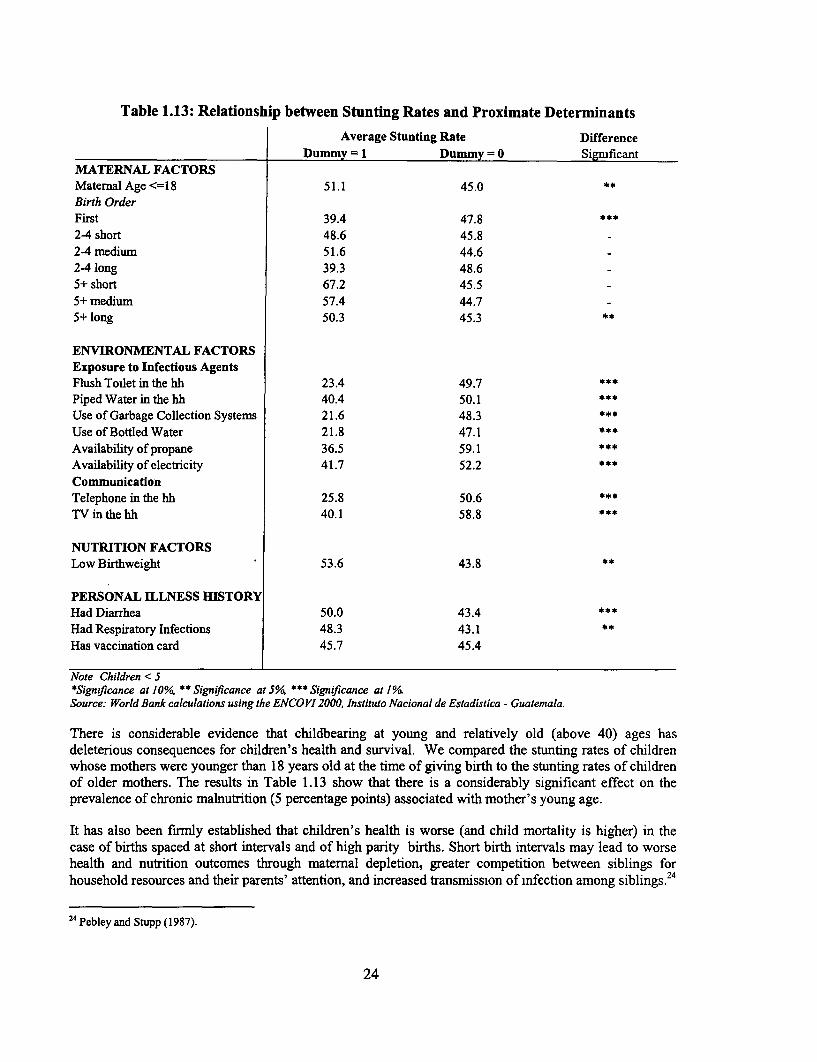
Table 1.13: Relationship between Stunting Rates and Proximate Determinants
Average Stunting Rate DifferenceDummy =1 Dummy =0 Significant
MATERNAL FACTORSMaternal Age <=18 51.1 45.0 **
Birth OrderFirst 39.4 47.824 short 48.6 45.82-4 medium 51.6 44.624 long 39.3 48.65+ short 67.2 45.55+ medium 57.4 44.75+ long 50.3 45.3 **
ENVIRONMENTAL FACTORSExposure to Infectious AgentsFlush Toilet in the hh 23.4 49.7Piped Water in the hh 40.4 50.1Use of Garbage Collection Systems 21.6 48.3Use of Bottled Water 21.8 47.1Availability of propane 36.5 59.1Availability of electricity 41.7 52.2CommunicationTelephone in the hh 25.8 50.6TV in the hh 40.1 58.8
NUTRITION FACTORSLow Birthweight 53.6 43.8 **
PERSONAL ILLNESS HISTORYHad Diarrhea 50.0 43.4Had Respiratory Infections 48.3 43.1 **
Has vaccination card 45.7 45.4
Note Children < 5*Sign,ficance at 10%, ** Significance at 5%/ *SigniJicance at 1°/Source: World Bank calculations using the ENCOVI 2000, Instituto Nacional de Estadistica - Guatemala.
There is considerable evidence that childbearing at young and relatively old (above 40) ages hasdeleterious consequences for children's health and survival. We compared the stunting rates of childrenwhose mothers were younger than 18 years old at the time of giving birth to the stunting rates of childrenof older mothers. The results in Table 1.13 show that there is a considerably significant effect on theprevalence of chronic malnutrition (5 percentage points) associated with mother's young age.
It has also been firmly established that children's health is worse (and child mortality is higher) in thecase of births spaced at short intervals and of high parity births. Short birth intervals may lead to worsehealth and nutrition outcomes through maternal depletion, greater competition between siblings forhousehold resources and their parents' attention, and increased transmission of infection among siblings.24
2 4 Pebley and Stupp (1987).
24
We modeled birth spacing and parity in seven categories. First, we distinguished the number of births intotwo categories-from two to four children and five or more children. Within these two groups, we furtherclassified children in terms of the length of time between their births and the birth of the sibling bornimmediately before them. We specified short, medium, and long intervals and defined them asrepresenting 14 months or less, 15-29 months, and 30 months or more respectively. The data in Table1.13 show that malnutrition increases monotonically with the child's birth order in the family and isworse in the case of short birth intervals.
Five characteristics of the household are assumed to affect its hygienic and sanitary characteristics and toinfluence the likelihood of transmission of infectious diseases, both directly and indirectly. There fivecharacteristics are: the availability of piped water, the availability of a flush toilet, the availability ofpropane, 25 the use of garbage collection systems, and the use of bottled water. Table 1.12 lists thehousehold conditions that facilitate the transmission of infectious diseases. Less than 20 percent and 15percent of children live in households with flush toilets and with garbage collection systems respectively.About 30 percent of children live in households where bottled water is used as the source of drinklmgwater. Children living in households with better environmental factors have significantly better growthpatterns.
Birth weight provides information on the adequacy of a mother's nutrient intake during her pregnancy.Infants with low birth weights generally have low stores of nutrients like iron, fat, and vitamin A and are,therefore, more likely than bigger babies to be malnourished later in life. Information on birth weightneeds to be used with care since the birth weights reported in ENCOVV/INE 2000 are not derived fromactual measurements but from the mothers' recollection. Moreover, birth weight information in theENCOVI/INE survey was collected only for each mother's most recent birth. Therefore, the sample usedto assess the relationship between birth weight and stunting is smaller (3,112 observations) than thesample used to assess the impact of other proximate determinants (5,414 observations). Nevertheless, theaverage prevalence of malnutrition in children with low birth weights is significantly higher (54 percent)than malnutrition in children with normal birth weights (44 percent). There is evidence that someindigenous women in Guatemala try to control their weight gain during pregnancy, believing that asmaller baby will reduce the risk of complications during delivery and, therefore, the need to go to a "coldand impersonal place" like they perceive the hospital to be.26
Several studies have analyzed the impact of different breastfeeding patterns on the nutritional status ofchildren and infants.27 Exclusively breastfeeding for at least the first six months of a baby's life providesthem with an adequate source of nutrients and antibodies and eliminates the chance that the baby will fallill as a result of using infected utensils to prepare formula. Moreover, in a country where contraceptiveuse is as low as in Guatemala, breastfeeding plays a major role in lengthening birth intervals by extendingthe duration of post-partum amenorrhoea. On the other side, excessively prolonged breastfeeding can bedangerous for the growth and development of the child as it can lead to some micronutrient deficiencyand growth faltering.28 A number of studies carried out in Africa, Latin America, and Asia have reportedan association between prolonged breastfeeding (more than 12 months) and an increased risk of height-for-age deficits. 29 Victora et al (1984) found, after controlling for possible confounding variables, that
25 Propane is used mostly for cooking in gas stoves (although some people also use it to warm up water). Therefore, it is asubstitute for fuelwood, but it is also a better technology because It is cleaner and more efficient.
26 Solares (1997).
2 Barrera (1990) and IFPRI (2000).
2 WHO Note for the Press (2001). On the internet at: htttp://www.who.int/inf-pr-2001/en/note200l-07.html American Academyof Pediatrics, 1997.
29 Martorell, Leslie, and Moock (1984) and Brakohiapa et al (1988).
25
Brazilian children who were breastfed for three to six months tended to have a better nutritional status(measured in terms of both height-for-age and weight-for-height) than those who were breastfed for eithershorter or longer periods. As possible explanations for this, they suggested: (i) that poorly nourishedmothers in developing countries produce milk with a low fat content that provides less energy per unitthan milk from better nourished women; (ii) that mothers who breastfeed for long periods may be givingthe child inadequate supplementary foods; and (iii) frequent breastfeeding may also reduce the baby'sappetite. Selection effects may also be important, since some mothers may breastfeed longer when theirchildren are shorter or thinner than average.
We used an index of breastfeeding duration to compare the length of time a child was breastfed withhis/her age and with the median time for breastfeeding in Guatemala. Breastfeeding is almost universaland prolonged in Guatemala. The median duration of breastfeeding in the ENCOVI sample is 16months. 30 The breastfeeding duration index ranges from zero to one and equals either the ratio of thelength of breastfeeding and 16 if the child is at least 16 months old at the time of the respondent'sinterview3' or the ratio between the length of breastfeeding and the child's age if the child is less than 16months at the time of the interview. The mean value of the index is 0.78. Table 1.14 shows that thebreastfeeding index monotonically decreases with higher per capita consumption and with the mother'seducation level. It is higher in rural areas, for indigenous women, and for women who do not speakSpanish.
30 Trussell et al (1992), usmg data from the 1987 Guatemalan DHS, estimated the trimean of breastfeedmg duration to be 19.6months with current-status data and 18.1 with retrospective data. If Ql, Q2, and Q3 are the ages at which 25 percent, 50 percent,and 75 percent of women are no longer breastfeeding, the tnmean is calculated as (Q, + 2Q2 + Q3)/4-
31 The index takes the value of one if the child was breastfed for longer than 16 months.
26
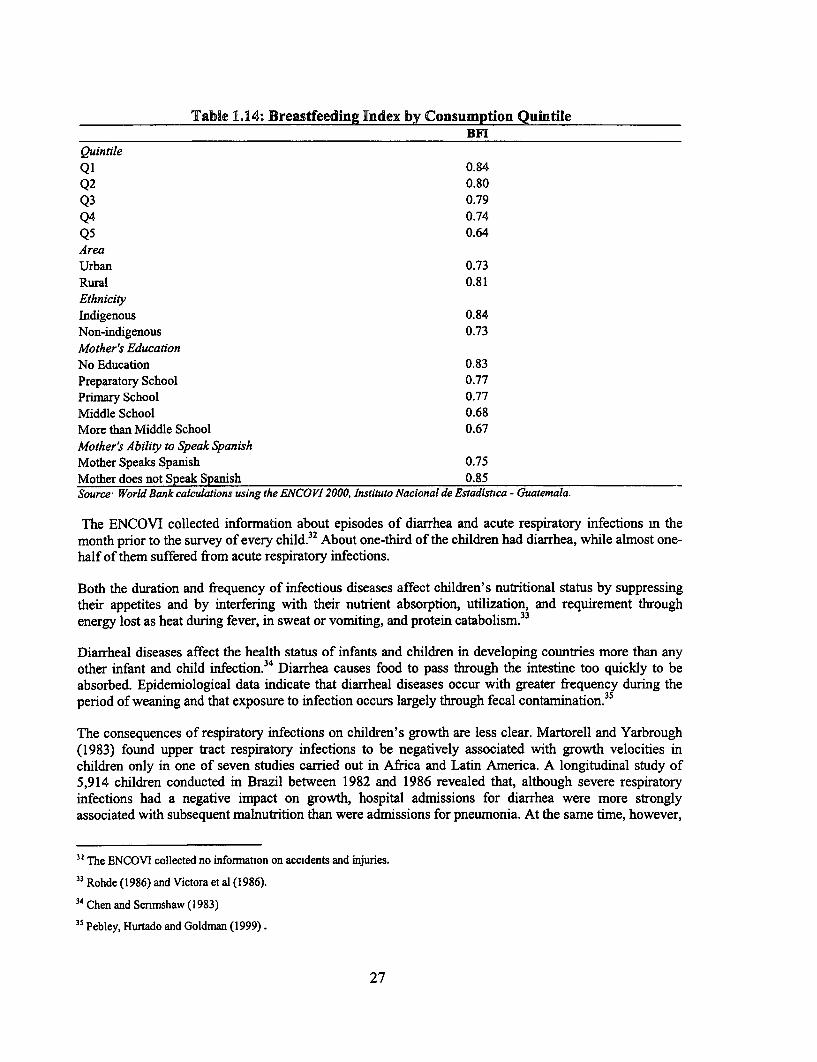
Table 1.14: Breastfeeding Index by Consumption QuintileBFI
Quintile
Q1 0.84Q2 0.80Q3 0.79Q4 0.74Q5 0.64
Area
Urban 0.73
Rural 0.81EthnicityIndigenous 0.84Non-indigenous 0.73Mother's Education
No Education 0.83Preparatory School 0.77Primary School 0.77Middle School 0.68More than Middle School 0.67Mother's Ability to Speak SpanishMother Speaks Spanish 0.75Mother does not Speak Spanish 0.85Source* World Bank calculations using the ENCOVI 2000, Instituto Nacional de Estadistca - Guatemala.
The ENCOVI collected information about episodes of diarrhea and acute respiratory infections m themonth prior to the survey of every child.32 About one-third of the children had diarrhea, while almost one-half of them suffered from acute respiratory infections.
Both the duration and frequency of infectious diseases affect children's nutritional status by suppressingtheir appetites and by interfering with their nutrient absorption, utilization, and requirement throughenergy lost as heat during fever, in sweat or vomiting, and protein catabolism.33
Diarrheal diseases affect the health status of infants and children in developing countries more than anyother infant and child infection.34 Diarrhea causes food to pass through the intestine too quickly to beabsorbed. Epidemiological data indicate that diarrheal diseases occur with greater frequency during theperiod of weaning and that exposure to infection occurs largely through fecal contanination.35
The consequences of respiratory infections on children's growth are less clear. Martorell and Yarbrough(1983) found upper tract respiratory infections to be negatively associated with growth velocities inchildren only in one of seven studies carried out in Africa and Latin America. A longitudinal study of5,914 children conducted in Brazil between 1982 and 1986 revealed that, although severe respiratoryinfections had a negative impact on growth, hospital admissions for diarrhea were more stronglyassociated with subsequent malnutrition than were admissions for pneumonia. At the same time, however,
3! The ENCOVI collected no information on accidents and injuries.
33 Rohde (1986) and Victora et al (1986).
34 Chen and Scnmshaw (1983)
35 Pebley, Hurtado and Goldman (1999).
27
malnutrition was a more important risk factor for pneumonia than it was for diarrhea. All of theassociations were stronger in the first two years of life than at older ages.36
The prevalence of chronic malnutrition was significantly higher among children who had diarrhea (50percent) or acute respiratory infections (48 percent) in the two weeks prior to the survey than among thosewho did not have such infections (44 percent and 43 percent respectively).
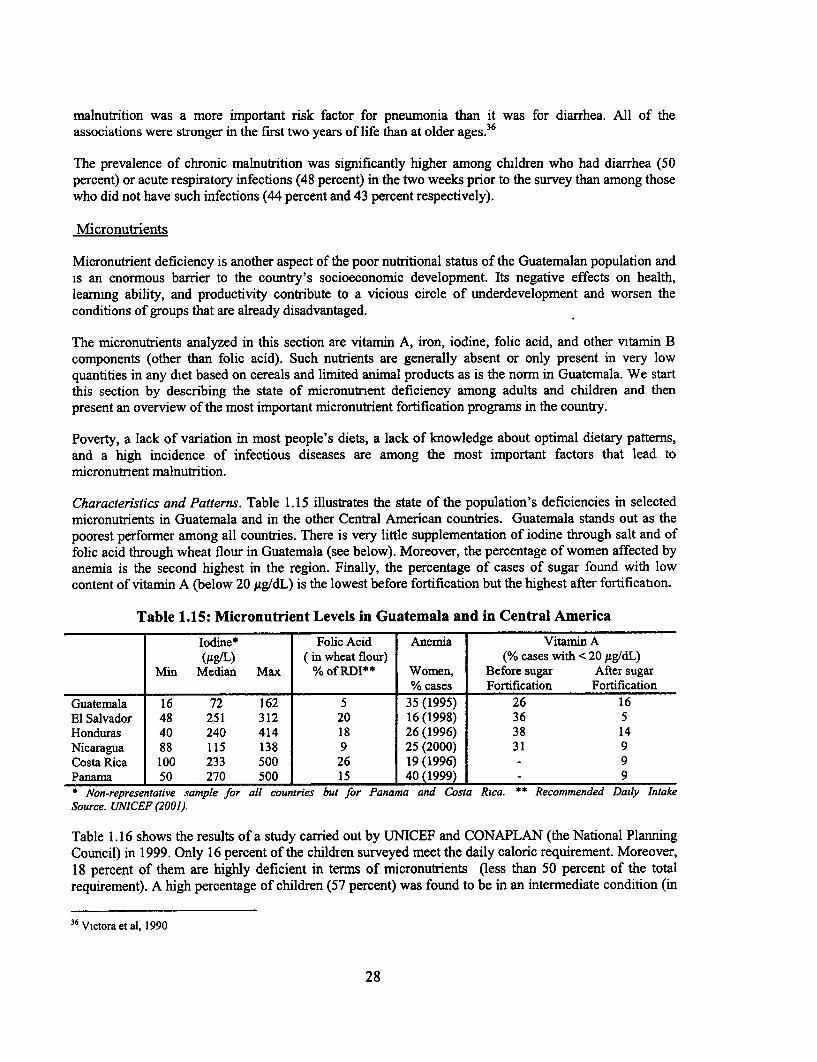
Micronutrients
Micronutrient deficiency is another aspect of the poor nutritional status of the Guatemalan population andis an enormous barrier to the country's socioeconomic development. Its negative effects on health,learmng ability, and productivity contribute to a vicious circle of underdevelopment and worsen theconditions of groups that are already disadvantaged.
The micronutrients analyzed in this section are vitamin A, iron, iodine, folic acid, and other vitamin Bcomponents (other than folic acid). Such nutrients are generally absent or only present in very lowquantities in any diet based on cereals and limited animal products as is the norm in Guatemala. We startthis section by describing the state of micronutnent deficiency among adults and children and thenpresent an overview of the most important micronutrient fortification programs in the country.
Poverty, a lack of variation in most people's diets, a lack of knowledge about optimal dietary patterns,and a high incidence of infectious diseases are among the most important factors that lead tomicronutnent malnutrition.
Characteristics and Patterns. Table 1.15 illustrates the state of the population's deficiencies in selectedmicronutrients in Guatemala and in the other Central American countries. Guatemala stands out as thepoorest performer among all countries. There is very little supplementation of iodine through salt and offolic acid through wheat flour in Guatemala (see below). Moreover, the percentage of women affected byanemia is the second highest in the region. Finally, the percentage of cases of sugar found with lowcontent of vitamin A (below 20 ,g/dL) is the lowest before fortification but the highest after fortificaton.
Table 1.15: Micronutrient Levels in Guatemala and in Central America
Iodine* Folic Acid Anemia Vitamnin A(lg/L) (in wheat flour) (% cases with < 20 Ag/dL)
Min Median Max % of RDI** Women, Before sugar After sugar% cases Fortification Fortification
Guatemala 16 72 162 5 35 (1995) 26 16El Salvador 48 251 312 20 16 (1998) 36 5Honduras 40 240 414 18 26 (1996) 38 14Nicaragua 88 115 138 9 25 (2000) 31 9Costa Rica 100 233 500 26 19 (1996) - 9Panama 50 270 500 15 40 (1999) 9* Non-representative sample for all countries but for Panama and Costa Rica. ** Recommended Daily IntakeSource. UNICEF (2001).
Table 1.16 shows the results of a study carried out by UNICEF and CONAPLAN (the National PlanningCouncil) in 1999. Only 16 percent of the children surveyed meet the daily caloric requirement. Moreover,18 percent of them are highly deficient in terms of micronutrients (less than 50 percent of the totalrequirement). A high percentage of children (57 percent) was found to be in an intermediate condition (in
36 Victora et al, 1990
28
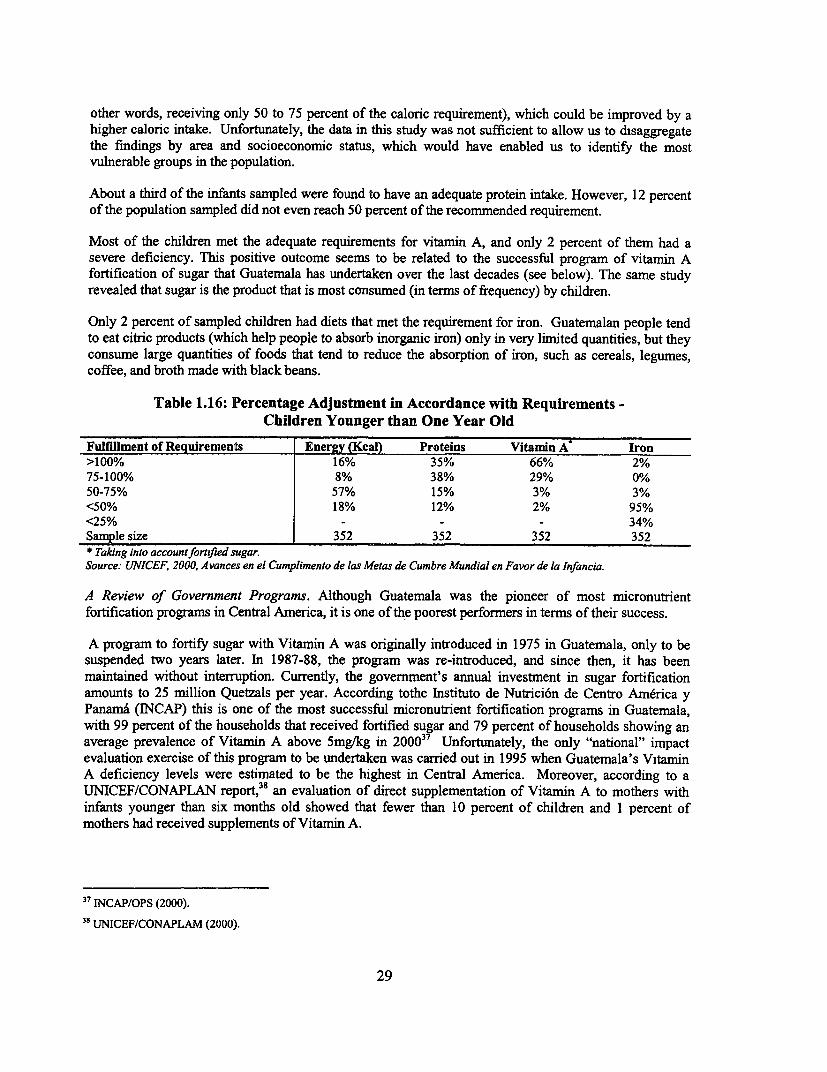
other words, receiving only 50 to 75 percent of the caloric requirement), which could be improved by ahigher caloric intake. Unfortunately, the data in this study was not sufficient to allow us to disaggregatethe findings by area and socioeconomic status, which would have enabled us to identify the mostvulnerable groups in the population.
About a third of the infants sampled were found to have an adequate protein intake. However, 12 percentof the population sampled did not even reach 50 percent of the recommended requirement.
Most of the children met the adequate requirements for vitamin A, and only 2 percent of them had asevere deficiency. This positive outcome seems to be related to the successful program of vitamin Afortification of sugar that Guatemala has undertaken over the last decades (see below). The same studyrevealed that sugar is the product that is most consumed (in terms of frequency) by children.
Only 2 percent of sampled children had diets that met the requirement for iron. Guatemalan people tendto eat citric products (which help people to absorb inorganic iron) only in very limited quantities, but theyconsume large quantities of foods that tend to reduce the absorption of iron, such as cereals, legumes,coffee, and broth made with black beans.
Table 1.16: Percentage Adjustment in Accordance with Requirements -Children Younger than One Year Old
Fulfillment of Requirements Energy (Kcal) Proteins Vitamin A Iron>100% 16% 35% 66% 2%75-100% 8% 38% 29% 0%50-75% 57% 15% 3% 3%<50% 18% 12% 2% 95%<25% - -- 34%Sample size 352 352 352 352* Taking into accountfortified sugar.Source: UNICEF, 2000, Avances en el Cumplimento de las Metas de Cumbre Mundial en Favor de la Infancia.
A Review of Government Programs. Although Guatemala was the pioneer of most micronutrientfortification programs in Central America, it is one of the poorest performers in terms of their success.
A program to fortify sugar with Vitamin A was originally introduced in 1975 in Guatemala, only to besuspended two years later. In 1987-88, the program was re-introduced, and since then, it has beenmaintained without interruption. Currently, the government's annual investment in sugar fortificationamounts to 25 million Quetzals per year. According tothe Instituto de Nutrici6n de Centro America yPanama (INCAP) this is one of the most successful micronutrient fortification programs in Guatemala,with 99 percent of the households that received fortified sugar and 79 percent of households showing anaverage prevalence of Vitamin A above Smg/kg in 20003 Unfortunately, the only "national" impactevaluation exercise of this program to be undertaken was carried out in 1995 when Guatemala's VitaminA deficiency levels were estimated to be the highest in Central America. Moreover, according to aUNICEF/CONAPLAN report, 38 an evaluation of direct supplementation of Vitamin A to mothers withinfants younger than six months old showed that fewer than 10 percent of children and 1 percent ofmothers had received supplements of Vitamin A.
37 INCAP/OPS (2000).3 8UNICEF/CONAPLAM (2000).
29
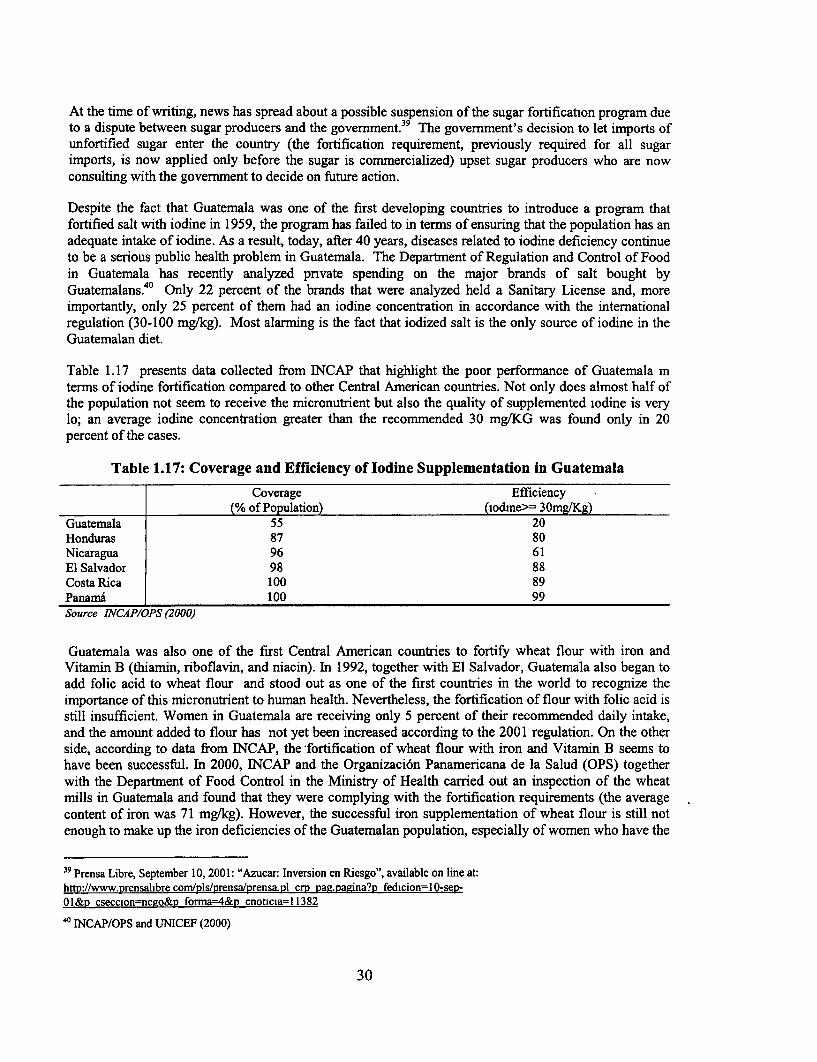
At the time of writing, news has spread about a possible suspension of the sugar fortification program dueto a dispute between sugar producers and the government.39 The government's decision to let imports ofunfortified sugar enter the country (the fortification requirement, previously required for all sugarimports, is now applied only before the sugar is commercialized) upset sugar producers who are nowconsulting with the government to decide on future action.
Despite the fact that Guatemala was one of the first developing countries to introduce a program thatfortified salt with iodine in 1959, the program has failed to in terms of ensuring that the population has anadequate intake of iodine. As a result, today, after 40 years, diseases related to iodine deficiency continueto be a serious public health problem in Guatemala. The Department of Regulation and Control of Foodin Guatemala has recently analyzed pnvate spending on the major brands of salt bought byGuatemalans.40 Only 22 percent of the brands that were analyzed held a Sanitary License and, moreimportantly, only 25 percent of them had an iodine concentration in accordance with the internationalregulation (30-100 mg/kg). Most alarming is the fact that iodized salt is the only source of iodine in theGuatemalan diet.
Table 1.17 presents data collected from INCAP that highlight the poor performance of Guatemala mterms of iodine fortification compared to other Central American countries. Not only does almost half ofthe population not seem to receive the micronutrient but also the quality of supplemented iodine is verylo; an average iodine concentration greater than the recommended 30 mg/KG was found only in 20percent of the cases.
Table 1.17: Coverage and Efficiency of Iodine Supplementation in Guatemala
Coverage Efficiency(% of Population) (iodine>= 30mg/Kg)
Guatemala 55 20Honduras 87 80Nicaragua 96 61El Salvador 98 88Costa Rica 100 89Panama 100 99Source INCAP/OPS (2000)
Guatemala was also one of the first Central American countries to fortify wheat flour with iron andVitamin B (thiamin, riboflavin, and niacin). In 1992, together with El Salvador, Guatemala also began toadd folic acid to wheat flour and stood out as one of the first countries in the world to recognize theimportance of this micronutrient to human health. Nevertheless, the fortification of flour with folic acid isstill insufficient. Women in Guatemala are receiving only 5 percent of their recommended daily intake,and the amount added to flour has not yet been increased according to the 2001 regulation. On the otherside, according to data from INCAP, the fortification of wheat flour with iron and Vitamin B seems tohave been successful. In 2000, INCAP and the Organizaci6n Panamericana de la Salud (OPS) togetherwith the Department of Food Control in the Ministry of Health carried out an inspection of the wheatmills in Guatemala and found that they were complying with the fortification requirements (the averagecontent of iron was 71 mg/kg). However, the successful iron supplementation of wheat flour is still notenough to make up the iron deficiencies of the Guatemalan population, especially of women who have the
39 Prensa Libre, September 10, 2001: "Azucar: Inversion en Riesgo", available on line at:http://www.prensalibrecom/ols/prensa/prensa.nl crm pag.nagina?p fedicion=10-sM-01&p csecclon=nego&n forma=4&D cnoticia= 11382
40 INCAP/OPS and UNICEF (2000)
30
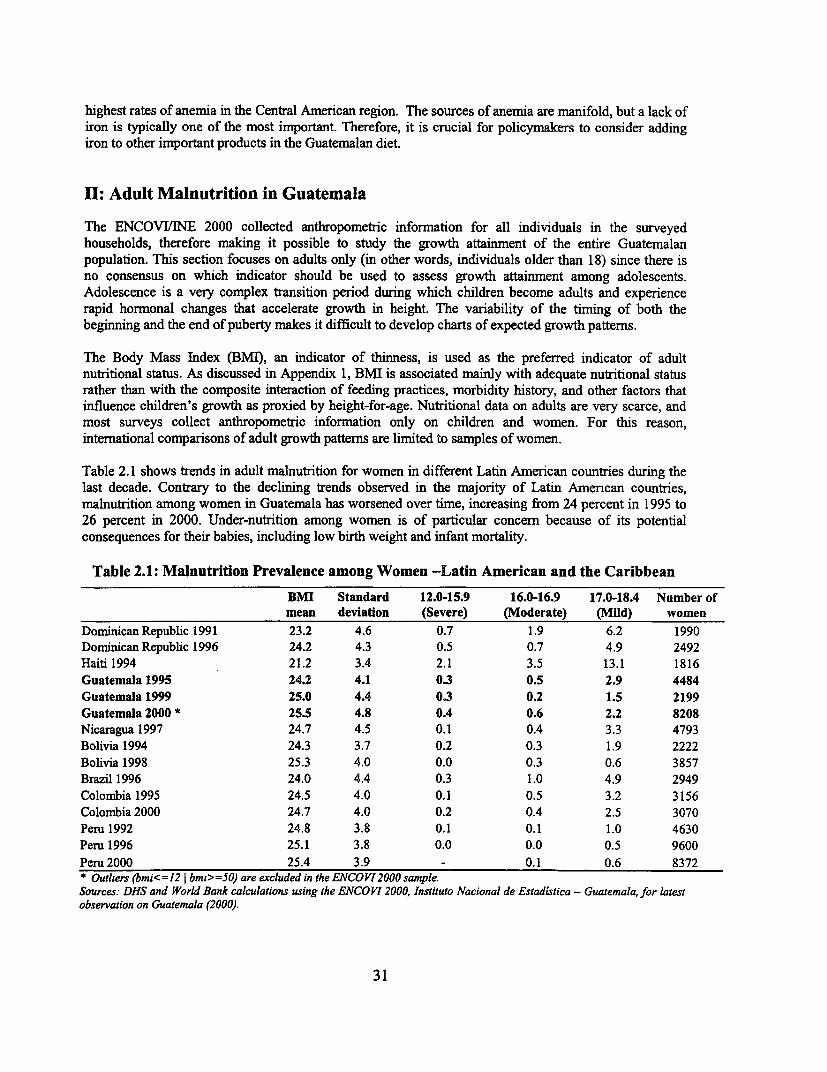
highest rates of anemia in the Central American region. The sources of anemia are manifold, but a lack ofiron is typically one of the most important. Therefore, it is crucial for policymakers to consider addingiron to other important products in the Guatemalan diet.
II: Adult Malnutrition in Guatemala
The ENCOVWINE 2000 collected anthropometric information for all individuals in the surveyedhouseholds, therefore making it possible to study the growth attainment of the entire Guatemalanpopulation. This section focuses on adults only (in other words, individuals older than 18) since there isno consensus on which indicator should be used to assess growth attainment among adolescents.Adolescence is a very complex transition period during which children become adults and experiencerapid hormonal changes that accelerate growth in height. The variability of the timing of both thebeginning and the end of puberty makes it difficult to develop charts of expected growth patterns.
The Body Mass Index (BMI), an indicator of thinness, is used as the preferred indicator of adultnutritional status. As discussed in Appendix 1, BMI is associated mainly with adequate nutritional statusrather than with the composite interaction of feeding practices, morbidity history, and other factors thatinfluence children's growth as proxied by height-for-age. Nutritional data on adults are very scarce, andmost surveys collect anthropometric information only on children and women. For this reason,international comparisons of adult growth patterns are limited to samples of women.
Table 2.1 shows trends in adult malnutrition for women in different Latin American countries during thelast decade. Contrary to the declining trends observed in the majority of Latin Amencan countries,malnutrition among women in Guatemala has worsened over time, increasing from 24 percent in 1995 to26 percent in 2000. Under-nutrition among women is of particular concern because of its potentialconsequences for their babies, including low birth weight and infant mortality.
Table 2.1: Malnutrition Prevalence among Women -Latin American and the Caribbean
BMI Standard 12.0-15.9 16.0-16.9 17.0-18.4 Number ofmean deviation (Severe) (Moderate) (Mild) women
Dominican Republic 1991 23.2 4.6 0.7 1.9 6.2 1990Dominican Republic 1996 24.2 4.3 0.5 0.7 4.9 2492Haiti 1994 21.2 3.4 2.1 3.5 13.1 1816Guatemala 1995 24.2 4.1 0.3 0.5 2.9 4484Guatemala 1999 25.0 4.4 0.3 0.2 1.5 2199Guatemala 2000 * 25.5 4.8 OA 0.6 2.2 8208Nicaragua 1997 24.7 4.5 0.1 0.4 3.3 4793Bolivia 1994 24.3 3.7 0.2 0.3 1.9 2222Bolivia 1998 25.3 4.0 0.0 0.3 0.6 3857Brazil 1996 24.0 4.4 0.3 1.0 4.9 2949Colombia 1995 24.5 4.0 0.1 0.5 3.2 3156Colombia 2000 24.7 4.0 0.2 0.4 2.5 3070Peru 1992 24.8 3.8 0.1 0.1 1.0 4630Peru 1996 25.1 3.8 0.0 0.0 0.5 9600Peru 2000 25.4 3.9 - 0.1 0.6 8372* Outliers (bmi<=12 I bmi>=50) are excluded in the ENCOV12000 sample.Sources: DHS and World Bank calculations using the ENCOVI 2000, Instituto Nacional de Estadistica - Guatemala, for latestobservation on Guatemala (2000).
31
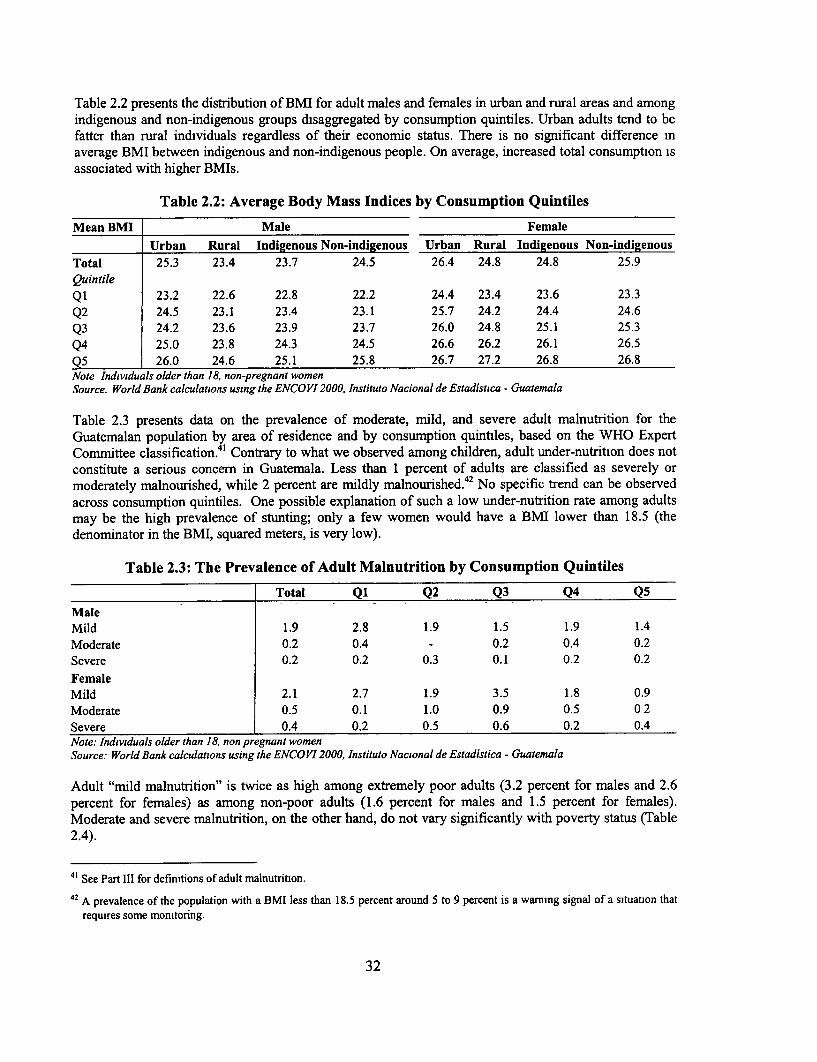
Table 2.2 presents the distribution of BMI for adult males and females in urban and rural areas and amongindigenous and non-indigenous groups disaggregated by consumption quintiles. Urban adults tend to befatter than rural individuals regardless of their economic status. There is no significant difference inaverage BMI between indigenous and non-indigenous people. On average, increased total consumption isassociated with higher BMIs.
Table 2.2: Average Body Mass Indices by Consumption Quintiles
Mean BMI Male Female
Urban Rural Indigenous Non-indigenous Urban Rural Indigenous Non-indigenousTotal 25.3 23.4 23.7 24.5 26.4 24.8 24.8 25.9Quintile
Q1 23.2 22.6 22.8 22.2 24.4 23.4 23.6 23.3Q2 24.5 23.1 23.4 23.1 25.7 24.2 24.4 24.6Q3 24.2 23.6 23.9 23.7 26.0 24.8 25.1 25.3Q4 25.0 23.8 24.3 24.5 26.6 26.2 26.1 26.5Q5 26.0 24.6 25.1 25.8 26.7 27.2 26.8 26.8Note Individuals older than 18, non-pregnant womenSource. World Bank calculations using the ENCO VI 2000, Instituto Nacional de Estadistica - Guatemala
Table 2.3 presents data on the prevalence of moderate, mild, and severe adult malnutrition for theGuatemalan population by area of residence and by consumption quintiles, based on the WHO ExpertCommittee classification. 41 Contrary to what we observed among children, adult under-nutrition does notconstitute a serious concern in Guatemala. Less than 1 percent of adults are classified as severely ormoderately malnourished, while 2 percent are mildly malnourished. 42 No specific trend can be observedacross consumption quintiles. One possible explanation of such a low under-nutrition rate among adultsmay be the high prevalence of stunting; only a few women would have a BMI lower than 18.5 (thedenominator in the BMI, squared meters, is very low).
Table 2.3: The Prevalence of Adult Malnutrition by Consumption Quintiles
Total Q1 Q2 Q3 Q4 Q5
MaleMild 1.9 2.8 1.9 1.5 1.9 1.4Moderate 0.2 0.4 - 0.2 0.4 0.2Severe 0.2 0.2 0.3 0.1 0.2 0.2FemaleMild 2.1 2.7 1.9 3.5 1.8 0.9Moderate 0.5 0.1 1.0 0.9 0.5 0 2Severe 0.4 0.2 0.5 0.6 0.2 0.4Note: Individuals older than 18, non pregnant womenSource: World Bank calculations using the ENCO VI 2000, Instituto Nacional de Estadistica - Guatemala
Adult "mild malnutrition" is twice as high among extremely poor adults (3.2 percent for males and 2.6percent for females) as among non-poor adults (1.6 percent for males and 1.5 percent for females).Moderate and severe malnutrition, on the other hand, do not vary significantly with poverty status (Table2.4).
41 See Part III for definitions of adult malnutrition.
42 A prevalence of the population with a BMI less than 18.5 percent around 5 to 9 percent is a warming signal of a situation thatrequires some monitoring.
32
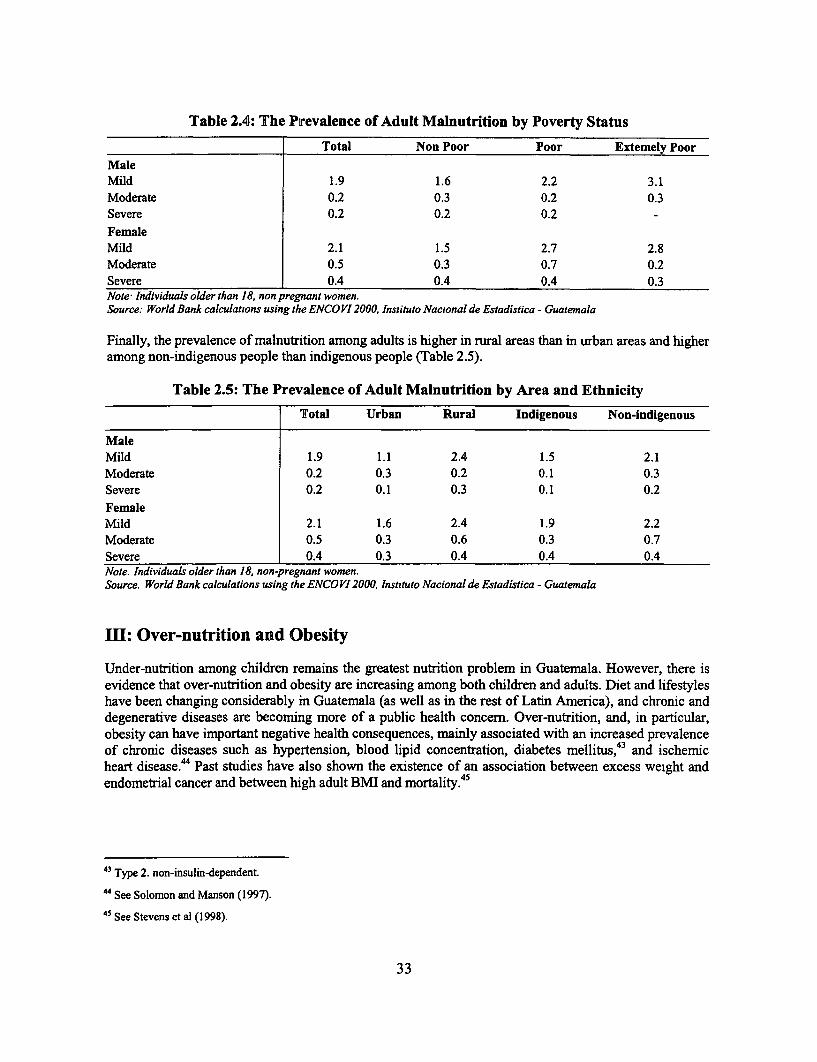
Table 2.4: The Prevalence of Adult Malnutrition by Poverty Status
Total Non Poor Poor Extemely PoorMaleMild 1.9 1.6 2.2 3.1Moderate 0.2 0.3 0.2 0.3Severe 0.2 0.2 0.2FemaleMild 2.1 1.5 2.7 2.8Moderate 0.5 0.3 0.7 0.2Severe 0.4 0.4 0.4 0.3Note Individuals older than 18, non pregnant women.Source: World Bank calculations using the ENCOVI 2000, Instituto Nacional de Estadistica - Guatemala
Finally, the prevalence of malnutrition among adults is higher in rural areas than in urban areas and higheramong non-indigenous people than indigenous people (Table 2.5).
Table 2.5: The Prevalence of Adult Malnutrition by Area and Ethnicity
Total Urban Rural Indigenous Non-indigenous
MaleMild 1.9 1.1 2.4 1.5 2.1Moderate 0.2 0.3 0.2 0.1 0.3Severe 0.2 0.1 0.3 0.1 0.2FemaleMild 2.1 1.6 2.4 1.9 2.2Moderate 0.5 0.3 0.6 0.3 0.7Severe 0.4 0.3 0.4 0.4 0.4Note. Individuals older than 18, non-pregnant women.Source. World Bank calculations using the ENCO V 2000, Instituto Nacional de Estadistica - Guatemala
III: Over-nutrition and Obesity
Under-nutrition among children remains the greatest nutrition problem in Guatemala. However, there isevidence that over-nutrition and obesity are increasing among both children and adults. Diet and lifestyleshave been changing considerably in Guatemala (as well as in the rest of Latin America), and chronic anddegenerative diseases are becoming more of a public health concern. Over-nutrition, and, in particular,obesity can have important negative health consequences, mainly associated with an increased prevalenceof chronic diseases such as hypertension, blood lipid concentration, diabetes mellitus,43 and ischemicheart disease.44 Past studies have also shown the existence of an association between excess weight andendometrial cancer and between high adult BMIl and mortality.45
43 Type 2. non-insulin-dependent.
44 See Solomon and Manson (1997).
45 See Stevens et al (1998).
33
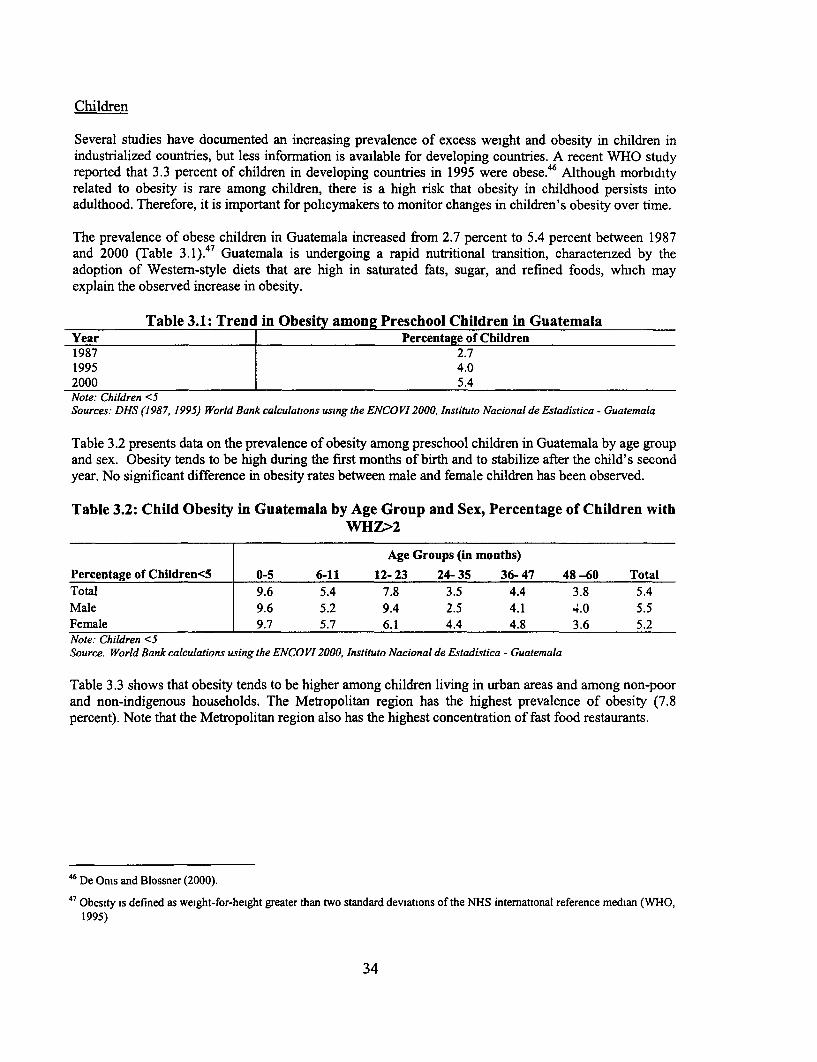
Children
Several studies have documented an increasing prevalence of excess weight and obesity in children inindustrialized countries, but less information is available for developing countries. A recent WHO studyreported that 3.3 percent of children in developing countries in 1995 were obese.46 Although morbidityrelated to obesity is rare among children, there is a high risk that obesity in childhood persists intoadulthood. Therefore, it is important for policymakers to monitor changes in children's obesity over time.
The prevalence of obese children in Guatemala increased from 2.7 percent to 5.4 percent between 1987and 2000 (Table 3. 1).47 Guatemala is undergoing a rapid nutritional transition, charactenzed by theadoption of Western-style diets that are high in saturated fats, sugar, and refined foods, which mayexplain the observed increase in obesity.
Table 3.1: Trend in Obesity among Preschool Children in GuatemalaYear Percentage of Children1987 2.71995 4.02000 5.4Note: Children <5Sources: DHS (1987, 1995) World Bank calculations using the ENCOVI2000, Instituto Nacional de Estadistica - Guatemala
Table 3.2 presents data on the prevalence of obesity among preschool children in Guatemala by age groupand sex. Obesity tends to be high during the first months of birth and to stabilize after the child's secondyear. No significant difference in obesity rates between male and female children has been observed.
Table 3.2: Child Obesity in Guatemala by Age Group and Sex, Percentage of Children withWHZ>2
Age Groups (in months)Percentage of Children<5 0-5 6-11 12- 23 24- 35 36- 47 48 -60 TotalTotal 9.6 5.4 7.8 3.5 4.4 3.8 5.4Male 9.6 5.2 9.4 2.5 4.1 4.0 5.5Female 9.7 5.7 6.1 4.4 4.8 3.6 5.2Note: Children <5Source. World Bank calculations using the ENCO VI 2000, Instituto Nacional de Estadistica - Guatemala
Table 3.3 shows that obesity tends to be higher among children living in urban areas and among non-poorand non-indigenous households. The Metropolitan region has the highest prevalence of obesity (7.8percent). Note that the Metropolitan region also has the highest concentration of fast food restaurants.
46 De Onis and Blossner (2000).
47 Obesity is defined as weight-for-height greater than two standard deviations of the NHS international reference median (WHO,1995)
34
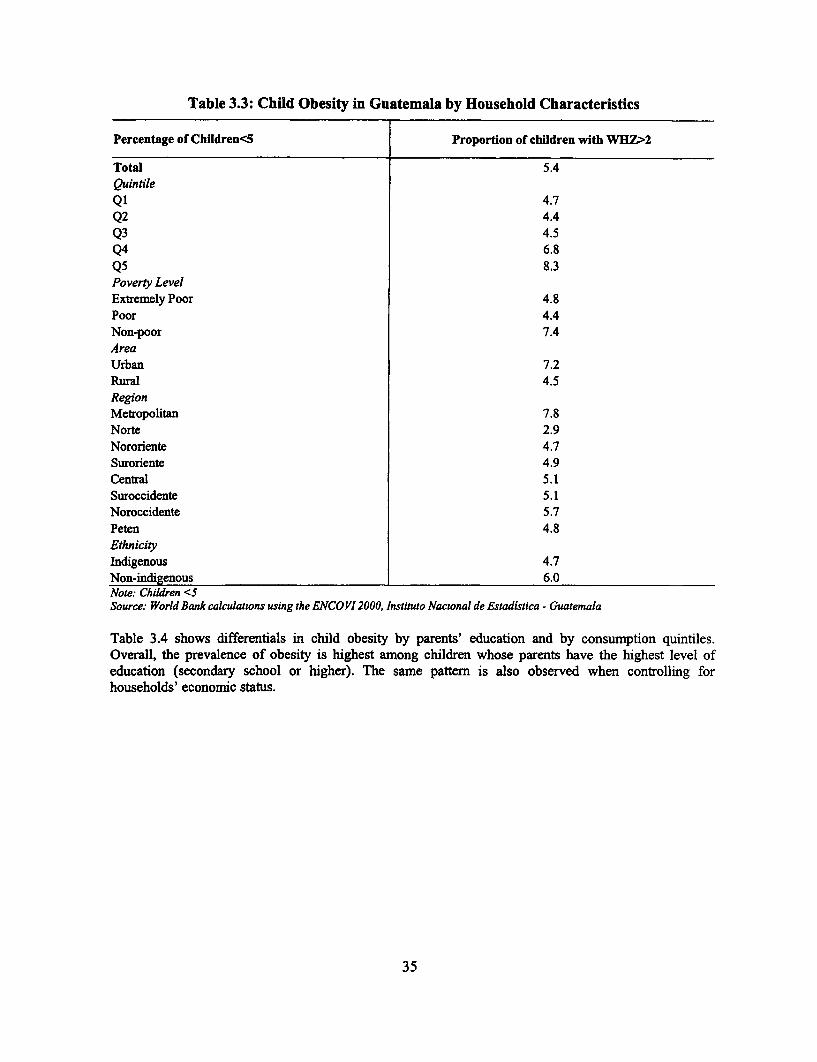
Table 3.3: Child Obesity in Guatemala by Household Characteristics
Percentage of Children<5 Proportion of children with WHZ>2
Total 5.4Quintile
Q1 4.7Q2 4.4
Q3 4.5Q4 6.8
Q5 8.3Poverty LevelExtremely Poor 4.8
Poor 4.4Non-poor 7.4AreaUrban 7.2Rural 4.5RegionMetropolitan 7.8Norte 2.9Nororiente 4.7Suroriente 4.9Central 5.1Suroccidente 5.1Noroccidente 5.7Peten 4.8EthnicityIndigenous 4.7Non-indigenous 6.0Note: Children <SSource: World Bank calculations using the ENCOVI 2000, Instituto Nacwonal de Estadistica - Guatemala
Table 3.4 shows differentials in child obesity by parents' education and by consumption quintiles.Overall, the prevalence of obesity is highest among children whose parents have the highest level ofeducation (secondary school or higher). The same pattern is also observed when controlling forhouseholds' economic status.
35
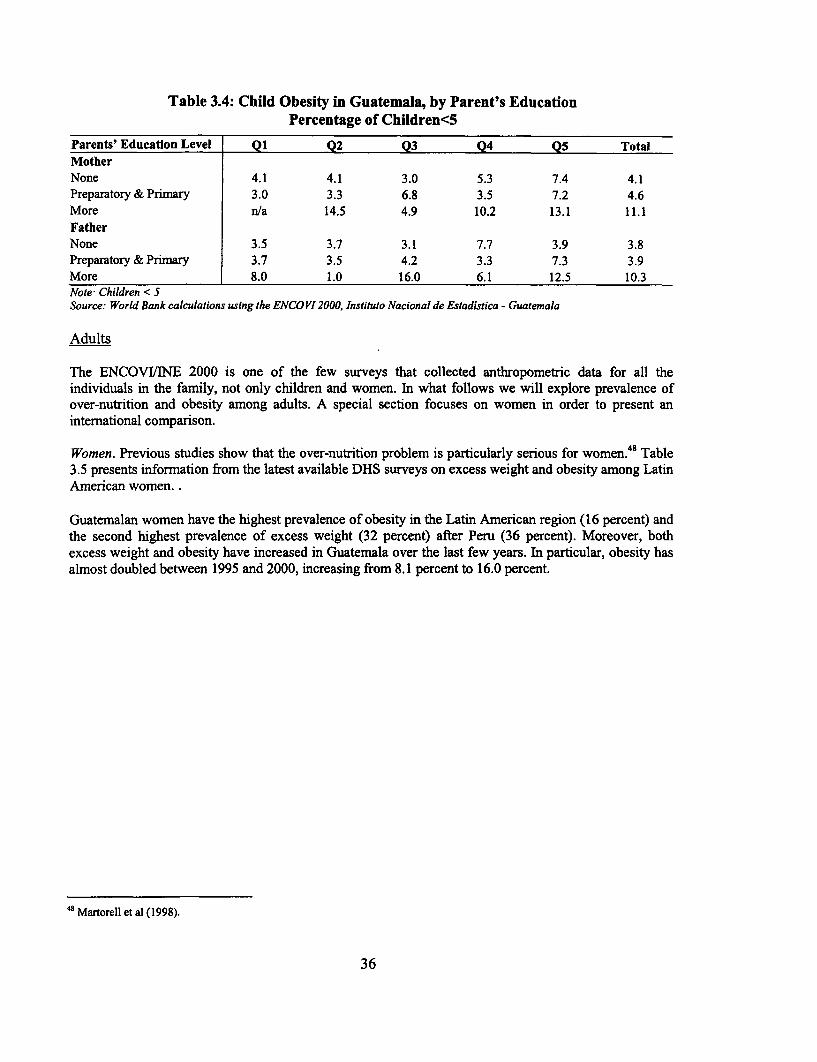
Table 3.4: Child Obesity in Guatemala, by Parent's EducationPercentage of Children<5
Parents' Education Level Q1 Q2 Q3 Q4 Q5 TotalMotherNone 4.1 4.1 3.0 5.3 7.4 4.1Preparatory & Primary 3.0 3.3 6.8 3.5 7.2 4.6More n/a 14.5 4.9 10.2 13.1 11.1
FatherNone 3.5 3.7 3.1 7.7 3.9 3.8Preparatory & Primary 3.7 3.5 4.2 3.3 7.3 3.9More 8.0 1.0 16.0 6.1 12.5 10.3Note Children < 5Source: World Bank calculations using the ENCO VI 2000, Instituto Nacional de Estadistica - Guatemala
Adults
The ENCOVI/NE 2000 is one of the few surveys that collected anthropometric data for all theindividuals in the family, not only children and women. In what follows we will explore prevalence ofover-nutrition and obesity among adults. A special section focuses on women in order to present aninternational comparison.
Women. Previous studies show that the over-nutrition problem is particularly serious for women.48 Table3.5 presents information from the latest available DHS surveys on excess weight and obesity among LatinAmerican women. .
Guatemalan women have the highest prevalence of obesity in the Latin American region (16 percent) andthe second highest prevalence of excess weight (32 percent) after Peru (36 percent). Moreover, bothexcess weight and obesity have increased in Guatemala over the last few years. In particular, obesity hasalmost doubled between 1995 and 2000, increasing from 8.1 percent to 16.0 percent.
48 Martorell et al (1998).
36
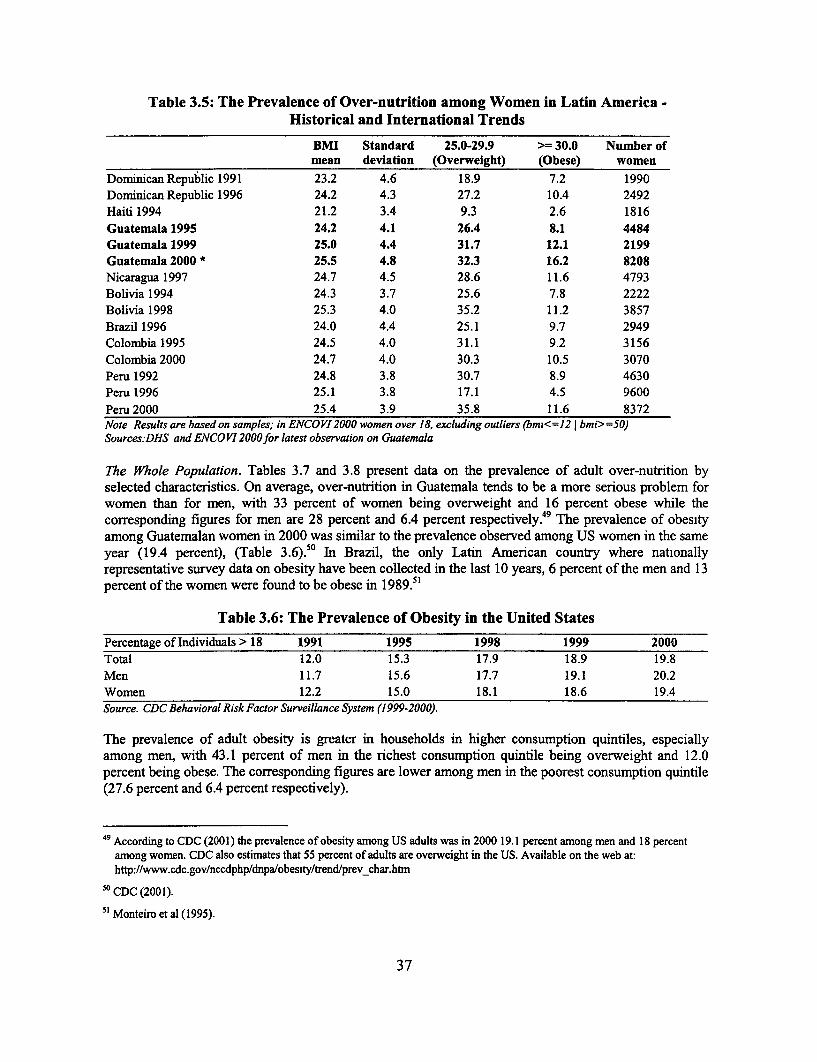
Table 3.5: The Prevalence of Over-nutrition among Women in Latin America -Historical and International Trends
BMI Standard 25.0-29.9 > 30.0 Number ofmean deviation (Overweight) (Obese) women
Dominican Republic 1991 23.2 4.6 18.9 7.2 1990Dominican Republic 1996 24.2 4.3 27.2 10.4 2492Haiti 1994 21.2 3.4 9.3 2.6 1816
Guatemala 1995 24.2 4.1 26.4 8.1 4484Guatemala 1999 25.0 4.4 31.7 12.1 2199Guatemala 2000 * 25.5 4.8 32.3 16.2 8208Nicaragua 1997 24.7 4.5 28.6 11.6 4793Bolivia 1994 24.3 3.7 25.6 7.8 2222Bolivia 1998 25.3 4.0 35.2 11.2 3857Brazil 1996 24.0 4.4 25.1 9.7 2949Colombia 1995 24.5 4.0 31.1 9.2 3156
Colombia 2000 24.7 4.0 30.3 10.5 3070Peru 1992 24.8 3.8 30.7 8.9 4630Peru 1996 25.1 3.8 17.1 4.5 9600
Peru 2000 25.4 3.9 35.8 11.6 8372Note Resultsare based on samples; in ENCOVI2000women over 18, excludingoutliers (bmz<=12 j bmi>=50)Sources:DHS and ENCO V12000for latest observation on Guatemala
The Whole Population. Tables 3.7 and 3.8 present data on the prevalence of adult over-nutrition byselected characteristics. On average, over-nutrition in Guatemala tends to be a more serious problem forwomen than for men, with 33 percent of women being overweight and 16 percent obese while thecorresponding figures for men are 28 percent and 6.4 percent respectively. 49 The prevalence of obesityamong Guatemalan women in 2000 was similar to the prevalence observed among US women in the sameyear (19.4 percent), (Table 3.6).5 In Brazil, the only Latin American country where nationallyrepresentative survey data on obesity have been collected in the last 10 years, 6 percent of the men and 13percent of the women were found to be obese in 1989.5'
Table 3.6: The Prevalence of Obesity in the United States
Percentage of Individuals > 18 1991 1995 1998 1999 2000Total 12.0 15.3 17.9 18.9 19.8Men 11.7 15.6 17.7 19.1 20.2Women 12.2 15.0 18.1 18.6 19.4Source. CDC Behavioral Risk Factor Surveillance System (1999-2000).
The prevalence of adult obesity is greater in households in higher consumption quintiles, especiallyamong men, with 43.1 percent of men in the richest consumption quintile being overweight and 12.0percent being obese. The corresponding figures are lower among men in the poorest consumption quintile(27.6 percent and 6.4 percent respectively).
49 According to CDC (2001) the prevalence of obesity among US adults was in 2000 19.1 percent among men and 18 percentamong women. CDC also estimates that 55 percent of adults are overweight in the US. Available on the web at:http://www.cdc.gov/nccdphp/dnpa/obesity/trend/prev_char.htm
50 CDC (2001).
51 Monteiro et al (1995).
37
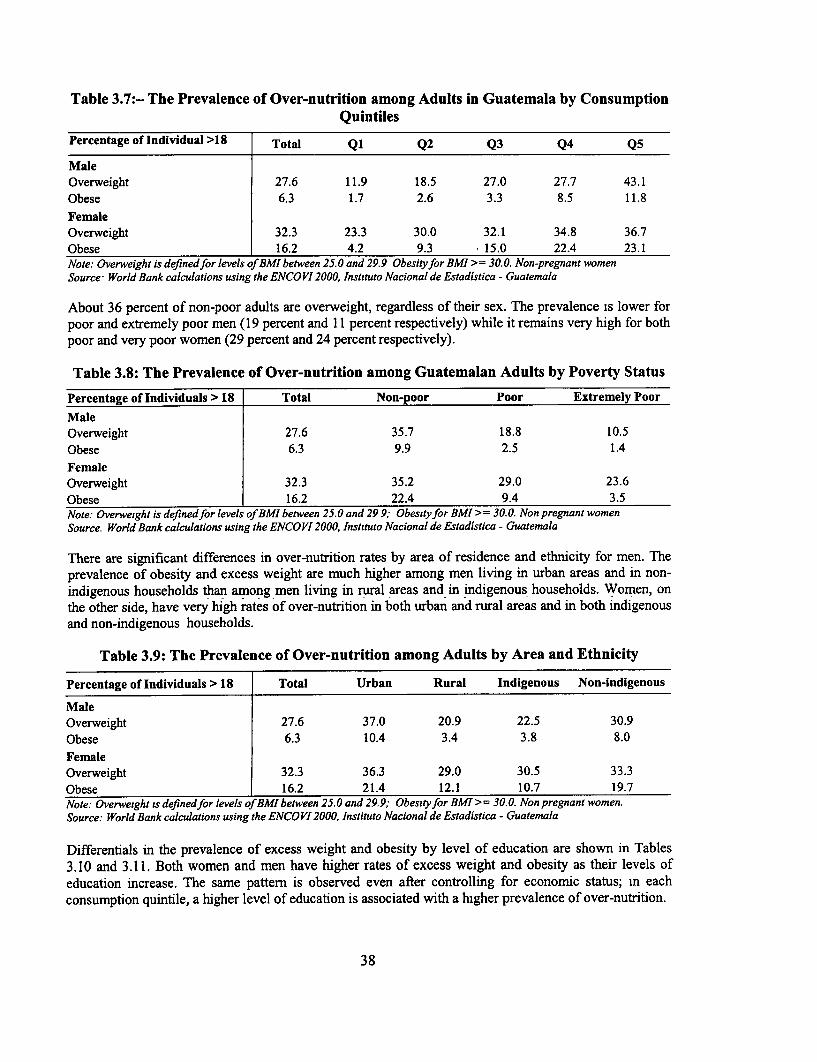
Table 3.7:- The Prevalence of Over-nutrition among Adults in Guatemala by ConsumptionQuintiles
Percentage of Individual >18 Total Q1 Q2 Q3 Q4 Q5
MaleOverweight 27.6 11.9 18.5 27.0 27.7 43.1
Obese 6.3 1.7 2.6 3.3 8.5 11.8
FemaleOverweight 32.3 23.3 30.0 32.1 34.8 36.7
Obese 16.2 4.2 9.3 15.0 22.4 23.1Note: Overweight is defined for levels ofBMI between 25.0 and 29.9 Obesityfor BMI >= 30.0. Non-pregnant womenSource- World Bank calculations using the ENCOVI 2000, Inst tuto Nacional de Estadistica - Guatemala
About 36 percent of non-poor adults are overweight, regardless of their sex. The prevalence is lower forpoor and extremely poor men (19 percent and 11 percent respectively) while it remains very high for bothpoor and very poor women (29 percent and 24 percent respectively).
Table 3.8: The Prevalence of Over-nutrition among Guatemalan Adults by Poverty Status
Percentage of Individuals > 18 Total Non-poor Poor Extremely Poor
MaleOverweight 27.6 35.7 18.8 10.5
Obese 6.3 9.9 2.5 1.4
FemaleOverweight 32.3 35.2 29.0 23.6
Obese 16.2 22.4 9.4 3.5Note: Overweight is definedfor levels of BMl between 25.0 and 299,; Obesityfor BMI >= 30.0. Non pregnant womenSource. World Bank calculations using the ENCO VI 2000, Instituto Nacional de Estadistica - Guatemala
There are significant differences in over-nutrition rates by area of residence and ethnicity for men. Theprevalence of obesity and excess weight are much higher among men living in urban areas and in non-indigenous households than among men living in rural areas and in indigenous households. Women, onthe other side, have very high rates of over-nutrition in both urban and rural areas and in both indigenousand non-indigenous households.
Table 3.9: The Prevalence of Over-nutrition among Adults by Area and Ethnicity
Percentage of Individuals > 18 Total Urban Rural Indigenous Non-indigenous
MaleOverweight 27.6 37.0 20.9 22.5 30.9
Obese 6.3 10.4 3.4 3.8 8.0
FemaleOverweight 32.3 36.3 29.0 30.5 33.3
Obese 16.2 21.4 12.1 10.7 19.7Note: Overweight ts definedfor levels ofBMI between 25.0 and 29.9; Obesityfor BMI >= 30.0. Non pregnant women.Source: World Bank calculations using the ENCO VI 2000, Instituto Nacional de Estadistica - Guatemala
Differentials in the prevalence of excess weight and obesity by level of education are shown in Tables3.10 and 3.11. Both women and men have higher rates of excess weight and obesity as their levels ofeducation increase. The same pattern is observed even after controlling for economic status; in eachconsumption quintile, a higher level of education is associated with a higher prevalence of over-nutrition.
38
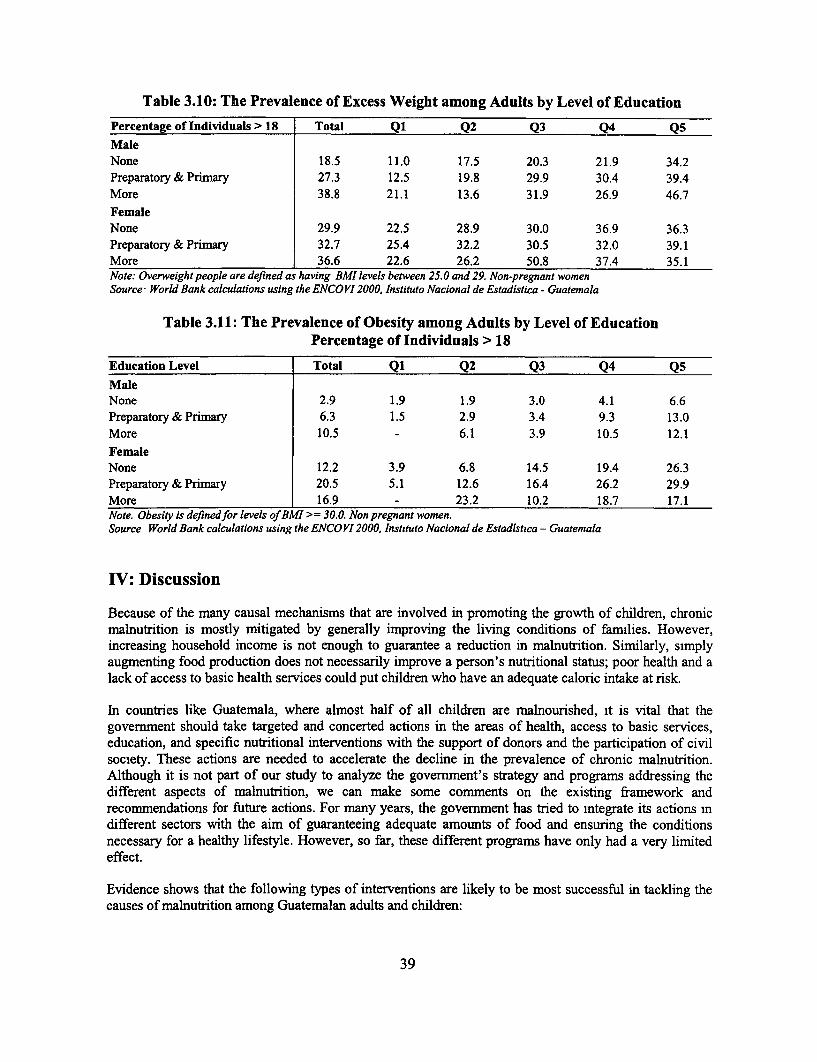
Table 3.10: The Prevalence of Excess Weight among Adults by Level of Education
Percentage of Individuals > 18 Total Q1 Q2 Q3 Q4 Q5
MaleNone 18.5 11.0 17.5 20.3 21.9 34.2Preparatory & Primary 27.3 12.5 19.8 29.9 30.4 39.4More 38.8 21.1 13.6 31.9 26.9 46.7
FemaleNone 29.9 22.5 28.9 30.0 36.9 36.3Preparatory & Primary 32.7 25.4 32.2 30.5 32.0 39.1More 36.6 22.6 26.2 50.8 37.4 35.1Note: Overweight people are defined as having BMI levels between 25.0 and 29. Non-pregnant womenSource World Bank calculations using the ENCO VI 2000, Instituto Nacional de Estadistica - Guatemala
Table 3.11: The Prevalence of Obesity among Adults by Level of EducationPercentage of Individuals > 18
Education Level Total Q1 Q2 Q3 Q4 Q5
MaleNone 2.9 1.9 1.9 3.0 4.1 6.6Preparatory & Primary 6.3 1.5 2.9 3.4 9.3 13.0More 10.5 - 6.1 3.9 10.5 12.1
FemaleNone 12.2 3.9 6.8 14.5 19.4 26.3Preparatory & Primary 20.5 5.1 12.6 16.4 26.2 29.9More 16.9 - 23.2 10.2 18.7 17.1Note. Obesity is definedfor levels of BMI >= 30.0. Non pregnant women.Source World Bank calculations using the ENCOVI 2000, Instituto Nacional de Estadistica - Guatemala
IV: Discussion
Because of the many causal mechanisms that are involved in promoting the growth of children, chronicmalnutrition is mostly mitigated by generally improving the living conditions of families. However,increasing household income is not enough to guarantee a reduction in malnutrition. Similarly, simplyaugmenting food production does not necessarily improve a person's nutritional status; poor health and alack of access to basic health services could put children who have an adequate caloric intake at risk.
In countries like Guatemala, where almost half of all children are malnourished, it is vital that thegovernment should take targeted and concerted actions in the areas of health, access to basic services,education, and specific nutritional interventions with the support of donors and the participation of civilsociety. These actions are needed to accelerate the decline in the prevalence of chronic malnutrition.Although it is not part of our study to analyze the govermment's strategy and programs addressing thedifferent aspects of malnutrition, we can make some comments on the existing framework andrecommendations for future actions. For many years, the government has tried to integrate its actions indifferent sectors with the aim of guaranteeing adequate amounts of food and ensuring the conditionsnecessary for a healthy lifestyle. However, so far, these different programs have only had a very limitedeffect.
Evidence shows that the following types of interventions are likely to be most successful in tackling thecauses of malnutrition among Guatemalan adults and children:
39
* Community-based Programs. A lack of appropriate nutrition information and incorrect feedingpractices for infants and young children are key causes of child malnutrition. A person's nutritionalstatus improves largely due to changes in his or her behavior. Yet Guatemala has introduced very fewcommunity-based programs, which have proven to be successful in producing this change mawareness and behavior in many countries of Latin Amenca. Analysis of different programs in otherparts of the world has also shown that community-based programs are the most cost-effectiveinterventions for child malnutrition.
* Mothers' Nutritional Status and Child Growth Monitoring. The government's current nutritionalstrategy focuses on feeding programs and school-based programs, which are not directly addressingthe most vulnerable groups, in other words, children under the age of two and pregnant women.
* Micronutrient Supplementation Programs. Guatemala's initial commitment to micronutrientsupplementation programs and the relative success of the fortification of sugar with Vitamin A showthat the country is capable of addressing the problem of malnutrition among the most vulnerablegroups. However, the failure of most of the other supplementation programs signals a need for propermonitonng of micro-nutritional programs and policies to bring Guatemala up to speed withinternational recommendations. In particular, the starting pomt should be the implementation of aninformation system to collect periodic and consistent data on micronutrient deficiency.
The following are the key groups that these programs should target:
* Preschool Children and Pregnant Women. Preschool children should be directly targeted, in contrastto most of the existing programs that only target children in school. Malnutrition does its greatestharm to children under 24 months old, which is the period of greatest brain development and greatestvulnerability. Children's malnutrition can be partly traced back to low birth weight (and, therefore, tomaternal malnutrition). Another critical period is between 6 and 24 months when infants make thetransition from being exclusively fed with breast milk (which provides all the nutrient and antibodiesneeded by the infant) to a diet of solid and liquid foods (often contaminated and of poor quality).
* Household-level Programs. Nutritional education programs are needed at the household level. Byemphasizing the importance of a more balanced diet, they could address both children's under-nutrition and the increasingly worrymg phenomenon of adult over-nutrition.
At the moment there is no individual to whom the President, the Congress, Ministers, or donors can turnto for authontative advice on nutrition. This lack of leadership and vision means that there is a lack ofdirection and prioritization among programs and that there are significant overlaps and gaps and muchinconsistency. It is necessary to address the leadership and organizational gap at the national level as soonas possible and to build into the process a system of oversight by civil society so that the overall direction,resources, and priorities do not change with each change of government.
Guatemala has the highest rate of chronic malnutrition in Latin America. Yet the government's strategicframework appears to have no guiding vision on nutrition, no clear division of labor across ministries, noadequate control of resources, and no accountability. Nor is there a mechanism for assessing howprograms perform. Functional leadership is absent, and the lack of a clear vision about nutrition sharedby government and stakeholders alike means that nutrition is neglected in terms of both the mobilizationand the deployment of resources.
40
Appendix A: Indicators and MethodoRogy
In this section we present the main indicators and the methodology used in the study.
Anthropometrv
Children. In empirical studies, child health is generally represented by one of the following measures: (i)clinical measures of bodily attributes; (ii) anthropometric measures of height, weight, and body massindex; (iii) respondent-reported symptoms, mortality histories, and general health evaluation; and (iv)reports of a child's inability to undertake normal activities.52 Measurement errors are inevitable in allkinds of measures, although they tend to be fewer m the case of the first two categories. Given thecomplexity and the costs associated with clinical measurements, anthropometric measures are generallypreferable for evaluating health and nutritional status in empirical studies." 3
Of all anthropometric measures, the weight-for-height, height-for-age, and weight-for-age indicators havebeen used most extensively. 54 Height-for-age, weight-for-height, and weight-for-age deficits arecommonly interpreted as indicative of chronic, acute, and total malnutrition respectively. It is veryimportant, however, to recognize that height and weight are measures of growth attainment rather thannutritional status per se.5
Height-for-age is an indicator of stunting, which represents the accumulated consequences of retardedskeletal growth and is frequently found to be associated with poor overall economic conditions. Weight-for-height is an indicator of wasting, a deficit in tissue and fat mass compared with the amount expectedin a child of the given height. One of the main characteristics of wasting is that it can develop veryrapidly, and, since under favorable conditions weight can be restored quickly, the individual can alsoregain the necessary weight equally rapidly. Weight-for-age is commonly interpreted as an indicator oftotal malnutrition or underweight. It has been shown that deficits in weight-for-age are a composite ofdeficits in weight-for-height and height-for-age and that studying weight-for-age does not add anyadditional information to that provided by studying the other two indicators- weight-for-height andheight-for-age.56
Evaluating the growth attainment of a population requires a reference population that allows for normalvariation within any age group. Although there are obvious differences between adults of differentethnicities, children of different ethnicities have the potential to achieve similar levels of growth m thefirst few years of their life. Many comparative empirical studies have demonstrated that socioeconomicfactors are of greater importance than race and ethnicity in determining children's height.57 Data fromIndia58 and Guatemala 59 suggest that ethnic differences in growth potential are minor prior to puberty and
52Behrman and Deolalikar (1988).
53 Martorell and Ho (1984) and Eveleth and Tanner (1990). See Thomas and Strauss (1996) for a discussion of the difficultiesassociated with the measurement of health status and the collection of height and weight data.
5 See Martorell and Habicht (1986) for a comprehensive review of the main research findings on the charactenstics of children'santhropometry in developing countries.
55 Martorell (1982) and WHO Working Group (1986).56 Keller (1983).
57 See Part I for a bnef review of such studies.
" Rao and Sastry (1977).
59 Johnston, Borden, and MacVean (1973).
41
that it is during this stage that the major differentiation between ethnic groups takes place. Cleardifferences surface during the adolescence period for both sexes; Guatemalan and Indian children whowere near the 50th percentile of the reference growth charts prior to puberty, ended up near the 25hpercentile by the end of adolescence.
The World Health Organization has long recommended the use of a reference population for theassessment of the nutritional status of children.60 The International Reference Population advocated by theWorld Health Organization (WHO) was developed by the US Centers for Disease Control (CDC) basedon data from the National Center for Health Statistics (NCHS). The reference curves were obtamed fromtwo different populations. For children below the age of two years, the sample is small and is basedalmost exclusively on white, middle-class children attending the FELS Research Institute in Ohio. Thechildren's recumbent lengths were measured for the FELS data. For children aged two to adulthood, theWHO/NCHS/CDC cross-sectional curves are based on the relatively large and nationally representativesample of children obtained from the first National Health and Nutrition Examination Survey m theUnited States. Therefore, it also includes non-whites and children from low-income households. Thechildren standing heights were measured for the NCHS data.6 '
In order to be able to compare the growth attainment of children of different ages by sex, we convertedthe ENCOVI/NE anthropometric measurements into three indexes: height-for-age, weight-for-age, andweight-for-height. Using the WHO/NCHS/CDC curves, we then expressed the growth attainment of eachchild as a standard deviation from the median (z-scores). 62 The standardizing calculations were made withANTHRO (Software for Calculating Pediatric Anthropometry), Version 1.01, provided by the Division ofNutrition of the Centers for Disease Control and the Nutrition Unit of the World Health Organization.
The z-score measures the degree to which a child's measurements deviate from what is expected for thatchild based on a reference population. The formula for the calculation of the height-for-age z-score is:
z, = (y,' a - H s`a)/csa
where z, = z-score for child i; Y,Sa = measured height (in cm) for child i of sex s and age a;
H s=a median height (in cm) for children of sex s and age a in the reference population; and
s.a = standard deviation in height (in cm) for children of sex s and age a in the referencepopulation. 63
In the reference population, 2.3 percent of the children had a z score less than -2, and 16 percent had ascore of less than -1. These levels are generally expected for a "normal" population. We then calculatedmalnutrition rates as the percentage of children younger than five whose z score was two standarddeviations below the reference value. Children were defined as stunted if their height-for-age z score wasused, as wasted if their weight-for-height score was used. and underweight if their weight-for-age scorewas used.
60 Waterlow et al (1977), WHO (1979), WHO (1983), and WHO Working Group (1986)
61 Hamill et a] (1979).
62 Waterlow et al (1977) and WHO Working Group (1986).
63 For example, in computing the z-score for height-for-age of a 17-month old boy, the child's height was compared to thedistribution of height among 17-month old boys in the intemational reference population (the median and standard deviation are81 4 cm and 3.0 cm respectively). If the mdex child is 76.5 cm tall, his height is 1.63 standard deviations below the median andhe is assigned a z-score of-1.63.
42

Adults. The nutritional status of adults has been studied less intensively then that of children's, in partbecause of a lack of data and in part because the consequences of malnutrition for adults are considered tobe less severe than for children. Moreover, since the nutritional status of adults is largely determinedearlier in their lives, there is less scope for policy interventions. Also, although genetic variations ingrowth attainment at adult age are very important, the use of an international reference against which tomeasure individual growth perfonnance is problematic. However, there are several reasons why it ishighly desirable to analyze the nutritional status of adults. First, the nutritional status of women can haveserious consequences for their children's birth-weights and for infant mortality. Second, some studieshave shown that there are economic and health consequences to being a malnourished adult. Not only haslow body mass index (BM1) been shown to have a negative effect on labor productivity but also, indeveloping countries, a BMI lower than 18.5 has been associated with increased mortality risk.
There is evidence that, in many developing countries and particularly in Latin America, overweight adultsare more common than underweight adult. In most population, excess weight and obesity are generallyassociated with increase risks of morbidity, like heart disease, diabetes mellitus, and some forms ofcancer.
The body mass index - weight in kilograms over height in meters squared - is the most common indicatorof adult nutritional status.64 BMI measures the thinness or obesity of adults controllmg for the fact thatweight is influenced by height and, therefore, is less biased by this relationship than other indexes.Moreover, by being correlated with fat mass, BMI is a good index of body energy. The WHO ExpertCommittee on Physical Growth suggests that a BMI of 18.5 should be seen as the minimum requirementfor adequate health and proposes the classification presented in Table A. 1.
Table Al: Cutoff Points for BMI - Adults
Classification BMI RangeUnderweight(Chronically Energy Deficient)
Mild 17-18.49Moderate 16-16.99Severe <16
Normal 18.5-24.99Overweight >=25
Preobese 25-29.99Obese Class 1 30-34.99Obese Class 2 35-39.99Obese Class 3 >40
Source: WHO, 1995 and 2000.
Table A.2 shows the prevalence levels of adult malnutrition and specifies which levels would indicate theexistence of a public health problem.
"BMI is an appropnate indicator for white individuals living in Europe or North Amenca, but its appropriateness has beenquestioned for other populations that differ in body build and proportions (WHO Expert Comnittee, 1995).
43
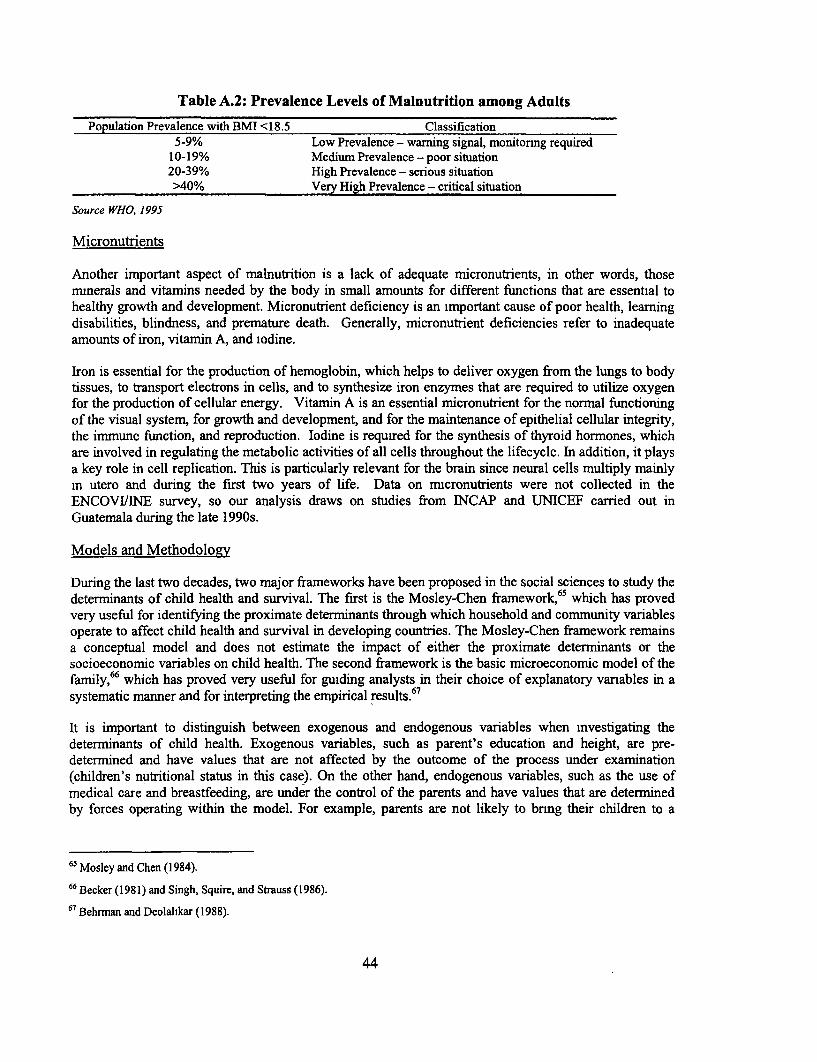
Table A.2: Prevalence Levels of Malnutrition among Adults
Population Prevalence with BMI <18.5 Classification5-9% Low Prevalence - warning signal, monitornng required
10-19% Medium Prevalence - poor situation20-39% High Prevalence - serious situation>40% Very High Prevalence - critical situation
Source WHO, 1995
Micronutrients
Another important aspect of malnutrition is a lack of adequate micronutrients, in other words, thosemmnerals and vitamins needed by the body in small amounts for different functions that are essential tohealthy growth and development. Micronutrient deficiency is an important cause of poor health, learningdisabilities, blindness, and premature death. Generally, micronutrient deficiencies refer to inadequateamounts of iron, vitamin A, and iodine.
Iron is essential for the production of hemoglobin, which helps to deliver oxygen from the lungs to bodytissues, to transport electrons in cells, and to synthesize iron enzymes that are required to utilize oxygenfor the production of cellular energy. Vitamin A is an essential micronutrient for the normal functioningof the visual system, for growth and development, and for the maintenance of epithelial cellular integrity,the immune function, and reproduction. Iodine is required for the synthesis of thyroid hormones, whichare involved in regulating the metabolic activities of all cells throughout the lifecycle. In addition, it playsa key role in cell replication. This is particularly relevant for the brain since neural cells multiply mainlyin utero and during the first two years of life. Data on micronutrients were not collected in theENCOVIILNE survey, so our analysis draws on studies from INCAP and UNICEF carried out inGuatemala during the late 1 990s.
Models and Methodology
During the last two decades, two major frameworks have been proposed in the social sciences to study thedeterminants of child health and survival. The first is the Mosley-Chen framework, 65 which has provedvery useful for identifying the proximate determinants through which household and community variablesoperate to affect child health and survival in developing countries. The Mosley-Chen framework remainsa conceptual model and does not estimate the impact of either the proximate determinants or thesocioeconomic variables on child health. The second framework is the basic microeconomic model of thefamily,66 which has proved very useful for guiding analysts in their choice of explanatory vanables in asystematic manner and for interpreting the empirical results.67
It is important to distinguish between exogenous and endogenous variables when investigating thedeterminants of child health. Exogenous variables, such as parent's education and height, are pre-determined and have values that are not affected by the outcome of the process under examination(children's nutritional status in this case). On the other hand, endogenous variables, such as the use ofmedical care and breastfeeding, are under the control of the parents and have values that are determinedby forces operating within the model. For example, parents are not likely to bnng their children to a
65 Mosley and Chen (1984).
66 Becker (1981) and Singh, Squire, and Strauss (1986).
67 Behrman and Deolalikar (1988).
44

medical provider unless they think their children are sick. Including endogenous variables without furthercontrol would result in biased estimated coefficients.
The Mosley-Chen Framework. In their analytical framework, Mosley and Chen identify five categories ofproximate determinants of child health and survival in developing countries: (i) maternal factors (age atchildbearing, parity, and birth intervals, which are affected by reproductive practices); (ii) environmentalcontamination with infectious agents, which is influenced by hygienic practices; (iii) nutrient deficiency(calories, protein, and micronutrnents, which are affected by feeding practices); (iv) injuries (accidentsand intentional injuries, which are affected by care); (v) personal illness control (preventive measures andcurative treatment, which are affected by health care practices). The framework is very comprehensiveand shows how causes of malnutrition are multi-sectoral, ranging from food intake through health carepractices to economic status. All social and economic determinants must operate through the proximatedeterminants to affect children's health and survival.
The Economic Model of the Family. The Beckerian microeconomic model of the family provides thebasic theoretical framework for a number of empirical studies of determinants of nutritional status.According to the simplified one-period model, households maximize the followmg utility function:
U = u(X, L, N)
where X and L represent the households' consumption of a composite good (the vector of consumptiongoods of different individuals in the household) and the household members' leisure respectively, and Nis the nutritional status of household members. Households maximize their utility function under severalconstraints, including a time constraint for each household member, a budget constramt for the entirehousehold, and a biological nutrition production function:
N = n(I, Z, Tj)
The nutrition production function n relates the nutritional status of the child (the age and sex standardizedanthropometric measure, either height-for-age or weight-for-age) to his or her past health status and theproximate determinants as outlined in the Mosley-Chen framework. In this simplified one-period model,nutrition is a function of a set of inputs chosen by the household (including food intake, breastfeeding,utilization of health facilities, and the time dedicated by the mother to health-related activities), a set ofexogenous characteristics (Z), which include the child's age and gender, the parents' health andeducation, and other household and community factors that influence a child's nutrition. Ti is a stochasticerror term representing unobserved individual, household, and community characteristics affectingchildren's nutritional status.68
Ideally, one could estimate the effect of variables that influence directly a child's nutritional status byestimating the simultaneous system of the health production function and input demands. Unfortunately,the structure of the analysis is severely constrained by what data are available. The health productionfunction is a complex relationship that cannot be captured easily by regression analysis based on cross-sectional survey data. It is best estimated with longitudinal data, which provide sufficient information tomake it possible to make reliable judgments on the relative importance of different proximatedeterminants on growth attainment at the individual level.
The estimation of the health production function is further complicated by the fact that input use may becorrelated with the error terms. The major source of bias arises from unobserved heterogeneity in the
68 For more details on the fornulation of the health production function, see Behrman J.R. and A.B. Deolalikar (1988).
45
outcomes, in other words, the use of inputs is correlated with factors unknown to the researcher. Forexample, parents may take a child to the hospital more often if they are aware of the child's weak physicalcondition. Not taking into account the child's initial health endowment would underestimate the effects ofthe utilization of health facilities.
Researchers have often adopted instrumental variables and fixed effects models to address this concern.Unfortunately, identifying instruments for inputs is often a difficult task. Moreover, it is almostimpossible to measure all the inputs that enter into the health production function. Omittmg inputs - orthe quality of inputs - that are correlated with other included input (or instruments) could yield biasedestimates.
Using cluster fixed-effect models, on the other side, makes it possible to control for missing variables atthe cluster level (in other words, at the family/household level). The main problem in using fixed-effectmodels is twofold: (i) if dummy variables are included for every fixed effect (such as for every family orevery cluster), computation may not be feasible(in other words, if we added one dummy for eachhousehold); and (ii) if the fixed effect is differenced away, then the effect of those variables that do notvary within a cluster (such as income in the household or infrastructure in a community) will be lost inthe estimation process. Moreover, fixed effects do not work if non-linearities are ornitted in the model andif the unobservable variables affecting the health production function are not fixed.69
Quasi-reduced Form Estimation. In the absence of adequate instrument and fixed-effect models,estimating reduced-form equations has proved to be a viable solution. Estimation of the reduced-formanthropometry function n does not provide information on the biological mechanisms responsible forchildren's growth deficits, but it does provide a consistent statistical framework within which to estimatethe impact on children's health and nutrition of household and community exogenous variables that aregenerally open to policy intervention. The parameter estimates of the coefficients in the reduced-formequation can be interpreted as thefull effects of exogenous covariates, that is their effects not mediated bythe proximate determinants.
The microeconomic model of the family can be solved to yield a reduced-form equation for healthoutcomes in which child anthropometry depends only on exogenous individual, household, andcommunity characteristics:
N; = n(C,, Ch, Cc, si),
where N, is the height-for-age z-score for child i;
C, are the individual characteristics of the child, including age and sex;
Ch are household characteristics that incorporate measures of family background, including resourceavailability, parents' health, and parents' skills measured generally by their level of education, andwhether the father is absent from the household;
C. are community characteristics, including the availability of health services, the state of infrastructuresuch as water and sewage, food prices, and other community characteristics that affect child healththrough the proximate determinants; and
69 Multi-level (random effects) linear models offer an alternative to fixed-effect models but do require additional assumptionsabout the distnbution of the error terms.
46
E, is an individual specific random disturbance associated with the anthropometric outcome of the indexedchild and is assumed to be uncorrelated with the C vanables.
An alternative to the simple reduced-form approach is to estimate a quasi-reduced form model,'° whichdiffers from the standard model in that it includes some predicted inputs from the health productionfunction (like consumption or quality of water or sanitation) and some variables from the reduced-formdemand equation. Compared to the traditional reduced form, this approach has the advantage ofcontrolling for the endogeneity bias and helping to explain the effect of some policy instruments, such asthe availability of household resources. On the other hand, interpreting results from this kind of study isdifficult, as they do not disclose the total effect of exogenous changes nor all of the structural parameters.In Part I, we estimated a quasi-reduced form model in which we used a household's assets, land, and non-wage income as identifying instruments for per capita household consumption.
70 See Berman and Deolalikar (1988) and Sahn (1989).
47
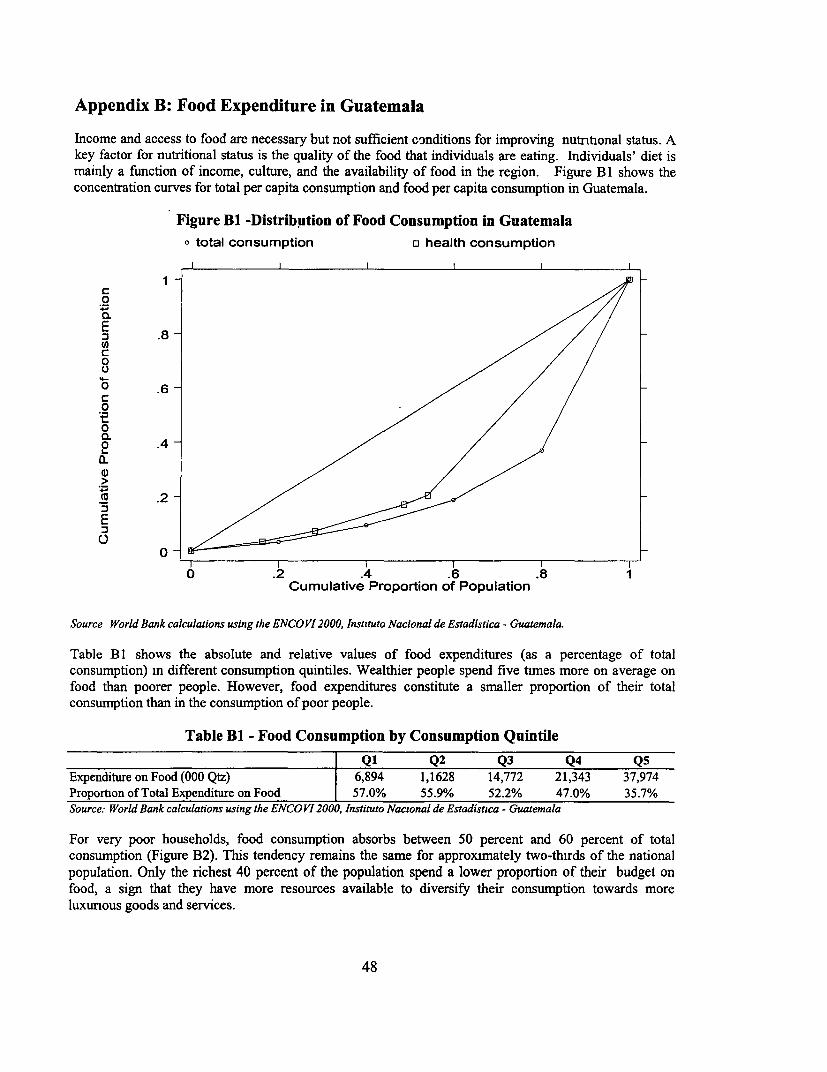
Appendix B: Food Expenditure in Guatemala
Income and access to food are necessary but not sufficient conditions for improving nutrtional status. Akey factor for nutritional status is the quality of the food that individuals are eating. Individuals' diet ismainly a function of income, culture, and the availability of food in the region. Figure B 1 shows theconcentration curves for total per capita consumption and food per capita consumption in Guatemala.
Figure BI -Distribution of Food Consumption in Guatemalatotal consumption o health consumption
o .2 .0.E
04- .
Ca .6
0
_ .2~0 2 4.6.
Cumulative Proportion of Population
Source World Bank calculations using the ENCO VI 2000, Instituto Nacional de Estadistica - Guatemala.
Table B 1 shows the absolute and relative values of food expenditures (as a percentage of totalconsumption) in different consumption quintiles. Wealthier people spend five times more on average onfood than poorer people. However, food expenditures constitute a smaller proportion of their totalconsumption than in the consumption of poor people.
Table B1 - Food Consumption by Consumption Quintile
Ql Q2 Q3 Q4 Q5Expenditure on Food (000 Qtz) 6,894 1,1628 14,772 21,343 37,974Proportion of Total Expenditure on Food 57.0% 55.9% 52.2% 47.0% 35.7%Source: World Bank calculations using the ENCO VI 2000, Instituto Nacional de Estadistuca - Guatemala
For very poor households, food consumption absorbs between 50 percent and 60 percent of totalconsumption (Figure B2). This tendency remains the same for approximately two-thirds of the nationalpopulation. Only the richest 40 percent of the population spend a lower proportion of their budget onfood, a sign that they have more resources available to diversify their consumption towards moreluxunous goods and services.
48
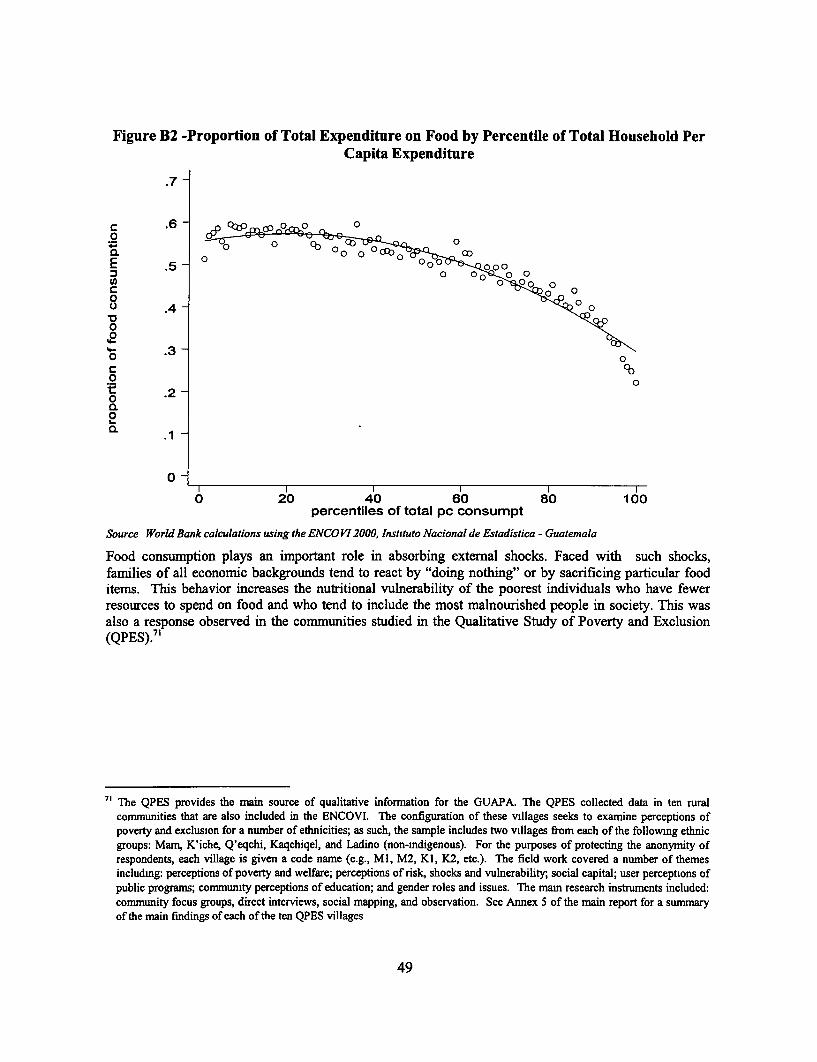
Figure B2 -Proportion of Total Expenditure on Food by Percentile of Total Household PerCapita Expenditure
.7 -
n6 - p 0Pco0 0g.
o 0~~~~~~~~~~~~~~~~~~
'4-
'4- .3 -o 0c Cb0 0*t .200.
O -
0
0 20 40 60 80 100percentiles of total pc consumpt
Source World Bank calculations using the ENCOVI 2000, Instututo Nacional de Estadistica - Guatemala
Food consumption plays an important role in absorbing external shocks. Faced with such shocks,families of all economic backgrounds tend to react by "doing nothing" or by sacrificing particular fooditems. This behavior increases the nutritional vulnerability of the poorest individuals who have fewerresources to spend on food and who tend to include the most malnourished people in society. This wasalso a response observed in the communities studied in the Qualitative Study of Poverty and Exclusion(QPES)."
71 The QPES provides the main source of qualitative infornation for the GUAPA. The QPES collected data in ten ruralcommunities that are also included in the ENCOVI. The configuration of these villages seeks to examine perceptions ofpoverty and exclusion for a number of ethnicities; as such, the sample includes two villages from each of the followmg ethnicgroups: Mam, K'iche, Q'eqchi, Kaqchiqel, and Ladino (non-indigenous). For the purposes of protecting the anonymity ofrespondents, each village is given a code name (e.g., Ml, M2, KI, K2, etc.). The field work covered a number of themesincludmng: perceptions of poverty and welfare; perceptions of risk, shocks and vulnerability, social capital; user perceptions ofpublic programs; community perceptions of education; and gender roles and issues. The main research instruments included:community focus groups, direct interviews, social mapping, and observation. See Annex 5 of the main report for a summaryof the main findings of each of the ten QPES villages
49
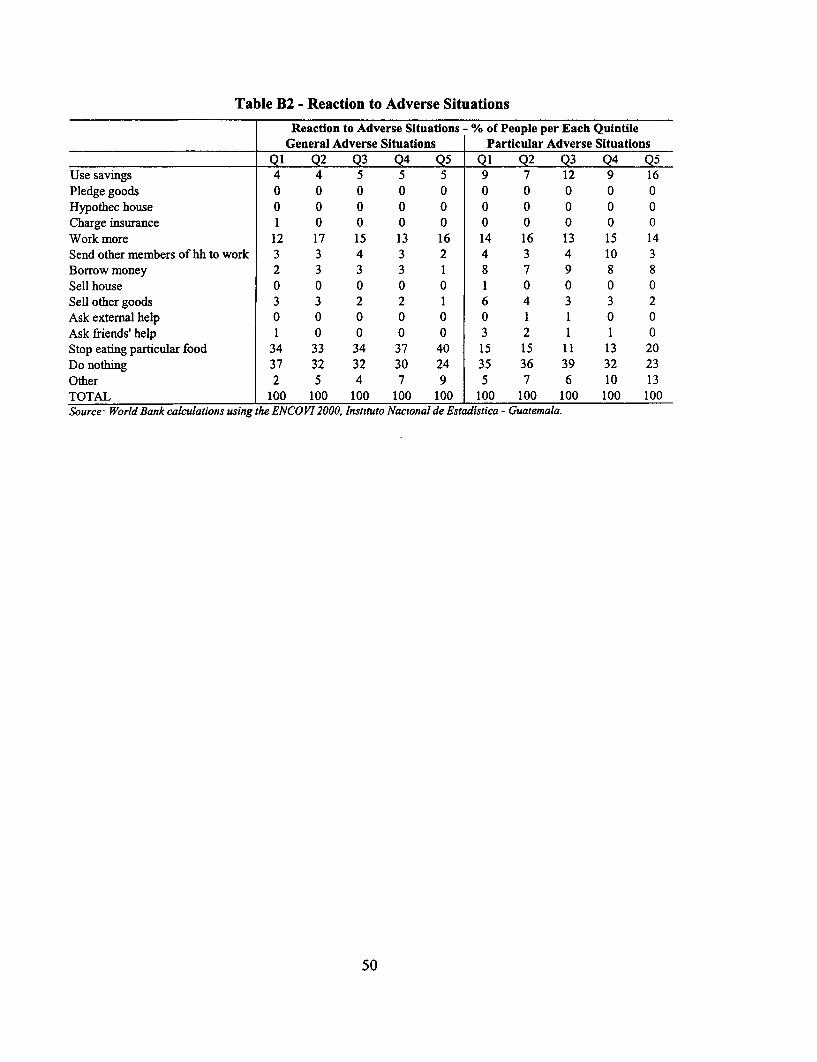
Table B2 - Reaction to Adverse Situations
Reaction to Adverse Situations - % of People per Each QuintileGeneral Adverse Situations Particular Adverse Situations
Ql Q2 Q3 Q4 Q5 Ql Q2 Q3 Q4 Q5Use savings 4 4 5 5 5 9 7 12 9 16Pledge goods 0 0 0 0 0 0 0 0 0 0Hypothec house 0 0 0 0 0 0 0 0 0 0Charge insurance 1 0 0 0 0 0 0 0 0 0Work more 12 17 15 13 16 14 16 13 15 14Send othermembers ofhhto work 3 3 4 3 2 4 3 4 10 3Borrow money 2 3 3 3 1 8 7 9 8 8Sell house 0 0 0 0 0 1 0 0 0 0Sell other goods 3 3 2 2 1 6 4 3 3 2Ask external help 0 0 0 0 0 0 1 1 0 0Ask friends'help 1 0 0 0 0 3 2 1 1 0Stopeatingparticularfood 34 33 34 37 40 15 15 11 13 20Do nothing 37 32 32 30 24 35 36 39 32 23Other 2 5 4 7 9 5 7 6 10 13TOTAL 100 100 100 100 100 100 100 100 100 100Source World Bank calculations using the ENCOVI 2000, Instituto Nacional de Estadistica - Guatemala.
50
References
Alderman, H. and L. Christiaensen. 2001. "Child Malnutrition in Ethiopia: the Role of Income,Education and Nutrition Programs" Presented at the World Bank's Economists' Forum, 3-4- May2001, Washington D.C..
Alderman, H. and M. Garcia, 1993/94. "Food Security and Health Security, Explainig the Levels ofNutritional Status in Pakistan" Economic Development and Cultural Change, vol. 42.
Alderman, H. 2000. "Anthropometry" in M. Grosh & P. Glewwe Designing Household SurveyQuestionnaires for Developing Countries: Lessons from 15 Years of the Living StandardsMeasurement Studv. Volume 1, The World Bank.
Alderman, H., 1993. "New Research on Poverty and Malnutrition. What are the implications for researchand policy?" Paper presented at the World Bank-IFPRI Conference on Poverty, Arlie House Oct25-28, in M. Lipton and J. Van der Gaag, eds., Including the Poor, 1993.
Alderman, H. 1990"Nutritional Status in Ghana and its Determinants, Social Dimension of Adjustment inSub-Saharan Africa" Working Paper 3, World Bank, Washington, DC.
American Academy of Pediatrics, 1997. "Breastfeeding and the Use of Human Milk"(RE9729)Pediatrics, Policy Statement, Vol. 100, N.6. Available on the web at:http://www.aap.org/policy/re9729.html
Barrera, A., 1990. "The Role of Matemal Schooling and Its Interactions with Public Health Programs inChild Health Production" Journal of Development Economics, 32.
Barrett, C. Forthcoming. "Food Security and Food Assistance Programs" in B. Gardner and G. Rausser,eds., Handbook of Agricultural Economics Vol.2, Amsterdam, Elsevier Science.
Becker, G. 1981. A Treatise on the Family, Cambridge: Harvard University Press.
Behrman, J. R. and B. Wolfe, 1987. "How Does Mother's Schooling Affect the Family's Health,Nutrition, Medical Care Usage and Household Sanitation?" Journal of Econometrics, 36.
Behrman, J.R. and A.B. Deolalikar. 1988. "Health and Nutrition" Chapter 14 in Handbook ofDevelopment Economics. Volume I, eds. H. Chenery and T.N. Srinivasan. Amsterdam: ElseverScience Publishers.
Brakohiapa, L.A., J. Yartley, A. Bille, E. Harrison, E. Quansah, M.A. Armar, K. Kishi, and S.Yamamoto.1988. "Does Prolonged Breastfeeding Adversely Affect a Child's Nutritional Status?" Lancet2:416-418.
CDC, 2001. "Obesity Trends, Prevalence and Obesity among US Adults by Characteristics" Available onthe web at: http://www.cdc.gov/nccdphp/dnpalobesity/trend/prev_char.htm.
CDC Behavioral Risk Factor Surveillance System (BRFSS), 1999-2000. Available on the web at:http://www.cdc.aov/nccdphp/brfss/
Chen, L.C. and N.S. Scrimshaw (eds). 1983. Diarrhea and Malnutrition. Interactions. Mechanisms, andInterventions. New York: Plenum Press.
51
Constituci6n Politica de la RepuTblica de Guatemala 1985.De Onis, M. and M. Blossner, 2000."Prevalence and Trends of overweight among preschool children in developing countries"American Journal of Clinical Nutrition, 72.
Eveleth, P.B. and J.M. Tanner. 1990. Worldwide Variation in Human Growth. Second Edition.Cambridge: Cambridge University Press.
Gardner G and B Halweil, 2000, "Underfed and Overfed, The Global Epidemic of Malnutrition" WorldWatch Paper, Washington D.C.
Gragnolati, M., 1999, "Child Malnutrition m Rural Guatemala: A Multilevel Statistical Analysis" PhDDissertation. Office of Population Research, Princeton University.
Hobcraft, J.N., J.W. McDonald and S.O. Rutstein. 1985. "Demographic Determinants of Infant and EarlyChild Mortality: A Comparative Analysis" Population Studies 39(3):363-385.
Horton, S, 1988, "Birth Order and Child Nutritional Status: Evidence from the Philippines" EconomicDevelopment and Cultural Change, January: 341-45.
IFPRI, 2000. Fourth Report on the World Nutrition Situation, January 2000.
INCAP, 1999. La Iniciativa de Seguridad Alimentaria Nutricional en Centro America, Guatemala, Marzo1999.
INCAP/ OPS y UNICEF, 2000. Situaci6n de los Alimentos Fortificados, Guatemala, 2000.
INCAP/ OPS, 2000. Seguridad Alimentaria Nutricional en Centro America, Guatemala, Enero 2000
Johnston, F.E., M. Borden, and R.B. MacVean. 1973. "Height, Weight and Their Growth Velocities inGuatemalan Private School Children of High Socioeconomic Class" Human Biology 45:627-641.
Keller W. 1983. "Choice of Indicators of Nutritional Status" in Evaluation of Nutrition Education inThird World Communities. Ed. B. Schurch. Nestle' Foundation Publication Series. Bern: HansHuber Publishers.
Lavy, V., J.Strauss, D. Thomas, P de Vreyer. 1994. "Quality of Health Care, Survival and HealthOutcomes in Ghana" Journal of Health Economics.
Martorell, R. and T.J. Ho. 1984. "Malnutrition, Morbidity and Mortality" Pp. 49-68 in Child Survival:Strategies for Research, eds. W.H. Mosley and L.C. Chen. Supplement to Population andDevelopment Review 10.
Martorell, R., Nutrition and health status indicators : suggestions for surveys of the standard of living indeveloping countries, Washington, D.C. : World Bank, Development Research Center, 1982.
Martorell, R., J. Leslie and P.R. Moock. 1984. "Characteristics and Determinants of Child NutritionalStatus in Nepal" American Journal of Clinical Nutrition 39:74-86.
Martorell, R., L.K. Kahn, M.L. Hughes and L.M. Grummer-Strawn, 1998. "Obesity in Latin AmericanWomen and Children" Journal of Nutrition, 129.
52
Martorell, R. and C. Yarbrough. 1983. "The Energy Cost of Diarrheal Diseases and Other CommonDiseases in Children" Pp. 125-141 in Diarrhea and Malnutrition. Interactions. Mechanisms, andInterventions, eds L.C. Chen and N.S. Scrimshaw. New York: Plenum Press.
Monteiro C.A., L. Mondini, Ana Lucia Medeiros de Souza and B.M. Popkin 1995. "The NutritionTransition in Brazil" European Journal of Clinical Nutrition, 49:105-113.
Mosley, W.H. and L. Chen. 1984. "An Analytical Framework for the Study of Child Survival mDeveloping Countries' Pp. 25-48 in Child Survival: Strategies for Research, eds. W.H. Mosleyand L.C. Chen. Supplement to Population and Development Review 10.
Pebley, A.R. and N. Goldman. 1995. "Social Inequality and Children's Growth in Guatemala" HealthTransition Review 5:1-20.
Pebley, A.R., E. Hurtado and N. Goldman. 1999 "Beliefs about Children's Illness." Journal of BiosocialScience, 31:195-219.
Pebley, A.R. and P.W. Stupp. 1987. "Reproductive Patterns and Child Mortality in Guatemala"Demography 24(l):43-60.
PMA, 2001, PrograTna en el Pais - Guatemala, 2001-2004.
Ramirez, N., 2001. Micronutrientes y Situacion Nutricional, UNICEF, Julio 2001.
Rao, D.H. and J.G. Sastry. 1977. "Growth Pattern of Well-to-Do Indian Adolescents and YoungChildren" Indian J. Med. Res. 66:950-956.
Rohde, J.E. 1986. "Acute Diarrhea" in Strategies for Primary Health Care: Technologies Appropriate forthe Control of Disease in the Developing World eds. J.A. Walsh and K.S. Warren. Chicago:University of Chicago Press.
Sahn, D., 1989. "The Contribution of Income to Improved Nutrition in Cote d'Ivoire" Journal of AfricanEconomies, Vol.3, N.l.
Sahn, D.E. and H. Alderman, 1997. "On the Determinants of Nutrition in Mozambique: the Importance ofAge Specific Effects" World Development 25.
Sastry, N. 1997. "Family-Level Clustering of Childhood Mortality Risk in Northeast Brazil" PopulationStudies 51:245-261.
Singh I., L. Squire, and J. Strauss. 1986. Agricultural Household Models: Extensions. Applications andPolicy. Baltimore: The Johns Hopkins University Press.
Solares, J., 1997. Etnicidad, Salud y Riesgo in Guatemala: OPS/OMS-BID.
Solomon, C.G. and J.E. Manson, 1997. "Obesity and mortality: a review of the epiderniologic data"American Journal of Clinical Nutrition, 66.
Stevens, J., J. Cai, E.R. Pamuk, D. F. Williamson, M.J. Thun, and J. L. Wood. 1998. "The Effect of Ageon the Association between Body-Mass Index and Mortality" New England Journal of Medicine,338.
53
Strauss, J. and D. Thomas, 1995, "Human Resources: Empirical Modeling of Household and FamulyDecisions" in J. Behrman and T.N. Srinivasan eds., Handbook of Development Economics. vol 3.Amsterdam, North Holland.
Thomas D., J. Strauss and M. H. Henriques, 1988. "How Does A Mother's Education Affect Child'sHeight?" University of Warwick, mimeo, 1988.
Thomas, D. and J. Strauss, 1992. "Prices, Infrastructure, Household Characteristics, and Child Height"Journal of Development Economics 39:301-331.
Thomas, D., J. Strauss, M.-H. Henriques. 1990. "Child Survival, Height for Age and HouseholdCharacteristics in Brazil" Journal of Development Economics 33:197-234.
Trussel, J., L. Grummer-Strawn, G. Rodriguez, and M. VanLandingham. 1992. "Trends and Differentialsin Breastfeeding Behavior: Evidence for the WFS and DHS." Population Studies 46:285-307.
UNICEF, 1998. The State of World Children
UNICEF, 2000. The State of World Children
UNICEF/ CONAPLAM, 2000. Avances en el Cumplimento de las Metas de Cumbre Mundial en Favorde la Infancia, Guatemala, Febrero 2000.
Victora, C.G., J.P. Vaughan, J.C. Martines, and L.B. Barcelos. 1984. "Is Prolonged BreastfeedingAssociated with Malnutrition?" American Journal of Clinical. Nutrition. 39:307-314.
Victora, C.V., P. Vaughan, B.R. Kirkwood, J.C. Martines, and L.B. Barcelos. 1986. "Risk Factors forMalnutrition in Brazilian Children: the Role of Social and Environmental Variables" Bulletin ofthe World Health Organization 64(2):299-309.
Victora, C.V., F.C. Barros, B.R. Kirkwood, and J.P. Vaughan. 1990. "Pneumonia, Diarrhea, and Growthin the First Four Years of Life" American Journal of Clinical Nutrition. 52:391-396.
Waterlow, J.R., W. Buzina, W. Keller, J. Lane, M. Nichaman, and J. Tanner. 1977. "The Presentation andUse of Height and Weight Data for Comparing the Nutritional Status of Groups of Children underthe Age of 10 Years" Bulletin of the World Health Organization 55(4):489-498.
World Bank, 2000. Nutrition Toolkit, Health Nutntion and Population Sector, The World Bank.
World Health Organization Working Group. 1986. "Use and Interpretation of Anthropometric Indicatorsof Nutritional Status" Bulletin of the World Health Organization 64:924-941.
World Health Organization, 1995. "Physical Status: The Use And Interpretation of Anthropometry"Report of a WHO Expert Committee. WHO Technical Report Series 854, Geneva.
World Health Organization, 2000. "Obesity: Preventing and Managing the Global Epidemic" Report of aWHO Consultation, Geneva.
World Health Organization Note for the Press. 2001. On the web at: http://www.who.int/inf-pr-200 1/en/note2001 -07.htrnl.
54


Policy Research Working Paper Series
ContactTitle Author Date for paper
WPS2938 Recurrent Expenditure Requirements Ron Hood December 2002 M Galatisof Capital Projects: Estimation for David Husband 31177Budget Purposes Fei Yu
WPS2939 School Attendance and Child Labor Gladys L6pez-Acevedo December 2002 M Gellerin Ecuador 85155
WPS2940 The Potential Demand for an HIV/ Hillegonda Maria Dutilh December 2002 H SladovichAIDS Vaccine in Brazil Novaes 37698
Expedito J. A LunaMois6s GoldbaumSamuel KilsztajnAnaclaudia RossbachJose de la Rocha Carvalheiro
WPS2941 Income Convergence during the Branko Milanovic January 2003 P SaderDisintegration of the World 33902Economy, 1919-39
WPS2942 Why is Son Preference so Persistent Monica Das Gupta January 2003 M Das Guptain East and South Asia? A Cross- Jiang Zhenghua 31983Country Study of China, India, and the Li BohuaRepublic of Korea Xie Zhenming
Woojin ChungBae Hwa-Ok
WPS2943 Capital Flows, Country Risk, Norbert Fiess January 2003 R Izquierdoand Contagion 84161
WPS2944 Regulation, Productivity, and Giuseppe Nicoletti January 2003 Social ProtectionGrowth- OECD Evidence Stefano Scarpetta Advisory Service
85267
'WPS2945 Micro-Finance and Poverty Evidence Shahidur R Khandker January 2003 D AfzalUsing Panel Data from Bangladesh 36335
WPS2946 Rapid Labor Reallocation with a Jan Rutkowski January 2003 J RutkowskiStagnant Unemployment Pool The 84569Puzzle of the Labor Market in Lithuania
WPS2947 Tax Systems in Transition Pradeep Mitra January 2003 S TassewNicholas Stern 88212
WPS2948 The Impact of Contractual Savings Gregorio Impavido January 2003 P BraxtonInstitutions on Securities Markets Alberto R Musalem 32720
Thierry Tressel
WPS2949 Intersectoral Migration in Southeast Rita Butzer January 2003 P KokilaAsia: Evidence from Indonesia, Yair Mundlak 33716Thailand, and the Philippines Donald F Larson
WPS2950 Is the Emerging Nonfarm Market Dominique van de Walle January 2003 H SladovichEconomy the Route Out of Poverty Dorothyjean Cratty 37698in Vietnam?
WPS2951 Land Allocation in Vietnam's Martin Ravallion January 2003 H. SladovichAgrarian Transition Dominique van de Walle 37698

Policy Research Working Paper Series
ContactTitle Author Date for paper
WPS2952 The Effects of a Fee-Waiver Program Nazmul Chaudhury January 2003 N Chaudhuryon Health Care Utilization among the Jeffrey Hammer 84230Poor. Evidence from Armenia Edmundo Murrugarra
WPS2953 Health Facility Surveys: An Magnus Lindelow January 2003 H. SladovichIntroduction Adam Wagstaff 37698
WPS2954 Never Too Late to Get Together Bartlomiej Kaminski January 2003 P FlewittAgain: Turning the Czech and Slovak Beata Smarzynska 32724Customs Union into a Stepping Stoneto EU Integration
WPS2955 The Perversity of Preferences The Qaglar Ozden January 2003 P. FlewittGeneralized System of Preferences Eric Reinhardt 32724and Developing Country TradePolicies, 1976-2000
WPS2956 Survey Compliance and the Johan A. Mistiaen January 2003 P. SaderDistribution of Income Martin Ravallion 33902
WPS2957 Mexico. In-Firm Training for the Hong Tan January 2003 H. TanKnowledge Economy Gladys Lopez-Acevedo 33206
WPS2958 Globalization and Workers in Martin Rama January 2003 H. SladovichDeveloping Countries 37698
WPS2959 Wage Differentials and State- Michael M. Lokshin January 2003 P. SaderPrivate Sector Employment Choice Branko Jovanovic 33902in the Federal Republic of Yugoslavia
WPS2960 The Poverty/Environment Nexus in Susmita Dasgupta January 2003 Y. D'SouzaCambodia and Lao People's Uwe Deichmann 31449Democratic Republic Craig Meisner
David Wheeler
WPS2961 Strategic Planning for Poverty Rob Swinkels January 2003 N LopezReduction in Vietnam: Progress and Carrie Turk 88032Challenges for Meeting the LocalizedMillennium Development Goals
WPS2962 High Consumption Volatility: Philippe Auffret January 2003 K. TomlinsonThe Impact of Natural Disasters? 39763
WPS2963 Catastrophe Insurance Market in the Philippe Auff ret January 2003 K TomlinsonCaribbean Region Market Failures 39763and Recommendations for PublicSector Interventions
WPS2964 Wages and Productivity in Mexican Gladys L6pez-Acevedo January 2003 M. GellerManufacturing 85155
WPS2965 Informality Revisited William F. Maloney January 2003 P. Soto37892
WPS2966 Health and Poverty in Guatemala Michele Gragnolati January 2003 M. GragnolatiAlessandra Marini 85287