mammalian responses to climate change at the paleocene...
TRANSCRIPT

INTRODUCTION
Evolution is an expected response to environmental change,and, similarly, climatic change and other environmental shiftsare widely acknowledged to be important mechanisms drivingevolution. Why then is it so difficult to show correlations in timebetween mammalian evolution and changing climates?
For every study claiming to see some correlation of mam-malian evolution with climate change, there is another ques-tioning such an interpretation. Sloan (1970), Gingerich (1976,1985), and Rose (1981b) studied late Paleocene and earlyEocene mammals in North America and regarded mammalianfaunal change through this interval as a consequence of climaticcooling followed by warming, a pattern questioned by Krauseand Maas (1990). Stucky (1990), Janis (1993), and Webb andOpdike (1995) studied broad changes in Cenozoic mammalian
faunas and related these to climate change, but subsequent stud-ies of the North American record by Prothero (1999) and Alroyet al. (2000) failed to find relationships to climate and insteademphasized intrinsic biotic controls on faunal change. Vrba(1985) studied mammalian faunal change through the Plio-Pleistocene record in southern Africa and developed a ‘turnoverpulse’ hypothesis of climatically driven rapid speciation andfaunal evolution, but evidence for the principal pulse wasqueried by Behrensmeyer et al. (1997).
The Paleocene-Eocene boundary is one case where the cor-relation of a turnover pulse of mammalian faunal change withclimate change appears unequivocal. Here I summarize what isknown of the North American Paleocene-Eocene transitionbased on the stratigraphic record of mammals and climate in thevicinity of Polecat Bench in the northern Bighorn Basin ofnorthwestern Wyoming.
Geological Society of AmericaSpecial Paper 369
2003
Mammalian responses to climate change at the Paleocene-Eocene boundary: Polecat Bench record in the northern Bighorn Basin, Wyoming
Philip D. GingerichDepartment of Geological Sciences and Museum of Paleontology,University of Michigan, Ann Arbor, Michigan 48109–1079, USA
ABSTRACTThe Paleocene-Eocene transition in North American land-mammal faunas is well
documented on the south side of Polecat Bench and in surrounding badlands of north-western Wyoming. Here a rich fossil record is known from a stratigraphic section withan established geomagnetic polarity time scale and medium- to high-resolution car-bon and oxygen isotope records. The Paleocene-Eocene carbon isotope excursion(CIE) and temperature maximum (PETM) associated with greenhouse warming areboth represented, starting at ca. 55 Ma and lasting ∼∼86 k.y., during the transition fromPaleocene to Eocene epochs and from Clarkforkian to Wasatchian land-mammal ages.Attention is focused on transient dwarfing of earliest Wasatchian (Wa-0) mammalsduring the CIE-PETM interval and on morelasting changes in generic compositionand diversity. Faunal changes lagged initiation of the CIE by some 13 and 22 k.y., con-sistent with the idea of a stepped and pulsed response to climate change. Body sizedwarfing in Wa-0 mammals cannot be explained as a response to temperature alone,and elevated atmospheric CO2 probably played an important role.
463
Gingerich, P.D., 2003, Mammalian responses to climate change at the Paleocene-Eocene boundary: Polecat Bench record in the northern Bighorn Basin, Wyoming,in Wing, S.L., Gingerich, P.D., Schmitz, B., and Thomas, E., eds., Causes and Consequences of Globally Warm Climates in the Early Paleogene: Boulder, Col-orado, Geological Society of America Special Paper 369, p. 463–478. © 2003 Geological Society of America.

HISTORY OF STUDY
The Thanetian stage/age of the Paleocene and the Ypresianstage/age of the Eocene in Europe have long been known to con-tain different mammalian faunas. Similarly, the Tiffanian andClarkforkian land-mammal ages of the Paleocene and theWasatchian land-mammal age of the Eocene in North Americahave long been known to differ faunally. The Thanetian andTiffanian-Clarkforkian on both continents are dominated by ar-chaic mammalian orders such as Multituberculata, plesiadapi-form Proprimates, and Condylarthra, while the younger Ypre-sian and Wasatchian on both continents are dominated bymodern orders such as Artiodactyla, Perissodactyla, and truePrimates (see, for example, Gervais, 1877; Lemoine, 1891; Rus-sell, 1964; Cope, 1888; Granger, 1914; Jepsen, 1930; Rose,1981a). From the 1870s and 1880s, these differences were un-derstood to indicate a profound reorganization of early Cenozoicmammalian faunas. Sometime between 1910 and 1912, verte-brate paleontologists accepted the Paleocene as representing adistinct epoch of mammalian evolution. First appearances of Ar-tiodactyla, Perissodactyla, and true Primates were taken to markthe beginning of the succeeding Eocene epoch. Sinclair (1912)and Scott (1913) were at the forefront of modern acceptance ofthe Paleocene as a distinct epoch.
What does the transition from Paleocene to Eocene mam-malian faunas look like? This is a more difficult question that re-quires high-resolution biostratigraphy. It is a question best stud-ied in a sharply eroding badland setting like the Bighorn Basin ofWyoming, and the contiguous Clarks Fork Basin of Wyomingand Montana (Fig. 1), where accumulation of Paleocene-Eocenesediments was virtually continuous and the resulting strata arethick, well exposed, and richly fossiliferous. This area has specialinterest as the type area of the Clarkforkian land-mammal age.
Granger (1914), Jepsen (1930), Wood et al. (1941), and oth-ers, considered Clarkforkian and Wasatchian faunas to be dis-tinct. However, in the 1960s, two studies cast doubt on this, andindeed on our whole understanding of the Paleocene-Eocenetransition in North America. Wood (1967) studied published ev-idence of the Clarkforkian land-mammal age fauna and con-cluded that it resulted from an intermixture of late PaleoceneTiffanian land-mammal age faunal elements and early EoceneWasatchian elements. This meant, at best, that the Paleocene-Eocene transition was slow and gradual, and, at worst, that verylittle was known about the transition. Jepsen and Woodburne(1969) published a record of the “dawn horse” perissodactylHyracotherium that was said to come from the Paleocene of theClarks Fork Basin. This extension of temporal range reinforcedthe idea of a phased faunal transition, and led to temporary con-fusion of intercontinental faunal correlation.
GENERAL RESULTS
With this background, resolution could only come fromnew, larger, stratigraphically controlled collections of mammals
from the Clarks Fork and northern Bighorn Basins. I initiated aproject of new collections in 1975, which has since gone throughseveral phases with substantial studies completed on the Clark-forkian land-mammal age (Rose, 1979, 1980, 1981a, 1981b),paleomagnetic stratigraphy (Butler et al., 1981, 1987; Clyde etal., 1994), mammalian biostratigraphy (Gingerich, 1983, 1991,2001a), the Clarkforkian-to-Wasatchian faunal transition (Gin-gerich, 1989; Clyde and Gingerich, 1998; Gunnell, 1998; Gin-gerich and Clyde, 2001), carbon and oxygen isotope stratigra-phy (Koch et al., 1992, 1995; Fricke et al., 1998; Bowen et al.,2001), and the Wasatchian land-mammal age (Badgley and Gin-gerich, 1988; Clyde, 1997, 2001). A dissertation on the Tiffan-ian land-mammal age is in progress by R. Secord. Parallel stud-ies of sedimentology, paleobotany, and mollusks have beencarried out by Kraus (1980, 1987, 1996, 2001), Hickey (1980),Wing (1998), Hartman and Roth (1998), Wing et al. (2000), andWing and Harrington (2001).
There is no longer any doubt that the Clarkforkian land-mammal fauna in the type area is distinct from both the preced-ing Tiffanian-age fauna and the succeeding Wasatchian-age fauna (Fig. 2). The Clarkforkian fauna contains Rodentia,Tillodontia, the condylarth Haplomylus, and the pantodontCoryphodon not found in the preceding Tiffanian, and lacks Ar-tiodactyla, Perissodactyla, Primates, and hyaenodontid Cre-odonta that first appear in the succeeding Wasatchian fauna. Thebeginning of the Clarkforkian land-mammal age in the type areais defined by the first appearance of Rodentia, which is con-strained within about ±50 m stratigraphically and within about±100 k.y. temporally. The end of the Clarkforkian land-mammalage coincides with the beginning of the Wasatchian land-mam-mal age defined by the first appearance of Perissodactyla, andthis is even more tightly constrained stratigraphically and tem-porally (Fig. 2). Note that the Wa-0 faunal interval at the begin-ning of the Wasatchian, of particular interest here, coincideswith the carbon isotope excursion (CIE) and Paleocene-EoceneThermal Maximum (PETM) at the beginning of the Eocene (seebelow).
The Tiffanian, Clarkforkian, and Wasatchian land-mammalages of the Clarks Fork and northern Bighorn basins can be fur-ther subdivided, respectively, into six, three, and seven zonesand their corresponding biochrons (Fig. 2). Stratigraphic levelsand interpolated ages and durations of the biochrons are shownand explained in Table 1. Briefly, age and duration were calcu-lated by interpolation, using a cubic spline to describe the fit ofstratigraphic thickness to radiometric age. The spline was cali-brated using the stratigraphic positions and accepted ages of pa-leomagnetic anomalies. Accumulation of Paleocene and lowerEocene strata on Polecat Bench was not linear with time (al-though through much of the Clarkforkian and Wasatchian wasthis approximately linear), and a spline provides a model-freedescription of the pattern. Faunal samples are generally aggre-gated from 10 to 20 m of section in any particular locality, withthe position of each locality in the master section rounded to theclosest 5 m level (meaning that precision and accuracy are both
464 P.D. Gingerich
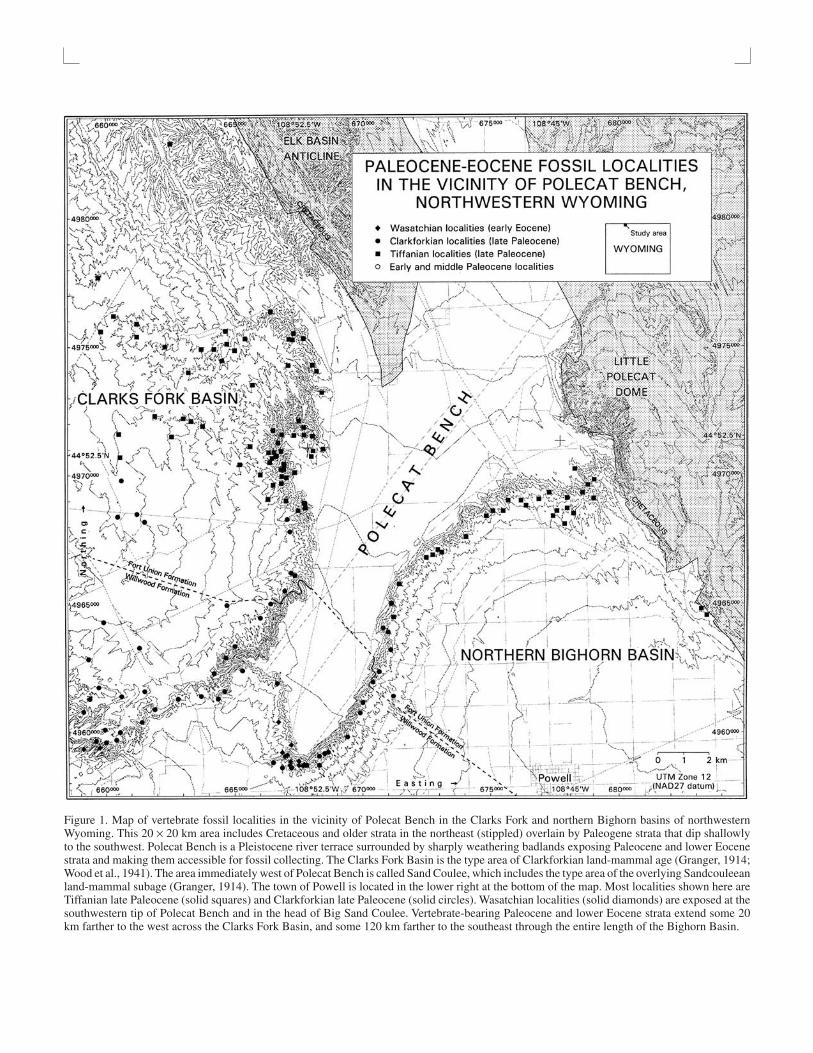
Figure 1. Map of vertebrate fossil localities in the vicinity of Polecat Bench in the Clarks Fork and northern Bighorn basins of northwesternWyoming. This 20 × 20 km area includes Cretaceous and older strata in the northeast (stippled) overlain by Paleogene strata that dip shallowlyto the southwest. Polecat Bench is a Pleistocene river terrace surrounded by sharply weathering badlands exposing Paleocene and lower Eocenestrata and making them accessible for fossil collecting. The Clarks Fork Basin is the type area of Clarkforkian land-mammal age (Granger, 1914;Wood et al., 1941). The area immediately west of Polecat Bench is called Sand Coulee, which includes the type area of the overlying Sandcouleeanland-mammal subage (Granger, 1914). The town of Powell is located in the lower right at the bottom of the map. Most localities shown here areTiffanian late Paleocene (solid squares) and Clarkforkian late Paleocene (solid circles). Wasatchian localities (solid diamonds) are exposed at thesouthwestern tip of Polecat Bench and in the head of Big Sand Coulee. Vertebrate-bearing Paleocene and lower Eocene strata extend some 20km farther to the west across the Clarks Fork Basin, and some 120 km farther to the southeast through the entire length of the Bighorn Basin.

Figu
re 2
. St
ratig
raph
ic r
ange
s of
sel
ecte
d ve
rteb
rate
tax
a in
the
Pol
ecat
Ben
ch–S
and
Cou
lee
stra
tigra
phic
sec
tion
of t
he C
lark
s Fo
rk a
nd n
orth
ern
Big
horn
bas
ins,
Wyo
min
g. T
hese
are
sho
wn
in th
e co
ntex
t of
pale
omag
netic
str
atig
raph
y, in
terp
olat
ed a
ge, l
ithos
trat
igra
phy,
chr
onos
trat
igra
phy,
and
sta
ble
isot
ope
stra
tigra
phy,
bas
edon
div
erse
stu
dies
of t
he P
olec
at B
ench
–San
d C
oule
e st
ratig
raph
ic s
ectio
n by
But
ler e
t al.
(198
1, 1
987;
cal
ibra
ted
follo
win
g C
ande
and
Ken
t, 19
95);
by
Gin
geri
ch (1
976,
1983
, 199
1, 2
001a
) an
d R
ose
(198
1a);
and
by
Koc
h et
al.
(199
2), F
rick
e et
al.
(199
8), B
ao e
t al.
(199
9), a
nd B
owen
et a
l. (2
001)
. Not
e fi
rst a
ppea
ranc
es o
f co
smop
ol-
itan
Peri
ssod
acty
la, A
rtio
dact
yla,
Pri
mat
es, a
nd H
yaen
odon
tidae
in
the
Wa-
0 fa
unal
zon
e co
inci
dent
with
the
car
bon
isot
ope
excu
rsio
n (C
IE)
and
oxyg
en i
soto
pe e
x-cu
rsio
n re
pres
entin
g th
e Pa
leoc
ene-
Eoc
ene
The
rmal
Max
imum
(PE
TM
), in
terp
olat
ed to
be
near
or
slig
htly
you
nger
than
55.
0 M
a (s
ee T
able
s 1
and
2). C
onfi
denc
e lim
-its
on
taxo
n ra
nges
are
cal
cula
ted
follo
win
g St
raus
s an
d Sa
dler
(19
89)
to e
mph
asiz
e th
e qu
ality
of
the
reco
rd. O
ne-t
aile
d lim
its a
re e
mpl
oyed
in e
ach
case
bec
ause
they
are
larg
er a
nd h
ence
mor
e co
nser
vativ
e. C
hart
upd
ated
fro
m G
inge
rich
(20
00).
V-S
MO
W—
Vie
nna
stan
dard
mea
n oc
ean
wat
er; P
DB
—Pe
edee
bel
emni
te.

Mammalian responses to climate change at the Paleocene-Eocene boundary 467
TABLE 1. AGE AND DURATION ESTIMATES FOR BIOSTRATIGRAPHIC ZONESABOVE AND BELOW THE PALEOCENE-EOCENE BOUNDARY ON POLECAT BENCH
Zone Zone Zonebottom Zone top bottom Zone top duration
Zone name (m) (m) (ma) (ma) (k.y.)
Wa-5 2200 — —53.48 — —Wa-4 2020 2200 –53.87 –53.48 393.2Wa-3b 1780 2020 –54.40 –53.87 530.4Wa-3a 1750 1780 –54.47 –54.40 66.2Wa-2 1645 1750 –54.70 –54.47 230.8Wa-1 1543 1645 –54.92 –54.70 221.9Wa-0 1506 1543 –55.00 –54.92 79.8Cf-3 1335 1506 –55.36 –55.00 362.3Cf-2 1180 1335 –55.68 –55.36 317.8Cf-1 885 1180 –56.27 –55.68 587.6Ti-6 820 885 –56.41 –56.27 145.0Ti-5b 655 820 –56.89 –56.41 478.5Ti-5a 530 655 –57.39 –56.89 492.9Ti-4 415 530 –57.85 –57.39 463.4Ti-3 215 415 –58.93 –57.85 1079.7Ti-2 155 215 –59.48 –58.93 551.7
Note: These are calculated by interpolation, using a cubic spline describing the fit of stratigraphicthickness to radiometric age. Spline calibration points are the bottoms and tops of magnetic anomalies26R, 26N, 25R, 25N, and 24R in the Polecat Bench–Sand Coulee stratigraphic section (Fig. 2). SeeTable 2 for more detailed interpolation in the vicinity of Wa-0.
on the order of 20 k.y.). Faunal samples analyzed here includeall specimens from all localities recorded at a particular 5 mstratigraphic level.
The Clarkforkian-Wasatchian boundary is of special inter-est because it coincides closely with the Paleocene-Eoceneepoch boundary, and both boundaries lie within paleomagneticanomaly 24R (Fig. 2). The average long-term sediment accu-mulation rate through this interval is ∼467 m/m.y. Spline and lin-ear interpolations yield ages for the Clarkforkian-Wasatchianboundary of 55.00 and 54.97 Ma respectively (base of Wa-0?),or 54.99 and 54.96 Ma respectively (base of Wa-0), and ages forthe Paleocene-Eocene boundary of 55.01 and 54.98 Ma respec-tively (Table 2). Note that both interpolations yield a Clark-forkian-Wasatchian boundary recognized by the first appear-ance of perissodactyls that is at most 21.5 k.y. younger than thePaleocene-Eocene boundary at the base of the carbon isotopeexcursion (CIE; see below).
Stable isotopes in soil nodules, gar scales, and hematite en-crusting bones document: (1) a profound 4–5 per mil (‰) neg-ative excursion in δ13C at the time of the Clarkforkian-Wasatchian transition (Koch et al., 1992; Bowen et al., 2001;Bains et al., this volume), reflecting the global carbon isotopeexcursion, or CIE, first recognized in the deep sea (the base ofthe CIE is now taken to mark the Paleocene-Eocene boundaryhere and elsewhere; Luterbacher et al., 2000; Fig. 2); (2) a sub-stantial ∼2‰ positive excursion in δ18O at the time of the Clark-forkian-Wasatchian transition (Fricke et al., 1998), reflecting abrief interval of warm climate during the Paleocene-Eocene
Thermal Maximum (PETM) associated with the CIE (Fig. 2);and (3) a longer-term 4‰ negative trend in δ18O through muchof Clarkforkian and early Wasatchian time (Bao et al., 1999),consistent with a background pattern of slight climatic coolingacross the Paleocene-Eocene boundary (Fig. 2).
HIGH-RESOLUTION STRATIGRAPHY
High-resolution carbon isotope stratigraphy shows the CIEto span the 1500 through 1540 m interval in the Polecat Benchsection, with an interpolated duration of ∼86,000 yr (Fig. 3;Table 2). Stratigraphically, the Wa-0 mammalian fauna at thebeginning of the Wasatchian land-mammal age falls entirelywithin the CIE. Clarkforkian mammals are found as high as1505 m, and the onset of the CIE evidently happened during lat-est Clarkforkian time.
The interval from 1506 to 1511 m contains unusual brownpaleosols, abundant Celtis (hackberry) endocarps, and the onlyspecimens of the rare condylarth Meniscotherium from theBighorn Basin for which precise stratigraphic information isavailable. Meniscotherium is unusual for a condylarth in beinga highly specialized selenodont herbivore. It is common in laterWasatchian faunas in more southern localities (e.g., New Mex-ico). The Meniscotherium-bearing interval in the Polecat Benchsection coincides with maximum excursion values of the CIE.The remainder of the CIE, from 1512 through ∼1540 m, con-tains numerous bright red and purple paleosols and yields theclassic Wa-0 mammalian fauna (Gingerich, 1989).
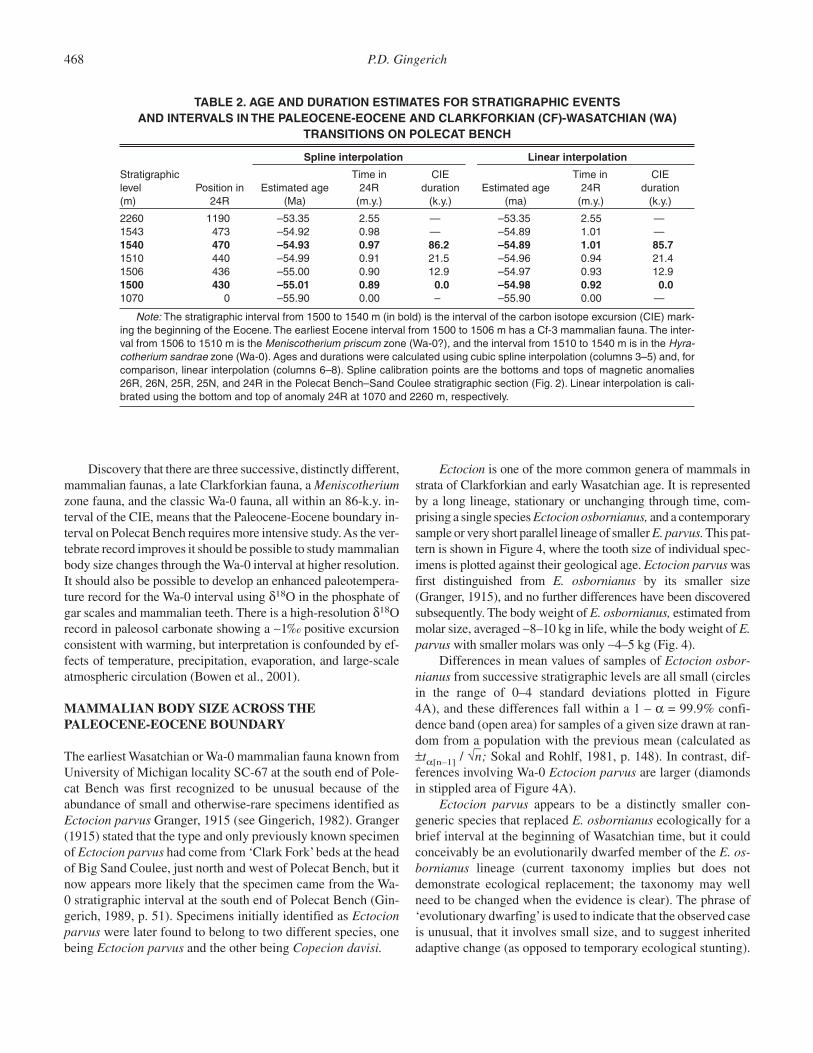
Discovery that there are three successive, distinctly different,mammalian faunas, a late Clarkforkian fauna, a Meniscotheriumzone fauna, and the classic Wa-0 fauna, all within an 86-k.y. in-terval of the CIE, means that the Paleocene-Eocene boundary in-terval on Polecat Bench requires more intensive study. As the ver-tebrate record improves it should be possible to study mammalianbody size changes through the Wa-0 interval at higher resolution.It should also be possible to develop an enhanced paleotempera-ture record for the Wa-0 interval using δ18O in the phosphate ofgar scales and mammalian teeth. There is a high-resolution δ18Orecord in paleosol carbonate showing a ∼1‰ positive excursionconsistent with warming, but interpretation is confounded by ef-fects of temperature, precipitation, evaporation, and large-scaleatmospheric circulation (Bowen et al., 2001).
MAMMALIAN BODY SIZE ACROSS THEPALEOCENE-EOCENE BOUNDARY
The earliest Wasatchian or Wa-0 mammalian fauna known fromUniversity of Michigan locality SC-67 at the south end of Pole-cat Bench was first recognized to be unusual because of theabundance of small and otherwise-rare specimens identified asEctocion parvus Granger, 1915 (see Gingerich, 1982). Granger(1915) stated that the type and only previously known specimenof Ectocion parvus had come from ‘Clark Fork’beds at the headof Big Sand Coulee, just north and west of Polecat Bench, but itnow appears more likely that the specimen came from the Wa-0 stratigraphic interval at the south end of Polecat Bench (Gin-gerich, 1989, p. 51). Specimens initially identified as Ectocionparvus were later found to belong to two different species, onebeing Ectocion parvus and the other being Copecion davisi.
Ectocion is one of the more common genera of mammals instrata of Clarkforkian and early Wasatchian age. It is representedby a long lineage, stationary or unchanging through time, com-prising a single species Ectocion osbornianus, and a contemporarysample or very short parallel lineage of smaller E. parvus. This pat-tern is shown in Figure 4, where the tooth size of individual spec-imens is plotted against their geological age. Ectocion parvus wasfirst distinguished from E. osbornianus by its smaller size(Granger, 1915), and no further differences have been discoveredsubsequently. The body weight of E. osbornianus, estimated frommolar size, averaged ∼8–10 kg in life, while the body weight of E.parvus with smaller molars was only ∼4–5 kg (Fig. 4).
Differences in mean values of samples of Ectocion osbor-nianus from successive stratigraphic levels are all small (circlesin the range of 0–4 standard deviations plotted in Figure 4A), and these differences fall within a 1 – α = 99.9% confi-dence band (open area) for samples of a given size drawn at ran-dom from a population with the previous mean (calculated as±tα[n–1] / √n
–; Sokal and Rohlf, 1981, p. 148). In contrast, dif-
ferences involving Wa-0 Ectocion parvus are larger (diamondsin stippled area of Figure 4A).
Ectocion parvus appears to be a distinctly smaller con-generic species that replaced E. osbornianus ecologically for abrief interval at the beginning of Wasatchian time, but it couldconceivably be an evolutionarily dwarfed member of the E. os-bornianus lineage (current taxonomy implies but does notdemonstrate ecological replacement; the taxonomy may wellneed to be changed when the evidence is clear). The phrase of‘evolutionary dwarfing’is used to indicate that the observed caseis unusual, that it involves small size, and to suggest inheritedadaptive change (as opposed to temporary ecological stunting).
468 P.D. Gingerich
TABLE 2. AGE AND DURATION ESTIMATES FOR STRATIGRAPHIC EVENTS AND INTERVALS IN THE PALEOCENE-EOCENE AND CLARKFORKIAN (CF)-WASATCHIAN (WA)
TRANSITIONS ON POLECAT BENCH
Spline interpolation Linear interpolation
Stratigraphic Time in CIE Time in CIElevel Position in Estimated age 24R duration Estimated age 24R duration(m) 24R (Ma) (m.y.) (k.y.) (ma) (m.y.) (k.y.)
2260 1190 –53.35 2.55 — –53.35 2.55 —1543 473 –54.92 0.98 — –54.89 1.01 —1540 470 –54.93 0.97 86.2 –54.89 1.01 85.71510 440 –54.99 0.91 21.5 –54.96 0.94 21.41506 436 –55.00 0.90 12.9 –54.97 0.93 12.91500 430 –55.01 0.89 0.0 –54.98 0.92 0.01070 0 –55.90 0.00 – –55.90 0.00 —
Note: The stratigraphic interval from 1500 to 1540 m (in bold) is the interval of the carbon isotope excursion (CIE) mark-ing the beginning of the Eocene. The earliest Eocene interval from 1500 to 1506 m has a Cf-3 mammalian fauna. The inter-val from 1506 to 1510 m is the Meniscotherium priscum zone (Wa-0?), and the interval from 1510 to 1540 m is in the Hyra-cotherium sandrae zone (Wa-0). Ages and durations were calculated using cubic spline interpolation (columns 3–5) and, forcomparison, linear interpolation (columns 6–8). Spline calibration points are the bottoms and tops of magnetic anomalies26R, 26N, 25R, 25N, and 24R in the Polecat Bench–Sand Coulee stratigraphic section (Fig. 2). Linear interpolation is cali-brated using the bottom and top of anomaly 24R at 1070 and 2260 m, respectively.

Figu
re 3
. Hig
h-re
solu
tion
carb
on is
otop
e st
ratig
raph
y an
d bi
otic
cha
nge
at th
e so
uth
end
of P
olec
at B
ench
. Lith
ostr
atig
raph
y an
d st
ratig
raph
ic r
ange
s of
the
elm
-rel
ated
dic
ot C
elti
s(h
ack-
berr
y) a
nd im
port
ant m
amm
alia
n ta
xa c
ross
ing
the
Pale
ocen
e-E
ocen
e bo
unda
ry a
re f
rom
Gin
geri
ch (
2001
a). F
ourt
een
mam
mal
-bea
ring
fos
sil l
ocal
ities
are
kno
wn
(SC
-77,
etc
.), r
epre
sent
-in
g se
ven
dist
inct
str
atig
raph
ic in
terv
als
(sha
ded)
. The
se c
an b
e gr
oupe
d in
to f
our
time-
succ
essi
ve a
ssoc
iatio
ns b
ased
on
thei
r bi
ota
(Cf-
3, W
a-0?
, Wa-
0, a
nd W
a-1
on th
e or
dina
te).
The
in-
terv
al la
bele
d “W
a-0
or W
a-1”
on
the
ordi
nate
is p
oorl
y sa
mpl
ed a
nd c
ould
be
eith
er W
a-0
or W
a-1
in a
ge. T
he 8
6,00
0-ye
ar ti
me
scal
e sh
own
here
is c
onsi
sten
t with
age
inte
rpol
atio
ns in
Tabl
e 2.
Not
e th
at t
he b
egin
ning
of
the
carb
on i
soto
pe e
xcur
sion
is
in t
he l
ate
Cla
rkfo
rkia
n, o
verl
appi
ng t
he s
trat
igra
phic
int
erva
l of
loc
aliti
es S
C-7
1, e
tc. T
he m
ost
nega
tive
δ13C
val
ues
(∼15
‰)
are
in th
e ea
rlie
st z
one
of th
e W
asat
chia
n (W
a-0?
), r
epre
sent
ed b
y SC
-404
with
the
firs
t hac
kber
ry C
elti
san
d ra
re c
ondy
lart
h M
enis
coth
eriu
m.T
he r
emai
nder
of
the
carb
on is
otop
eex
curs
ion
span
s th
e in
terv
al o
f th
e cl
assi
c W
a-0
faun
a w
ith s
mal
l Ect
ocio
nan
d C
opec
ion
from
loca
litie
s SC
-67,
etc
. Ect
ocio
nan
d C
opec
ion
of s
tand
ard
size
are
kno
wn
from
loca
litie
s SC
-68
, etc
., in
zon
e W
a-1a
fter
car
bon
isot
ope
valu
es r
etur
ned
to n
orm
al (
here
∼9‰
). R
epro
duce
d w
ith m
odif
icat
ions
fro
m F
igur
e 6
in B
owen
et a
l. (2
001)
.

Figu
re 4
. Str
atig
raph
ic re
cord
of t
ooth
siz
e an
d bo
dy s
ize
for t
he m
amm
alia
n ge
nus
Ect
ocio
nth
roug
h C
lark
fork
ian
and
earl
y W
asat
chia
n tim
e in
the
nort
hern
Big
horn
and
Cla
rks
Fork
bas
ins.
Mos
t spe
cim
ens
repr
esen
t the
com
mon
spe
cies
Ect
ocio
n os
born
ianu
sof
∼8–
10 k
g bo
dy w
eigh
t, bu
t sm
alle
r sp
ecim
ens
of E
ctoc
ion
parv
usof
∼4–
5 kg
bod
y w
eigh
t pre
dom
inat
e in
the
Wa-
0 st
ratig
raph
ic in
terv
al c
oinc
idin
g w
ith th
e C
IE a
nd P
ET
M (
cf. F
igur
e 2)
. Ver
tical
axi
s is
tim
e, b
ased
on
cubi
c sp
line
inte
rpol
atio
n of
Fig
ure
2 an
d Ta
ble
1. I
nset
A s
how
s th
at th
e W
a-0
sam
-pl
e (d
iam
onds
) di
ffer
s fr
om a
djac
ent s
ampl
es m
ore
than
exp
ecte
d by
cha
nce
(sym
bols
are
ope
n or
clo
sed
refl
ectin
g ne
gativ
e an
d po
sitiv
e ch
ange
s in
toot
h si
ze, r
espe
ctiv
ely)
. Das
hed
lines
in A
are
con
fide
nce
limits
for
α=
0.0
5, 0
.01,
and
0.0
01. I
nset
B s
how
s ra
tes
for W
a-0
sam
ples
to b
e hi
gher
than
all
othe
r ra
tes
calc
ulat
ed o
n th
e sa
me
time
scal
e (d
ashe
d lin
es o
f sl
ope
1 ar
efi
t to
diam
ond
rate
s in
volv
ing
Wa-
0). B
ody
wei
ght i
s es
timat
ed fr
om to
oth
size
follo
win
g un
gula
te re
gres
sion
of L
egen
dre
(198
9, T
able
1),
and
gen
erat
ion
time
is e
stim
ated
from
bod
y w
eigh
t(E
isen
berg
, 198
1). E
ctoc
ion
osbo
rnia
nus
in th
e B
igho
rn a
nd C
lark
s Fo
rk b
asin
s w
as c
hose
n by
Sim
pson
(194
3) a
s th
e fe
atur
ed e
xam
ple
whe
n he
intr
oduc
ed th
e co
ncep
t of a
n ev
olvi
ng c
hron
-oc
line,
but
impr
oved
sam
plin
g an
d st
ratig
raph
ic c
ontr
ol s
how
n he
re in
dica
tes
that
E. o
sbor
nian
usch
ange
d lit
tle th
roug
h its
kno
wn
evol
utio
nary
his
tory
.

Rates required for dwarfing and recovery, plotted as dia-monds in inset Figure 4B, are high but at the margin of rates cal-culated for the rest of the time series (and again within the rangeexpected for evolutionary change, including island dwarfing, onthese time scales; Gingerich, 2001b). There are two Wa-0 spec-imens the size of ordinary E. osbornianus in the Wa-0 fauna,which supports the idea of replacement rather than dwarfing, butthese could be contaminants (this idea can be tested isotopi-cally). Whether E. parvus represents a parallel lineage or a briefevolutionary dwarfing event in the longer E. osbornianus line-age, it is a conspicuous outlier with a body weight estimated tohave been only ∼50% the weight of its more common andlonger-ranging congener.
Copecion too is represented by a long stationary lineagecomprising a single species Copecion brachypternus, and a con-temporary sample or very short parallel lineage of C. davisi.This pattern is shown in Figure 5. Copecion davisi was first dis-tinguished from C. brachypternus by its smaller size (Gingerich,1989), and no further differences have been discovered subse-quently. The body weight of C. brachypternus estimated frommolar size, like that of E. osbornianus, averaged ∼8–10 kg inlife, while the body weight of C. davisi with smaller molars wasonly ∼5–6 kg.
Here again, differences in mean values of successive sam-ples of Copecion brachypternus are all small (circles in the rangeof 0–4 standard deviations plotted in Figure 5A), and these dif-ferences again fall within a 1 – α = 99.9% confidence band (openarea) for samples of a given size drawn at random from a popu-lation with the previous mean. In contrast, differences involvingWa-0 Copecion davisi are larger (diamonds in Figure 5A).
C. davisi appears to be a distinctly smaller congenericspecies that replaced C. brachypternus ecologically for a briefinterval at the beginning of Wasatchian time, but it could con-ceivably be an evolutionarily dwarfed member of the C.brachypternus lineage (again, current taxonomy implies butdoes not demonstrate ecological replacement).
Rates required for dwarfing and recovery, plotted as dia-monds in inset Figure 5B, are high but again at the margin ofrates calculated for the rest of the time series (and again withinthe range expected for evolutionary change on these time scales;Gingerich, 2001b). There are no Wa-0 specimens the size of or-dinary C. brachypternus. Whether C. davisi represents a paral-lel lineage or a transient evolutionary dwarfing event in thelonger C. brachypternus lineage, it is a conspicuous outlier witha body weight estimated to have been only ∼60% the weight ofits more common and longer-ranging congener.
Perissodactyls make their first appearance in the NorthAmerican fossil record in the Wasatchian land-mammal age.The only common perissodactyl from Wa-0 is the small 5–6 kg,short-lived species Hyracotherium sandrae (Fig. 6). There islimited evidence that the larger 8–10 kg Hyracotheriumgrangeri comes from the Wa-0 interval too, but it is much rarerthan H. sandrae, at least in northern Bighorn Basin localities (H.grangeri is the only species reported from the Castle Gardens
Wa-0 fauna in the southeastern Bighorn Basin; Strait, 2001).Thus, the body size pattern for Hyracotherium through the Wa-0 to Wa-2 part of the record is similar to that for Ectocion andCopecion, with H. sandrae being a conspicuous outlier in hav-ing a body weight estimated to have been only some 60% theweight of its more common and longer-ranging congener H.grangeri. There are no differences known to distinguish H. san-drae from H. grangeri except size.
More examples could be shown (see Gingerich, 1989), butFigures 4–6 convey the idea that unusually small body size is asalient characteristic of Wa-0 species from the CIE and PETMinterval of the earliest Wasatchian. Some species, such as Hy-opsodus loomisi, seem to have made the transition from Wa-0 toWa-1 with no substantial change in body size. No species areknown to exhibit larger body size in response to the elevatedmean annual temperatures in the Wa-0 interval.
EXPLANATION FOR EVOLUTIONARY DWARFING
How can we explain the rapid replacement or evolution ofa common, successful Paleocene species by a congener only50%–60% of its body weight? Requisite rates of change liewithin the range of evolutionary rates observed on 104–105 gen-eration time scales in other settings, so the replacement is notrate limited. The problem is rather to identify the selective forc-ing factor or factors. We know that the CIE-PETM interval onland is unusual for its isotopically light carbon, its isotopicallyheavy oxygen, its ambient temperature elevated by up to 8 °C,and its elevated levels of greenhouse gases such as CO2 in theatmosphere (Koch et al., 1992; Fricke et al., 1998; Dickens,2000; Royer et al., 2001; Zachos et al., 2001). Elevated temper-ature and elevated CO2 are both possible forcing factors.
Bergmann’s rule is one of the best documented and widelyknown ecological and biogeographic generalizations (Berg-mann, 1847; Rensch, 1929; Ashton et al., 2000): As a rule, thebody size of a species increases in cooler climates and decreasesin warm climates. Koch (1986) studied geographic clines in ex-tant North American mammals and showed that today 0.02 lnunits of tooth crown area are approximately equivalent to 1.0 °Cof temperature change. The difference in tooth crown area dis-tinguishing, for example, Ectocion parvus in the earliestWasatchian from E. parvus in the Clarkforkian is about –0.3 lnunits, which would require a temperature rise of some 15 °C(compared to ∼4 °C reported by Fricke et al., 1998). Thus, a sim-ple Bergmann response to temperature elevation cannot be thewhole explanation for the dwarfing observed Wa-0 mammals.
Body size in mammals is also influenced by food quality(Case, 1979). Here new and ongoing experiments with herbi-vores fed on plants grown in CO2-enriched atmospheres are par-ticularly interesting (e.g., Fajer et al., 1989; Kinney et al., 1997;Tuchman et al., 2002). Experiments show that ‘high’ CO2 par-tial pressures (∼700 ppmv, compared to present-day pressuresof ∼350 ppmv) are sufficient to increase photosynthesis, and toincrease carbon and decrease nitrogen in plant tissues. The ex-
Mammalian responses to climate change at the Paleocene-Eocene boundary 471

Figu
re 5
. Str
atig
raph
ic re
cord
of t
ooth
siz
e an
d bo
dy s
ize
for t
he m
amm
alia
n ge
nus
Cop
ecio
nth
roug
h C
lark
fork
ian
and
earl
y W
asat
chia
n tim
e in
the
nort
hern
Big
horn
and
Cla
rks
Fork
bas
ins.
Mos
t spe
cim
ens
repr
esen
t the
com
mon
spe
cies
Cop
ecio
n br
achy
pter
nus
of ∼
8–10
kg
body
wei
ght,
but s
mal
ler
spec
imen
s of
Cop
ecio
n da
visi
of ∼
5–6
kg b
ody
wei
ght p
redo
min
ate
in th
eW
a-0
stra
tigra
phic
inte
rval
coi
ncid
ing
with
the
CIE
and
PE
TM
(cf
. Fig
ure
2). V
ertic
al a
xis
is ti
me
base
d on
cub
ic s
plin
e in
terp
olat
ion.
Ins
ets
A a
nd B
sho
w th
at th
e W
a-0
sam
ple
(dia
mon
ds)
diff
ers
from
adj
acen
t sam
ples
mor
e th
an e
xpec
ted
by c
hanc
e (s
ymbo
ls a
re o
pen
or c
lose
d re
flec
ting
nega
tive
and
posi
tive
chan
ges
in to
oth
size
, res
pect
ivel
y). D
ashe
d lin
es in
A a
re c
onfi
-de
nce
limits
for
α=
0.0
5, 0
.01,
and
0.0
01. D
istr
ibut
ion
in B
sho
ws
rate
s fo
r Wa-
0 sa
mpl
es to
be
high
er th
an a
ll ot
her
rate
s ca
lcul
ated
on
the
sam
e tim
e sc
ale
(das
hed
lines
of
slop
e 1
are
fit
to d
iam
ond
rate
s in
volv
ing
Wa-
0). B
ody
wei
ght i
s es
timat
ed f
rom
toot
h si
ze f
ollo
win
g un
gula
te r
egre
ssio
n of
Leg
endr
e (1
989,
Tab
le 1
), a
nd g
ener
atio
n tim
e is
est
imat
ed f
rom
bod
y w
eigh
t(E
isen
berg
, 198
1).

Figu
re 6
. Str
atig
raph
ic re
cord
of t
ooth
siz
e an
d bo
dy s
ize
for t
he m
amm
alia
n ge
nus
Hyr
acot
heri
umth
roug
h C
lark
fork
ian
and
earl
y W
asat
chia
n tim
e in
the
nort
hern
Big
horn
and
Cla
rks
Fork
basi
ns. M
ost s
peci
men
s re
pres
ent t
he c
omm
on s
peci
es H
yrac
othe
rium
gra
nger
iof
∼8–1
0 kg
bod
y w
eigh
t, bu
t sm
alle
r sp
ecim
ens
of H
yrac
othe
rium
san
drae
of ∼
5–6
kg b
ody
wei
ght p
re-
dom
inat
e in
the
Wa-
0 st
ratig
raph
ic in
terv
al c
oinc
idin
g w
ith th
e C
IE a
nd P
ET
M (
cf. F
igur
e 2)
. Ver
tical
axi
s is
tim
e ba
sed
on c
ubic
spl
ine
inte
rpol
atio
n. I
nset
fig
ures
A a
nd B
sho
w th
at th
eW
a-0
sam
ple
(dia
mon
ds)
diff
ers
from
adj
acen
t sa
mpl
es m
ore
than
exp
ecte
d by
cha
nce
(sym
bols
are
ope
n or
clo
sed
refl
ectin
g ne
gativ
e an
d po
sitiv
e ch
ange
s in
too
th s
ize,
res
pect
ivel
y).
Das
hed
lines
in
A a
re c
onfi
denc
e lim
its f
or α
= 0
.05,
0.0
1, a
nd 0
.001
. Dis
trib
utio
n in
B s
how
s ra
tes
for
Wa-
0 sa
mpl
es t
o be
hig
her
than
all
othe
r ra
tes
calc
ulat
ed o
n th
e sa
me
time
scal
e(d
ashe
d lin
e of
slo
pe 1
is f
it to
dia
mon
d ra
te in
volv
ing
Wa-
0). B
ody
wei
ght i
s es
timat
ed f
rom
toot
h si
ze f
ollo
win
g un
gula
te r
egre
ssio
n of
Leg
endr
e (1
989,
Tab
le 1
), a
nd g
ener
atio
n tim
e is
estim
ated
fro
m b
ody
wei
ght (
Eis
enbe
rg, 1
981)
.

tra carbon is used to enhance secondary compounds, inhibitingdigestibility for herbivores. CO2 enrichment also leads to re-duction in rubisco enzyme concentrations in foliage, thus de-creasing leaf protein and lowering nutritional value for herbi-vores. Experimentally, insect herbivores are observed to growmore slowly on high-CO2 foliage. No experiments have beendone with mammalian herbivores, but it is logical to expect thatmammals too would experience slower growth. Slower growth,coupled with any of the usual seasonal temperature, rainfall, orday-length effects controlling reproductive cycles, would lead toreproduction at smaller body size rather than at the same orlarger size. This would be, simply and directly, environmentalselection favoring evolutionary dwarfing. Alternatively, undersome conditions, we might expect ‘normal’-sized species to bereplaced by smaller congeners or other species.
We do not know very much about the partial pressure ofCO2 during the PETM or Wa-0 interval of dwarfing in mam-mals. Royer et al. (2001) published one estimate of 800 ppmvbased on the stomatal index of Ginkgo gardneri from ArdtunHead on the Isle of Mull, which is correlated over some distanceto an interval with CIE and PETM indicators. Further, we do notyet know anything experimentally about the effects that a diet ofplants grown in CO2-enhanced environments might have on thebody size of mammalian herbivores. Nevertheless, the coinci-dental transience of both the elevated partial pressure of CO2postulated during the PETM and the transience of the dwarfedbody size of mammals during this interval suggest a cause andeffect relationship. The temperature rise during the PETM in-terval is not sufficient by itself to explain all of the dwarfing ob-served through any simple Bergmann response to warming, buttemperature plus an elevated partial pressure of CO2 might ex-plain this.
OTHER RESPONSES TO CLIMATE CHANGE
Differences distinguishing the Wa-0 mammalian fauna ofthe CIE-PETM interval from faunas that preceded or followedin time can be divided into two categories: Transient differencesand permanent differences. The size changes in Ectocion andCopecion illustrated here are transient in the sense that the sizesof species observed following the CIE-PETM event returned tothe sizes observed before the event. Unusually small species ap-peared during the PETM interval, and smaller size is plausiblya response to elevated temperature and elevated CO2. A secondtransient change concerns the proportion of digging mammals(palaeanodonts and taeniodonts) in the Wa-0 fauna (Gingerich,1989). Digging mammals typically constitute <1% of all speci-mens in a Clarkforkian or Wasatchian fauna, but rise to 6% dur-ing Wa-0 time (of which ∼3% are palaeanodonts and ∼3% aretaeniodonts). It is not clear that digging would be favored by awarmer climate, but a better-drained landscape promoting de-velopment of especially mature paleosols, like those in the Wa-0 interval, could plausibly favor digging mammals. Both ofthese transient faunal changes are so closely linked to the CIE-
474 P.D. Gingerich
PETM interval, occurring in precisely the same strata, that therecan be little question that they are, directly or indirectly, re-sponses to climate change.
A more permanent faunal change occurring at the time ofthe CIE-PETM event is evident in a range chart showing the rel-ative timing of first and last appearances of mammalian generafrom the northern Bighorn and Clarks Fork basins (Fig. 7). In-tegration of appearances and disappearances shows a plateau ofdiversity of ∼45–50 genera in the middle and late Clarkforkian,which then rises to a higher plateau of ∼55–60 genera in theearly Wasatchian. This rise coincides with and results from apeak of 14 first appearances of new genera in the Wa-0 fauna.Lesser peaks of first and last appearances are scattered throughClarkforkian and Wasatchian time, but the most conspicuousone is the peak of first appearances coinciding with the CIE-PETM event.
Other lasting changes at the CIE-PETM event are an in-crease in mean species body size, and an increase in the relativeimportance of herbivores and frugivores (see Clyde and Gin-gerich, 1998). These equally rapid but more permanent changesalmost certainly reflect immigration of new taxa. The cos-mopolitanism of the new taxa (Artiodactyla, Perissodactyla, Pri-mates, etc.) is itself evidence of adaptive advantages enabling theimmigrants to invade and live side by side with endemic taxa.
DISCUSSION
Webb and Opdike (1995, Tables 11.1 and 11.2) listed 15mammalian genera as North American immigrants at the begin-ning of Wasatchian time. Nine of the genera listed by Webb andOpdike not only make their first appearance in the Wasatchianland-mammal age, but also make their first appearance in theWa-0 fauna (as do five genera not listed by Webb and Opdike as Wasatchian immigrants). The remaining six genera listed by Webb and Opdike appear at different times later in the
Figure 7. Stratigraphic ranges of late Paleocene and early Eocene mam-malian genera in the Polecat–Sand Coulee area of the Clarks Fork andnorthern Bighorn basins. Dashed lines in the range chart separate zonesof the Clarkforkian and Wasatchain land mammal ages (labeled Cf-1,etc.). Stippled column is Wa-0. Graph at the bottom of the figure showsthe cumulative number of genera inferred to be present through the Paleocene-Eocene boundary interval based on first and last appear-ances of genera in the range chart. Numbers of first and last appear-ances are shown as solid and dashed lines, respectively, in the histogramat the bottom of the graph. Note the peak of first appearances in Wa-0and the change from a plateau of diversity in the middle and late Clark-forkian to a plateau of higher diversity in the early Wasatchian. Inter-pretation is complicated by dependency of diversity on both sample sizeand number of contributing localities. Rarefaction curves for speciesshow Wasatchian assemblages to be more diverse for a given numberof specimens (Clyde and Gingerich, 1998). At the same time, the aver-age number of localities per stratigraphic level is about two for Clark-forkian levels and about three for Wasatchian levels, which might ex-plain the higher generic diversity seen here. Range chart is abstractedfrom Figure 2 of Gingerich and Clyde (2001).
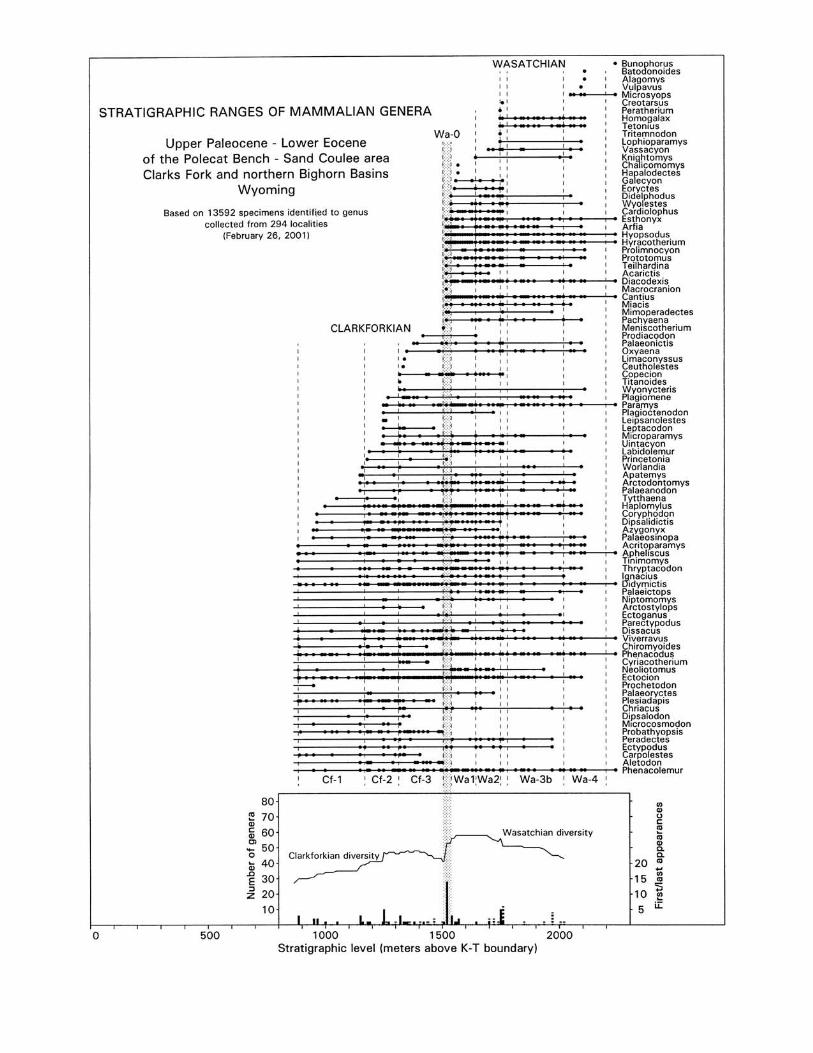
Wasatchian. Appearance of so many mammals in such a re-stricted interval of time coinciding with the CIE-PETM event re-inforces the arguments by Stucky (1990), Janis (1993), andWebb and Opdike (1995) that climate has an important effect onCenozoic mammalian faunas. This is shown too by the transientchanges mentioned above. Whether climate has any direct effecton speciation remains to be substantiated, but mammalianturnover is pulsed and the Wa-0 pulse discussed here clearly co-incides with climate change (Vrba, 1985).
Prothero (1999) and Alroy et al. (2000) studied Cenozoicclimate and mammals on million-year time scales and failed tofind any substantial biotic response to climate change. Prothero(1999) excluded the Paleocene-Eocene transition from his studybecause it involved immigrant genera, while Alroy et al. (2000)included it and found evidence associating climate and bioticchange in this brief transition. One reason the relationship offaunal change to climate is clear at the Paleocene-Eoceneboundary is because the isotopic record being compared comesfrom the very same stratigraphic section, standardizing the spa-tial scale and removing uncertainties inherent in correlation ofdistant sections like those on land and in the deep sea. Anotherreason the relationship is clear here may be that important cli-matic events operate on short time scales, and any direct forcingof mammalian change will be blurred if mammals being com-pared are not sampled on comparably short time scales. Aggre-gation of mammalian records on million-year time scales maynot be precise enough to reveal patterns on the time scale of cli-mate change (just as study of evolutionary change on million-year time scales is inadequate to characterize rates on the timescale of the evolutionary process; Gingerich, 2001b).
Climate plays a large role in structuring living mammalianfaunas both geographically and ecologically (Badgley and Fox,2000). The links between Wa-0 faunal change and climatechange demonstrated here cannot be generalized to the wholefaunal history of Cenozoic mammals, but at the same time it isclear that climate plays an important role in faunal change andsuch relationships deserve careful investigation.
ACKNOWLEDGMENTS
I thank Dr. James A. Teeri for information on experiments withplants grown in environments of elevated carbon dioxide;Daniel C. Fisher for discussion; and Catherine E. Badgley,David L. Fox, Gregg F. Gunnell, and John P. Hunter for reviewsimproving the manuscript. Research on mammalian faunal evo-lution across the Paleocene-Eocene boundary has been sup-ported by a series of grants from the National Science Founda-tion, most recently EAR-0125502.
REFERENCES CITED
Alroy, J., Koch, P.L., and Zachos, J.C., 2000, Global climate change and NorthAmerican mammalian evolution, in Erwin, D.H., and Wing, S.L., eds.,Deep time: Paleobiology’s perspective: Paleobiology, v. 26 (supplement),p. 259–288.
Ashton, K.G., Tracy, M.C., and de Queiroz, A., 2000, Is Bergmann’s Rule validfor mammals: American Naturalist, v. 156, p. 390–415.
Badgley, C.E., and Fox, D.L., 2000, Ecological biogeography of North Ameri-can mammals: Species density and ecological structure in relation to envi-ronmental gradients: Journal of Biogeography, v. 27, p. 1437–1467.
Badgley, C.E., and Gingerich, P.D., 1988, Sampling and faunal turnover in earlyEocene mammals: Palaeogeography, Palaeoclimatology, Palaeoecology, v. 63, p. 141–157.
Bao, H., Koch, P.L., and Rumble, D., 1999, Paleocene-Eocene climatic varia-tion in western North America: Evidence from the δ18O of pedogenichematite: Geological Society of America Bulletin, v. 111, p. 1405–1415.
Behrensmeyer, A.K., Todd, N.E., Potts, R., and McBrinn, G.E., 1997, LatePliocene faunal turnover in the Turkana Basin, Kenya and Ethiopia: Sci-ence, v. 278, p. 1589–1594.
Bergmann, C., 1847, Über die Verhältnisse der Wärmeökonomie der Thiere zuihrer Grösse: Göttinger Studien, v. 1, p. 595–798.
Bowen, G.J., Koch, P.L., Gingerich, P.D., Norris, R.D., Bains, S., and Corfield,R.M., 2001, Refined isotope stratigraphy across the continental Paleocene-Eocene boundary on Polecat Bench in the northern Bighorn Basin, in Gin-gerich, P.D., ed., Paleocene-Eocene stratigraphy and biotic change in theBighorn and Clarks Fork basins, Wyoming: University of Michigan Paperson Paleontology, v. 33, p. 73–88.
Butler, R.F., Gingerich, P.D., and Lindsay, E.H., 1981, Magnetic polarity stratig-raphy and biostratigraphy of Paleocene and lower Eocene continental de-posits, Clarks Fork Basin, Wyoming: Journal of Geology, v. 89, p. 299–316.
Butler, R.F., Krause, D.W., and Gingerich, P.D., 1987, Magnetic polarity stratig-raphy and biostratigraphy of middle-late Paleocene continental deposits ofsouth-central Montana: Journal of Geology, v. 95, p. 647–657.
Cande, S.C., and Kent, D.V., 1995, Revised calibration of the geomagnetic po-larity timescale for the Late Cretaceous and Cenozoic: Journal of Geo-physical Research, v. 100, p. 6093–6095.
Case, T.J., 1979, Optimal body size and an animal’s diet: Acta Biotheoretica, v. 28, p. 54–69.
Clyde, W.C., 1997, Stratigraphy and mammalian paleontology of the McCul-lough Peaks, northern Bighorn Basin, Wyoming: Implications for bio-chronology, basin development, and community reorganization across thePaleocene-Eocene boundary [Ph.D. dissertation]: Ann Arbor, Michigan,University of Michigan, 270 p.
Clyde, W.C., 2001, Mammalian biostratigraphy of the McCullough Peaks areain the northern Bighorn Basin, in Gingerich, P.D., ed., Paleocene-Eocenestratigraphy and biotic change in the Bighorn and Clarks Fork basins,Wyoming: University of Michigan Papers on Paleontology, v. 33, p. 109–126.
Clyde, W.C., and Gingerich, P.D., 1998, Mammalian community response to thelatest Paleocene thermal maximum: An isotaphonomic study in the north-ern Bighorn Basin, Wyoming: Geology, v. 26, p. 1011–1014.
Clyde, W.C., Stamatakos, J., and Gingerich, P.D., 1994, Chronology of theWasatchian land-mammal age (early Eocene): Magnetostratigraphic re-sults from the McCullough Peaks section, northern Bighorn Basin,Wyoming: Journal of Geology, v. 102, p. 367–377.
Cope, E.D., 1888, Synopsis of the vertebrate fauna of the Puerco series: Trans-actions of the American Philosophical Society, v. 16, p. 298–361.
Dickens, G.R., 2000, Methane oxidation during the late Paleocene thermal maximum: Bulletin de la Société Géologique de France, v. 177, p. 37–49.
Eisenberg, J.F., 1981, The mammalian radiations: An analysis of trends in evo-lution, adaptation, and behavior: Chicago, Illinois, University of ChicagoPress, 610 p.
Fajer, E.D., Bowers, M.D., and Bazzaz, F.A., 1989, The effects of enriched car-bon dioxide atmospheres on plant-insect herbivore interactions: Science, v. 243, p. 1198–1200.
Fricke, H.C., Clyde, W.C., O’Neil, J.R., and Gingerich, P.D., 1998, Evidence forrapid climate change in North America during the latest Paleocene thermalmaximum: Oxygen isotope compositions of biogenic phosphate from theBighorn Basin (Wyoming): Earth and Planetary Science Letters, v. 160, p. 193–208.
476 P.D. Gingerich

Gervais, P., 1877, Enumération de quelques ossements d’animaux vertébrés re-cueillis aux environs de Reims par M. Lemoine: Journal de Zoologie, Paris,v. 6, p. 74–79.
Gingerich, P.D., 1976, Cranial anatomy and evolution of early Tertiary Plesi-adapidae (Mammalia, Primates): University of Michigan Papers on Pale-ontology, v. 15, p. 1–140.
Gingerich, P.D., 1982, Paleocene ‘Meniscotherium semicingulatum’and the firstappearance of Meniscotheriidae (Condylarthra) in North America: Journalof Mammalogy, v. 63, p. 488–491.
Gingerich, P.D., 1983, Paleocene-Eocene faunal zones and a preliminary analy-sis of Laramide structural deformation in the Clarks Fork Basin, Wyoming:Wyoming Geological Association, 34th Annual Field Conference, Guide-book, p. 185–195.
Gingerich, P.D., 1985, South American mammals in the Paleocene of NorthAmerica, in Stehli, F.G., and Webb, S.D., eds., The great American bioticinterchange: New York, Plenum Press, p. 123–137.
Gingerich, P.D., 1989, New earliest Wasatchian mammalian fauna from theEocene of northwestern Wyoming: Composition and diversity in a rarelysampled high-floodplain assemblage: University of Michigan Papers onPaleontology, v. 28, p. 1–97.
Gingerich, P.D., 1991, Systematics and evolution of early Eocene Perissodactyla(Mammalia) in the Clarks Fork Basin, Wyoming: Contributions from theMuseum of Paleontology, University of Michigan, v. 28, p. 181–213.
Gingerich, P.D., 2000, Paleocene-Eocene boundary and continental verte-brate faunas of Europe and North America, in Schmitz, B., et al., eds.,Early Paleogene warm climates and biosphere dynamics: GFF, v. 122, p. 57–59.
Gingerich, P.D., 2001a, Biostratigraphy of the continental Paleocene-Eoceneboundary interval on Polecat Bench in the northern Bighorn Basin, in Gin-gerich, P.D., ed., Paleocene-Eocene stratigraphy and biotic change in theBighorn and Clarks Fork basins, Wyoming: University of Michigan Paperson Paleontology, v. 33, p. 37–71.
Gingerich, P.D., 2001b, Rates of evolution on the time scale of the evolutionaryprocess, in Hendry, A., et al., eds., Contemporary microevolution—Rate,Pattern, and Process: Genetica, v. 112/113, p. 127–144.
Gingerich, P.D., and Clyde, W.C., 2001, Overview of mammalian biostrati-graphy in the Paleocene-Eocene Fort Union and Willwood formations ofthe Bighorn and Clarks Fork basins, in Gingerich, P.D., ed., Paleocene-Eocene stratigraphy and biotic change in the Bighorn and Clarks Forkbasins, Wyoming: University of Michigan Papers on Paleontology, v. 33,p. 1–14.
Granger, W., 1914, On the names of lower Eocene faunal horizons of Wyomingand New Mexico: Bulletin of the American Museum of Natural History, v. 33, p. 201–207.
Granger, W., 1915, A revision of the lower Eocene Wasatch and Wind River fau-nas, Part III: Order Condylarthra, families Phenacodontidae and Menis-cotheriidae: Bulletin of the American Museum of Natural History, v. 34, p. 329–361.
Gunnell, G.F., 1998, Mammalian faunal composition and the Paleocene-Eoceneepoch/series boundary: Evidence from the northern Bighorn Basin,Wyoming, in Aubry, M.-P., et al., eds., Late Paleocene–early Eocene cli-matic and biotic events in the marine and terrestrial records: New York, Co-lumbia University Press, p. 409–427.
Hartman, J.H., and Roth, B., 1998, Late Paleocene and early Eocene nonmarinemolluscan faunal change in the Bighorn Basin, northwestern Wyoming andsouth-central Montana, in Aubry, M.-P., et al., eds., Late Paleocene–earlyEocene climatic and biotic events in the marine and terrestrial records: NewYork, Columbia University Press, p. 323–379.
Hickey, L.J., 1980, Paleocene stratigraphy and flora of the Clarks Fork basin, inGingerich, P.D., ed., Early Cenozoic paleontology and stratigraphy of theBighorn Basin, Wyoming: University of Michigan Papers on Paleontology,v. 24, p. 33–49.
Janis, C.M., 1993, Tertiary mammal evolution in the context of changing cli-mates, vegetation, and tectonic events: Annual Review of Ecology and Sys-tematics, v. 24, p. 467–500.
Jepsen, G.L., 1930, Stratigraphy and paleontology of the Paleocene of north-eastern Park County, Wyoming: Proceedings of the American Philosophi-cal Society, v. 69, p. 463–528.
Jepsen, G.L., and Woodburne, M.O., 1969, Paleocene hyracothere from PolecatBench Formation, Wyoming: Science, v. 164, p. 543–547.
Kinney, K.K., Lindroth, R.L., Jung, S.M., and Nordheim, E.V., 1997, Effects ofCO2 and NO3 availability on deciduous trees: Phytochemistry and insectperformance: Ecology, v. 78, p. 215–230.
Koch, P.L., 1986, Clinal geographic variation in mammals: Implications for thestudy of chronoclines: Paleobiology, v. 12, p. 269–281.
Koch, P.L., Zachos, J.C., and Gingerich, P.D., 1992, Correlation between iso-tope records in marine and continental carbon reservoirs near the Pale-ocene-Eocene boundary: Nature, v. 358, p. 319–322.
Koch, P.L., Zachos, J.C., and Dettman, D.L., 1995, Stable isotope stratigraphyand paleoclimatology of the Paleogene Bighorn Basin (Wyoming, USA):Palaeogeography, Palaeoclimatology, Palaeoecology, v. 115, p. 61–89.
Kraus, M.J., 1980, Genesis of a fluvial sheet sandstone, Willwood Formation,northwest Wyoming, in Gingerich, P.D., ed., Early Cenozoic paleontologyand stratigraphy of the Bighorn Basin, Wyoming: University of MichiganPapers on Paleontology, v. 24, p. 87–94.
Kraus, M.J., 1987, Integration of channel and flood-plain suites, II: Vertical relations of alluvial paleosols: Journal of Sedimentary Petrology, v. 57, p. 602–612.
Kraus, M.J., 1996, Avulsion deposits in lower Eocene alluvial rocks, BighornBasin, Wyoming: Journal of Sedimentary Research, v. 66, p. 354–363.
Kraus, M.J., 2001, Sedimentology and depositional setting of the WillwoodFormation in the Bighorn and Clarks Fork basins, in Gingerich, P.D., ed.,Paleocene-Eocene stratigraphy and biotic change in the Bighorn and ClarksFork basins, Wyoming: University of Michigan Papers on Paleontology, v. 33, p. 15–28.
Krause, D.W., and Maas, M.C., 1990, The biogeographic origins of late Pale-ocene–early Eocene mammalian immigrants to the western interior ofNorth America, in Bown, T.M., and Rose, K.D., eds., Dawn of the age ofmammals in the northern part of the Rocky Mountain interior, North Amer-ica: Boulder, Colorado, Geological Society of America Special Paper 243,p. 71–105.
Legendre, S., 1989, Les communautés de mammifères du Paléogène (Eocènesupérieur et Oligocène) d’Europe occidentale: Structures, milieux et évo-lution: Münchner Geowissenschaftliche Abhandlungen, Reihe A, Geologieund Paläontologie, v. 16, p. 1–110.
Lemoine, V., 1891, Étude d’ensemble sur les dents des mammifères fossiles desenvirons de Reims: Bulletin de la Société Géologique de France, v. 19, p. 263–290.
Luterbacher, H., Hardenbol, J.A., and Schmitz, B., 2000, Decision of the votingmembers of the International Subcommission on Paleogene Stratigraphyon the criterion for the recognition of the Paleocene-Eocene boundary:Newsletter of the International Subcommission on Paleogene Stratigraphy,Tübingen, November 2000, v. 9, p. 13.
Prothero, D.R., 1999, Does climatic change drive mammalian evolution?: GSAToday, v. 9, no. 9, p. 1–7.
Rensch, B., 1929, Das Prinzip Geographischer Rassenkreise und das Problemder Artbildung: Berlin, Borntraeger, 206 p.
Rose, K.D., 1979, The Clarkforkian land-mammal ‘age’ and mammalian faunalcomposition across the Paleocene-Eocene boundary [Ph.D. thesis]: AnnArbor, Michigan, University of Michigan, 628 p.
Rose, K.D., 1980, Clarkforkian land-mammal age: Revised definition, zonation,and tentative intercontinental correlations: Science, v. 208, p. 744–746.
Rose, K.D., 1981a, The Clarkforkian land-mammal age and mammalian faunalcomposition across the Paleocene-Eocene boundary: University of Michi-gan Papers on Paleontology, v. 26, p. 1–197.
Rose, K.D., 1981b, Composition and species diversity in Paleocene and Eocenemammal assemblages: An empirical study: Journal of Vertebrate Paleon-tology, v. 1, p. 367–388.
Royer, D.L., Wing, S.L., Beerling, D.J., Jolley, D.W., Koch, P.L., Hickey, L.J.,and Berner, R.A., 2001, Paleobotanical evidence for near present-day lev-
Mammalian responses to climate change at the Paleocene-Eocene boundary 477

els of atmospheric CO2 during part of the Tertiary: Science, v. 292, p. 2310–2313.
Russell, D.E., 1964, Les Mammifères Paléocènes d’Europe: Mémoires duMuséum National d’Histoire Naturelle, Paris, Série C, v. 13, p. 1–324.
Scott, W.B., 1913, A history of land mammals in the Western Hemisphere: NewYork, Macmillan Company, 693 p.
Simpson, G.G., 1943, Criteria for genera, species, and subspecies in zoology andpaleontology: Annals of the New York Academy of Sciences, v. 44, p. 145–178.
Sinclair, W.J., 1912, Contributions to geologic theory and method by Americanworkers in vertebrate paleontology: Geological Society of America Bul-letin, v. 23, p. 262–266.
Sloan, R.E., 1970, Cretaceous and Paleocene terrestrial communities of westernNorth America, in Yochelson, E.L., ed., Proceedings of the North Ameri-can Paleontological Convention, Two Volumes: Lawrence, Kansas, AllenPress, p. 427–453.
Sokal, R.R., and Rohlf, F.J., 1981, Biometry (2nd edition): San Francisco, W.H.Freeman, 859 p.
Strait, S.G., 2001, New Wa-0 mammalian fauna from Castle Gardens in thesoutheastern Bighorn Basin, in Gingerich, P.D., ed., Paleocene-Eocenestratigraphy and biotic change in the Bighorn and Clarks Fork basins,Wyoming: University of Michigan Papers on Paleontology, v. 33, p. 127–143.
Strauss, D.J., and Sadler, P.M., 1989, Classical confidence intervals andBayesian probability estimates for ends of local taxon ranges: Mathemati-cal Geology, v. 21, p. 411–427.
Stucky, R.K., 1990, Evolution of land mammal diversity in North America dur-ing the Cenozoic, in Genoways, H.H., ed., Current mammalogy, Volume 2:Plenum, New York, p. 375–432.
Tuchman, N.C., Wetzel, R.G., Rier, S.T., Wahtera, K.A., and Teeri, J.A., 2002,Elevated atmospheric CO2 lowers leaf litter nutritional quality for streamecosystem food webs: Global Change Biology, v. 8, p. 163–170.
Vrba, E.S., 1985, Environment and evolution: Alternative causes of the tempo-ral distribution of evolutionary events: South African Journal of Science, v.81, p. 229–236.
Webb, S.D., and Opdike, N.D., 1995, Global climatic influences on Cenozoicland mammal faunas, in Stanley, S.M., et al., eds., Effects of past globalchange on life: Washington, D.C., National Academies Press, p. 184–208.
Wing, S.L., 1998, Late Paleocene–early Eocene floral and climatic change in theBighorn Basin, Wyoming, in Aubry, M.-P., et al., eds., Late Paleocene–early Eocene climatic and biotic events in the marine and terrestrialrecords: New York, Columbia University Press, p. 380–400.
Wing, S.L., and Harrington, G.J., 2001, Floral response to rapid warming in theearliest Eocene and implications for concurrent faunal change: Paleobiol-ogy, v. 27, p. 539–563.
Wing, S.L., Bao, H., and Koch, P.L., 2000, An early Eocene cool period? Evi-dence for continental cooling during the warmest part of the Cenozoic, inHuber, B.T., et al., eds., Warm climates in Earth history: Cambridge, UK,Cambridge University Press, p. 197–237.
Wood, H.E., Chaney, R.W., Clark, J., Colbert, E.H., Jepsen, G.L., Reeside, J.B.,and Stock, C., 1941, Nomenclature and correlation of the North Americancontinental Tertiary: Geological Society of America Bulletin, v. 52, p. 1–48.
Wood, R.C., 1967, A review of the Clark Fork vertebrate fauna: Breviora, Mu-seum of Comparative Zoology, Harvard University, v. 257, p. 1–30.
Zachos, J.C., Pagani, M., Sloan, L.C., Thomas, E., and Billups, K., 2001, Trends,rhythms, and aberrations in global climate 65 Ma to present: Science, v. 292, p. 686–693.
MANUSCRIPT ACCEPTED BY THE SOCIETY AUGUST 13, 2002
478 P.D. Gingerich
Printed in the USA