mammoth groundwater extraction: a hydrological analysis of
TRANSCRIPT
UNIVERSITY OF CALIFORNIA
Santa Barbara
Mammoth Groundwater Extraction: A Hydrological Analysis of Potential Recharge to an Eastern
Sierra Nevada Watershed A Group Project submitted in partial satisfaction of the requirements for the degree of
Master�s in Environmental Science and Management for the
Donald Bren School of Environmental Science and Management
By
Andrew D. Breibart
Robin E. Cathcart
Karin A. Didriksen
J. Lauren Everett
Group Advisor: John M. Melack
June 2001
iii
ACKNOWLEDGEMENTS
We would like to recognize and specially thank the following people and organizations for their support, guidance, and advice throughout the completion of this project: The Mammoth Community Water Distinct (MCWD) and Mammoth Mountain Ski Area (MMSA) for giving us the opportunity to evaluate potential sources of water and for financially supporting the project. We would especially like to thank Gary Sisson, MCWD and Thom Heller, MMSA for providing us with the necessary resources and information. The United States Forest Service-Inyo National Forest, United States Geological Survey, and Sue Burak with Snow Survey Associates for supplying hydrologic data and knowledge about the Dry Creek watershed. The following people and organizations affiliated with the University of California-Santa Barbara: Our faculty advisor, John Melack, who furnished us with valuable advice and direction throughout the course of the project. Jeff Dozier, PhD Tom Dunne, PhD Lorne G. Everett, PhD Rick Kattelmann, PhD Arturo Keller, PhD Hugo Loaigacia, PhD Al Leydecker, Post Doctoral Researcher Mike Colee, Graduate Student Researcher Tom Painter, Graduate Student Researcher University of California Sierra Nevada Research Laboratory The Map and Imagery Lab The Staff at the Bren School
iv
ABSTRACT
Anticipation of increased growth and development in Mammoth Lakes, California, necessitated the search for additional water sources to satisfy demand during consecutive drought years. The Mammoth Community Water District (MCWD) and Mammoth Mountain Ski Area (MMSA) identified the Dry Creek basin, located in the Inyo National Forest, as a potential source. A water balance of the basin, using 1992 as a representative drought year and 1996 as a representative average year, calculated the amount of groundwater potentially available for extraction. The water balance utilized the upper 22 km2 of the watershed, which represents the source of recharge for the well field. The calculated change in potential groundwater recharge ranges between 2.8 x 10⁶ and 1.3 x 10⁷ m3 for a drought year. The proposed extraction quantity of 3.7 x 10⁶ m3 yr-1 is greater than the lower range calculated for groundwater recharge in drought years. However, during average water years, the range of potential recharge is 2.5 x 10⁷ and 1.1 x 10⁷ m3. The proposed extraction quantity is less than the lower range calculated for groundwater recharge, indicating that the aquifer can supply both the MCWD and MMSA with their desired quantity. We recommend that the MCWD and MMSA extract up to 2.5 x 10⁶ m3 during drought years and 3.7 x 10⁶ m3 during average years. We also recommend further collection of hydrologic data, coupled with the extraction to facilitate a deeper understanding of the Dry Creek hydrology, while supplying the Town of Mammoth Lakes with the water it seeks.
v
EXECUTIVE SUMMARY
Large portions of California�s agricultural and metropolitan areas depend on the water obtained from the Sierra Nevada. Population influx and resource development are placing mounting pressure on the state�s hydrologic resources, increasing the need for more accurate water balances of the drainage basins in montane regions. As the demand for water grows, ways of augmenting California�s water supply are being explored with greater intensity.
The Town of Mammoth Lakes, located in central, eastern California is currently experiencing a strain on their water resources. The Dry Creek drainage, located in California�s Inyo National Forest, has been proposed for the location of a well field, which would provide both the Mammoth Community Water District (MCWD) and the Mammoth Mountain Ski Area (MMSA) with an additional source of water. The MCWD currently utilizes surface diversion and groundwater extraction from within the Mammoth Creek drainage, and is requesting an additional capacity of 2.46 x 10⁶ m3 yr-1 (2,000 AFY) from wells within the Dry Creek drainage. The ski area is looking towards groundwater development in the Dry Creek basin also to alleviate their water demand in times of drought or scarcity, and has requested a total procurement of 8.5 x 10⁵ m3 yr-1 (685 AFY) from the basin. The two entities have requested that we use 3.7 x 10⁶ m3 yr-1 (3,000 AFY) in our water budget calculations rather than the 3.3 x 10⁶ m3 yr-1 (2,685 AFY), in the event that the MCWD or MMSA would increase their usage in the future.
The Dry Creek drainage sits on the eastside of the Sierra Nevada, immediately northwest of the Town of Mammoth Lakes and the Mammoth Creek drainage. The drainage area is approximately 66 km2 (17,000 acres) ranging in elevation from 2,195 to 3,353 meters (7,200-11,000 feet) above mean sea level. Surface runoff in the basin is primarily generated by the seasonal snow pack, and in almost all years, percolation is sufficient that surface flows do not leave the basin.
We conducted an analysis to assess the quantity of water available for pumping based upon a water balance. A hydrologic balance for the Dry Creek drainage was calculated to determine the amount of groundwater recharge for the proposed well field and for the entire watershed. Two water balances were developed:
��The well field water balance uses only the upper one third (22 km2) of the watershed to calculate the recharge for the Dry Creek wells;
��The basin water balance incorporates the entire topographical watershed to calculate the recharge to the entire basin.
The overall water balance equation used to calculate the change in storage for the well field and the entire watershed is:
vi
∈±−−=∆ UETPPR
Where ∆PR is the potential recharge to the groundwater system. P is the precipitation, which is comprised of snow water equivalence (SWE) and rainfall. ET is the evapotranspiration, which is the sum of the basin-wide evaporation and transpiration. U is the consumptive use of water within the watershed. Epsilon represents the sum of the errors associated with the estimation of the variables.
The main assumption for the water balance calculation is that the change in storage equals the amount of recharge. Our analysis considers the amount of recharge that contributes to the groundwater of the basin-wide hydrologic system for both a drought (1992) and an average year (1996).
The results of the water balances conducted on the Dry Creek watershed are presented for two different watershed schemes, both the whole basin, and the upper one third, for each of the two years analyzed (1992 and 1996). According to the well field water balance results, the recharge of the aquifer in 1992 ranges from 3.5 x 10⁶ m3 (2,800 AF) to 1.3 x 10⁷ m3 (10,500 AF).
The proposed extraction of 3.7 x 10⁶ m3 yr-1 (3,000 AFY) is greater than our lowest groundwater recharge estimate of 3.5 x 10⁶ m3 (2,800 AF), and smaller than our largest recharge estimate of 1.3 x 10⁷ m3 (10,500 AF). We find that the proposed extraction can supply Mammoth Lakes with the water it needs during average water years. However, increased monitoring of both the surface and groundwater hydrology is recommended to better explain the interrelationship between groundwater and spring flows in the region.
There are a number of stakeholders associated with this project who share concerns over the implications the Dry Creek Well Project. Most of these concerns are focused on the hydrologic impacts to the downstream resources, notably Big Springs and the Upper Owens River. Estimation of impacts on downstream resources will require an intensive groundwater and geologic investigation.
Our recommendation regarding the extraction of groundwater from the Dry Creek basin is to extract up to 2.5 x 10⁶ m3 yr-1 (2,000 AFY) during drought years, and in average water years extract the full 3.7 x 10⁶ m3 yr-1 (3,000 AFY), while monitoring the down gradient hydrology to assess any hydrologic effects from pumping. This recommendation will permit the MCWD and MMSA to extract the water they request, while also providing an opportunity for continued research into the area�s hydrogeology. The recommended extraction quantities coupled with hydrologic monitoring can provide the MCWD and MMSA with sufficient information to determine sustainable groundwater extraction rates.

vii
TABLE OF CONTENTS
CHAPTER 1 INTRODUCTION----------------------------------------------------------- 1
1.1 Background------------------------------------------------------------------------------ 1 1.1.1 Water Supply and Demand -------------------------------------------------------- 3
1.1.1.1 MCWD------------------------------------------------------------------------------ 3 1.1.1.2 MMSA ----------------------------------------------------------------------------- 4
1.2 Research Question---------------------------------------------------------------------- 4 1.2.1 Scope --------------------------------------------------------------------------------- 4 1.2.2 Importance of Research ------------------------------------------------------------ 5
1.3 Brief history of water use and demand in eastern Sierra Nevada ----------- 6
1.4 Previous research done on Dry Creek --------------------------------------------- 7
CHAPTER 2 WATER RIGHTS----------------------------------------------------------- 9
2.1 Federal water rights ------------------------------------------------------------------- 9
2.2 California Water Rights ------------------------------------------------------------- 11 2.2.1 Surface and groundwater use in California ------------------------------------ 11
2.3 Regional Water Rights --------------------------------------------------------------- 12 2.3.1 Authoritative bodies --------------------------------------------------------------- 13
2.3.1.1 California RWQCB � Lahontan Region ------------------------------------- 13
2.4 Local Water Rights ------------------------------------------------------------------- 14 2.4.1 MCWD ------------------------------------------------------------------------------ 14 2.4.2 MMSA------------------------------------------------------------------------------- 15
CHAPTER 3 DRY CREEK BASIN OVERVIEW-------------------------------------17
3.1 Watershed delineation---------------------------------------------------------------- 17
3.2 Surface Water -------------------------------------------------------------------------- 17 3.2.1 Creek and Spring Description---------------------------------------------------- 17 3.2.2 Surface Storage--------------------------------------------------------------------- 19
3.2.2.1 Mid-Chalet ----------------------------------------------------------------------- 19 3.2.2.2 Silt Pond -------------------------------------------------------------------------- 19 3.2.2.3 Inyo Crater Lakes --------------------------------------------------------------- 19
3.3 Vegetation ------------------------------------------------------------------------------- 19

viii
3.4 Geology – Long Valley---------------------------------------------------------------- 19 3.4.1 Faulting------------------------------------------------------------------------------ 20 3.4.2 Soils---------------------------------------------------------------------------------- 21
3.5 Groundwater --------------------------------------------------------------------------- 21
3.6 Relevance/Concerns------------------------------------------------------------------- 21
CHAPTER 4 WATER BALANCE -------------------------------------------------------23
4.1 Water Balance Methodologies ------------------------------------------------------ 23 4.1.1 Water balance equation ----------------------------------------------------------- 23 4.1.2 Years chosen to evaluate---------------------------------------------------------- 24 4.1.3 Overview of water balance method --------------------------------------------- 24
4.2 Surface Water Hydrology ----------------------------------------------------------- 26 4.2.1 Precipitation- Rain ----------------------------------------------------------------- 26
4.2.1.1 Lower Rain Zone ---------------------------------------------------------------- 28 4.2.1.2 Upper Rainfall Zone ------------------------------------------------------------ 28 4.2.1.3 Rainfall uncertainty ------------------------------------------------------------- 30
4.2.1 Precipitation - Snow water equivalent ------------------------------------------ 30 4.2.2.1 SWE Zone 1---------------------------------------------------------------------- 31 4.2.2.2 SWE Zone 2---------------------------------------------------------------------- 32 4.2.2.3 SWE Zone 3---------------------------------------------------------------------- 34 4.2.2.4 SWE Zone 4---------------------------------------------------------------------- 34 4.2.2.5 SWE Zone 5---------------------------------------------------------------------- 35 4.2.2.6 SWE Zone 6---------------------------------------------------------------------- 36 4.2.2.7 SWE Zone 7---------------------------------------------------------------------- 36 4.2.2.8 Other Snow Courses and Pillows --------------------------------------------- 37 4.2.2.9 SWE uncertainty----------------------------------------------------------------- 43
4.2.1 Runoff ------------------------------------------------------------------------------- 44 4.2.3 Evapotranspiration----------------------------------------------------------------- 44
4.2.3.1 Evaporation Zone---------------------------------------------------------------- 44 4.2.3.2 Evapotranspiration Zone ------------------------------------------------------- 48 4.2.3.3 Evapotranspiration uncertainty------------------------------------------------ 49
4.2.4 Consumption/Use ------------------------------------------------------------------ 49 4.2.4.1 Consumption/Use uncertainty ------------------------------------------------- 49
4.3 Groundwater Hydrology------------------------------------------------------------- 50 4.3.1 Soils---------------------------------------------------------------------------------- 50 4.3.2 Hydrogeology ---------------------------------------------------------------------- 50
4.3.2.1 Water bearing zones ------------------------------------------------------------ 51 4.3.3 Wells of MCWD ------------------------------------------------------------------- 51
4.3.3.1 Groundwater Elevations-------------------------------------------------------- 52
ix
4.3.4 Other wells in region -------------------------------------------------------------- 56 4.3.4.1 MMSA Wells -------------------------------------------------------------------- 56 4.3.4.2 USGS and Other Wells --------------------------------------------------------- 56
4.3.5 Chemical Analyses ---------------------------------------------------------------- 58 4.3.5.1 Carbon Analysis ----------------------------------------------------------------- 58 4.3.5.2 Temperature Analysis ---------------------------------------------------------- 59 4.3.5.3 Groundwater Dating ------------------------------------------------------------ 60
4.3.6 Modeling ---------------------------------------------------------------------------- 62 4.3.7 Groundwater Discussion---------------------------------------------------------- 63
CHAPTER 5 WATER BALANCE RESULTS ----------------------------------------64
5.1 Water Balance-------------------------------------------------------------------------- 64
5.2 Well Field Water Balance Results ------------------------------------------------- 65 5.2.1 Inputs -------------------------------------------------------------------------------- 65
5.2.1.1 Rainfall---------------------------------------------------------------------------- 65 5.2.1.2 SWE ------------------------------------------------------------------------------- 65
5.2.2 Outputs ------------------------------------------------------------------------------ 66 5.2.2.1 Evapotranspiration --------------------------------------------------------------- 66 5.2.2.2 Consumption/Use --------------------------------------------------------------- 68
5.2.3 Well Field Water Budget Error Calculation ----------------------------------- 68
5.3 Basin Water Balance Results ------------------------------------------------------- 72 5.3.1 Inputs -------------------------------------------------------------------------------- 72
5.3.1.1 Rainfall---------------------------------------------------------------------------- 72 5.3.1.2 SWE ------------------------------------------------------------------------------- 73
5.3.2 Outflows----------------------------------------------------------------------------- 75 5.3.2.1 Evapotranspiration -------------------------------------------------------------- 75 5.3.2.2 Consumption/Use --------------------------------------------------------------- 76
5.3.3 Basin Error Calculations ---------------------------------------------------------- 76
5.4 Discussion ------------------------------------------------------------------------------- 79
CHAPTER 6 WATER POLICY ISSUES-----------------------------------------------82
6.1 Stakeholders ---------------------------------------------------------------------------- 82 6.1.1 Hydrologic Impact Concerns----------------------------------------------------- 82
6.1.1.1 Big Springs and Upper Owens River------------------------------------------ 82 6.1.2 Water Right Concerns------------------------------------------------------------- 82
6.2 Discussion of Agency Responses---------------------------------------------------- 83 6.2.1 Hydrologic Impact Response----------------------------------------------------- 84 6.2.2 Water Right Response------------------------------------------------------------- 88
x
6.3 Discussion of Disparity between Public Policy and Stakeholder Solutions89
CHAPTER 7 RECOMMENDATIONS --------------------------------------------------90
7.1 Recommended Option---------------------------------------------------------------- 90
7.2 Recommendations for further data collection----------------------------------- 90 7.2.1 Surface Hydrology----------------------------------------------------------------- 90 7.2.2 Hydrogeology ---------------------------------------------------------------------- 91 7.2.3 Big Springs ------------------------------------------------------------------------- 92 7.2.3.1 Policy evaluation (policy implications)----------------------------------------- 94
7.3 Concluding Remarks ----------------------------------------------------------------- 95
LIST OF TABLES Table 2-1: Summary of MCWD’s Surface Water Rights ---------------------------- 15 Table 4-1: Rainfall zones characteristics------------------------------------------------- 28 Table 4-2: Rain gauges in Mammoth Lakes, CA--------------------------------------- 30 Table 4-3: SWE zones area, elevation, and site name --------------------------------- 38 Table 4-4: SWE Measurement sites. ------------------------------------------------------ 39 Table 4-5: 1992 and 1996 SWE and snow depth data in the Dry Creek
Watershed --------------------------------------------------------------------------------- 40 Table 4-6: Regional SWE measurement sites ------------------------------------------- 41 Table 4-6 (cont): Regional snow measurement sites ----------------------------------- 42 Table 4-7: Literature sources of annual evapotranspiration (ET)----------------- 48 Table 4-8: Dry Creek wells location and elevation------------------------------------- 52 Table 4-9: Hydraulic characteristics of the Dry Creek wells ------------------------ 53 Table 4-10: Groundwater elevations within MCWD wells from 1990 to 2000.-- 55 Table 4-11: Carbon chemistry for wells and springs in Dry Creek drainage ---- 59 Table 4-12: Chemical analysis of Dry Creek Wells, provided by the USGS
(Evans et al., 2000) ----------------------------------------------------------------------- 61 Table 5-1: Rainfall totals for well field water balance -------------------------------- 65 Table 5-2: SWE for the well field water balance --------------------------------------- 66 Table 5-3: Evaporation and evapotranspiration for the well field water balance
----------------------------------------------------------------------------------------------- 68 Table 5-4: Error calculations from well field water balance ------------------------ 70 Table 5-5: Range of potential recharge for the well field based on error analysis.
----------------------------------------------------------------------------------------------- 71 Table 5-6: Rainfall totals for basin water balance ------------------------------------- 72 Table 5-7: SWE for the basin water balance-------------------------------------------- 74 Table 5-8: Evaporation and evapotranspiration for the basin water balance --- 76 Table 5-9: Error calculations from basin water balance ----------------------------- 78

xi
Table 5-10: Calculated range of potential recharge for the Basin water balance based on error analysis ----------------------------------------------------------------- 79
Table 5-11: Results of well field and basin water budgets --------------------------- 80 Table 5-12: Comparison of basin water balance to well field water balance. ---- 81 Table 7-1 Potential flow reductions in Upper Owens River ------------------------- 94
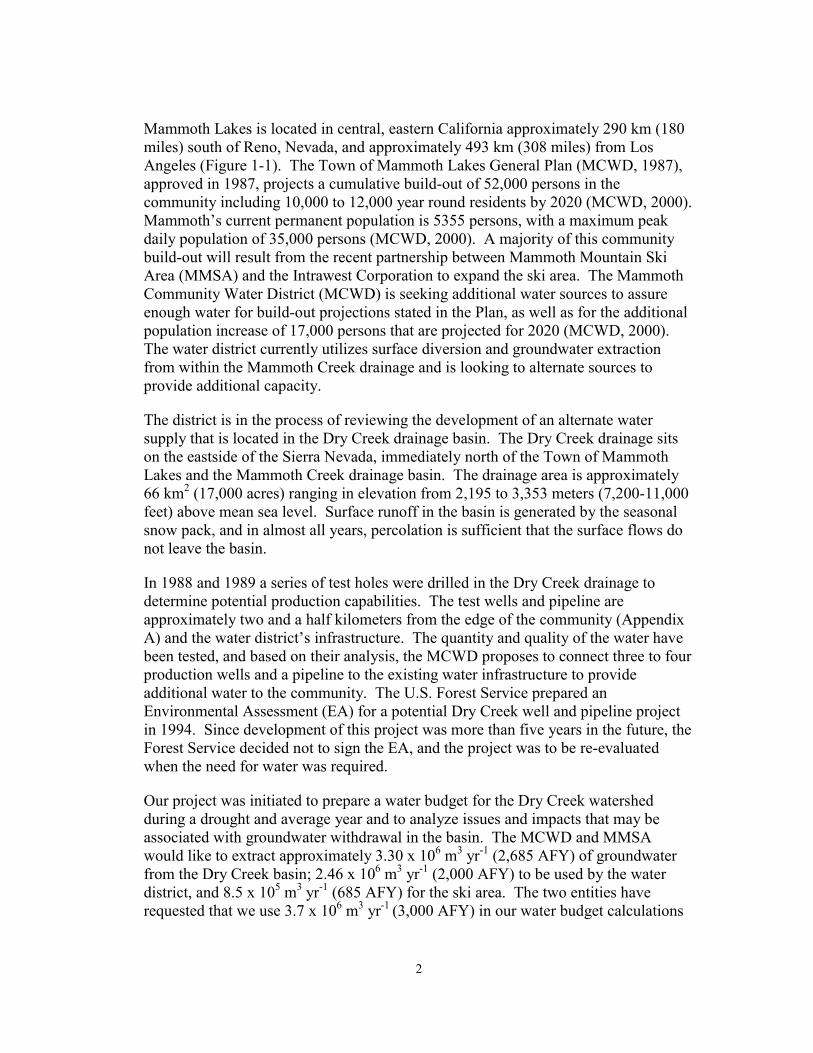
LIST OF FIGURES Figure 1-1: Location map of the Town of Mammoth Lakes -------------------------- 1 Figure 3-1: Elevation map of the Dry Creek drainage and surrounding area--- 18 Figure 3-2 View of the Dry Creek basin from Mammoth Mountain looking
northeast ----------------------------------------------------------------------------------- 20 Figure 4-1: Long term record of SWE at Mammoth Pass snow pillow (1931-
2000) (CA Data Exchange, 2001) ----------------------------------------------------- 24 Figure 4-2: Well field and basin water balance areas --------------------------------- 27 Figure 4-3: Delineation of upper and lower rainfall zones and location of rainfall
gauges--------------------------------------------------------------------------------------- 29 Figure 4-4: SWE zones within the Dry Creek basin----------------------------------- 33 Figure 4-5: Regression of SWE for San Joaquin Ridge snow course and the
Mammoth Snow Pillow (1989 and 1992 to 1995)---------------------------------- 34 Figure 4-6: Regression of SWE for Dry Creek West and Dry Creek East (1993 to
2000) ---------------------------------------------------------------------------------------- 36 Figure 4-7: Relationship between SWE and elevation in the Dry Creek
watershed ---------------------------------------------------------------------------------- 43 Figure 4-8: Evaporation and evapotranspiration zones for the well field water
balance ------------------------------------------------------------------------------------- 46 Figure 4-9: Evaporation and evapotranspiration zones for the basin water
balance ------------------------------------------------------------------------------------- 47 Figure 4-10: MCWD Wells------------------------------------------------------------------ 54 Figure 4-11: Groundwater elevations of the Dry Creek wells between 1988 and
2000 ----------------------------------------------------------------------------------------- 55 Figure 4-12: Groundwater elevation contours and local wells ---------------------- 57 Figure 5-1: Regression of average zonal elevation compared to SWE volume per
area for 1992 and 1996. ----------------------------------------------------------------- 73 Figure 6-1: Recommended stream gauge monitoring for Big Springs ------------ 86 Figure 7-1: Recommended stream monitoring and observation well locations - 93
LIST OF APPENDICES Appendix A: Referenced Locations ----------------------------------------------------- 101 Appendix B: SWE Data for 1992 and 1996-------------------------------------------- 103 Appendix C: Groundwater Chemistry Data ------------------------------------------ 105 Appendix D: Result Calculations -------------------------Error! Bookmark not defined.

xii
ACRONYMS ACWA Association of California Water Agencies AFY Acre feet per year BMP Best Management Practices CDEC California Data Exchange CDWR California Department of Water Resources CEQA California Environmental Quality Act cfs cubic feet per second CRAE Complementary Relationship Areal Evaporation DWR Department of Water Resources EA Environmental Assessment EIR Environmental Impact Report EIS Environmental Impact Statement EPA Environmental Protection Agency FONSI Finding of No Significant Impact gpd gallons per day INF Inyo National Forest LADWP Los Angeles Department of Water and Power LMRP Land and Resource Management Plan MAF Million acre-feet MMSA Mammoth Mountain Ski Area mi mile MCWD Mammoth Community Water District MMMS Mammoth Mountain Meteorological Site MOA Master Operating Agreement NEPA National Environmental Policy Act NPDES National Pollutant Discharge Elimination System RMS Root mean sum RWQCB Regional Water Quality Control Board SSA Snow Survey Associates SWE snow water equivalent SWRCB State Water Resources Control Board SNARL Sierra Nevada Aquatic Research Laboratory TML Town of Mammoth Lakes USFS United States Forest Service USGS United States Geologic Survey USOTA U.S. Office of Technology Assessment UTM Universal Transverse Mercator WEF Water Education Foundation

1
"8
"8
"8
200 0 200 400 Miles
N
43 N
31 N110 W128 W °°
°
°
Reno
Mammoth Lakes
Los Angeles
Chapter 1 Introduction 1.1 BACKGROUND In California, large portions of the state�s agricultural and metropolitan areas depend on the water obtained from the Sierra Nevada. Population influx and resource development are placing mounting pressure on the state�s hydrologic resources, increasing the need for more accurate water balances of the drainage basins in montane regions. As the demand for more water grows, ways of augmenting California�s water supply are being explored with greater intensity.
A general and growing complication is that the demand for water for use in western cities often conflicts with previously established demands for water for other purposes, including irrigation, fish and wildlife sustenance, recreation, and power generation (USOTA, 1993). The build-out of mountain communities such as Aspen, Colorado, and Mammoth Lakes, California, where recreational development is escalating, has put further strain on western water resources. Water scarcity has continually redefined the West, and as a result of the interdependence on water by multiple users, satisfying the increasing demand has become a challenge.
Figure 1-1: Location map of the Town of Mammoth Lakes
2
Mammoth Lakes is located in central, eastern California approximately 290 km (180 miles) south of Reno, Nevada, and approximately 493 km (308 miles) from Los Angeles (Figure 1-1). The Town of Mammoth Lakes General Plan (MCWD, 1987), approved in 1987, projects a cumulative build-out of 52,000 persons in the community including 10,000 to 12,000 year round residents by 2020 (MCWD, 2000). Mammoth�s current permanent population is 5355 persons, with a maximum peak daily population of 35,000 persons (MCWD, 2000). A majority of this community build-out will result from the recent partnership between Mammoth Mountain Ski Area (MMSA) and the Intrawest Corporation to expand the ski area. The Mammoth Community Water District (MCWD) is seeking additional water sources to assure enough water for build-out projections stated in the Plan, as well as for the additional population increase of 17,000 persons that are projected for 2020 (MCWD, 2000). The water district currently utilizes surface diversion and groundwater extraction from within the Mammoth Creek drainage and is looking to alternate sources to provide additional capacity.
The district is in the process of reviewing the development of an alternate water supply that is located in the Dry Creek drainage basin. The Dry Creek drainage sits on the eastside of the Sierra Nevada, immediately north of the Town of Mammoth Lakes and the Mammoth Creek drainage basin. The drainage area is approximately 66 km2 (17,000 acres) ranging in elevation from 2,195 to 3,353 meters (7,200-11,000 feet) above mean sea level. Surface runoff in the basin is generated by the seasonal snow pack, and in almost all years, percolation is sufficient that the surface flows do not leave the basin.
In 1988 and 1989 a series of test holes were drilled in the Dry Creek drainage to determine potential production capabilities. The test wells and pipeline are approximately two and a half kilometers from the edge of the community (Appendix A) and the water district�s infrastructure. The quantity and quality of the water have been tested, and based on their analysis, the MCWD proposes to connect three to four production wells and a pipeline to the existing water infrastructure to provide additional water to the community. The U.S. Forest Service prepared an Environmental Assessment (EA) for a potential Dry Creek well and pipeline project in 1994. Since development of this project was more than five years in the future, the Forest Service decided not to sign the EA, and the project was to be re-evaluated when the need for water was required.
Our project was initiated to prepare a water budget for the Dry Creek watershed during a drought and average year and to analyze issues and impacts that may be associated with groundwater withdrawal in the basin. The MCWD and MMSA would like to extract approximately 3.30 x 10⁶ m3 yr-1 (2,685 AFY) of groundwater from the Dry Creek basin; 2.46 x 10⁶ m3 yr-1 (2,000 AFY) to be used by the water district, and 8.5 x 10⁵ m3 yr-1 (685 AFY) for the ski area. The two entities have requested that we use 3.7 x 10⁶ m3 yr-1 (3,000 AFY) in our water budget calculations
3
rather than 3.30 x 10⁶ m3 yr-1 (2,685 AFY), in the event that the MCWD or MMSA would like to increase their usage in the future.
1.1.1 WATER SUPPLY AND DEMAND The Town of Mammoth Lakes� (TML) population is composed of year-round and seasonal residents. Thirty percent (approx. 5,355 persons as of January 2000) of housing in the town is occupied by year-round residences, and is projected to increase to 8,400 residents by build-out of the General Plan (MCWD, 2000). During the winter season, the temporary seasonal population fluctuates, rising to as high as 35,000 people during peak holiday periods (MCWD, 2000). These seasonal population peaks drive water supply concerns in Mammoth Lakes.
1.1.1.1 MCWD During dry years MCWD has had difficulty providing a reliable water supply, and has not been able to fully use their existing surface water rights from Mammoth Creek during years of below normal runoff due to commitments to maintain minimum stream flows and lake levels (USFS, 1994). For 1987-1991, a period of drought, MCWD requested temporary water right permits from the State Water Resources Control Board (SWRCB) for the relief of fishery bypass requirements that ordain mandated water levels in Mammoth Creek, in early summer, allowing this water to be stored and utilized toward the end of the summer (USFS, 1994). In three out of four years MCWD received temporary permits. Since August 28 1991, MCWD has operated under Preliminary Cease and Desist Order No. 9P, which modified fishery flows in Mammoth Creek (USFS, 1994). The MCWD�s current existing annual water supply is estimated to equal 8.1 x 10⁶ m3 (6,534 AF) and is projected to be adequate to supply existing and future needs of the community during normal precipitation years (MCWD, 2000). The current average total annual demand is approximately 3.5 x 10⁶ m3 (2,877 AF) (MCWD, 2000).
To meet future needs for community build-out and provide a reliable source of water during periods of below normal precipitation, MCWD proposes to have four water sources: (each source would be able to deliver approximately 2.46 x 10⁶ m3 yr-1)
��Minimum of 2.46 x 10⁶ m3 yr-1 (2,000 AFY) from surface diversions (from Lake Mary)
��2.46 x 10⁶ m3 yr-1 (2,000 AFY) from wells within the Mammoth Meadow
��2.46 x 10⁶ m3 yr-1 (2,000 AFY) from wells within Dry Creek drainage
��2.46 x 10⁶ m3 yr-1 (2,000 AFY) from a yet to be determined source.
Current district estimates forecast groundwater supplies from 8 production wells in the community to be approximately 4.9 x 10⁶ m3 yr-1 (4,000 AFY) (MCWD, 1998). In practice however, the quantities of water vary from year to year as a result of climatic conditions. As a result, the district uses their own conservative figure of 7.8
4
x 106 m3 yr-1 (6,300 AFY) for planning purposes (MCWD, 2000). MCWD has stated in its 2000 Urban Water Management Plan that groundwater will likely be the only source of additional water supplies for the Mammoth area over the next 15 years. Groundwater supplies are used primarily to augment surface supplies in meeting peak daily demands, as well as providing alternative supplies during years of below average precipitation.
1.1.1.2 MMSA The Mammoth Mountain Ski Area (MMSA) is seeking the right to divert additional water from the headwaters of the Dry Creek watershed for the purposes of snowmaking, irrigation, and recreation. MMSA is a customer of the water district, receiving emergency water supply services during times when the ski area�s normal water sources experience temporary difficulties. The ski area has its own source of potable water supplies from wells developed on United States Forest Service (USFS) lands in the Dry Creek watershed, as well as a spring near the base of the mountain (MCWD, 1998). However, these sources have occasionally experienced temporary supply difficulties. In order to address emergency situations experienced by the ski area�s water system, a temporary water service connection between the district and MMSA was constructed in 1969. Water delivered through this connection enters the ski area�s potable water system and may be used at any location served by the distribution system. Water usage records (1993-1997) for this connection show that annual usage has averaged approximately 4940 m3 (1.30 x 10⁶ gallons). MMSA's current groundwater use from within the Dry Creek drainage is approximately 5.2 x 10⁵ m3 yr-1 (421 AFY). Of that amount, 3.3 x 10⁵ m3 yr-1 (264 AFY) is used for snowmaking, and 1.9 x 10⁵ m3 yr-1 (157 AFY) for domestic and irrigation use. The ski area is looking to increase their use of groundwater in the Dry Creek basin, to 8.5 x 10⁵ m3 yr-1 (685 AFY) to facilitate additional snowmaking, and to alleviate their water demand in times of drought or scarcity.
1.2 RESEARCH QUESTION Our research question is to determine whether the MCWD and MMSA can rely on the Dry Creek watershed as a sustainable water source and provide annually the 3.7 x 10⁶ m3 yr-1 (3,000 AFY) of water they wish to extract.
1.2.1 SCOPE The proposed project goal is to calculate a water budget for the Dry Creek Watershed during a drought and average water year as part of an analysis of the issues and impacts associated with the proposed groundwater withdrawal. In order to achieve the goal, the project has been divided into three components:
��Compilation of all available hydrologic data for the Dry Creek basin and nearby areas.
��Analysis of the hydrogeology of the Dry Creek Basin

5
��Identification of the potentially affected stakeholders, an evaluation of federal, state, and local groundwater rights, and the potential impact on downstream water resources.
1.2.2 IMPORTANCE OF RESEARCH Groundwater has become a major component in appeasing California's increasing water demand. In average years, underground basins supply about 30% of the water used by the state's cities and farms, rising to 60% or higher in drought years (ACWA, 1999). California's rapidly growing population, estimated to reach 40 million by 2010, is placing mounting pressure on the state's water supplies. State officials now predict that California will experience annual shortages of 4.9 x 10⁹ m3 yr-1 (4 MAF), to 7.4 x 10⁹ m3 yr-1 (6 MAF) by 2010 unless steps are taken now to address the declining reliability of the state's water supply system (Agencies, 1999). The amount of water stored in California�s aquifers is far greater than that stored in the State�s surface water reservoirs (approximately 5.5 x 10¹⁰ m3 yr-1 (45 MAF)), although only a portion of California�s groundwater resources can be economically and practically extracted for use (CDWR, 1998). According to the Department of Water Resources' (DWR) draft Bulletin 160-98, about 1.5 x 10¹⁰ m3 yr-1 (12.5 MAF) of groundwater is extracted in average years for agricultural, municipal and industrial use. Most of that is replaced, or "recharged". In average years, about 1.85 x 10¹⁰ m3 yr-1 (1.5 MAF) more is extracted from groundwater basins than is replaced (Agencies, 1999).
During dry years, the MCWD has had considerable difficulties providing a reliable water supply. The increasing growth and development compound this problem. Surface diversions are possible, but during drought years, the amount of water that can be diverted while maintaining minimum instream flows may be limited. The majority of our project�s significance lies in the analysis of the limit for extracting the groundwater such that downstream effects on spring flows and other adjacent basins can be recognized and mitigated.
The competition for water resources between previous allocations and increased development is becoming more complex as is the struggle between environmental concerns and increased development. This is further complicated by the lack of a statewide, comprehensive management system for groundwater use. Without a statewide management plan, it is increasingly more difficult to prevent groundwater overdrafts that can adversely affect aquifers. Further, there is little incentive to store water in groundwater basins by individuals or water agencies if the resource is unregulated. Rights to most of the state's groundwater are not clearly defined, leading to disputes among competing water users and overdrafts in unadjudicated basins. Agricultural interests and urban interests have locked horns over attempts to regulate groundwater pumping. To clarify this problem, legislation, known as AB 3030, was passed in 1992 (ACWA, 1999). Under this law, local entities can voluntarily develop groundwater management plans in unadjudicated basins. Counties can also adopt ordinances to protect groundwater against overdraft from out-of-county exports. Yet the increasing number of water management districts, each with their own

6
groundwater management plans may be making the situation more difficult, than if a singular statewide plan was implemented.
1.3 BRIEF HISTORY OF WATER USE AND DEMAND IN EASTERN SIERRA NEVADA
The Owens River and Mono Lake epitomize environmental water use in the eastern Sierra Nevada. These two water bodies have historically been at the forefront of water supply, demand, and political controversy. The Owens River originates in the mountains south of the Mono Basin and historically terminated in Owens Lake (Appendix A). Local purveyors began diverting water from the Owens River before the turn of the century. Most of these local diversions were bought out by Los Angeles Department of Water and Power (LADWP) to firm up its water rights to divert the Owens River into the Los Angeles Aqueduct, which gradually dried Owens Lake. LADWP began the diversions from the Mono Basin into the Owens River in 1941. It also constructed a series of hydroelectric facilities, which dried a section of the Owens River where it flowed through the Owens River Gorge. Ongoing litigation occurs between Inyo County and LADWP over LADWP's groundwater pumping in the Owens Valley. As part of a settlement agreement, an Environmental Impact Report (EIR) was prepared to discuss environmental impacts of LADWP's water gathering activities in the Owens Valley (CDWR, 1994). However, this issue is still unresolved. Overall, the Owens River has been the subject of some of the most contentious "water wars" in California. Current proceedings may result in some significant changes in the operations of the Owens River, resulting in restoration of flowing water in some sections that have been dry for over 40 years (CDWR, 1994).
Mono Lake lies at the center of the Mono Basin, east of Yosemite National Park at the base of the Sierra Nevada (Appendix A). The lake is one of the oldest in North America and the second largest in California; it is recognized as a valuable scenic, recreational, wildlife, and scientific resource. The lake receives most of its water from precipitation on its surface and runoff from freshwater creeks. However, the lake has no outlet and its salinity has increased over time because of evaporation and stream diversions. With the exception of flood flows, four of the creeks, Lee Vining, Walker, Parker, and Rush, have been diverted to Los Angeles by the LADWP (CDWR, 1994). A system of hydroelectric power plants, canals, tunnels, and reservoirs was constructed to generate electricity and carry the water to the Owens Valley where, together with the Owens River diversions, it is transported to Los Angeles via the Los Angeles Aqueduct. Diversions from the tributaries accelerated an already declining lake level, resulting in a drop of 14 m (45 feet between 1941 and 1982, when the historic low was reached (CDWR, 1994). As a result of the drop in water levels, large areas of the lakebed have become exposed, causing local air quality problems from dust formed by dried alkali silt.
Disagreements over environmental and water rights issues and their impacts on Mono Lake have resulted in litigation involving these allocations, including a lawsuit filed
7
in 1979 by the National Audubon Society, the Mono Lake Committee, and others. In September 1989, the Environmental Water Act of 1989 was signed into law (CDWR, 1994). It authorizes DWR to spend up to a total of $60 million from the Environmental Water Fund for water projects or programs that will benefit the environment (CDWR, 1994). A portion of this total was reserved exclusively for projects that would enhance the Mono Lake environment as well as provide replacement water and power to Los Angeles. In September 1994, the SWRCB issued Decision 1631, which set permanent streamflows for Mono Basin streams and a lake level of 6,392 feet to protect Mono Lake's public trust values, as ordered by the California Supreme Court. The lake�s elevation imparted by the decision is still 7.62 meters (25 feet) below Mono Lake's pre-diversion level of 1,956 meters (6,417 feet), but is expected to restore many lost public trust values and prevent future degradation of resources. Besides protecting Mono Lake's ecosystem, the 1994 decision effectively "forced" the LADWP to consider conservation and reclamation projects to make up for the reduced water in the aqueduct.
The Owens River and Mono Lake are significant recreation areas for the town of Mammoth Lakes, Los Angeles, and other surrounding communities. They also exemplify the intricacy of water rights, the difficulties in transferring water from one region to another, and accordance from the overall political climate. Dry Creek shares many of the same attributes, suggestive of the complexity surrounding extracting groundwater from the Dry Creek basin.
1.4 PREVIOUS RESEARCH DONE ON DRY CREEK There have been a number of studies undertaken to quantify MCWD�s groundwater supplies. However, most of the research has focused on groundwater wells in the Mammoth Creek basin, and not in the Dry Creek basin.
In 1991, Kenneth Heim, an undergraduate student at Cal State University, Fullerton completed a hydrologic study of Big Springs in Mono County (Heim, 1991). Heim mapped the vegetation and hydrogeology of the watersheds surrounding Big Springs and emptying into the Upper Owens River. He analyzed precipitation and runoff records and the water chemistry of samples taken from springs, wells and creeks in this area. Heim tried to estimate the hydrologic interrelationship between Big Springs discharge and the surrounding watersheds. Although he estimated the contributive percentages of Big Springs flow from the surrounding watersheds, he provided no quantitative validation for them.
In 1991, the MCWD commissioned a study to identify the potential bedrock groundwater resources on Deadman Ridge (BCI Geonetics, 1991), which is located to the north of the Dry Creek basin in Mammoth Lakes. The consultants determined that sufficient groundwater might be available on Deadman Ridge, warranting a subsequent test drilling program. Effects on downstream resources from extracting groundwater from this region were not assessed in their report. Pumping tests and

8
monitoring stations were recommended to the district as a future action, but were not implemented.
In 1993, the district initiated a groundwater monitoring program in order to assess the potential hydrologic connectivity between groundwater and surface water within the Mammoth Creek drainage. Well monitoring and aquifer tests were evaluated in an attempt to discern whether groundwater pumping from the district�s new production wells affected flows from North Spring at Valentine Reserve, flows from the Hot Creek headsprings, and stream flows in Mammoth Creek. The study found that no effect was seen on the respective water bodies from the groundwater withdrawal (USFS, 2000).
Another investigation into the effects of local groundwater extraction was undertaken in 1996 for the proposed Snowcreek Golf Course expansion project (USFS, 2000). This study evaluated the potential effects of groundwater pumping expected under the golf course expansion project on the Hot Creek headsprings. The report concluded the headsprings were not affected by the withdrawal, further citing that groundwater levels are too deep to influence stream flows (USFS, 2000).
The 1997 Mammoth-June analysis undertaken by the Forest Service, reviewed the existing and historic water conditions for Mammoth Creek, Dry Creek, Deadman Creek, Glass Creek, and Hartley Springs (USFS, 1997). A Dry Creek water budget, which calculated groundwater recharge utilizing data from 1992, 1993, and 1994, was developed in this study.
While a few studies have concluded that there likely are no interactions between groundwater pumping and surface discharges in the Mammoth Creek watershed, it is unclear how these findings can be extrapolated to groundwater withdrawal from the Dry Creek basin and the possible effects on Big Springs and the Upper Owens River. Chris Farrar of the United States Geological Survey (USGS) (USFS, 2000) has contended that patterns in spring and stream flows may indicate some correlation to groundwater pumping, but that the available data could not definitively distinguish between a change in spring or stream flows due to groundwater pumping or due to natural variation in precipitation. The existing data appear to be inconclusive, and additional information will have to be acquired before any definitive conclusions can be drawn on the interaction between groundwater pumping and surface water resources.
9
Chapter 2 Water Rights The groundwater within the Dry Creek basin is governed at the Federal, State, regional, and local level. There is no comprehensive statewide management plan for regulating groundwater use in the state of California. The only truly universal law governing groundwater pumping is the state constitutional mandate that water not be wasted or used unreasonably (WEF, 1998). Defining groundwater rights in California has never been easy. From a physical standpoint, groundwater is more difficult to observe and quantify than surface water, which discourages government regulations where it is not essential to solving immediate and serious problems. From a political standpoint, the freedom to pump groundwater without restriction, which has been the long-held tradition, has been difficult to alter.
2.1 FEDERAL WATER RIGHTS About 50 % of the water supply in California originates in watersheds within National Forests, and the headwaters of most rivers and streams are found in National Forests (U.S. Dept. of the Interior, 1997). Management of riparian and aquatic resources in the National Forests is guided by Standards and Guidelines found in individual Forest Land and Resource Management Plans (LMRP), as well as national environmental legislation such as the Clean Water Act, the Clean Air Act, and the Endangered Species Act. The Forest Service manages surface and groundwater resources located on the National Forest System to assure adequate supplies of sufficient quality are secured and maintained under Federal and State laws to meet National Forest System resource needs, before making excess water available to private parties for their uses.
Undergroundwater that is not directly tied to a surface flow is owned by the landowner in the state of California. Therefore, the Federal Government owns the groundwater beneath the lands, and thus beneath the Dry Creek drainage. The Inyo National Forest LMRP notes that the Forest Service �provides indirect economic benefit to the public� by making forest lands available for �water production� and other uses. The LMRP allows for development on National Forests System land in the Mammoth Lakes/June Lake area where adequate water is available after natural resource needs are met. It also allows for the exploration and development of new water sources within National Forest System lands for community purposes only when such opportunities have been exhausted on private lands. One stipulation in the LMRP requires that private land sources of water within the Town limits be developed before National Forest Land will be made available for that purpose. In the Mammoth Lakes area, over 45 wells have been drilled since 1976 (USFS, 1994). Only 1 out of 24 wells have produced water of good quality and quantity (USFS, 1994). All other wells either have insufficient water, or poor water quality, and hence the necessity to drill wells on Federal Forest Lands. The Forest Service believes that the MCWD had adequately searched for water sources on private lands (Robertson and Service, 1992), and that it was in the best interests of the community and the
10
Forest Service to allow water extraction from National Forest lands. This resulted in the drilling of the six wells within the Dry Creek drainage.
In May of 1992, and again in 1994, the Inyo National Forest (INF) completed an EA for the Dry Creek Well Project. An EA is an informational document prepared in conformance with the guidelines for implementation of the National Environmental Policy Act (NEPA). It is a document intended to provide decision-makers, public agencies, and the public in general, with detailed and objective information about the potential environmental impacts associated with a proposed project. The EA also serves to identify ways in which potentially significant adverse environmental effects can be minimized or eliminated through the development of project alternatives and mitigation measures. The INF decreed a "Finding of No Significant Impact" (FONSI) for this project, and found that it complied with the Memorandum of Agreement between the water district and Forest Service, as well as with the Best Management Practices (BMPs). BMP control measures are designed to accommodate site-specific conditions, and to account for the complexity and physical and biological variability of the natural environment. However, approval of this environmental document with a FONSI does not signify support for the project. It only indicates that the environmental effects of the project have been fully evaluated under California Environmental Quality Act (CEQA) and NEPA guidelines (MCWD, 1998). Thus, based upon the analysis of the EA, the Forest Service determined that the Dry Creek Well Project was not a major federal action, which would significantly affect the quality of the human environment.
Therefore, an environmental impact statement (EIS) was not needed, per the requirements of NEPA. Their consideration was made based on the following factors:
��All practical means to avoid or minimize environmental impacts through mitigation measures are planned for adoption,
��There are no major adverse cumulative effects,
��There are no known threatened or endangered species being affected,
��There are minimal irreversible resource commitments and irretrievable losses.
Though the Forest Service concludes that this project will not significantly affect the quality of the human environment, our research suggests that a better understanding of the regional hydrology may reveal the extent of potential affects on downstream resources. A more thorough understanding will address the majority of stakeholder concerns, discussed in Chapter 6, more prominently than the Forest Service�s analysis alone.
The State Historical Preservation Officer has also concurred that mitigation measures suggested within the EA would provide protection to the cultural resource within the project area. The Mammoth Water District will still, however, need to obtain a
11
"special-use permit" from the Inyo National Forest. Although the USFS�s EA resulted in a FONSI, the agency never issued a Decision Notice for this project. Thus, the MCWD will need to resubmit a permit application for this project before it is developed.
2.2 CALIFORNIA WATER RIGHTS The SWRCB is responsible for both the allocation of water rights and, through the Regional Water Quality Control Board (RWQCB), for ensuring compliance with State and Federal water quality laws, including the Porter-Cologne Act and the Clean Water Act. In its capacity as permitter and regulator of appropriative water rights, the SWRCB acts as a public trustee of the State's ownership interest in the water. As trustee, the agency must allocate water equitably among potential consumptive uses, while guaranteeing that in-stream public trust resources receive enough residual flow so that they are not impaired. The SWRCB also develops control strategies for pollution sources and management plans. The agency also develops assessment reports, which identify categories of pollution; surface water bodies that will not attain water quality standards without pollution source controls; describes the development of BMPs for control of pollution sources; and reviews existing control programs. The SWRCB and RWQCBs review all proposed activities in the waterways that require Federal grants, licenses, or permits to determine the effect of the proposed action on water quality. Exclusively the SWRCB regulates claims to, and use of, surface water in California.
2.2.1 SURFACE AND GROUNDWATER USE IN CALIFORNIA California operates under a dual system of water rights for surface water, which recognizes both riparian rights, giving landowners rights to waters adjacent to their land, and appropriative rights, those granted by the courts with a �first in time is first in right� deference (CDWR, 1998). The State of California however, is not authorized by the California State Water Code to manage groundwater, and thus does not have a permit process for regulating groundwater use. There are no similar laws or regulations governing use of pumped groundwater except "groundwater confined in clearly defined underground channels." Thus groundwater management can only be accomplished by a judicial adjudication of the respective rights of overlying users and exporters, or by local management of rights to extract and use groundwater as authorized by statute or agreement (CDWR, 1998). Adjudication in this context is when a court of law apportions the available water of a basin amongst its overlying users. A legal action for such an adjudication is usually filed by one of the overlying users to obtain and quantify his legal right to pump a certain amount of water from the basin without being subject to damage claims from other overlying users (Chris Plakos, LADWP, personal communication). Anyone with legal title to a parcel of land overlying an unadjudicated groundwater basin can drill a well and pump as much groundwater as desired without being subject to California Water Law. The legality of, and the right to, conduct such pumping may be the subject of other statutes, but not California Water Law. Most of the groundwater basins in California
12
are not adjudicated: only 16 basins in CA are adjudicated (CDWR, 1996). The Dry Creek basin is not one of these adjudicated basins.
The State of California classifies three legal categories of groundwater: underflow of a surface stream, definite underground streams, and percolating waters. The groundwater held within the Dry Creek basin is considered percolating water. Surface water rights are applied to the first two categories of groundwater, while distinct groundwater laws are applied to percolating waters. In Katz v. Walkinshaw, (1903) 141 Cal. 116, the California Supreme Court rejected the English Common Law system of absolute ownership of groundwater, which had essentially allowed for unregulated pumping of groundwater. California landowners thus had a correlative right to extract as much groundwater as they could for beneficial use (State Bar of California, 1994). The Court has since adopted the rule of �reasonable use of percolating waters�, which pertains to the groundwater extraction beneath the Dry Creek basin. The jurisdiction of the SWRCB to issue permits and licenses for appropriation of undergroundwater is limited by Section 1200 of the California Water Code to �subterranean streams flowing through known and definite channels.� Underground water not flowing in a subterranean stream, such as water percolating through a groundwater basin, is not subject to the SWRCB�s jurisdiction.
The water extracted from the Dry Creek basin would be considered percolating groundwater, and, as such, may be pumped without obtaining a permit from the SWRCB (Anton, SWRCB, et al., 1992). Even if evidence could be provided that showed that the district�s proposed wells would adversely impact the flows in the Upper Owens River, the State Water Board would have relatively little authority to regulate diversions from the proposed wells, as groundwater well owners are not required to obtain permits from the State of California. Therefore, the only jurisdiction that the State Water Board has is under the �reasonableness� aspects of the diversion and use of water (Anton et al., 1992). Thus a finding of �unreasonableness� cannot be justified without sufficient evidence to support a prima facie finding that the proposed diversions are unreasonable (Robertson and Service, 1992).
If the proposed project involves the disturbance of five acres of land or greater, a Notice of Intent to obtain coverage under the National Pollutant Discharge Elimination System (NPDES) General Permit for storm water discharges associated with construction activity must be filed with the SWRCB (Rheiner, 1994).
2.3 REGIONAL WATER RIGHTS On a regional level, groundwater use is governed to ensure compliance with State and Federal water quality laws, which are dictated by the Federal Clean Water Act and California Water Code. The authoritative bodies that govern the quality of Dry Creek groundwater are discussed briefly.
13
2.3.1 AUTHORITATIVE BODIES The State is divided into nine separate regions for the purpose of regionally administrating the State's water quality control program. RWQCB are appointed for each region, and function as agents of the SWRCB and the Environmental Protection Agency (EPA). The role of the RWQCBs is to protect surface and groundwater quality, and the beneficial uses of the waters throughout the region by:
��Issuing waste discharge requirements (permits) regulating the discharge of waste to surface and groundwater;
��Enforcement of waste discharge requirements by the issuance of cease and desist orders, cleanup and abatement orders, administrative civil liability orders, and court action;
��Water quality control planning within the region;
��Surveillance and monitoring to detect new sources of pollution and to ensure that ongoing discharges are in compliance with waste discharge requirements (CDWR, 1998).
The legal requirements and responsibilities of the Regional Boards are found in the Federal Clean Water Act and in the California Water Code. The Federal Clean Water Act (Public Law 92-500, as amended) provides for the delegation of certain responsibilities in water quality control and water quality planning to the states. Where the EPA and the SWRCB have agreed to such delegation, the Regional Boards implement portions of the Clean Water Act, such as the NPDES program and toxic substance control programs. Water quality standards are referenced as objectives and policies listed in the Water Quality Control Plan for each region (CDWR, 1998). CEQA compliance is required prior to all Board actions.
2.3.1.1 CALIFORNIA RWQCB � LAHONTAN REGION The project study area is part of the Lahontan Region, one of the nine Regional Boards administered under the SWRCB. The Lahontan Region covers an area of twelve major watersheds, and over 85,806 km2 (33,130 square miles) extending from the northeastern Oregon-California border to the San Bernardino Mountains on its southern border (CDWR, 1998). The Water Quality Control Plan for this area is organized into three sub-areas: the Tahoe Basin, and the North and South Lahontan Basins, which meet at the boundary between the Mono Lake and East Walker River watersheds. The Dry Creek project study area is located at the northern extent of the South Lahontan Basin.
The Regional Water Quality Control Board (RWQCB), Lahontan Region, reviewed the EA submitted by the Forest Service in 1994, and found that this project did not contain any features which required regulation by the Regional Board (Rheiner, 1994). The RWQCB also found that the proposed implementation and monitoring measures within the EA appear adequate to ensure protection of water quality.
14
However, the MCWD was advised by the Regional Board to adhere to all standards, which are promulgated in the DWR Bulletin 74-81, Water Well Standards: State of California. In the event of dredge or fill activity, which presents the potential for an impact on the waters of the State, an application for water quality certification to the Regional Board would be required. Any work within jurisdictional waters of the United States will require Section 401 Water Quality Certification. Lastly, any work within jurisdictional waters of the United States will require Section 401 Water Quality Certification.
2.4 LOCAL WATER RIGHTS At the local level there has been movement to control groundwater pumping. Under state legislation passed in 1992, local entities may voluntarily develop groundwater management plans in unregulated basins (WEF, 1998). In 1994, a state appellate court upheld the authority of cities and counties to regulate groundwater use. The water rights that define groundwater use by the MCWD and MMSA are discussed below.
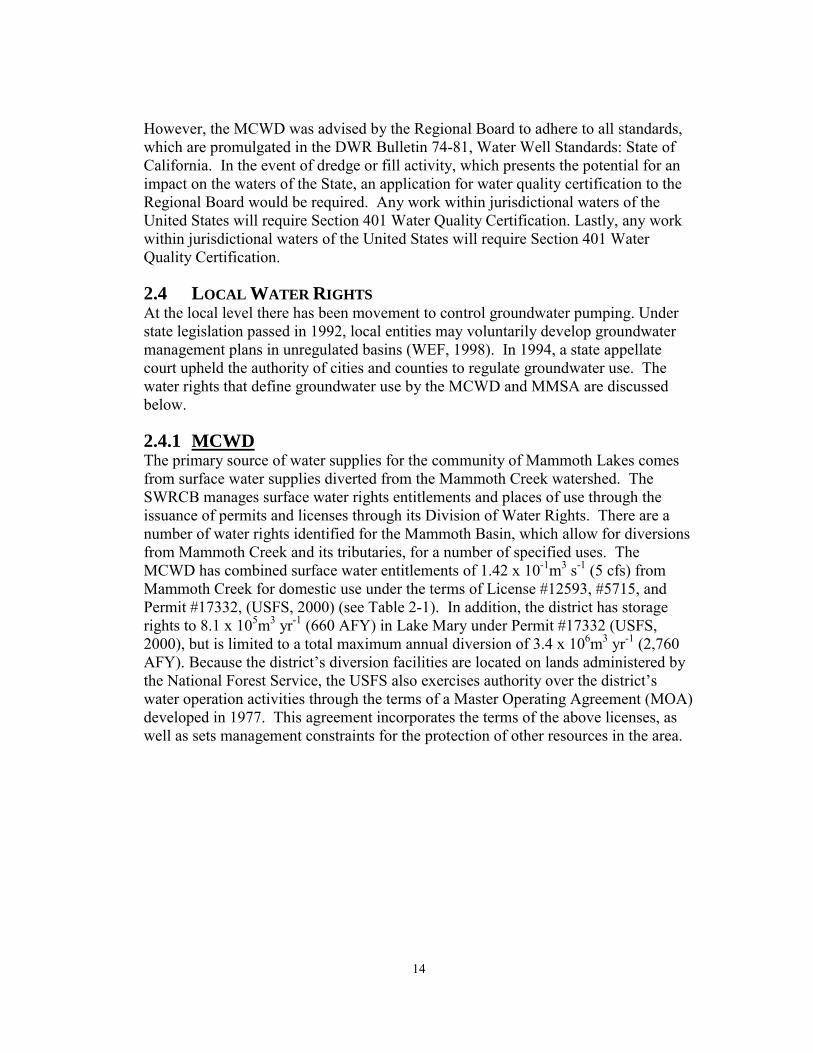
2.4.1 MCWD The primary source of water supplies for the community of Mammoth Lakes comes from surface water supplies diverted from the Mammoth Creek watershed. The SWRCB manages surface water rights entitlements and places of use through the issuance of permits and licenses through its Division of Water Rights. There are a number of water rights identified for the Mammoth Basin, which allow for diversions from Mammoth Creek and its tributaries, for a number of specified uses. The MCWD has combined surface water entitlements of 1.42 x 10⁻¹m3 s-1 (5 cfs) from Mammoth Creek for domestic use under the terms of License #12593, #5715, and Permit #17332, (USFS, 2000) (see Table 2-1). In addition, the district has storage rights to 8.1 x 10⁵m3 yr-1 (660 AFY) in Lake Mary under Permit #17332 (USFS, 2000), but is limited to a total maximum annual diversion of 3.4 x 10⁶m3 yr-1 (2,760 AFY). Because the district�s diversion facilities are located on lands administered by the National Forest Service, the USFS also exercises authority over the district�s water operation activities through the terms of a Master Operating Agreement (MOA) developed in 1977. This agreement incorporates the terms of the above licenses, as well as sets management constraints for the protection of other resources in the area.
15
Table 2-1: Summary of MCWD’s Surface Water Rights
(Source: USFS, 2000) Treated wastewater is currently discharged to Laurel Pond, a pond located approximately 5½ mi. southeast of Mammoth Lakes on U.S. Forest Service land (MCWD, 2000). Disposal occurs at the pond through percolation into the ground and evaporation into the atmosphere. The introduction of groundwater into the MCWD sewer system from the proposed project will result in an increase of sewer flows, and ultimately an increase in the flows available to Laurel Pond. Flows returned to Laurel Pond would meet RWQCB and EPA water quality standards but would contain different chemical concentrations than when removed from the ground (USFS, 1994). In order to maintain the pond as a usable waterfowl habitat setting, the pond elevation discussed in the MOA needs to be agreed upon between the MCWD and the Forest Service (USFS, 1994). As the lead agency under CEQA, the MCWD, after considering the environmental effects of the project, will decide whether to certify the EIR/EIS as adequate under CEQA. Following certification of the EIR/EIS, the district will consider whether or not to approve the project, and if approved, will file a Notice of Determination, after which it will pursue action through the SWRCB on its petitions.
2.4.2 MMSA The Ski Area is seeking the right to divert water from the headwaters of the Dry Creek watershed for the purposes of snowmaking, irrigation, and recreation. The water diverted under this right is intended to supplement the Ski Area�s current well water supply. Snowmaking begins in November to assure skiing on Thanksgiving weekend and the reservoir (mid-chalet pond) fills with well water after the
Permit #
License #
Diversion Season
Diversion Amount
Storage Remarks
7115 5715 May 1 -
Nov. 1 25,000 gpd (0.039 cfs)
-- --
11463 12593 Jan. 1 - Dec.
31 2 cfs -- --
17332 n/a Jan. 1 - Dec.
31 3 cfs District may store
660 AF of water in Lake Mary from April 1 to June 30 and 54 AF from September 1 to September 30.
Maximum allowable diversion is 5.039 cfs. Annual water diversions pursuant to all three water rights must not exceed 2,760 AF.
16
snowmaking season (SWRCB, 1993). During the spring and summer, water will be used from the reservoir for irrigation, and will be replaced with the water requested in Application 30222, as well as with groundwater (SWRCB, 1993). Snow is initially made on the Main Lodge side of the Mountain in the Dry Creek Drainage at the beginning of the ski season, since Dry Creek�s northern exposure is more favorable for snowmaking than the Mammoth Creek side. Snow will continue to be made in the Main Lodge area as long as temperatures are appropriate, and then proceed to the Mammoth Creek side. If temperatures were marginal, they would only make enough to access (and maintain access) the base areas in the Mammoth Creek area and concentrate efforts in the Main Lodge area (Thom Heller, MMSA, personal communication, 2000). The Ski Area currently has authority to extract up to 5.2 x 10⁵ m3 yr-1 (421 AFY) of groundwater per year from existing wells in their permit area. This is for the day-to-day operation of the ski area, including 3.2 x 10⁵ m3 yr-1 (264 AFY) for snowmaking. The Ski Area is requesting an increase in the extraction to 8.5 x 10⁵ m3 yr-1 (685 AFY), most of which would be to facilitate additional snowmaking. Since most of the water being requested will be used in the Dry Creek drainage, the majority of that water will percolate down to the groundwater system and recharge the aquifer. Some of the extracted water will be used for snowmaking within the Mammoth Creek drainage; therefore some will be lost from the Dry Creek watershed.
17
Chapter 3 Dry Creek Basin Overview The Dry Creek area is a 66 km2 (25.6 mi2) montane catchment located approximately 1.5 km northwest of the town of Mammoth Lakes, California, in the INF. The northeast-trending elongate basin is situated on the eastern side of the Sierra Nevada crest and extends from Mammoth Mountain at its southernmost tip at an elevation of 3,371 m to the Owens River (2,170 m). The Dry Creek watershed is part of the upper Owens River watershed.
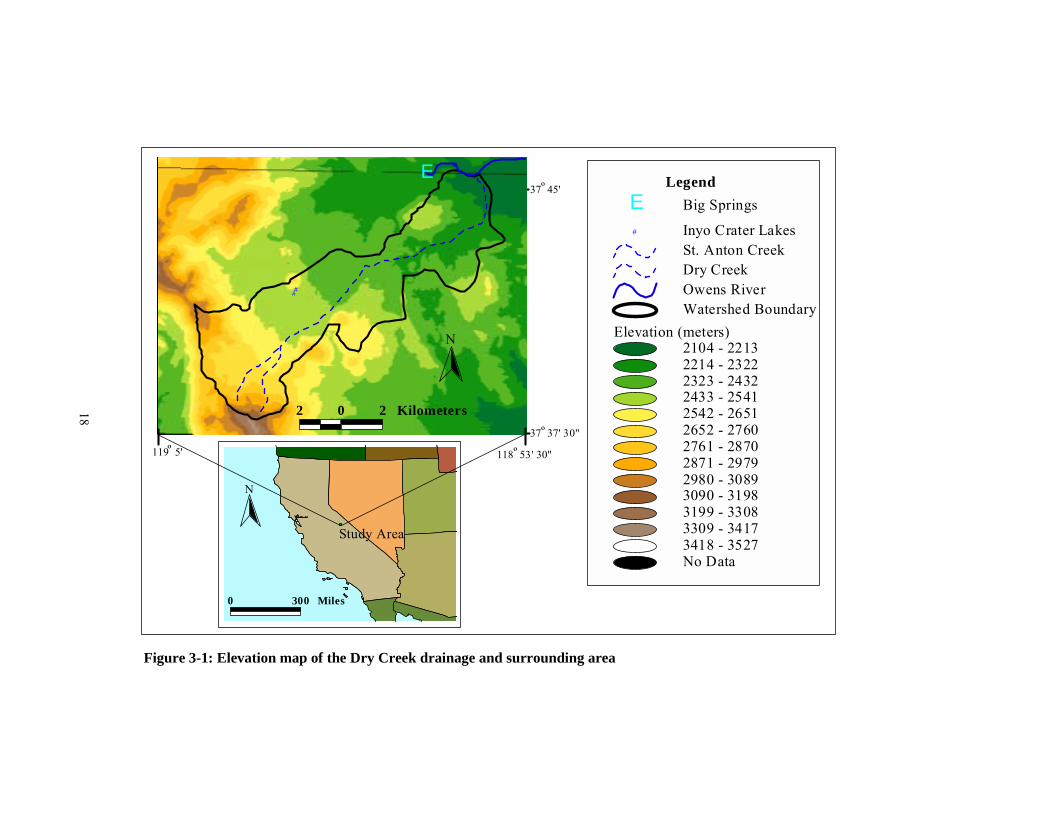
3.1 WATERSHED DELINEATION For the purposes of our analysis, we define the watershed as the area of land that is drained of surface water at a single outlet. The watershed boundaries are therefore, the topographical divides, defined by the surface water runoff (Figure 3-1). Streamflow in the Dry Creek watershed historically does not leave the basin, however flow entered the Owens River twice in the past 32 years (Tim Alpers, and Thom Heller, MMSA, personal communication, 2000).
The Dry Creek watershed begins at an elevation of 3,371 m at the peak of Mammoth Mountain, and extends northeast to the Dry Creek and Owens River confluence at an elevation of 2,170 m. Much of this approximate 1,200 meter basin-wide change in elevation occurs on the southwest side of the watershed where Mammoth Mountain and San Joaquin Ridge are located; the steep northeast facing area is where the majority of the watershed�s precipitation and groundwater recharge occurs.
3.2 SURFACE WATER Surface water in the watershed primarily exists as snow, which melts and directly infiltrates into the substrata. The runoff associated with the snowmelt is typically quite small, and is considered negligible in our water budget for the Dry Creek basin. The creeks in the basin are ephemeral with most of the water eventually percolating into the soil or evaporating, with the exception of two years in which flow was observed at the Owens River.
3.2.1 CREEK AND SPRING DESCRIPTION Dry Creek is approximately 18.5 km in length from its headwaters on Mammoth Mountain to the Owens River confluence. Dry Creek and its smaller tributary to the west, St. Anton Creek, drain the 66 km2 Dry Creek watershed. St. Anton Creek flows from the northwest slopes of Mammoth Mountain northeast for 3.7 km until it empties into Dry Creek.
Dry Creek is an ephemeral creek fed by snowmelt and spring flow from shallow perched aquifers during the snowmelt season. Dry Creek typically flows from June to August, depending upon the total precipitation in the basin.
18
E
##
2 0 2 Kilometers
N
Study Area
N
0 300 Miles
Big SpringsEInyo Crater Lakes#
St. Anton CreekDry CreekOwens RiverWatershed Boundary
Elevation (meters)2104 - 22132214 - 23222323 - 24322433 - 25412542 - 26512652 - 27602761 - 28702871 - 29792980 - 30893090 - 31983199 - 33083309 - 34173418 - 3527No Data
Legend
37 37' 30"º
37 45'º
118 53' 30"119 5' ºº
Figure 3-1: Elevation map of the Dry Creek drainage and surrounding area

19
3.2.2 SURFACE STORAGE Several surface water storage lakes or ponds exist within the basin. However, the cumulative surface area of these surface water storages is small in comparison to the overall watershed, and losses due to evaporation are considered negligible.
3.2.2.1 MID-CHALET There is a storage pond located on MMSA property located approximately 40 m south of the Mammoth Mountain Meteorological Site (MMMS), operated by University of California, Sierra Nevada Aquatic Research Laboratory (SNARL). The Pond has a surface area of 169,000 m2 with a storage capacity of 79,000 m3 and is fed by 95,000 m3 yr -1 of groundwater pumped nearby and diverted into the pond.
3.2.2.2 SILT POND A sediment retention basin is located at an elevation of 2760 m on the northwest slope of Mammoth Mountain. This depression, called Lost Lake by MMSA, is both fed and drained by St. Anton Creek, which helps reduce sediment loading from ski area erosion to Dry Creek. The surface area of the Lost Lake is approximately 2,600 m2.
3.2.2.3 INYO CRATER LAKES There are two 30-60 m (100-200 ft) deep craters in the basin, which partially fill with snowmelt and rainfall. Their formation was part of the Mono-Inyo Craters volcanic chain just south of Deer Mountain. Because of their small surface area and size, they are not incorporated into our water balance study.
3.3 VEGETATION The pumiceous soils in the watershed support a variety of tree species as well as shrubs and grasses. The most dominant tree in the upper half of the watershed is Lodgepole Pine (Pinus contorta). Jeffery Pine (Pinus jeffreyi), Red Fir (Abies procera), and Quaking Aspen (Populus tremuloides) comprise the rest of the upper half of the forested land. Sagebrush (Artemesia tridenta) and perennial grasses can also be found in sparse forests, and in clearings.
The lower half of the watershed is covered almost entirely by forests of Jeffery Pine with some larger areas of grasses and shrubs (Figure 3-2). There are also Red Fir, Lodgepole, sagebrush, and perennial grasses. Red Fir is mostly found on basalt domes like Lookout and Deer Mountains.
3.4 GEOLOGY – LONG VALLEY The basin contains the Inyo portion of what is known as the Mono-Inyo Craters volcanic chain. This linear volcanic complex of late Tertiary to Quaternary domes and craters extends from the north at Mono Lake to Mammoth Mountain at its southern end. Mammoth Mountain is a composite volcano that formed from approximately 20 different quartz latitic, rhyolitic, and andesitic eruptive events

20
between 256 to 52 thousand years ago with a collective lava flow thickness of 800 m (Bailey, 1989). Other prominent features within the Dry Creek watershed are the Inyo Domes and Inyo Crater Lakes. The north-south trending Mono-Inyo Crater volcanic chain is associated with the north striking fault system of the Sierra Nevada frontal fault escarpment. The Inyo Craters formed after underlying magma superheated the circulating groundwater. The vaporized water expanded to cause explosions creating the craters, which have since partially filled with water to form the Inyo Crater Lakes.
Most of the exposed surface geology is comprised of basalt, welded tuff, and obsidian originating from the numerous eruptive events associated with the Inyo Crater chain
(USGS website, 2001)
Figure 3-2 View of the Dry Creek basin from Mammoth Mountain looking northeast 3.4.1 FAULTING The Dry Creek watershed contains several faults associated with the Long Valley Caldera. Ring fractures radiating from the caldera center are a regional feature, as well as north-south trending normal faults, which are part of the Sierra Nevada frontal fault escarpment. These faults have the ability to serve as vertical conduits for groundwater flow to aquifers. Studies on the watershed and the larger region have

21
found a large tongue of cool water under the basin, which could be a source of water to the groundwater pumping zones (Mike Sorey USGS, personal communication).
3.4.2 SOILS The uppermost elevations in the watershed, comprising approximately 15% of the total basin, have little if any soil or material able to support vegetation. Rock outcrop, colluvium, and talus, span from Mammoth Mountain peak, down to elevations of approximately 2900 m. The soils within the Dry Creek basin are described as draining �somewhat excessively� (USDA Forest Service, 1995). These high rates allows for the majority of snowmelt to percolate through the soil column into the underlying fractured groundwater system.
3.5 GROUNDWATER The watershed�s groundwater is located in several systems. The shallowest water can be found in several upper permeable units on Mammoth Mountain. Wells located on the upper north and northwest sides of Mammoth Mountain provide MMSA with approximately 511,136 m3 yr -1 (421 AFY) of water, roughly 75% of which is used for snowmaking or irrigation within the watershed. One well on the mountain has groundwater head levels at a depth of 5 m, which obtains water from a localized perched zone. A spring flows next to the well, indicating that some of the groundwater is intercepted from the deeper recharge in the upper reaches of the watershed to contribute to spring flow. This ephemeral spring forms the headwaters of St. Anton Creek.
The majority of the underlying rocks in the watershed are extrusive igneous rocks ranging from basaltic to ryolitic in composition. These units are fairly impermeable when not fractured. However, fractured zones can serve as vertical conduits for large amounts of water to enter the groundwater system and flow through the horizontal permeable or fractured layers. In the proposed well field area, the fractured units, which serve as aquifers, are located at depths of 150 m (500 ft) below ground. The geometry of these aquifers is controlled by the shape and extent of the fractured zones from the lava flows, which stores the groundwater. The highly irregular aquifer geometry due to lava flows coupled with the heterogeneity of the fractured zones within these flows, adds to the complexity of the groundwater system.
Deeper circulation of waters is also common in the region due to volcanic activity. The hydrothermal system of the Long Valley Caldera supports three binary geothermal power plants in the region. The connectivity between this regional deeper circulating water body and the groundwater system within Dry Creek watershed are unknown.
3.6 RELEVANCE/CONCERNS The main concern of the proposed project is the ability of the watershed to sustain pumping at rates necessary for the TML and MMSA long-term use during drought
22
years. The proposal is for the Dry Creek watershed to be an alternate water source, providing Mammoth Lakes with 3.7 x 10⁶ m3 yr �1 (3000 AFY) of water, most of which is to be used in the Mammoth Creek watershed to the immediate southeast by the TML, with a portion going to use in the Dry Creek watershed by the MMSA. Both watersheds drain into the Owens River; Mammoth Creek supplies a yearly discharge into the Owens River, while Dry Creek discharges into the Owens River very rarely.
Big Springs, located directly north of the Dry Creek watershed, contributes to the Owens River flow. An estimate of the percent of Big Springs flow contributed by the Dry Creek basin has been attempted (Heim, 1991), but this conclusion is difficult to verify given the complexity of the groundwater system. Big Springs, located outside the Long Valley Caldera ring fracture system, but within the caldera drainage boundary, has three potential water sources (USFS, 1994). Spring flow could originate from precipitation in drainages outside or within the caldera ring fracture system. Water originating outside the caldera ring fracture system could flow down gradient until it reaches the ring fracture zone. Water could then flow along the fractures until resurfacing at Big Springs. Precipitation in drainages within the western ring fracture system could flow down gradient in rhyolite and basalt fracture zones that intersect the fracture system. Water could then migrate along the ring fractures to Big Springs. Precipitation recharging land intercepted by the ring fractures could flow along the ring fractures, eventually feeding Big Springs. Water could then be diverted via the fracture system to Big Springs (USFS, 1994).
23
Chapter 4 Water Balance 4.1 WATER BALANCE METHODOLOGIES There are three models commonly used for the estimation of groundwater recharge from precipitation: inflow, aquifer response, and outflow (Johansson, 1988). We used the inflow model in this report. It assumes a one dimensional water flow, calculating groundwater recharge from direct measurements of precipitation by assuming that water flows vertically through the vadose zone into the groundwater.
The total groundwater recharge, assumed to be the maximum volume available for groundwater extraction in the Dry Creek watershed, was estimated based on an inflow water balance equation for the drainage basin. This method was chosen because of the data currently available and watershed characteristics. There are two main assumptions involved in our use of this method:
��Groundwater recharge is equal to the total precipitation minus evapotranspiration.
��The quantity of water suitable for groundwater extraction should not be greater than the annual recharge in the basin.
The first assumption neglects changes in the watershed�s surface storage. The surface area of the water bodies located in the Dry Creek basin is less than one percent of the entire watershed, and is therefore considered a negligible component of the water balance. The second assumption indicates that groundwater levels in the basin are at least in part dependent upon the total groundwater recharge to the system. This implies that an extraction of groundwater in excess of the total recharge would decrease the water table levels and prove to be unsustainable. This is tantamount to saying that long-term recharge of the watershed�s groundwater system equals groundwater discharge from the basin, be it spring flow, groundwater pumping, or groundwater flow leaving the basin.
4.1.1 WATER BALANCE EQUATION The water balance equation for the watershed is:
∈±−−=∆ UETPPR
Where ∆PR is the potential recharge to groundwater. P is the precipitation, which is comprised of snow water equivalence (SWE) and rainfall. ET is the evapotranspiration, which is the sum of the basin-wide evaporation and transpiration. U is the consumptive use of water within the watershed. Epsilon represents the sum of the errors associated with the estimation of the variables.
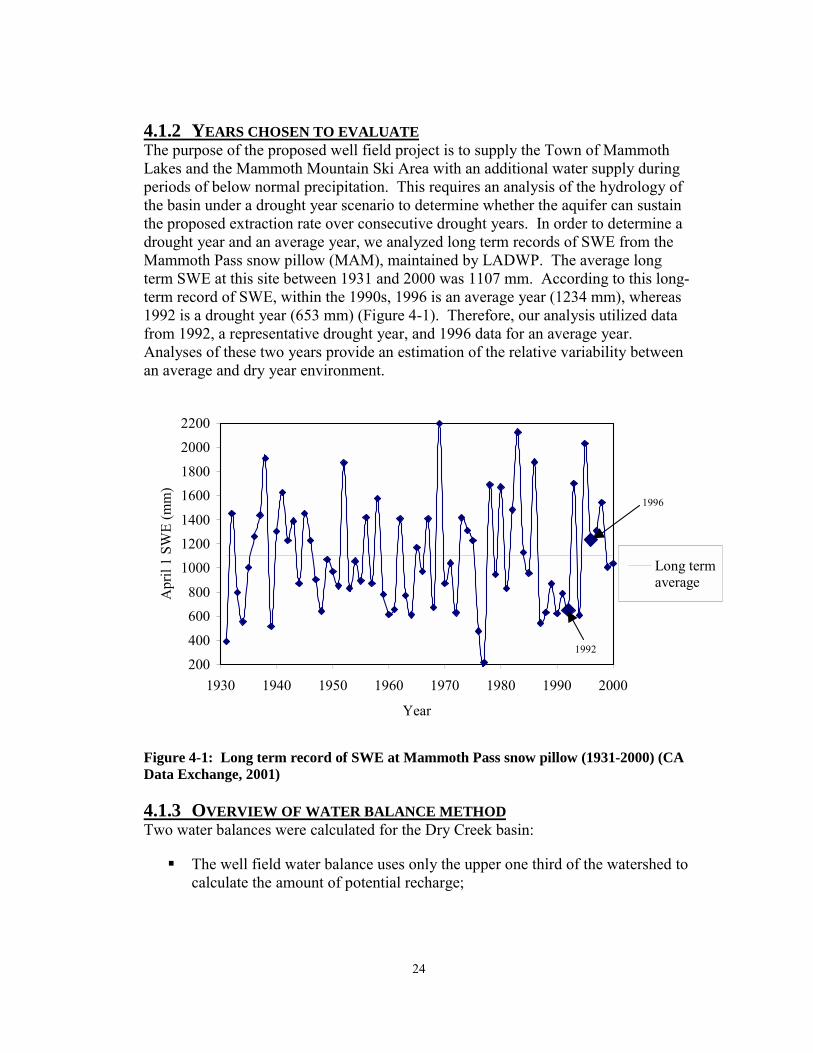
24
4.1.2 YEARS CHOSEN TO EVALUATE The purpose of the proposed well field project is to supply the Town of Mammoth Lakes and the Mammoth Mountain Ski Area with an additional water supply during periods of below normal precipitation. This requires an analysis of the hydrology of the basin under a drought year scenario to determine whether the aquifer can sustain the proposed extraction rate over consecutive drought years. In order to determine a drought year and an average year, we analyzed long term records of SWE from the Mammoth Pass snow pillow (MAM), maintained by LADWP. The average long term SWE at this site between 1931 and 2000 was 1107 mm. According to this long-term record of SWE, within the 1990s, 1996 is an average year (1234 mm), whereas 1992 is a drought year (653 mm) (Figure 4-1). Therefore, our analysis utilized data from 1992, a representative drought year, and 1996 data for an average year. Analyses of these two years provide an estimation of the relative variability between an average and dry year environment.
200
400
600
800
1000
1200
1400
1600
1800
2000
2200
1930 1940 1950 1960 1970 1980 1990 2000
Year
Apr
il 1
SWE
(mm
)
Long termaverage
1992
1996
Figure 4-1: Long term record of SWE at Mammoth Pass snow pillow (1931-2000) (CA Data Exchange, 2001) 4.1.3 OVERVIEW OF WATER BALANCE METHOD Two water balances were calculated for the Dry Creek basin:
��The well field water balance uses only the upper one third of the watershed to calculate the amount of potential recharge;

25
��The basin water balance incorporates the entire topographical watershed into the water balance.
The well field water balance utilizes the upper 22 km2 of the watershed, which represents the source of recharge for the well field (Figure 4-2). The well field water balance assumes that the amount of potential recharge within the upper one-third of the watershed is equal to the quantity of water available for extraction.
The basin water balance incorporates the entire topographical watershed, in order to determine the amount of groundwater recharge to the entire basin (Figure 4-2). This basin water balance was undertaken to develop a better understanding of how downstream resources may be affected by the proposed groundwater extraction within Dry Creek. A further discussion of the concerns regarding downstream impacts are developed in Chapter 6, and later analyzed in Chapter 7 according to our water balance results.
In order to determine the overall water balance of the Dry Creek watershed, a standard methodology of calculating the potential recharge was used by comparing the amount of inflow to the amount of outflow within the system. Each component of the water budget was calculated according to the data currently available. The total amount of inflow is equal to the amount of precipitation, which was subdivided into, rain and SWE. The outflow is equal to the amount of consumptive use and evapotranspiration.
Precipitation from April 1 to September 30 was determined by rain gauges within or near the basin. Since there are only two rain gauges within the basin, the watershed was delineated into two zones, an upper and lower rainfall zone (Figure 4-3), with one gauge in each zone. In order to calculate the total amount of annual rainfall within each zone, a singular annual value was extrapolated over the entire rainfall zone; the sum of the two zones determined the total rainfall within the basin.
Snow provides the majority of the precipitation within the basin, which is measured as SWE, the amount of water within the snowpack. The SWE was calculated by sectioning the basin into 7 different SWE zones. The zones were delineated based upon the distribution of SWE measurements, aspect, and elevation (Figure 4-4). There were eight different SWE measurement sites within the basin that were used to identify areas of similar SWE (Table 4-1). A value for SWE was determined for each zone, which was extrapolated over the entire zone; the sum of all seven zones determined the total precipitation due to SWE within the basin.
The outflows of the water balance consist of evapotranspiration and consumptive use. The loss from evapotranspiration consists of a combination of evaporation and transpiration. The well field region consists of areas that have little vegetative cover. Therefore there are areas where only evaporation occurs and areas where evapotranspiration occurs. The evaporation zone is the area where there is little

26
vegetative cover, with minimal loss from transpiration. Conversely, the remainder of the basin loses water through a combination of evaporation and transpiration, the evapotranspiration zone. We used literature values to estimate the water loss from evaporation and evapotranspiration for each respective zone (Figure 4-5). The representative evaporation and evapotranspiration values were extrapolated over their respective zones, and aggregated to get an estimate of the total water loss due to evapotranspiration. The water loss due to consumptive use was provided by the MMSA.
The values of the water balance were calculated and extrapolated over a wide area; therefore, there was a significant amount of uncertainty associated with each term in the water balance equation. The results of the water balance (Chapter 5) calculated a range of potential recharge. The greatest assumption with this water budget is that the potential recharge directly recharges the groundwater system. Therefore, in order to calculate the amount of recharge to the well fields, only the upper portion of the watershed was analyzed. The basin water balance results, as opposed to the well field balance results, become significant when we attempt to assess how this extraction may impact downstream resources in Chapter 7.2.2.
4.2 SURFACE WATER HYDROLOGY This section focuses on the methodology for calculation of annual precipitation, evaporation, and evapotranspiration for the Dry Creek watershed. Within each component of the water budget, a full description of the available data is provided as well as an explanation of our methodology. The level of uncertainty associated with each component of the water balance is addressed within this section. Results of the water budget are discussed in Chapter 5.
4.2.1 PRECIPITATION- RAIN Any precipitation that is captured in a gauge between April 1 and September 30 is considered rain, which may include both rain and snow. In order to calculate precipitation from rainfall within the basin, two rainfall zones (upper zone and lower zone) were identified (Figure 4-3). We utilized the gauges within our basin to determine the rainfall for each rainfall zone for 1992 and 1996; sparse data in 1992 forced us to interpret data from a gauge outside of the basin. The annual precipitation for each year and zone was extrapolated to determine the amount of total precipitation for the watershed.
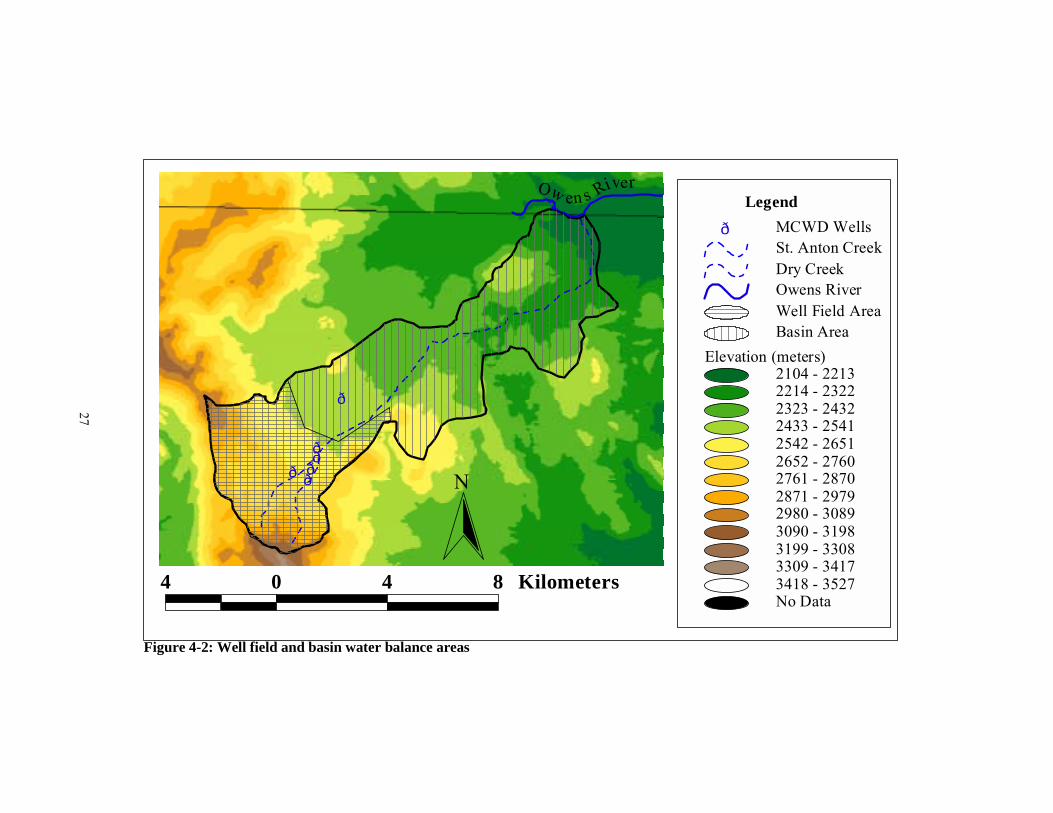
27
Figure 4-2: Well field and basin water balance areas
ð
ððð
ð
ð
Ow en s River
4 0 4 8 Kilometers
N
MCWD WellsðSt. Anton CreekDry CreekOwens RiverWell Field AreaBasin Area
Elevation (meters)2104 - 22132214 - 23222323 - 24322433 - 25412542 - 26512652 - 27602761 - 28702871 - 29792980 - 30893090 - 31983199 - 33083309 - 34173418 - 3527No Data
Legend
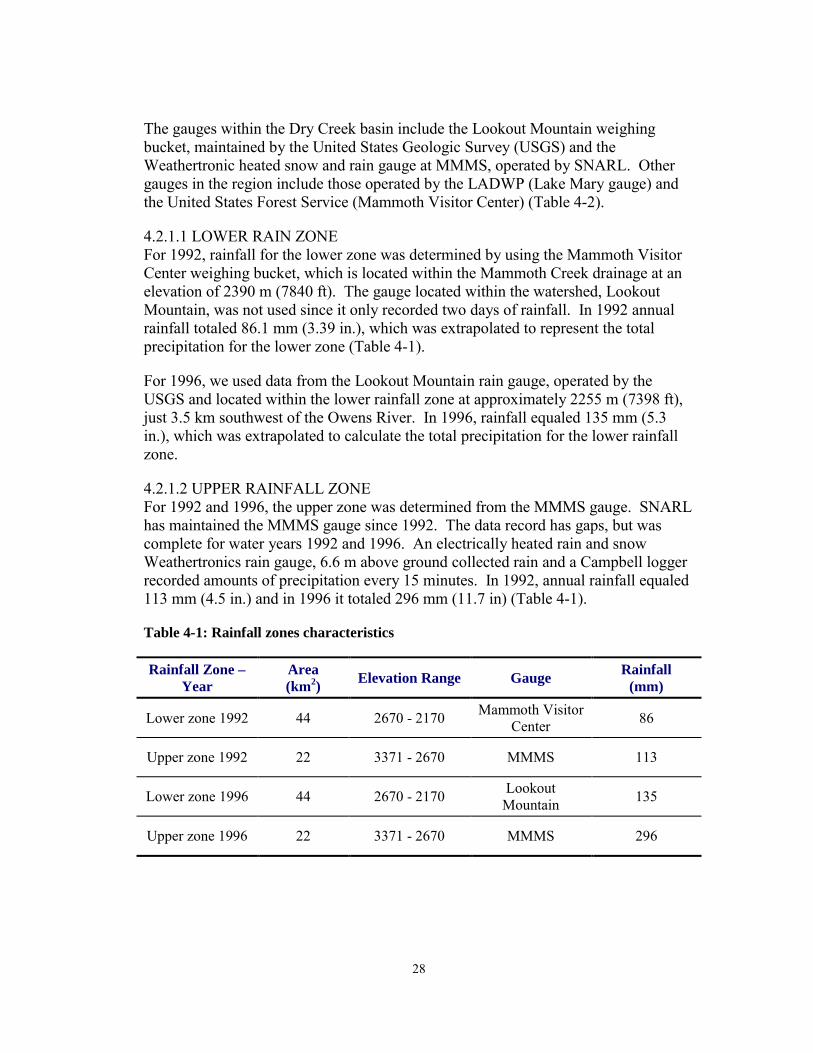
28
The gauges within the Dry Creek basin include the Lookout Mountain weighing bucket, maintained by the United States Geologic Survey (USGS) and the Weathertronic heated snow and rain gauge at MMMS, operated by SNARL. Other gauges in the region include those operated by the LADWP (Lake Mary gauge) and the United States Forest Service (Mammoth Visitor Center) (Table 4-2).
4.2.1.1 LOWER RAIN ZONE For 1992, rainfall for the lower zone was determined by using the Mammoth Visitor Center weighing bucket, which is located within the Mammoth Creek drainage at an elevation of 2390 m (7840 ft). The gauge located within the watershed, Lookout Mountain, was not used since it only recorded two days of rainfall. In 1992 annual rainfall totaled 86.1 mm (3.39 in.), which was extrapolated to represent the total precipitation for the lower zone (Table 4-1).
For 1996, we used data from the Lookout Mountain rain gauge, operated by the USGS and located within the lower rainfall zone at approximately 2255 m (7398 ft), just 3.5 km southwest of the Owens River. In 1996, rainfall equaled 135 mm (5.3 in.), which was extrapolated to calculate the total precipitation for the lower rainfall zone.
4.2.1.2 UPPER RAINFALL ZONE For 1992 and 1996, the upper zone was determined from the MMMS gauge. SNARL has maintained the MMMS gauge since 1992. The data record has gaps, but was complete for water years 1992 and 1996. An electrically heated rain and snow Weathertronics rain gauge, 6.6 m above ground collected rain and a Campbell logger recorded amounts of precipitation every 15 minutes. In 1992, annual rainfall equaled 113 mm (4.5 in.) and in 1996 it totaled 296 mm (11.7 in) (Table 4-1).
Table 4-1: Rainfall zones characteristics
Rainfall Zone – Year
Area (km2) Elevation Range Gauge Rainfall
(mm)
Lower zone 1992 44 2670 - 2170 Mammoth Visitor Center 86
Upper zone 1992 22 3371 - 2670 MMMS 113
Lower zone 1996 44 2670 - 2170 Lookout Mountain 135
Upper zone 1996 22 3371 - 2670 MMMS 296
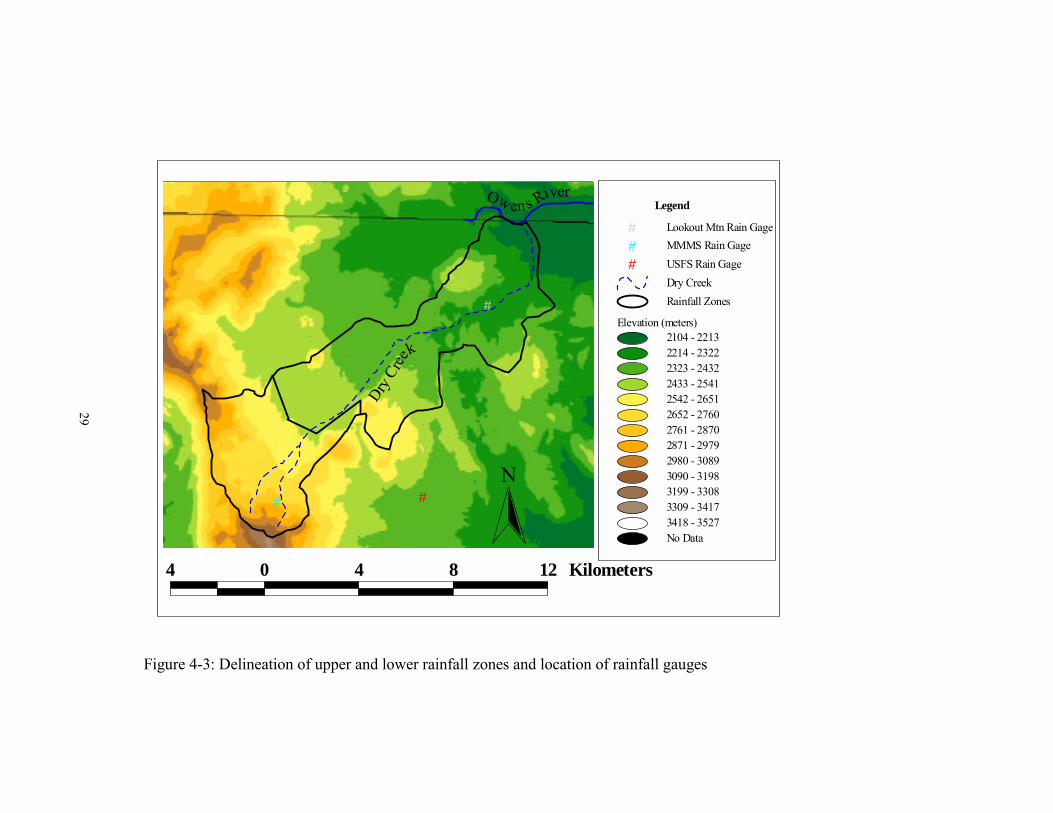
29
# #
#
Ow ens River
Dry Cree
k
4 0 4 8 12 Kilometers
N
Lookout Mtn Rain Gage#MMMS Rain Gage#USFS Rain Gage#
Dry CreekRainfall Zones
Elevation (meters)2104 - 22132214 - 23222323 - 24322433 - 25412542 - 26512652 - 27602761 - 28702871 - 29792980 - 30893090 - 31983199 - 33083309 - 34173418 - 3527No Data
Legend
Figure 4-3: Delineation of upper and lower rainfall zones and location of rainfall gauges

30
4.2.1.3 RAINFALL UNCERTAINTY Rainfall uncertainty may be due to measurement error and spatial variability. Instrumental error can account up to 5 percent of total error and 20 percent for gauges without windshields (Winter, 1981). Winter (1981) indicates an error of 20 percent for gauge density for a level landscape. The uncertainty associated with gauge density increases in mountainous regions where there are few rain gauges. Therefore, we assume that the uncertainty associated with gauge density is equal to approximately 50 percent within the Dry Creek basin. Given the high spatial variability of precipitation in mountainous terrain and the scarcity of rain gauges within the watershed, we aggregated the levels of uncertainty associated with rainfall, and determined the level of uncertainty to be 75 percent.
Table 4-2: Rain gauges in Mammoth Lakes, CA
Station Name Management Agency Drainage Gauge Elevation
(m)
Lake Mary Precipitation
Gauge LADWP Mammoth
Creek 30� cap. Belfort gauge 2723
Lookout Mountain USGS Dry Creek Weighing Bucket 2220
MMMS SNARL Dry Creek Weathertronics
electrically-heated rain and snow rain gauge
2930
Mammoth Visitor Center USFS Mammoth
Creek Weighing Bucket 2390
SNARL SNARL Mammoth Creek
Weathertronics heated tipping bucket with
shield 2160
4.2.1 PRECIPITATION - SNOW WATER EQUIVALENT Snow provides the majority of the precipitation within the watershed. SWE sites measure the height of snow on the ground April 1, which represents the peak SWE for the water year. The April 1 survey takes into account any evaporative loss that occurs before the April 1 measurement. SWE was calculated by sectioning the basin into 7 different zones, which were delineated based upon the distribution of SWE measurements, aspect, and elevation (Figure 4-4).

31
SWE, measured in mm, can be calculated using the following equation:
��
���
� ×w
s
ρdρ
where,
ρs = density of snow in kg m-3 d = depth of snow in m ρw = density of water in1000 kg m-3 Density pits and snow courses were used to estimate SWE for the Dry Creek. SNARL researchers utilize density pits, and the INF, LADWP, and Snow Survey Associates (SSA) conduct snow surveys (snow courses) (Table 4-4).
Since 1991, SWE has been measured at MMMS using density pits. The density pit method averages the density of multiple samples, which when multiplied by the depth of the pit, provides the SWE value. Between 1991 and 1996, scientists excavated density pits (McClung and Schaerer, 1993) at two locations within the MMMS site approximately 30 m apart.
Three agencies operate seven snow courses in the Dry Creek Watershed. The snow courses are usually situated in areas shielded from the wind (USACE, 1956). Generally, they are located in flat open areas, which are representative of snowpack conditions of the region. The snow surveyor walks a 305 m (1,000 ft.) long transect taking between five and ten measurements with a Mt. Rose snow tube. The snow surveyor inserts the tube into the snow until it reaches the bottom of the pack, records the snow depth, weighs it, and records the water content in inches (CDWR, 2001).
Each agency or organization measured SWE differently and at different time intervals. DWR recognizes the April 1 SWE measurement as the benchmark date for forecasting state water supplies, which represents the average date of peak SWE, the end of the snow accumulation season and the beginning of the snowmelt season (Serreze et al., 1999). However, the Sierra Nevada has been known to receive substantial snowfall after April 1, which is not captured in the measurements. For 1992 and 1996, the measurement dates for SWE were taken between February and mid-April, in an attempt to capture peak SWE.
4.2.2.1 SWE ZONE 1 Zone 1, located in the uppermost portion of the watershed with an area of 7.4 km2, uses SWE measured at MMMS as the representative amount of SWE for this area (Figure 4-4). This site measures SWE in snow pits located on the north slope of Mammoth Mountain at an elevation of 2940 m (9645 ft) near the headwaters of Dry Creek.

32
For 1992, density snow pit measurements were gathered from snow pits between March and April. The greatest SWE measurement was collected on April 8, 1992, which represents the peak SWE for this zone 890 mm (35 in); this value was extrapolated over the entire zone to represent precipitation from snow.
For 1996, an average of two density pit measurements collected in early April were used to calculate the peak SWE. The averaged 1996 measurement equaled 1250 mm (49 in), which was extrapolated over the entire zone.
The variability between the pits represents the heterogeneity associated with SWE on a small scale. The density from the two snow pits ranges from 370 kg m-3 to 410 kg m-3, and the pits differed by approximately 2 m in depth. The transport of snow by wind explains the variation in snow depth (R. Kattelmann, SNARL, personal communication, 2001).
4.2.2.2 SWE ZONE 2 A snow course method was used to estimate SWE in zone 2, located on the east side of San Joaquin Ridge, at an elevation of 3075 m (10,150 ft) and an area of 6.3 km2. The snow course is on an east to southeast facing slope, vegetated by �scattered stands of Whitebark Pine (Pinus albicaulis)� (S. Burak SSA, personal communication, 2000).
Sue Burak, a consultant with SSA, measured SWE with the snow course method. SSA maintained snow courses from December 1988 to April 1995 at San Joaquin Ridge (Table 4-4). SWE varied up to 50% between sample points due to the redistribution of snow at this site.
For 1992, the San Joaquin Ridge snow course survey recorded a total SWE of 729 mm (28.7 in.) with an average depth of 1.7 m (69.3 in.) in March. This SWE value fluctuated between February and May, resulting in a pattern of decreasing snow depth and increasing density as the season progressed. It appears the maximum snow depth may have been reached in February and the highest measured density in May (Appendix B). However, the March survey appears to have captured peak SWE, despite not recording the highest snow depths or densities.
No measurements were taken for the year 1996; therefore a linear regression was run for this site based upon the SWE measurements from Minarets 2, Mammoth (MMT), and the Mammoth Pass snow pillow. The regression against the Mammoth Pass snow pillow, which predicted 1996 SWE at San Joaquin Ridge to be 800 mm (31.5 in) generated the highest R2 of 0.86, giving the best statistical significance (Figure 4-5). From our regression, we took the SWE value of 800 mm to calculate the total SWE in Zone 2.
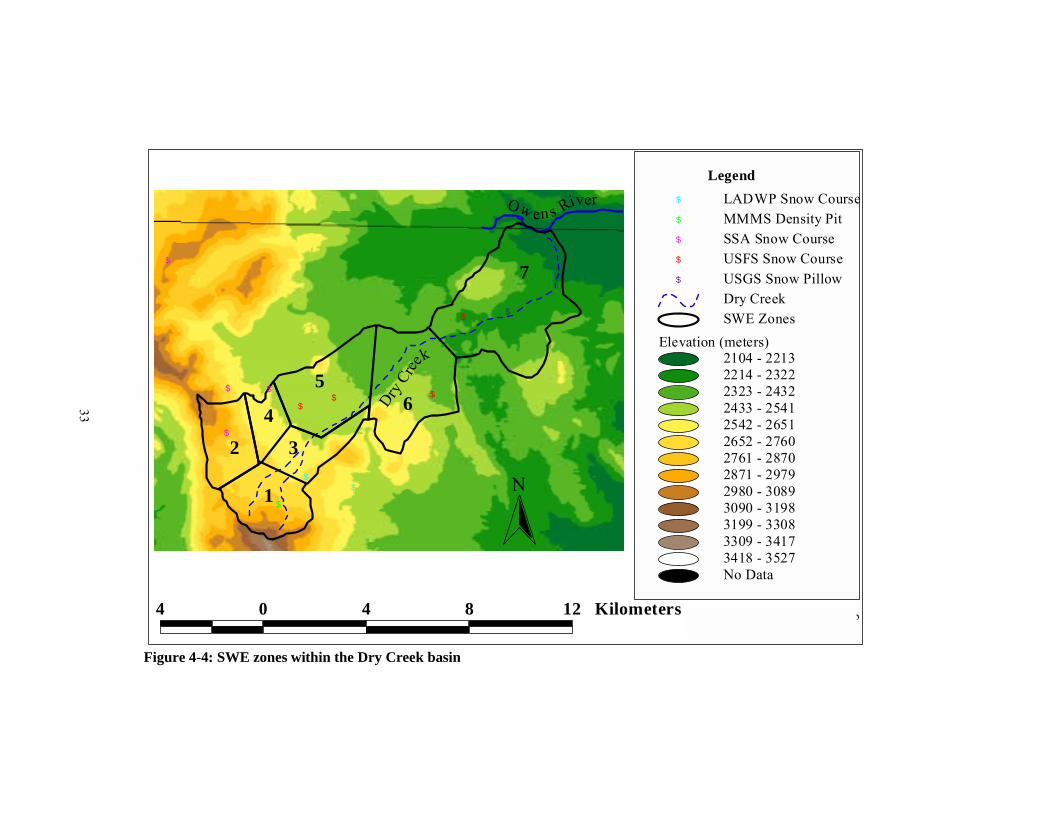
33
$$
$
$ $
$
$
$$
$
$
$
Ow en s River
Dry C
ree
k
4 0 4 8 12 Kilometers
N
LADWP Snow Course$
MMMS Density Pit$
SSA Snow Course$
USFS Snow Course$
USGS Snow Pillow$
Dry CreekSWE Zones
Elevation (meters)2104 - 22132214 - 23222323 - 24322433 - 25412542 - 26512652 - 27602761 - 28702871 - 29792980 - 30893090 - 31983199 - 33083309 - 34173418 - 3527No Data
Legend
Prepared by The Mammoth GroupUTM-1983 Projection
1
2 34
56
7
Figure 4-4: SWE zones within the Dry Creek basin
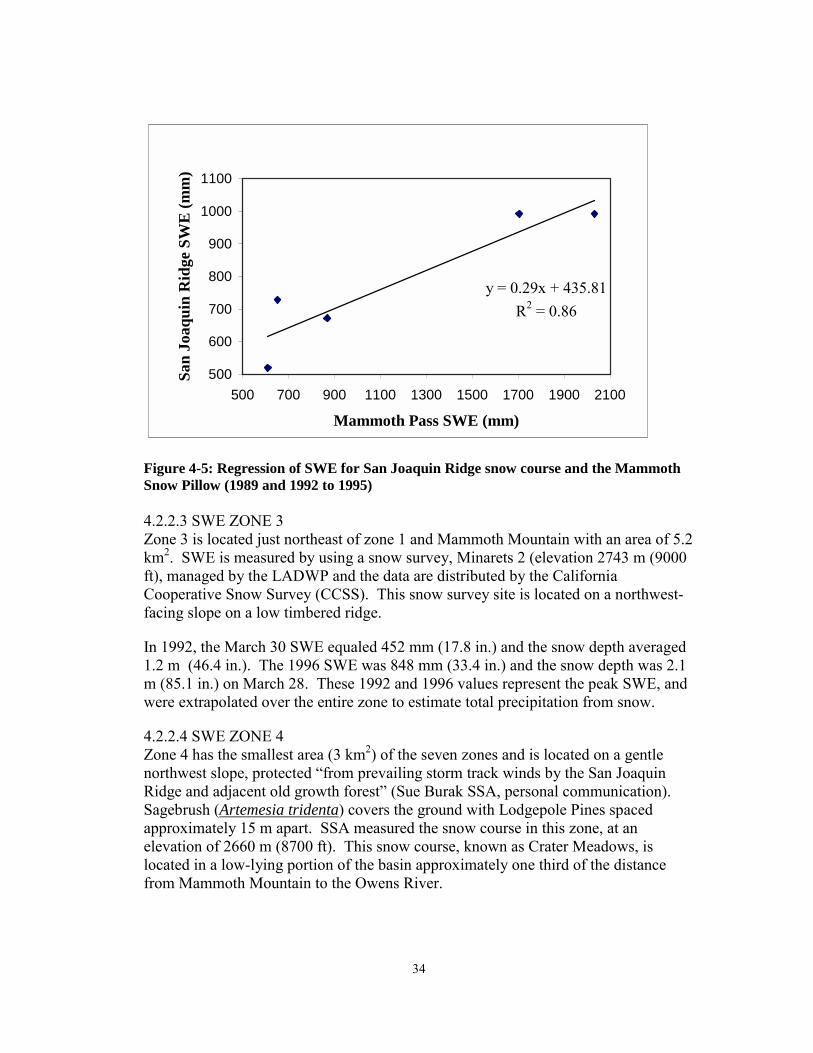
34
y = 0.29x + 435.81R2 = 0.86
500
600
700
800
900
1000
1100
500 700 900 1100 1300 1500 1700 1900 2100
Mammoth Pass SWE (mm)
San
Joaq
uin
Rid
ge S
WE
(mm
)
Figure 4-5: Regression of SWE for San Joaquin Ridge snow course and the Mammoth Snow Pillow (1989 and 1992 to 1995) 4.2.2.3 SWE ZONE 3 Zone 3 is located just northeast of zone 1 and Mammoth Mountain with an area of 5.2 km2. SWE is measured by using a snow survey, Minarets 2 (elevation 2743 m (9000 ft), managed by the LADWP and the data are distributed by the California Cooperative Snow Survey (CCSS). This snow survey site is located on a northwest-facing slope on a low timbered ridge.
In 1992, the March 30 SWE equaled 452 mm (17.8 in.) and the snow depth averaged 1.2 m (46.4 in.). The 1996 SWE was 848 mm (33.4 in.) and the snow depth was 2.1 m (85.1 in.) on March 28. These 1992 and 1996 values represent the peak SWE, and were extrapolated over the entire zone to estimate total precipitation from snow.
4.2.2.4 SWE ZONE 4 Zone 4 has the smallest area (3 km2) of the seven zones and is located on a gentle northwest slope, protected �from prevailing storm track winds by the San Joaquin Ridge and adjacent old growth forest� (Sue Burak SSA, personal communication). Sagebrush (Artemesia tridenta) covers the ground with Lodgepole Pines spaced approximately 15 m apart. SSA measured the snow course in this zone, at an elevation of 2660 m (8700 ft). This snow course, known as Crater Meadows, is located in a low-lying portion of the basin approximately one third of the distance from Mammoth Mountain to the Owens River.
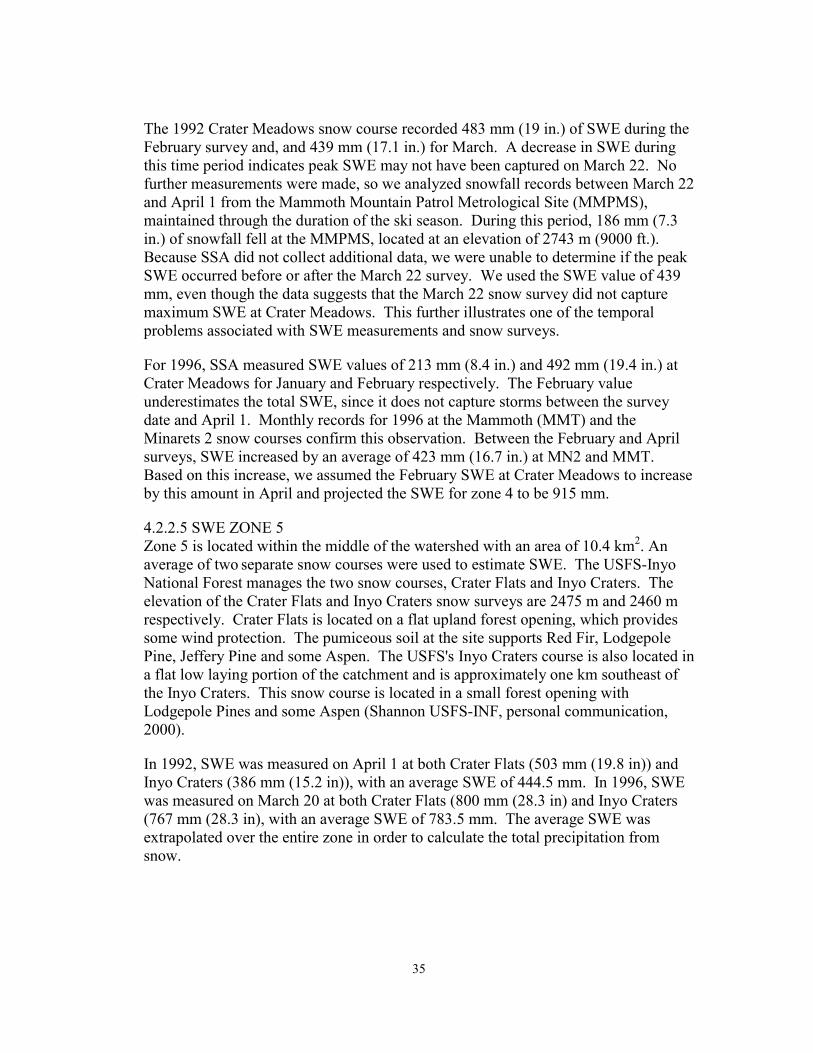
35
The 1992 Crater Meadows snow course recorded 483 mm (19 in.) of SWE during the February survey and, and 439 mm (17.1 in.) for March. A decrease in SWE during this time period indicates peak SWE may not have been captured on March 22. No further measurements were made, so we analyzed snowfall records between March 22 and April 1 from the Mammoth Mountain Patrol Metrological Site (MMPMS), maintained through the duration of the ski season. During this period, 186 mm (7.3 in.) of snowfall fell at the MMPMS, located at an elevation of 2743 m (9000 ft.). Because SSA did not collect additional data, we were unable to determine if the peak SWE occurred before or after the March 22 survey. We used the SWE value of 439 mm, even though the data suggests that the March 22 snow survey did not capture maximum SWE at Crater Meadows. This further illustrates one of the temporal problems associated with SWE measurements and snow surveys.
For 1996, SSA measured SWE values of 213 mm (8.4 in.) and 492 mm (19.4 in.) at Crater Meadows for January and February respectively. The February value underestimates the total SWE, since it does not capture storms between the survey date and April 1. Monthly records for 1996 at the Mammoth (MMT) and the Minarets 2 snow courses confirm this observation. Between the February and April surveys, SWE increased by an average of 423 mm (16.7 in.) at MN2 and MMT. Based on this increase, we assumed the February SWE at Crater Meadows to increase by this amount in April and projected the SWE for zone 4 to be 915 mm.
4.2.2.5 SWE ZONE 5 Zone 5 is located within the middle of the watershed with an area of 10.4 km2. An average of two separate snow courses were used to estimate SWE. The USFS-Inyo National Forest manages the two snow courses, Crater Flats and Inyo Craters. The elevation of the Crater Flats and Inyo Craters snow surveys are 2475 m and 2460 m respectively. Crater Flats is located on a flat upland forest opening, which provides some wind protection. The pumiceous soil at the site supports Red Fir, Lodgepole Pine, Jeffery Pine and some Aspen. The USFS's Inyo Craters course is also located in a flat low laying portion of the catchment and is approximately one km southeast of the Inyo Craters. This snow course is located in a small forest opening with Lodgepole Pines and some Aspen (Shannon USFS-INF, personal communication, 2000).
In 1992, SWE was measured on April 1 at both Crater Flats (503 mm (19.8 in)) and Inyo Craters (386 mm (15.2 in)), with an average SWE of 444.5 mm. In 1996, SWE was measured on March 20 at both Crater Flats (800 mm (28.3 in) and Inyo Craters (767 mm (28.3 in), with an average SWE of 783.5 mm. The average SWE was extrapolated over the entire zone in order to calculate the total precipitation from snow.
36
4.2.2.6 SWE ZONE 6 Zone 6 is located in the lower half of the Dry Creek basin, with an area of 13 km2 (5 mi2). This zone is characterized by relatively flat topography with a majority of the surface covered by a coniferous forest. The Lower Dry Creek West snow course used for zone 6 is characterized by a small forest opening on a 1-2% grade to the north by northwest in pumiceous soil, which supports Lodgepole Pine and Red Fir with some Aspen (Shannon USFS-INF, personal communication, 2000).
For 1992, SWE was not measured at the Lower Dry Creek West site. To determine a value for the 1992 SWE, we performed a regression against the Lower Dry Creek East snow survey records (Figure 4-6). The regression analysis between Lower Dry Creek East and Lower Dry Creek East depicted a strong statistical relationship between the two sites (R2 = 0.96). According to the regression analysis, the SWE for 1992 is equal to 318 mm (12.5 in.).
For 1996, we used the value of 541 mm (21.3 in.) from the March 19 snow survey to estimate total SWE for the Zone.
y = 1.18x + 78.3R2 = 0.96
150250350450550650750850
150 250 350 450 550 650Dry Creek East SWE (mm)
Dry
Cre
ek W
est S
WE
(mm
)
Figure 4-6: Regression of SWE for Dry Creek West and Dry Creek East (1993 to 2000) 4.2.2.7 SWE ZONE 7 Zone 7 is located at the northernmost point of the watershed with an area of 21 km2. Zone 7 SWE measurements came from the USFS�s Lower Dry Creek East snow course, located south of Lookout Mountain (Appendix A), elevation 2307 m. This snow course is located in a small clearing of Jeffery and Lodgepole forest uplands, on a west by northwest grade, of less than one percent (Casey Shannon USFS-Inyo National Forest, personal communication, 2000). The US Geological Survey
37
maintains a snow pillow, which is also located in SWE zone 7. However, data from the snow pillow was not used because of an incomplete data records (C. Farrar USGS-Carnelian Bay, personal communication, 2001). For 1992, a SWE value of 203 mm was used from March 31. For 1996, we used a SWE value of 348 mm from March 8.
4.2.2.8 OTHER SNOW COURSES AND PILLOWS The INF, LADWP, and SSA have managed snow courses and snow sensors in the watersheds adjacent to Dry Creek (Table 4-6). These watersheds include Deadman Creek and Glass Creek to the north and Mammoth Creek to the south of the Dry Creek watershed (Appendix A). Since 1992, the INF has maintained several snow courses outside of the Dry Creek watershed: one at Big Springs and four in the Glass Creek and Deadman Creek watersheds, the latter two lie to the north of the Dry Creek basin. The INF also operated a snow pillow on Mammoth Mountain, approximately 122 m from MMMS. This snow pillow functioned from 1969 to 1995 when the forest service stopped using it, due to changing wind patterns and redistribution of snow from construction of the mid-chalet pond. Additionally, the LADWP has historically maintained the following three snow courses in the Mammoth Creek watershed: Mammoth (MMT) in operation since 1928; Minarets 1 (MN1), maintained from 1928 to 1995; and Minarets 3 (MN3), which only operated in 1966. The LADWP also maintains the Mammoth Pass snow pillow in the Mammoth Creek Drainage basin, however this instrument may be removed since it is located within a wilderness area. We compared 1996 SWE data from MN3, MN2, and MAM with other Dry Creek snow courses, to establish if the latter captured peak SWE. The INF incorporated SWE data from MMT, MN1, and MAM in their 1992, 1993, and 1994 Dry Creek water budgets (USFS, 1997).
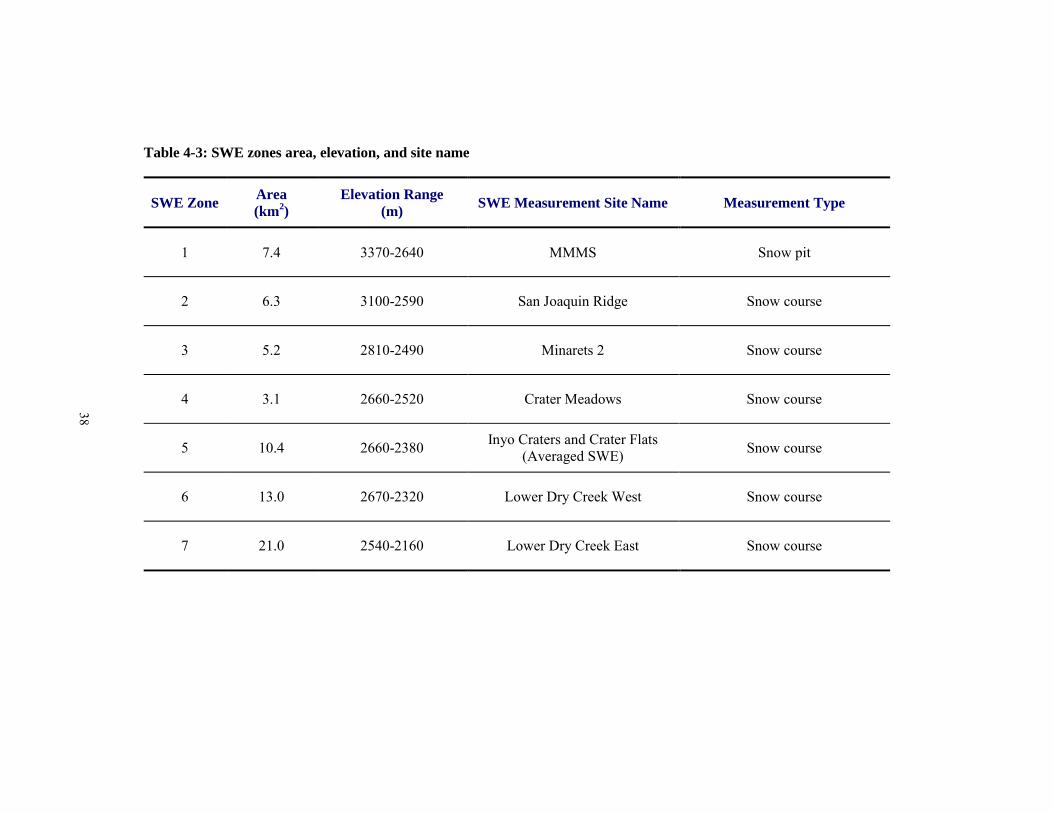
38
Table 4-3: SWE zones area, elevation, and site name
SWE Zone Area (km2)
Elevation Range (m) SWE Measurement Site Name Measurement Type
1 7.4 3370-2640 MMMS Snow pit
2 6.3 3100-2590 San Joaquin Ridge Snow course
3 5.2 2810-2490 Minarets 2 Snow course
4 3.1 2660-2520 Crater Meadows Snow course
5 10.4 2660-2380 Inyo Craters and Crater Flats (Averaged SWE) Snow course
6 13.0 2670-2320 Lower Dry Creek West Snow course
7 21.0 2540-2160 Lower Dry Creek East Snow course
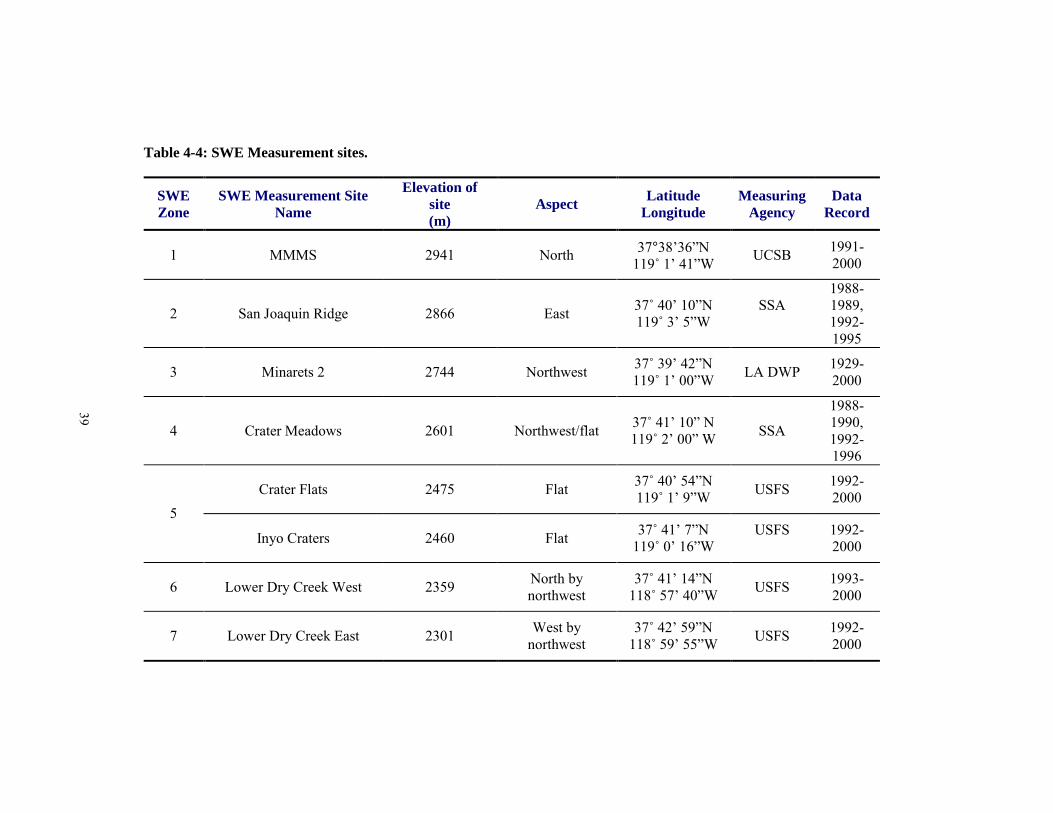
39
Table 4-4: SWE Measurement sites.
SWE Zone
SWE Measurement Site Name
Elevation of site (m)
Aspect Latitude Longitude
Measuring Agency
Data Record
1 MMMS 2941 North 37°38�36�N 119û 1� 41�W UCSB 1991-
2000
2 San Joaquin Ridge 2866 East 37û 40� 10�N 119û 3� 5�W
SSA
1988-1989, 1992-1995
3 Minarets 2 2744 Northwest 37û 39� 42�N 119û 1� 00�W LA DWP 1929-
2000
4 Crater Meadows 2601 Northwest/flat 37û 41� 10� N 119û 2� 00� W SSA
1988-1990, 1992-1996
Crater Flats 2475 Flat 37û 40� 54�N 119û 1� 9�W USFS 1992-
2000 5
Inyo Craters 2460 Flat 37û 41� 7�N 119û 0� 16�W
USFS
1992-2000
6 Lower Dry Creek West 2359 North by northwest
37û 41� 14�N 118û 57� 40�W USFS 1993-
2000
7 Lower Dry Creek East 2301 West by northwest
37û 42� 59�N 118û 59� 55�W USFS 1992-
2000
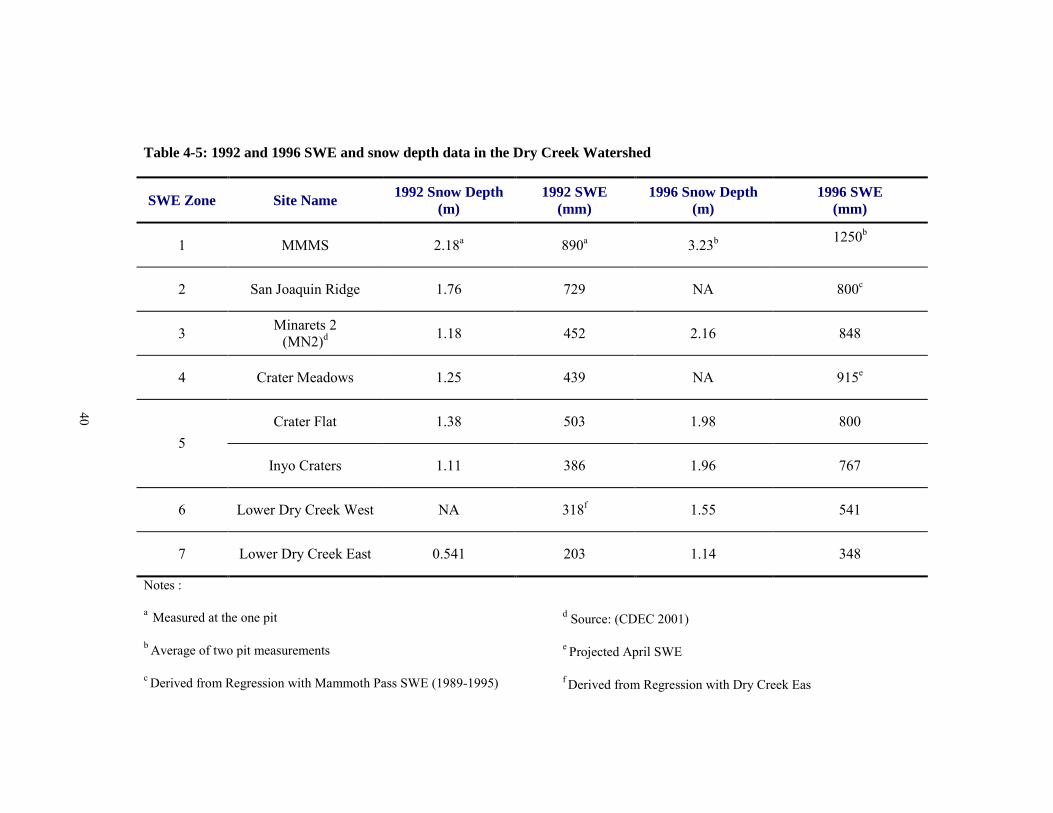
40
Table 4-5: 1992 and 1996 SWE and snow depth data in the Dry Creek Watershed
SWE Zone Site Name 1992 Snow Depth (m)
1992 SWE (mm)
1996 Snow Depth (m)
1996 SWE (mm)
1 MMMS 2.18a 890a 3.23b 1250b
2 San Joaquin Ridge 1.76 729 NA 800c
3 Minarets 2 (MN2)d 1.18 452 2.16 848
4 Crater Meadows 1.25 439 NA 915e
Crater Flat 1.38 503 1.98 800 5
Inyo Craters 1.11 386 1.96 767
6 Lower Dry Creek West NA 318f 1.55 541
7 Lower Dry Creek East 0.541 203 1.14 348
Notes :
a Measured at the one pit
b Average of two pit measurements
c Derived from Regression with Mammoth Pass SWE (1989-1995)
d Source: (CDEC 2001)
e Projected April SWE
f Derived from Regression with Dry Creek Eas
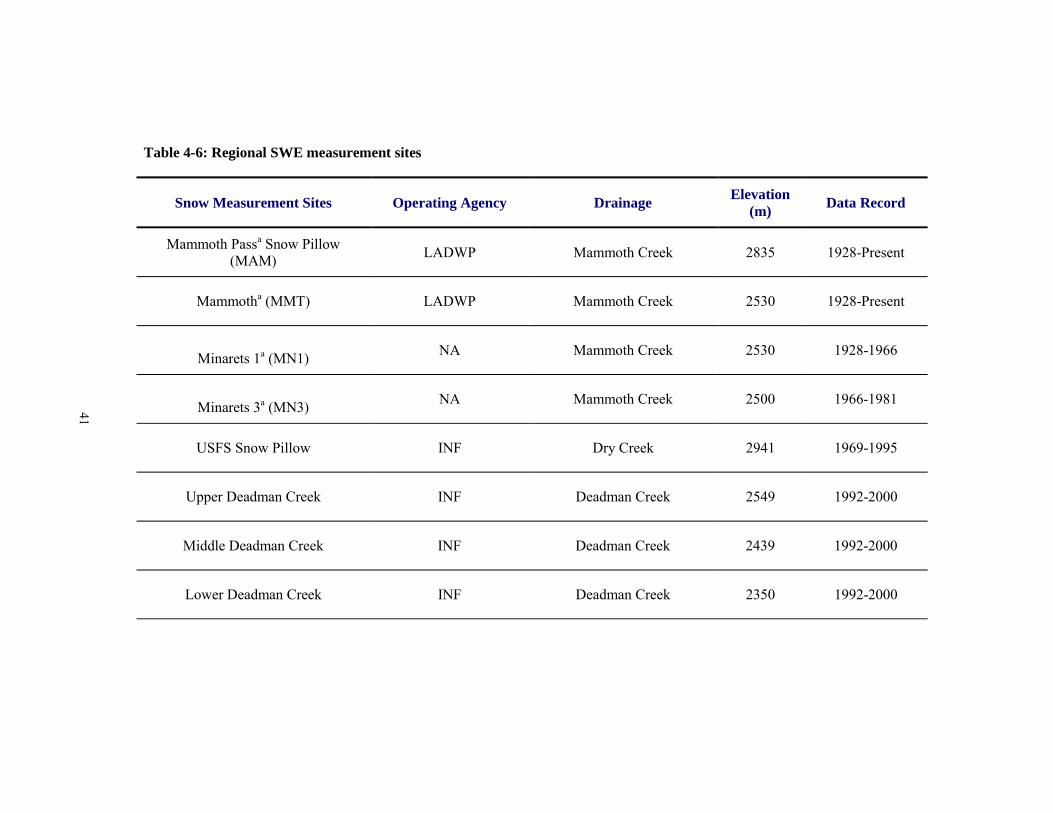
41
Table 4-6: Regional SWE measurement sites
Snow Measurement Sites Operating Agency Drainage Elevation (m) Data Record
Mammoth Passa Snow Pillow (MAM) LADWP Mammoth Creek 2835 1928-Present
Mammotha (MMT) LADWP Mammoth Creek 2530 1928-Present
Minarets 1a (MN1) NA Mammoth Creek 2530 1928-1966
Minarets 3a (MN3) NA Mammoth Creek 2500 1966-1981
USFS Snow Pillow INF Dry Creek 2941 1969-1995
Upper Deadman Creek INF Deadman Creek 2549 1992-2000
Middle Deadman Creek INF Deadman Creek 2439 1992-2000
Lower Deadman Creek INF Deadman Creek 2350 1992-2000
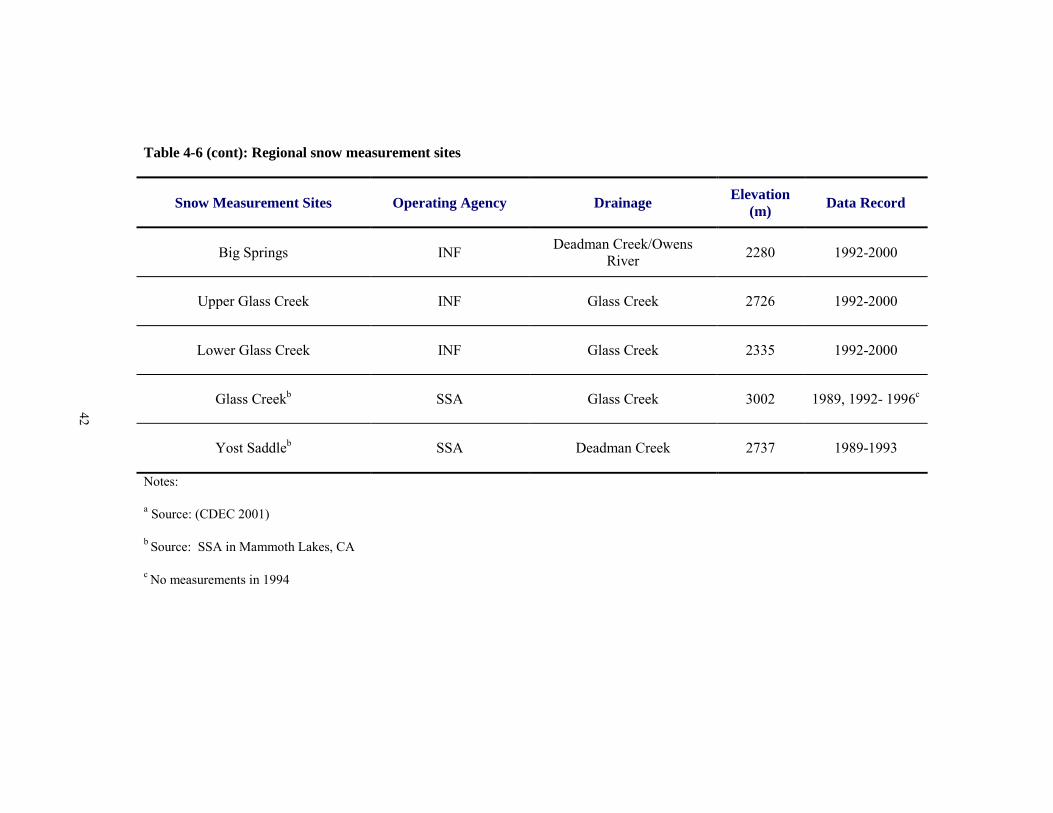
42
Table 4-6 (cont): Regional snow measurement sites
Snow Measurement Sites Operating Agency Drainage Elevation (m) Data Record
Big Springs INF Deadman Creek/Owens River 2280 1992-2000
Upper Glass Creek INF Glass Creek 2726 1992-2000
Lower Glass Creek INF Glass Creek 2335 1992-2000
Glass Creekb SSA Glass Creek 3002 1989, 1992- 1996c
Yost Saddleb SSA Deadman Creek 2737 1989-1993
Notes:
a Source: (CDEC 2001)
b Source: SSA in Mammoth Lakes, CA
c No measurements in 1994

43
4.2.2.9 SWE UNCERTAINTY Levels of uncertainty in estimating SWE throughout the basin are introduced through instrument error, and spatial and temporal variability. Sources of uncertainty from snow course SWE measurements include user error in reading the measurements; snow core collection difficulties; re-sampling old survey holes; inclusion of soil in the core; and incomplete removal of all snow and debris from the previous sample (USACE, 1956). Measurements with snow tubes used within snow courses can vary up to 12 percent (Work et al., 1965).
Snow deposition is unequally distributed; therefore the amount of SWE is unequal throughout the Dry Creek basin, which can be attributed to differences in snow depth and to a lesser degree density (Figure 4-7) (Elder et al., 1989). This variability in SWE is due to wind, slope, aspect, elevation, vegetation type, surface roughness, and energy exchange (Elder et al., 1991). Even with this heterogeneity of SWE there is a general trend that SWE increases with elevation. Therefore, extrapolating one value over an entire zone may underestimate or overestimate SWE. The variability of precipitation in heterogeneous terrain makes it difficult to estimate, and it is exacerbated in regions where the large percentage of total precipitation is snow (Johnson and Hanson, 1998). In alpine regions, redistribution accounts for additional spatial heterogeneity of snow (Dozier et al., 1987).
200400600800
100012001400
2300 2400 2500 2600 2700 2800 2900 3000Elevation (m)
SWE
(mm
)
1992 SWE1996 SWE
Figure 4-7: Relationship between SWE and elevation in the Dry Creek watershed Temporal variability produces a level of uncertainty, since the SWE measurements may not have captured the peak SWE. DWR recognizes April 1 as the date of peak SWE in California, and snow surveys are usually taken near this date. Therefore, the
44
timing of the SWE measurement may not accurately represent the peak SWE for the year. In order to determine the amount of uncertainty associated with SWE we aggregated the levels of uncertainty related to measurement, spatial variability and temporal variability and estimated the total uncertainty equal to 50 percent.
4.2.1 RUNOFF Dry Creek is an ephemeral stream, responding to spring flow, snowmelt, and storm flow. Ephemeral streams such as this generally flow in the upper reaches of a watershed only during, and for a short duration after, precipitation events. In the Dry Creek basin, on average, runoff begins in early June and ends in August, and in some instances occurs for less than a month. Runoff normally does not leave the basin, as most of the water percolates into the ground, although it has been observed flowing into the Owens River in 1969 and 1983 (T. Alpers and T. Heller, personal communication, 2000). Due to Dry Creek�s ephemeral nature, and the insignificance of runoff in comparison to the other water balance terms, we consider it negligible.
4.2.3 EVAPOTRANSPIRATION We delineated the watershed into two evapotranspiration zones, one representing solely evaporation and the other evapotranspiration. The evaporation zone has little vegetation so we only considered water loss through evaporation from snow, rock, and soil surfaces. The evapotranspiration zones, for the well field water balance and basin water balance, represent the remainder of the area for the water balances and are primarily forested (Figures 4-8 and 4-9 respectively).
4.2.3.1 EVAPORATION ZONE We assumed that most of the water loss in the uppermost portion of the Dry Creek basin is due to evaporation from snow, rock, and soil surfaces. This zone has an area of 7.4 km2 with an elevation range between 2640 and 3370 m (8659 to 11,054 ft) (Figures 4-8 and 4-9). The upper two-thirds of the evaporation zone lies above the tree line, with an elevation range between 2896 and 3384 m (9500 to 11,100 ft). The lower area was forested, but the ski area removed patches of trees to build ski runs, which have been revegetated with grasses to minimize erosion.
Evaporation from creeks and small ponds in this area (Lost Lake and the Mid-Chalet storage pond) is minimal as their cumulative surface area is very small in comparison to the overall watershed. For this reason, we assumed evaporation from these ponds is negligible, as this water loss would be within our margin of error.
Evaporation is difficult to quantify in montane watersheds, which are only snow-covered part of the year. It can be calculated using several different equations based on energy balance and meteorological measurements (Dunne and Leopold, 1971). In the Emerald Basin, for example, an aerodynamic method was used to calculate evaporation from snow and water surfaces, along with the Penman technique, which included energy balance terms for the other surfaces (Kattelmann and Elder, 1991).
45
The same method could be applied to a portion of the Dry Creek watershed as the meteorological data required for these equations can be obtained from MMMS; however, the results would not be uniform across the study area (Marks, 1988). Because of the limited micro-meteorological data available we did not use these methods.
To calculate evaporation for the Dry Creek basin, we used a value determined by the Complementary Relationship Areal Evaporation (CRAE) model, which utilized data from MMMS (Leydecker and Melack, 2000). The CRAE model calculates evaporation from both snow-covered and snow-free areas. The meteorological inputs required incoming solar radiation, air temperature, dew point temperature, and cloud cover that were obtained from MMMS recordings. Other inputs include elevation of the meteorological station, latitude, and snow covered area. Snow-covered area can limit the model�s application, as this parameter is generally ascertained from aerial photographs, and is not always available if cloudy weather persists. To adapt this model to the climatic conditions in the Sierra Nevada, a snow-covered area and an albedo model were included in the calculations. The model calculated monthly evaporative loss, however we summed monthly values between April and September to determine our evaporative loss. Evaporation occurring between October and March were taken into account in the SWE measurements.
Leydecker and Melack calculated evaporation from 1990 to 1994 with meteorological data from MMMS (2000). Evaporation varied between 368 to 574 mm from 1990 to 1994. Evaporation values for Mammoth Mountain calculated for 1992 were 419 mm. This value was used to determine the evaporative loss within the evaporation zone for 1992.
Evaporation for 1996 was not calculated in the CRAE model study; therefore a 1991 value of 574 mm was used. Leydecker and Melack calculated the highest evaporation value, 574 mm, between 1990 and 1994 (2000). This high value was chosen to provide a more conservative evaporation estimate. Selecting 574 mm (calculated for 1991, a drought year), to represent evaporation for 1996, and extrapolating over the evaporation zone, adds to the level of uncertainty associated with evaporation in our water balance.
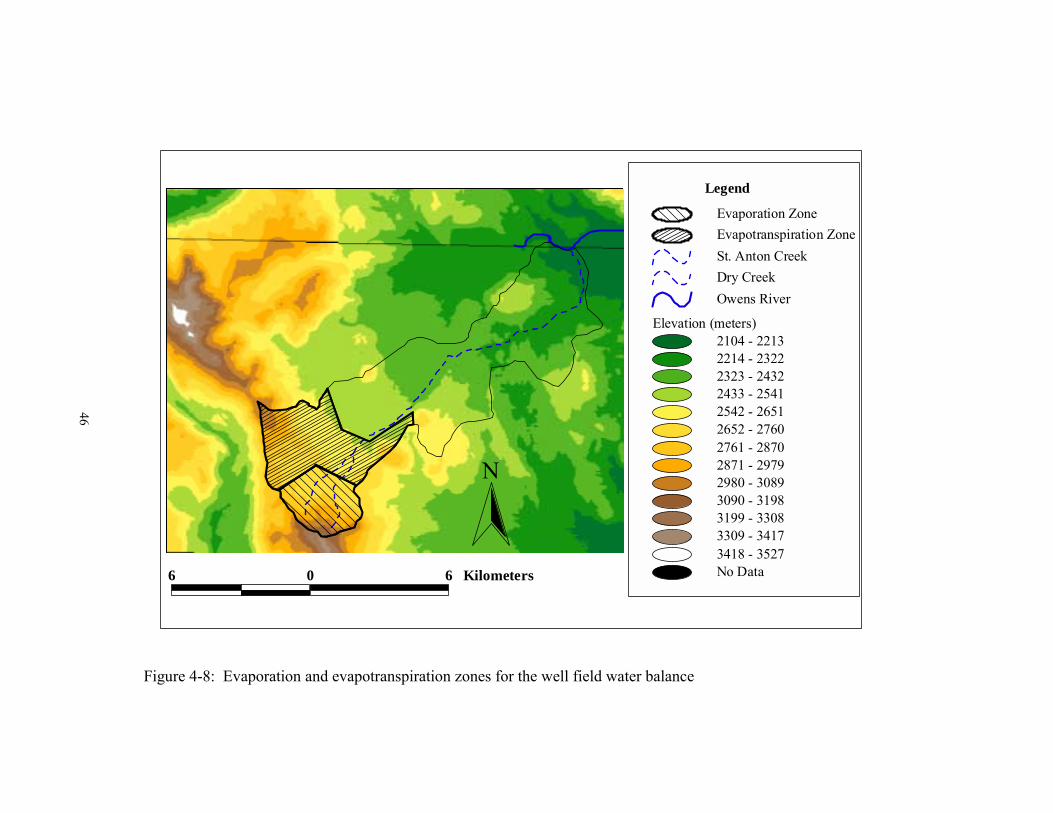
46
6 0 6 Kilometers
N
Evaporation ZoneEvapotranspiration ZoneSt. Anton CreekDry CreekOwens River
Elevation (meters)2104 - 22132214 - 23222323 - 24322433 - 25412542 - 26512652 - 27602761 - 28702871 - 29792980 - 30893090 - 31983199 - 33083309 - 34173418 - 3527No Data
Legend
Figure 4-8: Evaporation and evapotranspiration zones for the well field water balance
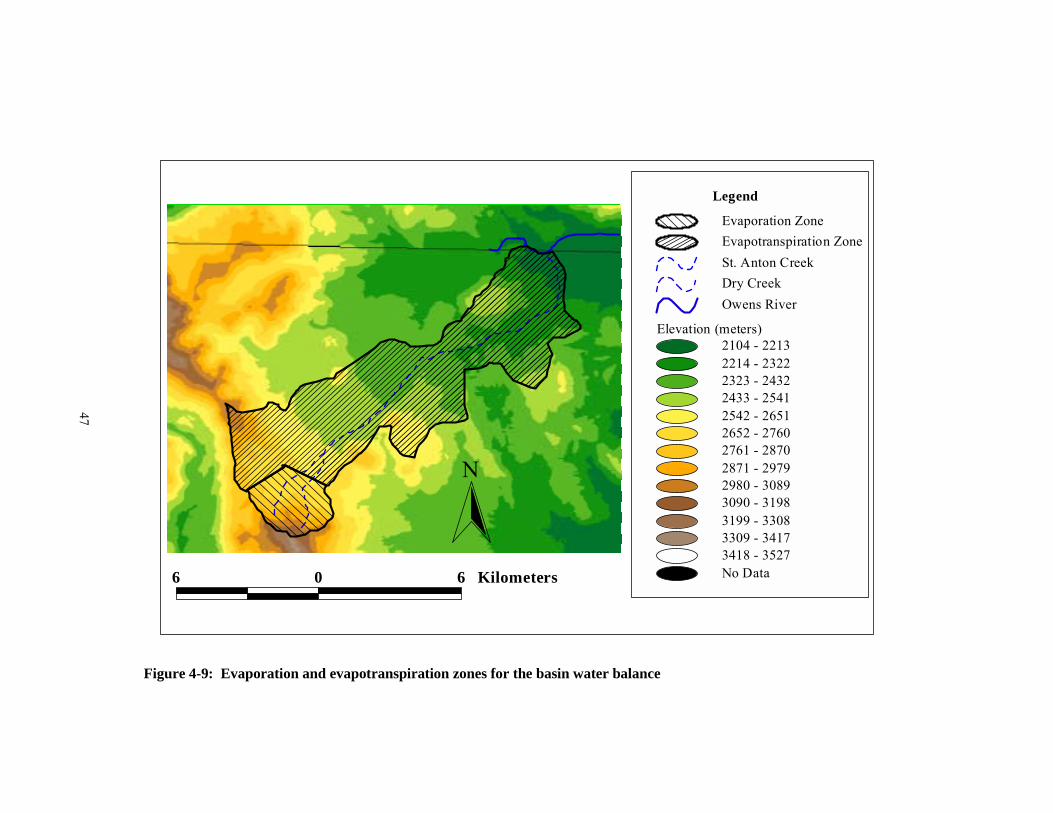
47
6 0 6 Kilometers
N
Evaporation ZoneEvapotranspiration ZoneSt. Anton CreekDry CreekOwens River
Elevation (meters)2104 - 22132214 - 23222323 - 24322433 - 25412542 - 26512652 - 27602761 - 28702871 - 29792980 - 30893090 - 31983199 - 33083309 - 34173418 - 3527No Data
Legend
Figure 4-9: Evaporation and evapotranspiration zones for the basin water balance
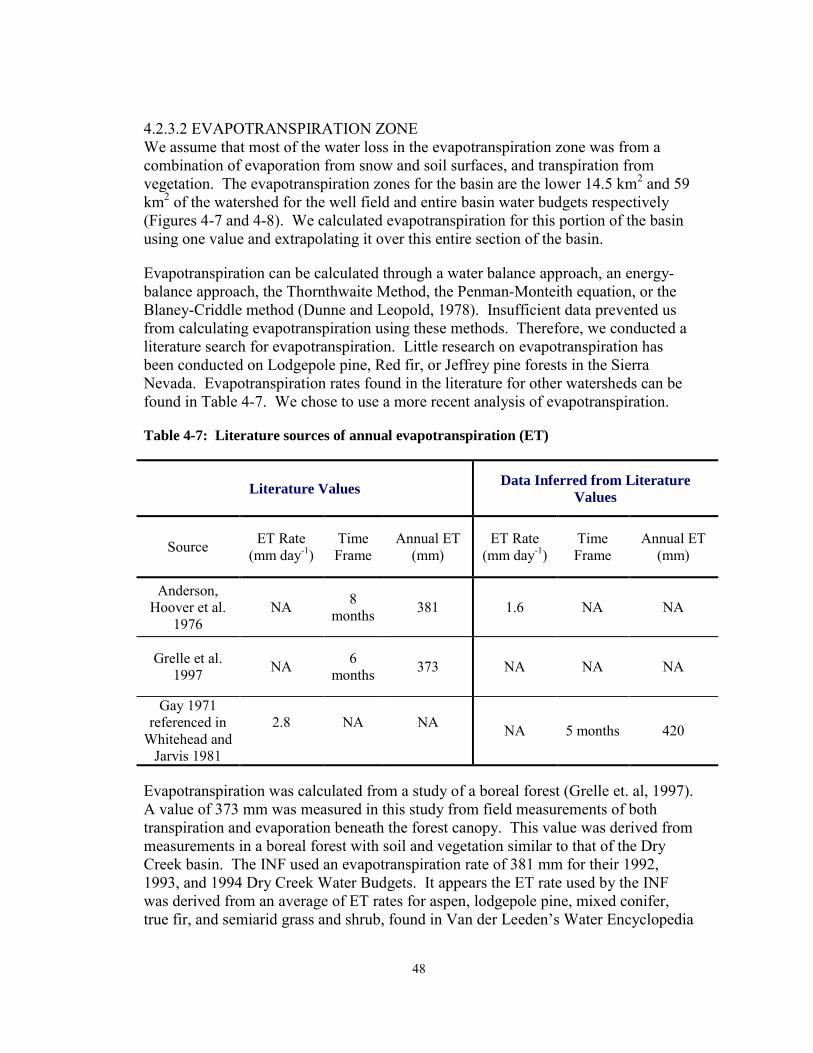
48
4.2.3.2 EVAPOTRANSPIRATION ZONE We assume that most of the water loss in the evapotranspiration zone was from a combination of evaporation from snow and soil surfaces, and transpiration from vegetation. The evapotranspiration zones for the basin are the lower 14.5 km2 and 59 km2 of the watershed for the well field and entire basin water budgets respectively (Figures 4-7 and 4-8). We calculated evapotranspiration for this portion of the basin using one value and extrapolating it over this entire section of the basin.
Evapotranspiration can be calculated through a water balance approach, an energy-balance approach, the Thornthwaite Method, the Penman-Monteith equation, or the Blaney-Criddle method (Dunne and Leopold, 1978). Insufficient data prevented us from calculating evapotranspiration using these methods. Therefore, we conducted a literature search for evapotranspiration. Little research on evapotranspiration has been conducted on Lodgepole pine, Red fir, or Jeffrey pine forests in the Sierra Nevada. Evapotranspiration rates found in the literature for other watersheds can be found in Table 4-7. We chose to use a more recent analysis of evapotranspiration.
Table 4-7: Literature sources of annual evapotranspiration (ET)
Literature Values Data Inferred from Literature Values
Source ET Rate (mm day-1)
Time Frame
Annual ET (mm)
ET Rate (mm day-1)
Time Frame
Annual ET (mm)
Anderson, Hoover et al.
1976 NA 8
months 381 1.6 NA NA
Grelle et al. 1997 NA 6
months 373 NA NA NA
Gay 1971 referenced in
Whitehead and Jarvis 1981
2.8
NA
NA
NA 5 months 420
Evapotranspiration was calculated from a study of a boreal forest (Grelle et. al, 1997). A value of 373 mm was measured in this study from field measurements of both transpiration and evaporation beneath the forest canopy. This value was derived from measurements in a boreal forest with soil and vegetation similar to that of the Dry Creek basin. The INF used an evapotranspiration rate of 381 mm for their 1992, 1993, and 1994 Dry Creek Water Budgets. It appears the ET rate used by the INF was derived from an average of ET rates for aspen, lodgepole pine, mixed conifer, true fir, and semiarid grass and shrub, found in Van der Leeden�s Water Encyclopedia
49
and multiplied by 75 percent to better approximate actual evapotranspiration (USFS, 1997).
4.2.3.3 EVAPOTRANSPIRATION UNCERTAINTY Quantifying the level of uncertainty for evapotranspiration is complicated, as it is difficult to estimate the actual values of this water balance term. Uncertainty associated with spatial variability occurs, when one point measurement of evaporation is extrapolated over a larger area. Winter (1981) assigns a value of 15 percent for the areal averaging of evaporation for lakes, and it will be higher in mountainous terrain. Our assumption that there is no transpiration within the evaporation zone may underestimate water loss in this zone, as there is some vegetative cover and hence evapotranspiration. During the 1996 water balance, the level of uncertainty was increased because we used a 1991 (a drought year) value for 1996 (an average year).
We introduced further uncertainty in the estimation of evapotranspiration since we used measurements from a boreal forest (Grelle et al., 1997). We assumed that the entire zone lost water through evapotranspiration, whereas some of the area is devoid of vegetation, especially forest. Consequently, evapotranspiration may overestimate the water loss to the atmosphere in this zone.
In order to estimate the level of uncertainty attributed to the areal averaging of evapotranspiration, we used a value of 15 percent for evaporation from lakes (Winter, 1981), since limited data are available to estimate the uncertainty associated with evapotranspiration. Taking into account the great uncertainty in estimating evapotranspiration and evaporation for the basin, an overall level of uncertainty of 50 percent was used.
4.2.4 CONSUMPTION/USE As of 1999, MMSA extracts roughly 5.2 x 10⁵ m3 yr-1 (421 AF) from wells within the Dry Creek basin. The 1999 value is a conservative value and may overestimate MMSA�s consumptive use for the 1992 and 1996.
Approximately 75% of this water is used for snowmaking and or irrigation in the Dry Creek watershed, with the other 25% used on the Mammoth Creek side of the MMSA (refer to Appendix A for location).
4.2.4.1 CONSUMPTION/USE UNCERTAINTY We assumed that the level of uncertainty associated with consumptive use is roughly 10%. While the MMSA consumption estimate was based on pumping records, there is likely some variability in the measurements, which warrants an uncertainty assumption albeit small.
50
4.3 GROUNDWATER HYDROLOGY One of the largest assumptions within the water balance analysis regards the change in groundwater storage. Since the groundwater within the Dry Creek basin is extremely complex and difficult to quantify, the excess amount of water within the water balance is assumed to equal the amount of groundwater recharge. The groundwater system in the Long Valley Caldera consists of two major aquifers (Sorey, et al., 1978):
��A shallow subsystem in which temperatures are not much higher than ambient land-surface temperatures, groundwater flow paths are relatively short and direct from areas of recharge to areas of discharge and the concentration of dissolved solids are relatively low;
��A deep subsystem in which temperatures are commonly much higher than ambient surface temperatures, groundwater flow paths are relatively long and circuitous and concentrations of dissolved solids are relatively high.
Groundwater within the Dry Creek basin is located within a local shallow cold water system (less than 244 m (800 ft). The Dry Creek wells are located within the shallow cold semi-confined aquifer system, in the upper one third on the basin.
4.3.1 SOILS Most of the watershed�s upper half has vitrandic cryorthents soils (USDA Forest Service, 1995). These soils, at depths greater than 1.5 m, are pumiceous and have permeability values ranging from 15 to over 50 cm/hr. The soils within the Dry Creek basin are described as draining �somewhat excessively� (USDA Forest Service, 1995). This qualitative description of soil saturation has the second highest of seven drainage categories. These high rates allow for the majority of snowmelt to percolate through the soil column into the underlying fractured groundwater system. Water percolated through the soil can also flow down gradient on top of the bedrock through the permeable soil as baseflow if the bedrock is impervious and non-fractured. Base flow can continue to flow until the underlying rock is fractured, allowing the water to flow into deeper water bearing zones in the bedrock.
Due to the highly permeable soils in the Dry Creek watershed and the lack of runoff, it is assumed that the total recharge to the groundwater system is equal to the total precipitation minus evapotranspiration and consumptive use.
4.3.2 HYDROGEOLOGY The geology of the upper watershed from Mammoth Mountain to the Inyo Craters is comprised of multiple lava flows from several vents both within and outside the basin. Mammoth Mountain was formed by over 20 separate flows, (Bailey, 1989), some of which extend as far north as 3.2 km (2 mi) from the Mammoth Mountain. These flows allow for the storage and movement of water along fractured portions of the flows. Flow-top breccia often develops on the top surface of flows from the
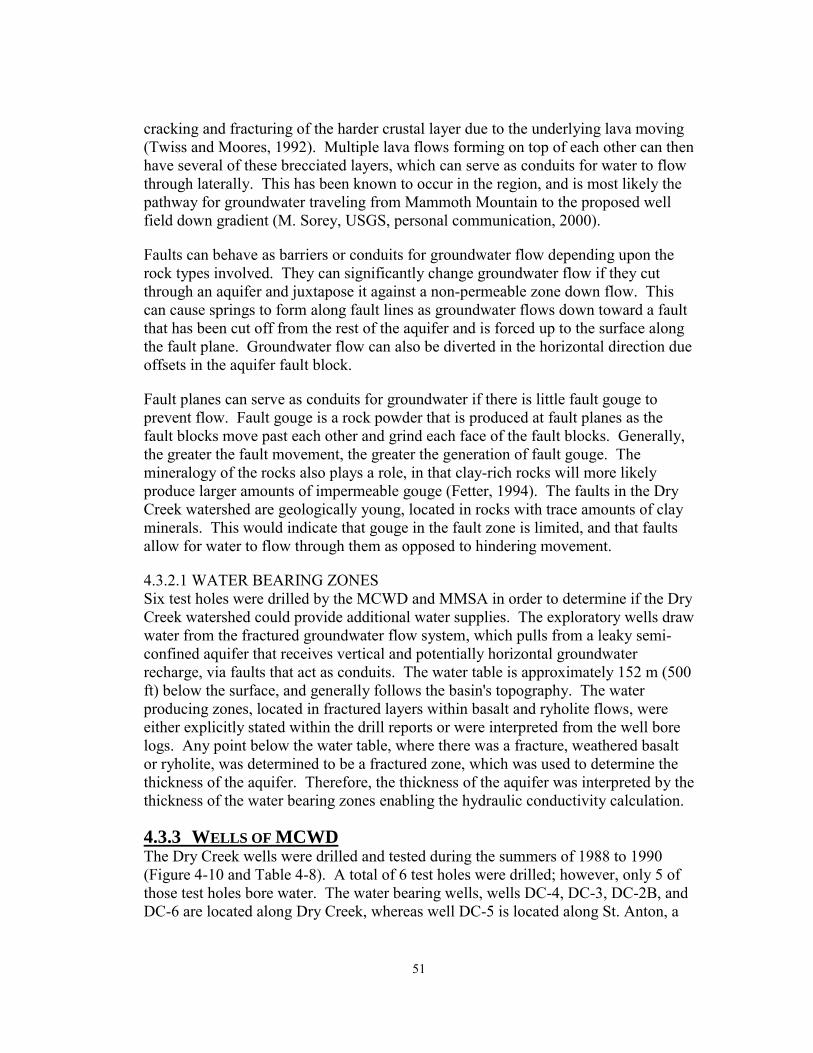
51
cracking and fracturing of the harder crustal layer due to the underlying lava moving (Twiss and Moores, 1992). Multiple lava flows forming on top of each other can then have several of these brecciated layers, which can serve as conduits for water to flow through laterally. This has been known to occur in the region, and is most likely the pathway for groundwater traveling from Mammoth Mountain to the proposed well field down gradient (M. Sorey, USGS, personal communication, 2000).
Faults can behave as barriers or conduits for groundwater flow depending upon the rock types involved. They can significantly change groundwater flow if they cut through an aquifer and juxtapose it against a non-permeable zone down flow. This can cause springs to form along fault lines as groundwater flows down toward a fault that has been cut off from the rest of the aquifer and is forced up to the surface along the fault plane. Groundwater flow can also be diverted in the horizontal direction due offsets in the aquifer fault block.
Fault planes can serve as conduits for groundwater if there is little fault gouge to prevent flow. Fault gouge is a rock powder that is produced at fault planes as the fault blocks move past each other and grind each face of the fault blocks. Generally, the greater the fault movement, the greater the generation of fault gouge. The mineralogy of the rocks also plays a role, in that clay-rich rocks will more likely produce larger amounts of impermeable gouge (Fetter, 1994). The faults in the Dry Creek watershed are geologically young, located in rocks with trace amounts of clay minerals. This would indicate that gouge in the fault zone is limited, and that faults allow for water to flow through them as opposed to hindering movement.
4.3.2.1 WATER BEARING ZONES Six test holes were drilled by the MCWD and MMSA in order to determine if the Dry Creek watershed could provide additional water supplies. The exploratory wells draw water from the fractured groundwater flow system, which pulls from a leaky semi-confined aquifer that receives vertical and potentially horizontal groundwater recharge, via faults that act as conduits. The water table is approximately 152 m (500 ft) below the surface, and generally follows the basin's topography. The water producing zones, located in fractured layers within basalt and ryholite flows, were either explicitly stated within the drill reports or were interpreted from the well bore logs. Any point below the water table, where there was a fracture, weathered basalt or ryholite, was determined to be a fractured zone, which was used to determine the thickness of the aquifer. Therefore, the thickness of the aquifer was interpreted by the thickness of the water bearing zones enabling the hydraulic conductivity calculation.
4.3.3 WELLS OF MCWD The Dry Creek wells were drilled and tested during the summers of 1988 to 1990 (Figure 4-10 and Table 4-8). A total of 6 test holes were drilled; however, only 5 of those test holes bore water. The water bearing wells, wells DC-4, DC-3, DC-2B, and DC-6 are located along Dry Creek, whereas well DC-5 is located along St. Anton, a
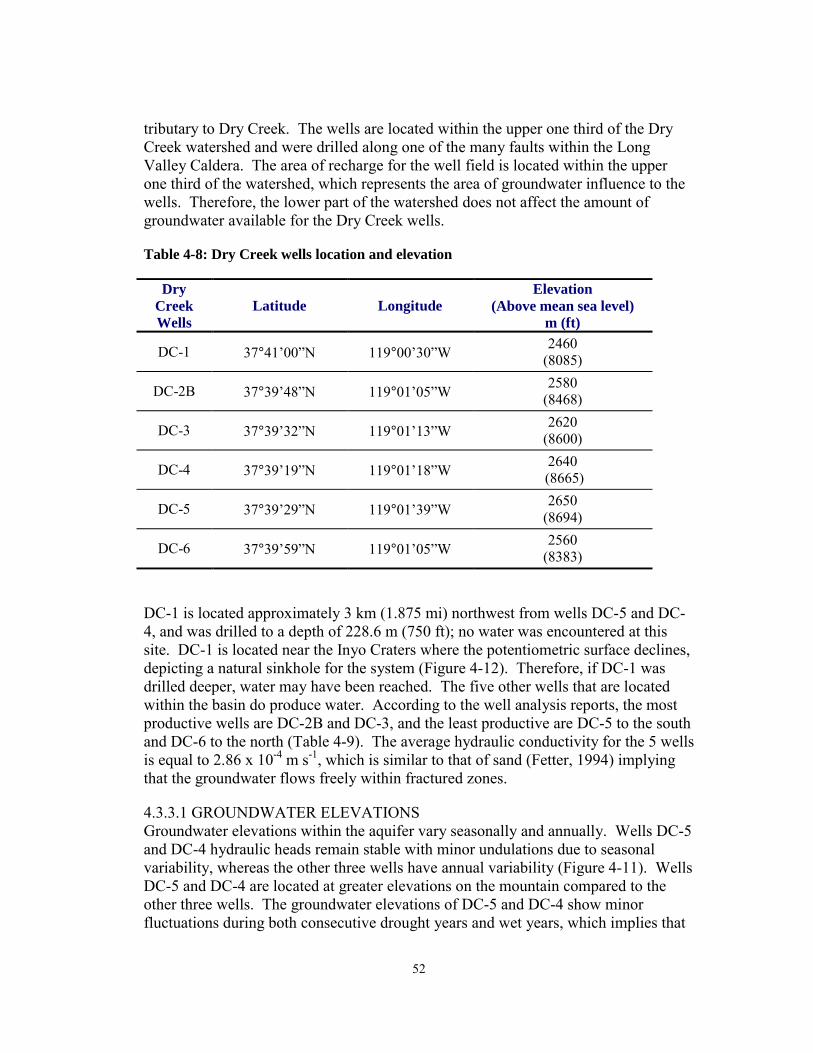
52
tributary to Dry Creek. The wells are located within the upper one third of the Dry Creek watershed and were drilled along one of the many faults within the Long Valley Caldera. The area of recharge for the well field is located within the upper one third of the watershed, which represents the area of groundwater influence to the wells. Therefore, the lower part of the watershed does not affect the amount of groundwater available for the Dry Creek wells.
Table 4-8: Dry Creek wells location and elevation
Dry Creek Wells
Latitude Longitude Elevation
(Above mean sea level) m (ft)
DC-1 37°41�00�N 119°00�30�W 2460 (8085)
DC-2B 37°39�48�N 119°01�05�W 2580 (8468)
DC-3 37°39�32�N 119°01�13�W 2620 (8600)
DC-4 37°39�19�N 119°01�18�W 2640 (8665)
DC-5 37°39�29�N 119°01�39�W 2650 (8694)
DC-6 37°39�59�N 119°01�05�W 2560 (8383)
DC-1 is located approximately 3 km (1.875 mi) northwest from wells DC-5 and DC-4, and was drilled to a depth of 228.6 m (750 ft); no water was encountered at this site. DC-1 is located near the Inyo Craters where the potentiometric surface declines, depicting a natural sinkhole for the system (Figure 4-12). Therefore, if DC-1 was drilled deeper, water may have been reached. The five other wells that are located within the basin do produce water. According to the well analysis reports, the most productive wells are DC-2B and DC-3, and the least productive are DC-5 to the south and DC-6 to the north (Table 4-9). The average hydraulic conductivity for the 5 wells is equal to 2.86 x 10⁻⁴ m s-1, which is similar to that of sand (Fetter, 1994) implying that the groundwater flows freely within fractured zones.
4.3.3.1 GROUNDWATER ELEVATIONS Groundwater elevations within the aquifer vary seasonally and annually. Wells DC-5 and DC-4 hydraulic heads remain stable with minor undulations due to seasonal variability, whereas the other three wells have annual variability (Figure 4-11). Wells DC-5 and DC-4 are located at greater elevations on the mountain compared to the other three wells. The groundwater elevations of DC-5 and DC-4 show minor fluctuations during both consecutive drought years and wet years, which implies that

53
the groundwater within the upper reaches of the watershed is not significantly impacted by climatic variations (Table 4-10).
Table 4-9: Hydraulic characteristics of the Dry Creek wells
Well Transmissivity
cm s-1
(gpd ft-2)
Hydraulic Conductivity
m s-1
Specific Capacity m day-1
(gpm ft-2)
Thickness of water-bearing
zones m (ft)
Safe Yield m3 day-1
DC-2B 0.12 (2600) 1.095 x 10⁻⁵ 0.15
(3.6) 34
(112) 2,300 � 6,000
DC-3 0.40 (8500) 1.967 x 10⁻⁵ 0.46
(11.3) 62
(204) 2,200 � 12,000
DC-4 2.8 (60000) 4.167 x 10⁻⁴ 0.015
(3.6) 40
(130) 150 � 3,500
DC-5 1.9 (41000) 6.45 x 10⁻⁴ 0.082
(2) 73
(240) 700 � 2,000
DC-6 0.15 (3200) 5.037 x 10⁻⁵ 0.028
(0.7) 24
(80) 220 - 870
The groundwater elevation of the other three wells, located down gradient of wells DC-5 and DC-6, show that the water table increased during wet years. Wells DC-2, DC-3 and DC-6, that are located at elevations of approximately 2500 m (8200 ft), show significant seasonal and annual variability within their groundwater elevations. All three wells depict the lowest groundwater elevation in 1992, the end of a six-year drought with a steady increase over the past 10 years. Well DC-2, DC-3 and DC-6 water table elevations vary between 38.8 m � 64.8 m (127.4 ft to 212.6 ft) from 1992 to the present (Table 4-10). These three wells are located along a fault, which may serve as a conduit for recharge to the Dry Creek groundwater system.
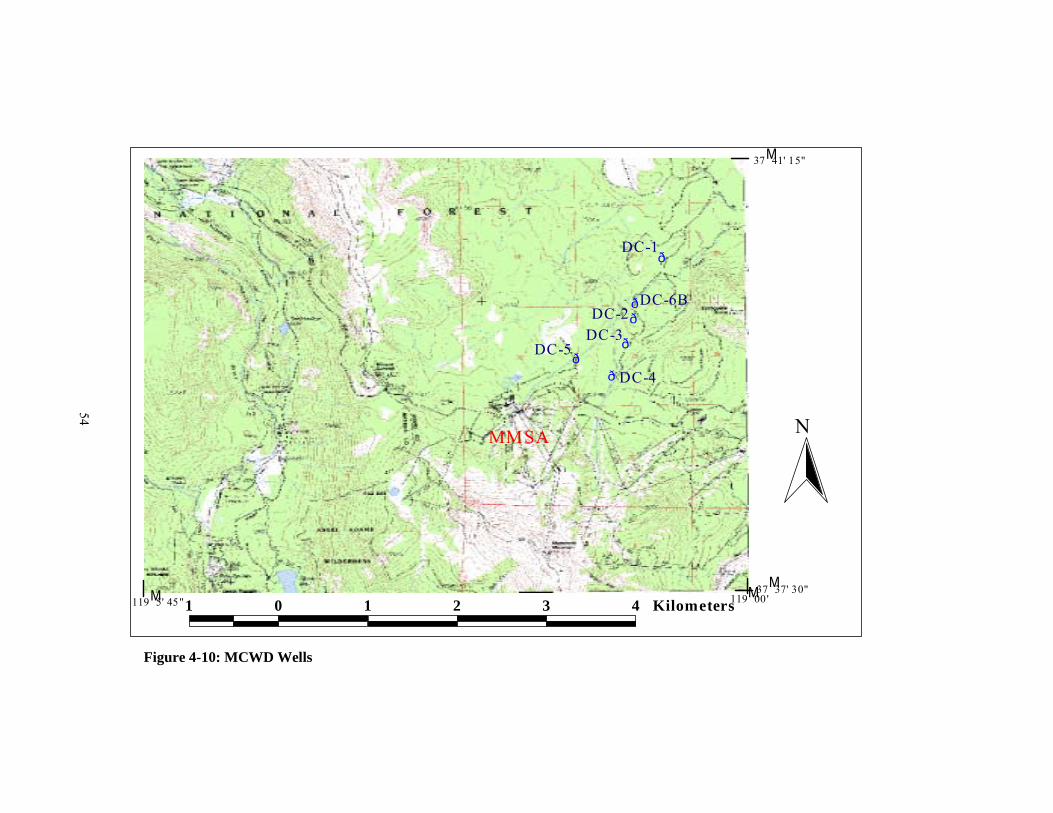
54
ð
ð
ð
ð
ð
ð
1 0 1 2 3 4 Kilometers
N
DC-4
DC-3DC-2
DC-6B
DC-1
MMSA
DC-5
119 00 '119 5' 45"M M 37 37' 30"
M
M
37 41' 15"
Figure 4-10: MCWD Wells
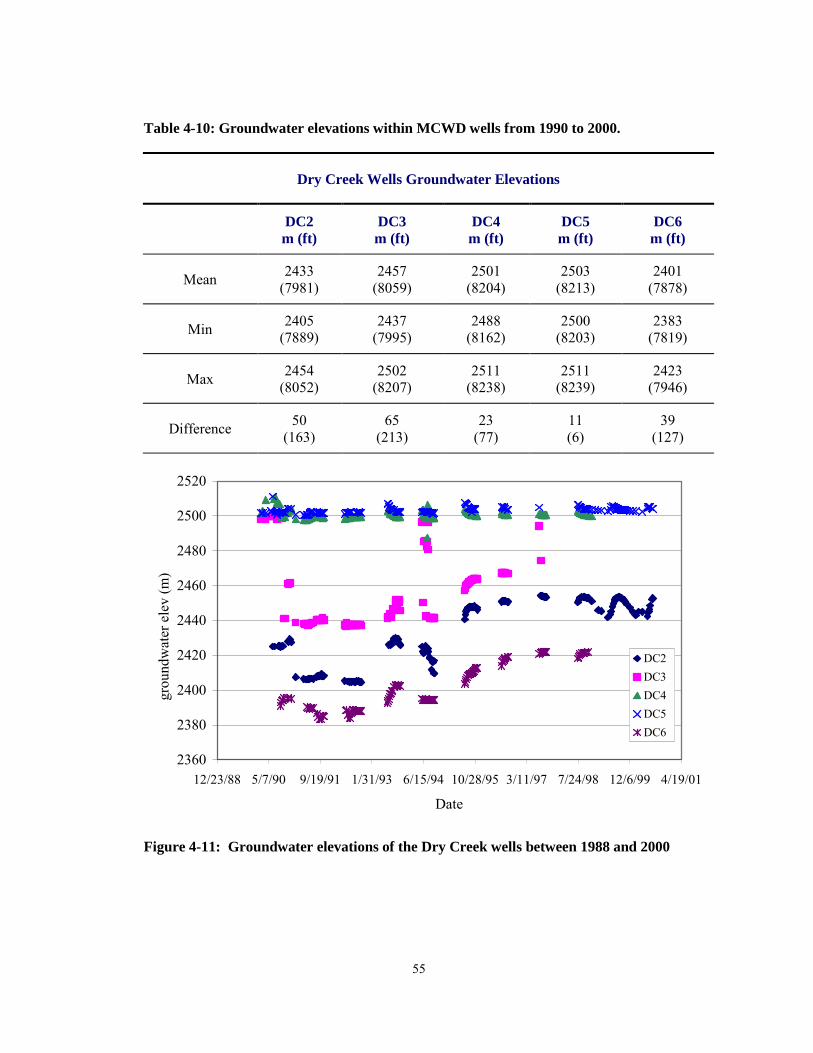
55
Table 4-10: Groundwater elevations within MCWD wells from 1990 to 2000.
Dry Creek Wells Groundwater Elevations
DC2 m (ft)
DC3 m (ft)
DC4 m (ft)
DC5 m (ft)
DC6 m (ft)
Mean 2433 (7981)
2457 (8059)
2501 (8204)
2503 (8213)
2401 (7878)
Min 2405 (7889)
2437 (7995)
2488 (8162)
2500 (8203)
2383 (7819)
Max 2454 (8052)
2502 (8207)
2511 (8238)
2511 (8239)
2423 (7946)
Difference 50 (163)
65 (213)
23 (77)
11 (6)
39 (127)
2360
2380
2400
2420
2440
2460
2480
2500
2520
12/23/88 5/7/90 9/19/91 1/31/93 6/15/94 10/28/95 3/11/97 7/24/98 12/6/99 4/19/01
Date
grou
ndw
ater
ele
v (m
)
DC2 DC3DC4DC5DC6
Figure 4-11: Groundwater elevations of the Dry Creek wells between 1988 and 2000
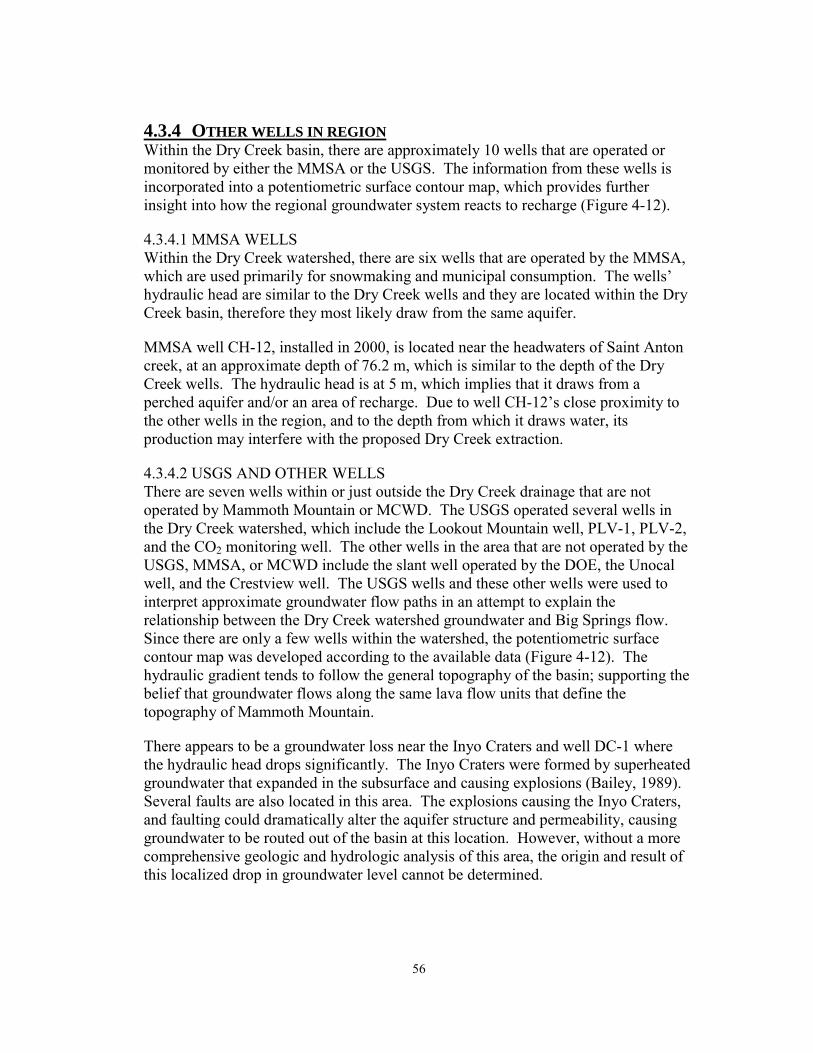
56
4.3.4 OTHER WELLS IN REGION Within the Dry Creek basin, there are approximately 10 wells that are operated or monitored by either the MMSA or the USGS. The information from these wells is incorporated into a potentiometric surface contour map, which provides further insight into how the regional groundwater system reacts to recharge (Figure 4-12).
4.3.4.1 MMSA WELLS Within the Dry Creek watershed, there are six wells that are operated by the MMSA, which are used primarily for snowmaking and municipal consumption. The wells� hydraulic head are similar to the Dry Creek wells and they are located within the Dry Creek basin, therefore they most likely draw from the same aquifer.
MMSA well CH-12, installed in 2000, is located near the headwaters of Saint Anton creek, at an approximate depth of 76.2 m, which is similar to the depth of the Dry Creek wells. The hydraulic head is at 5 m, which implies that it draws from a perched aquifer and/or an area of recharge. Due to well CH-12�s close proximity to the other wells in the region, and to the depth from which it draws water, its production may interfere with the proposed Dry Creek extraction.
4.3.4.2 USGS AND OTHER WELLS There are seven wells within or just outside the Dry Creek drainage that are not operated by Mammoth Mountain or MCWD. The USGS operated several wells in the Dry Creek watershed, which include the Lookout Mountain well, PLV-1, PLV-2, and the CO2 monitoring well. The other wells in the area that are not operated by the USGS, MMSA, or MCWD include the slant well operated by the DOE, the Unocal well, and the Crestview well. The USGS wells and these other wells were used to interpret approximate groundwater flow paths in an attempt to explain the relationship between the Dry Creek watershed groundwater and Big Springs flow. Since there are only a few wells within the watershed, the potentiometric surface contour map was developed according to the available data (Figure 4-12). The hydraulic gradient tends to follow the general topography of the basin; supporting the belief that groundwater flows along the same lava flow units that define the topography of Mammoth Mountain.
There appears to be a groundwater loss near the Inyo Craters and well DC-1 where the hydraulic head drops significantly. The Inyo Craters were formed by superheated groundwater that expanded in the subsurface and causing explosions (Bailey, 1989). Several faults are also located in this area. The explosions causing the Inyo Craters, and faulting could dramatically alter the aquifer structure and permeability, causing groundwater to be routed out of the basin at this location. However, without a more comprehensive geologic and hydrologic analysis of this area, the origin and result of this localized drop in groundwater level cannot be determined.
57
Elevation (meters)2104 - 22132214 - 23222323 - 24322433 - 25412542 - 26512652 - 27602761 - 28702871 - 29792980 - 30893090 - 31983199 - 33083309 - 34173418 - 3527No DataMammoth Mtn Wellsð
USGS and Other Wellsð
MCWD Wellsð
Watershed BoundaryGroundwater Elevation Dry CreekOwens River
Legend
ð
ð ð
ðð
ð
ð ð
ð
ð
ððð
ð
ð
ð ðððð
ð
Ow ens River
Dry Cree
k
6 0 6 12 Kilometers
N
2256 m
2591 m
2424 m
Figure 4-12: Groundwater elevation contours and local wells
58
4.3.5 CHEMICAL ANALYSES Chemical analyses of the groundwater within the Dry Creek basin can help determine the time required for vertical recharge, where areas of recharge are located, and the age of the groundwater. Chemical mixing models of Big Springs may provide further insight into the relationship that the Dry Creek watershed has with Big Springs. Further chemical analysis is recommended before this relationship can be appropriately evaluated.
4.3.5.1 CARBON ANALYSIS Groundwater sampling by the USGS has shown that many of the cold springs and wells lower on the flanks of Mammoth Mountain are rich in dissolved CO2. This is similar in composition to the CO2 in steam vents high on the mountain and in soil CO2 within the tree-kill areas (Evans, et al., 2000). Over the past 10 years, the level of CO2 and total dissolved carbon has increased significantly in the upper reaches of the watershed, which has increased the overall acidity of the groundwater (Table 4-11). The increase in carbon originates from a deep underground storage reservoir of abiogenic carbon, which has seeped into the groundwater system (Sorey, USGS, personal communication, 2000). The USGS CO2 monitoring well, located north of Saint Anton Creek and southwest of MMSA CH-12 well, depicts an increase in the amount of CO2 in the area. The pH in this well is more acidic than the Dry Creek DC-2B and DC-6 wells. A chemical analysis of the MCWD wells conducted in 1988 and 1998 concluded that water from all six wells was within drinking water standards (Appendix C). The increased acidity within the groundwater may cause some of the wells in the region to become corroded. This may lead to an increase in cost for the MCWD, should they need to replace the wells or ensure that the elevated corrosion will not affect water quality standards.
59
Table 4-11: Carbon chemistry for wells and springs in Dry Creek drainage
Well Date T ºC
Specific Conductance pH Alkalinity
mg/kg CO2
mg/kg
Total Dissolved Carbon mg/kg
8/29/881 -- 460 7.3 256 (20) (56)
DC-2B
10/8/98 7.8 710 6.10 445 735 288
9/12/902 -- 330 8.1 194 (16) (43)
DC-6
10/10/98 7.1 730 6.42 483 386 200
CH123 9/9/99 3.0 164 5.08 96 1910 540
CH12 spring4 8/24/97 3.0 206 5.17 133 2240 636
Notes: 1Values in ( ) computed from lab values of alkalinity and pH. 2Values in ( ) computed from lab alkalinity and pH = 7.3 3Well drilled in July-August 1999 near Chair 12 4Spring north of base of Chair 12
4.3.5.2 TEMPERATURE ANALYSIS Analysis of the temperature of the groundwater and springs within the Dry Creek basin helps describe or pinpoint the location of groundwater circulation and recharge. Groundwater with a temperature close to the local average annual surface temperature belongs to the shallow active water cycle, circulation being limited to 100 m, and rarely 200 m (Mazor, 1997). The groundwater elevation within the Dry Creek well field is approximately 152 m (500 ft) below the surface, with a temperature of approximately 7 °C, which is similar to the local average annual surface temperature. Cold groundwater may represent snow-water recharge (Mazor, 1997), and the
60
groundwater is coldest at the CH-12 well and spring. Therefore, the area near the CH-12 well is possibly an area of recharge (Table 4-11). The groundwater elevation is shallow near CH-12, with a hydraulic head of approximately 5.2 m (17 ft), which may also depict a recharge zone. Thus, the greatest amount of recharge occurs within the upper elevations of the watershed. To improve our understanding of recharge and groundwater circulation patterns, groundwater temperature analysis should be conducted approximately four times a year (Abbot et al., 2000).
4.3.5.3 GROUNDWATER DATING Groundwater dating provides an approximate age of the aquifer, further insight into recharge, and indicates if two sites are hydraulically linked. Analyzing the groundwater age at the Dry Creek wells and at Big Springs coupled with a chemical mixing model may provide more information of the Big Springs Dry Creek link. Currently, the methodologies used to age groundwater include CFCs, Tritium, 3Helium (3He)- Tritium comparison, 4Helium or by using radiocarbon and 13C (Mazor, 1997).
Before 1952, the ambient concentration of tritium within the atmosphere was 5 tritium units (TU). Therefore, the groundwater is past the age of 1952 when tritium is greater than 5 TU (Table 4-12). The wells sampled within the Dry Creek basin have levels of tritium that are greater than the ambient concentration, which implies that the groundwater is less than 50 years old. Tritium values that range between 6.7 to 26.7 TU indicate that groundwater residence times may vary from less than 1 year to in excess of 30 years (Abbot et al., 2000).
The USGS currently collects chemical analysis for δ18O, δD, and 3H, which can provide information on the location of recharge and the effects of evapotranspiration (Abbot et al., 2000). The partitioning between δ18O and δD have distinct signatures that depicts recharge regions and/ or areas where significant evapotranspiration has occurred. Therefore, further testing and analysis of these data is suggested to improve the understanding of the overall flow patterns and recharge to the system.

61
Table 4-12: Chemical analysis of Dry Creek Wells, provided by the USGS (Evans et al., 2000)
Site Date
T ºC
Cond. µµµµS/cm
[O2] mg/L pH alk.
mmol/L pCO2 atm
δδδδD %0
δδδδ18O %0
T TU
δδδδ13C- DIC %0
δδδδ13C- CO2%0
14C pmC
3He/4He R/RA
DC-2 Oct-98 7.8 710 1.8 6.09 7.29 0.277 -108.6 NA NA -5.36 NA 2.2 NA
DC-6 Oct-98 7.1 731 5.6 6.41 7.92 0.144 -108.4 NA NA -5.37 NA 4.7 4.2
CH12W (Sep-99) 3.0 147 3.2 5.07 1.49 0.568 NA NA NA -5.31 -4.79 NA 3.8
MMSA1 Aug-96 5.3 229 7.3 5.43 1.79 0.309 -105.6 -14.86 10.1 -5.87 NA 3.8 4.5
MMSA2B Aug-96 10.1 372 0.0 5.79 3.44 0.280 -109.1 -15.12 14.3 -7.05 NA 5.1 4.2
MMSA3 Oct-96 7.3 73 5.4 6.02 0.54 0.026 -110.0 -15.14 NA -22.5 NA 112 NA
62
4.3.6 MODELING A model of the groundwater system using Visual MODFLOW was attempted, yet proved unsuccessful due to a lack of information about the hydrogeologic system. The conceptual model of the Dry Creek groundwater combines the main features of the geology and hydrology that control the flow of the groundwater system (Committee on Fracture Characterization, 1996). These features include the basin-wide hydraulic head levels, hydraulic conductivities, vertical recharge rates and the geometry of the aquifer. Even a simple model within the Dry Creek basin, which attempts to determine the potential drawdown effects associated with groundwater extraction requires extensive input parameters. Knowledge of the recharge and infiltration rate to the system is required; however typically there is non-uniform infiltration rates associated within a fractured flow medium (Pruess et al., 1999). Groundwater recharge within the Dry Creek basin appears non-uniform, and thorough knowledge of the location and the amount of the recharge is necessary before simulation of groundwater flow and/ or extraction.
In order to construct a robust model of the groundwater system, one needs to accurately understand the hydrogeology of the area. Successful fractured groundwater flow models require an extensive knowledge of the fracture system in order to design and simulate flow and transport in a permeable rock mass intersected by some fracture zones (Fillion and Noyer, 1996). Our knowledge of the fractured system in the Dry Creek basin is based on the well geology cross-sections and the geology map of the entire Long Valley Caldera region (Bailey, 1989). The geology of the Dry Creek watershed is very complex, due to multiple faults and lava flows, and geothermal activity. Therefore, we lack the knowledge about the geology of the area to model the groundwater flow within a fractured media.
Visual MODFLOW simulates groundwater flow, transport, changes in hydraulic head, and the aquifer response to natural fluctuations and groundwater extraction. In order to run a simulation, the model requires hydraulic head and hydraulic conductivity distributions, knowledge of aquifer geometry, and an estimate of recharge (Waterloo Inc, 1999). The model also requires data collected in the field in order to calibrate the model. The hydraulic head distribution within the Dry Creek watershed is not well known due to a lack of regular well monitoring.
The variations in hydraulic conductivities also create a problem with model calibration. In general, the heterogeneous hydraulic conductivities due to faults and fractures make input of this model parameter difficult (Anderson and Woessner, 1992). The limited quantity of well bore logs from wells drilled in the basin are in many cases incomplete and or lacking sufficient detail to construct an accurate aquifer geometry required to establish model boundaries. Therefore, groundwater flow paths cannot be assessed, rendering a groundwater model of this system inaccurate. Due to the lack of information and the complexity of the hydrogeology, the model was not fully developed.
63
Future groundwater modeling of the Dry Creek basin requires further testing and groundwater analysis in order to improve the connection between the surface and groundwater systems.
4.3.7 GROUNDWATER DISCUSSION The water balance calculates the total change in groundwater storage. Since there is little data regarding recharge rates, we assume that the groundwater storage is equivalent to recharge. However the change in storage may not accurately represent the amount of recharge since the groundwater is located at a considerable depth below the surface (152 m). Faulting can either help or hinder groundwater recharge. Therefore, there may be a delay between the initial infiltration and response of the aquifer if water is diverted by fractures or blocked by faults (Lee and Lee, 2000). Due to the complex hydrogeology of the area, some of the recharge may be leaving the system via faults, which may supply water to the local groundwater, and the regional groundwater system.
64
Chapter 5 Water Balance Results 5.1 WATER BALANCE A hydrologic balance for the Dry Creek drainage was calculated to determine the amount of groundwater recharge for the proposed well field and for the entire watershed. Two water balances were developed:
��The well field water balance uses only the upper one third (22 km2) of the watershed to calculate the recharge for the Dry Creek wells;
��The basin water balance incorporates the entire topographical watershed to calculate the recharge to the entire basin.
The overall water balance equation used to calculate the potential recharge for the well field and the entire watershed is:
∈±−−=∆ UETPPR
Where ∆PR is the potential recharge to the groundwater system. P is the precipitation, which is comprised of snow water equivalence (SWE) and rainfall. ET is the evapotranspiration, which is the sum of the basin-wide evaporation and transpiration. U is the consumptive use of water within the watershed. Epsilon represents the sum of the errors associated with the estimation of the variables.
The main assumption for the water balance calculation is that the potential recharge supplies the aquifer with an amount of water annually. Therefore, the analysis of our water balance results determine whether the MCWD and MMSA can rely on the Dry Creek watershed as a reliable source during drought year scenarios, with the goal of sustaining the aquifer�s production capability over the long-term.
Our main concern focuses on the water balance for the proposed well field, as this is the region that provides recharge to the wells. The MCWD and MMSA seek the extraction of 3.7 x 10⁶ m3 yr-1 (3,000 AFY) from the Dry Creek wells to provide additional capacity when the demand is most formidable. In order to determine if the Dry Creek basin can support this extraction amount, a water balance was calculated determining the amount of annual groundwater recharge during a dry year (1992) and a normal year (1996) (Chapter 4.1.2). Since the proposed groundwater extraction will be relied upon in times of drought, we based our recommendations on the 1992 results. The basin water balance results, as opposed to the well field balance results, become significant when we recommend how to assess the potential impacts to downstream resources Chapter 7.2.2.

65
5.2 WELL FIELD WATER BALANCE RESULTS 5.2.1 INPUTS 5.2.1.1 RAINFALL The upper zone of rainfall represents the well field area. The rainfall in 1992 accounted for 14% of the total precipitation, whereas rainfall in 1996 accounted for 23% (Table 5-1). Measurements of rainfall varied up to 75 % between the upper and lower rainfall zones (Table 5-6). We estimate that uncertainty associated with rainfall to be 75% (Chapter 4.2.1.3).
Table 5-1: Rainfall totals for well field water balance
Year Rain Gauge
Measurement (mm)
Area (km2)
Total rainfall (m3)
Percent of total precipitation
1992 113 22 2.5 x 10⁶ 14%
1996 296 22 6.5 x 10⁶ 23%
5.2.1.2 SWE As described in Chapter 4.2.2, the well field area was delineated into four zones according to aspect, elevation and SWE measurement sites. In order to determine the total amount of SWE for the well field, the total SWE for each zone was calculated by extrapolating a point value over the entire zone, with all totals aggregated to determine the total amount of precipitation from SWE. For 1992, the total SWE from the well field area was 1.5 x 10⁷ m3 (12,000 AF), accounting for 86% of the total precipitation. In 1996 SWE was estimated to be 2.2 x 10⁷ m3 (17,800 AF), comprising 77% of the total annual precipitation (Table 5-2).
SWE varied spatially among the different zones in the well field region; the four SWE sites range by a factor of 2 within a 415 m elevation difference. SWE zone 1 contributed the greatest amount of precipitation, approximately 35% for 1992 and 1996. Whereas SWE zone 4 accounted for approximately 9% of the total precipitation.
The zones with the greatest elevation, SWE zones 1 and 2, represent 62% of the well field area and contribute 70% to the total SWE. However, there are other variables besides elevation that contribute to the increased SWE. Aspect, topography and vegetation are also integral to the amount of SWE that was captured within these zones. Timbered areas can decrease the amount of snow accumulation due to interception, and subsequent evaporation from the canopy decreases the amount of measured SWE.
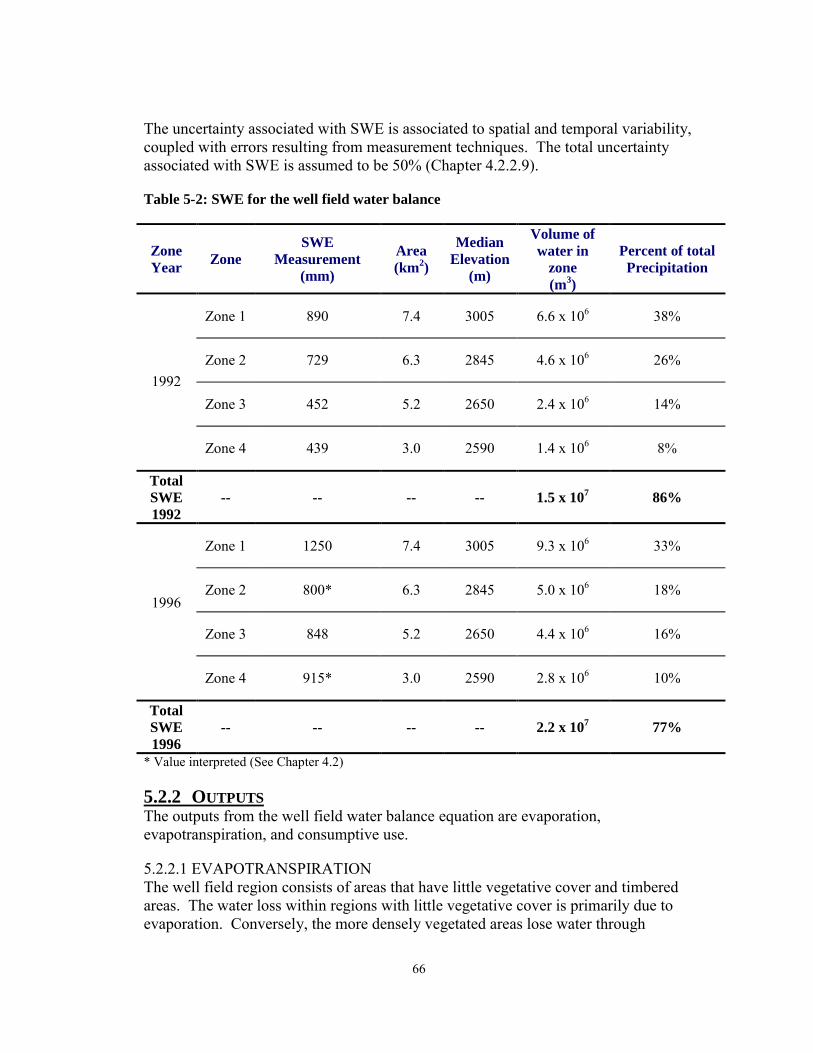
66
The uncertainty associated with SWE is associated to spatial and temporal variability, coupled with errors resulting from measurement techniques. The total uncertainty associated with SWE is assumed to be 50% (Chapter 4.2.2.9).
Table 5-2: SWE for the well field water balance
Zone Year Zone
SWE Measurement
(mm)
Area (km2)
Median Elevation
(m)
Volume of water in
zone (m3)
Percent of total Precipitation
Zone 1 890 7.4 3005 6.6 x 10⁶ 38%
Zone 2 729 6.3 2845 4.6 x 10⁶ 26%
Zone 3 452 5.2 2650 2.4 x 10⁶ 14% 1992
Zone 4 439 3.0 2590 1.4 x 10⁶ 8%
Total SWE 1992
-- -- -- -- 1.5 x 10⁷ 86%
Zone 1 1250 7.4 3005 9.3 x 10⁶ 33%
Zone 2 800* 6.3 2845 5.0 x 10⁶ 18%
Zone 3 848 5.2 2650 4.4 x 10⁶ 16%
1996
Zone 4 915* 3.0 2590 2.8 x 10⁶ 10%
Total SWE 1996
-- -- -- -- 2.2 x 10⁷ 77%
* Value interpreted (See Chapter 4.2)
5.2.2 OUTPUTS The outputs from the well field water balance equation are evaporation, evapotranspiration, and consumptive use.
5.2.2.1 EVAPOTRANSPIRATION The well field region consists of areas that have little vegetative cover and timbered areas. The water loss within regions with little vegetative cover is primarily due to evaporation. Conversely, the more densely vegetated areas lose water through

67
transpiration and evaporation. As mentioned previously, literature values were used to estimate the total amount of evaporation from the Dry Creek basin. The literature values were derived from an evaporation study conducted in the Dry Creek drainage basin (Leydecker and Melack 1999). Due to the unavailability of 1996 evaporation data, we used data collected from 1991; and since 1991 was a dry year, use of this value does not accurately represent the amount of water loss through evaporation. A brief description of the evaporation data is in Chapter 4.2.3.
Approximately 7.4 km2 or 37% of the well field area has little vegetative cover. The water loss due to evaporation was 3.1 x 10⁶ m3 (2,500 AF) for 1992 and 4.2 x 10⁶ m3 (3,400 AF) for 1996 (Table 5-3). In 1992, 9% of the total precipitation evaporated, whereas in 1996, 8% of the total precipitation evaporated, which equals approximately 50% of the SWE in zone 1. The remaining 63% of the well field area�s evaporative loss was from evapotranspiration.
The total water loss due to evapotranspiration was interpreted from literature values. We used a value of 373 mm yr-1 (Grelle 1997) as our estimate for the water loss due to evapotranspiration, and extrapolated that value over the 14.6 km2 area to estimate total loss from evapotranspiration for the well field region. The evapotranspiration value was used for both drought and average years. Other studies that have estimated the amount of evapotranspiration in Sierra Nevada river basins report that the annual loss due to evapotranspiration is 50% of the total precipitation (Kattelman et al. 1983). In 1992, the evaporative loss for Dry Creek is almost equal to 50% of the precipitation. However during average years the rate of evapotranspiration may be significantly different than drought water years. Our recommendations in Chapter 7 address the need for more precise evaporation estimates and suggest further data collection.
Although the loss from evapotranspiration is assumed to be the same for both water years, the percentage loss relative to precipitation is different. A greater percentage of the water was lost due to evapotranspiration (32%) during the dry year (1992) then in 1996 when 19% of the total precipitation was lost due to evapotranspiration (Table 5-3).
In 1992, the total evaporative loss for the well field represents 50% of the total precipitation; therefore 50% of the precipitation is available for consumptive use and groundwater recharge. In 1996, the total evaporative loss was approximately 35% of the total precipitation.
Given that the evaporation and evapotranspiration values are interpreted from the literature data, the uncertainty associated with their use was estimated to be 50%, as discussed in Chapter 4.2.3.3.
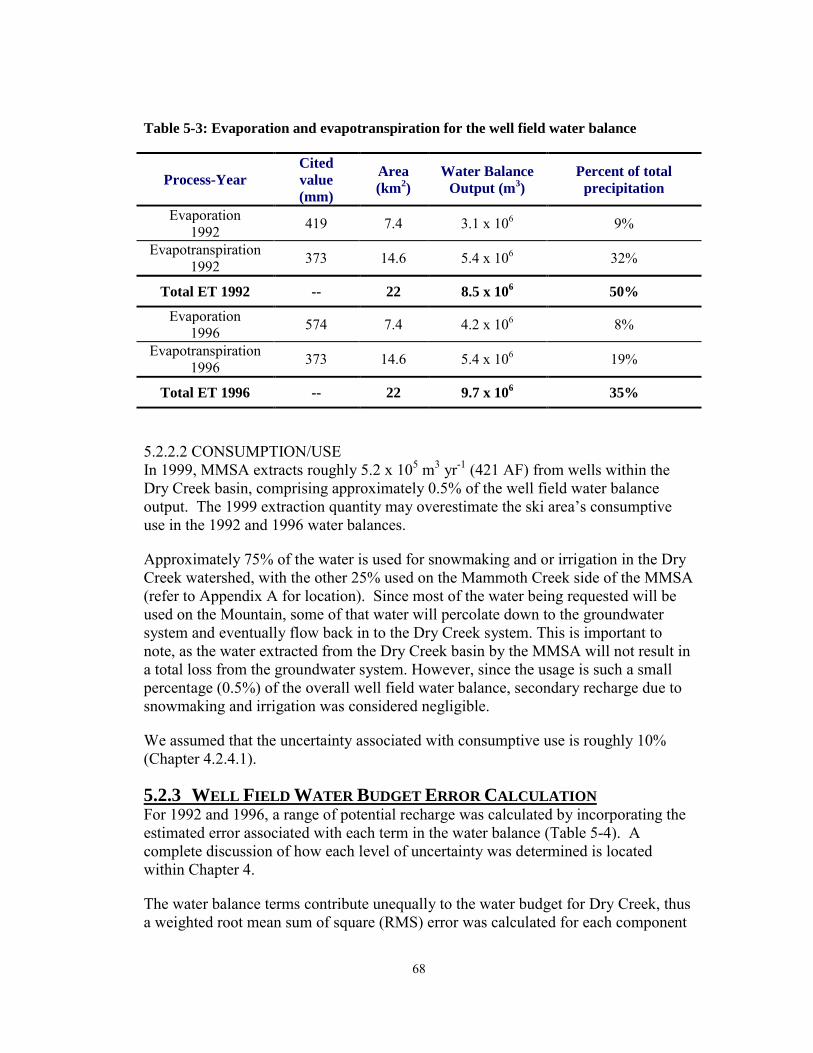
68
Table 5-3: Evaporation and evapotranspiration for the well field water balance
Process-Year Cited value (mm)
Area (km2)
Water Balance Output (m3)
Percent of total precipitation
Evaporation 1992 419 7.4 3.1 x 10⁶ 9%
Evapotranspiration 1992 373 14.6 5.4 x 10⁶ 32%
Total ET 1992 -- 22 8.5 x 10⁶ 50%
Evaporation 1996 574 7.4 4.2 x 10⁶ 8%
Evapotranspiration 1996 373 14.6 5.4 x 10⁶ 19%
Total ET 1996 -- 22 9.7 x 10⁶ 35% 5.2.2.2 CONSUMPTION/USE In 1999, MMSA extracts roughly 5.2 x 10⁵ m3 yr-1 (421 AF) from wells within the Dry Creek basin, comprising approximately 0.5% of the well field water balance output. The 1999 extraction quantity may overestimate the ski area�s consumptive use in the 1992 and 1996 water balances.
Approximately 75% of the water is used for snowmaking and or irrigation in the Dry Creek watershed, with the other 25% used on the Mammoth Creek side of the MMSA (refer to Appendix A for location). Since most of the water being requested will be used on the Mountain, some of that water will percolate down to the groundwater system and eventually flow back in to the Dry Creek system. This is important to note, as the water extracted from the Dry Creek basin by the MMSA will not result in a total loss from the groundwater system. However, since the usage is such a small percentage (0.5%) of the overall well field water balance, secondary recharge due to snowmaking and irrigation was considered negligible.
We assumed that the uncertainty associated with consumptive use is roughly 10% (Chapter 4.2.4.1).
5.2.3 WELL FIELD WATER BUDGET ERROR CALCULATION For 1992 and 1996, a range of potential recharge was calculated by incorporating the estimated error associated with each term in the water balance (Table 5-4). A complete discussion of how each level of uncertainty was determined is located within Chapter 4.
The water balance terms contribute unequally to the water budget for Dry Creek, thus a weighted root mean sum of square (RMS) error was calculated for each component
69
(Appendix D). In order to determine the total error associated with the inputs and outputs a weighted RMS error was calculated for both terms (Table 5-4). The percent of error relative to the calculated value decreases with an increase in the number of measurements. In terms of the total inputs, SWE has 4 measurements for the well field; therefore the percent of error is 17%. The percent of error for rainfall is equal to the level of uncertainty since there is only one point value for the well field. In order to calculate the error relative to the total inputs, a weighted RMS error was calculated for the combination of SWE and rain. Since SWE contributes the greatest percentage of the error, the error for the total inputs was normalized relative to the SWE error; the input error term is 14% of the calculated value. In terms of the outputs, evapotranspiration has two measurements whereas consumptive use has one value. The error relative to the outputs is normalized relative to the evapotranspiration and is larger than the input term since there are fewer measurements of output. The percent of error for the outputs is approximately 25% of the calculated value. The error associated with output is greater than the input term since there is more data available for the input terms.
In order to determine a range in potential recharge, the two extremes were calculated. The largest potential recharge was calculated by subtracting smallest output value (outflow � error) from the greatest input value (inflow + error). The smallest potential recharge was determined by subtracting the greatest outflow (outflow + error) from the lowest inflow value (inflow � error). The calculated range represents the extreme cases (Table 5-5), enabling our recommendations in Chapter 7.
In 1996, the potential recharge range is from 1.2 x 10⁷ m3 (9,700AF) to 2.4 x 10⁷ m3 (19,500 AF), which is greater than the proposed extraction rate of 3.7 x 10⁶ m3 yr-1 (3,000 AFY) (Table 5-5). Hence, there is enough recharge to support the proposed extraction, and the proposed pumping rate is unlikely to cause significant impacts to the Dry Creek aquifer during average water year scenarios.
Our purpose is to determine if there is enough groundwater recharge during consecutive dry years to support the annual extraction of 3.7 x 10⁶ m3 (3,000 AFY), without causing an over-draft to the aquifer. Therefore, the results from the 1992 water balance are used as the basis for our recommendations. According to the smallest results for 1992, the potential recharge equals 3.5 x 10⁶ m3 (2,800 AF), which is approximately 29% of the potential recharge to the well field in an average year (Table 5-5).

70
Table 5-4: Error calculations from well field water balance
Year Water Balance Variable
Calculated values m3
Level of Uncertainty for each point value
Weighted Root Mean Square Error
m3
Percent Error of Calculated Value
SWE 1.5 x 10⁷ 50% ± 2.6 x 10⁶ 17%
Rain 2.5 x 10⁶ 75% ± 1.9 x 10⁶ 75%
Total Inputs 1.7 x 10⁷ -- ±±±± 2.5 x 10⁶ 14%
Evapotranspiration 8.5 x 10⁶ 50% ± 2.4 x 10⁶ 28%
Consumptive Use 5.2 x 10⁵ 10% ± 5.2 x 10⁴ 10%
1992
Total Outputs 9.1 x 10⁶ -- ±±±± 2.3 x 10⁶ 25%
SWE 2.2 x 10⁷ 50% ± 3.5 x 10⁶ 16%
Rain 6.5 x 10⁶ 75% ± 4.9 x 10⁶ 75%
Total Inputs 2.8 x 10⁷ -- ± 3.8 x 10⁶ 14%
Evapotranspiration 9.7 x 10⁶ 50% ± 2.5 x 10⁶ 26%
Consumptive Use 5.2 x 10⁵ 10% ± 5.2 x 10⁴ 10%
1996
Total Outputs 1.0 x 10⁷ -- ±±±± 2.4 x 10⁶ 24%

71
Table 5-5: Range of potential recharge for the well field based on error analysis.
Year Input/ Output High
m3 (AF)
Low m3 (AF)
Midpoint m3 (AF)
Input ± error 2.0 x 10⁷ (a)
1.5 x 10⁷ (b) 1.8 x 10⁷
Output ± error 1.1 x 10⁷ (c)
6.8 x 10⁶ (d) 8.9 x 10⁶ 1992
Potential recharge range 1.3 x 10⁷ (10,500)
(a-d)
3.5 x 10⁶ (2,800)
(b-c)
8.3 x 10⁶ (6,700)
Input ± error 3.2 x 10⁷ (e)
2.4 x 10⁷ (f) 2.8 x 10⁷
Output ± error 1.3 x 10⁷ (g)
7.8 x 10⁶ (h) 1.0 x 10⁷ 1996
Potential recharge range 2.4 x 10⁷ (19,500)
(e-h)
1.2 x 10⁷ (9,700)
(f-g)
1.8 x 10⁷ (14,600)
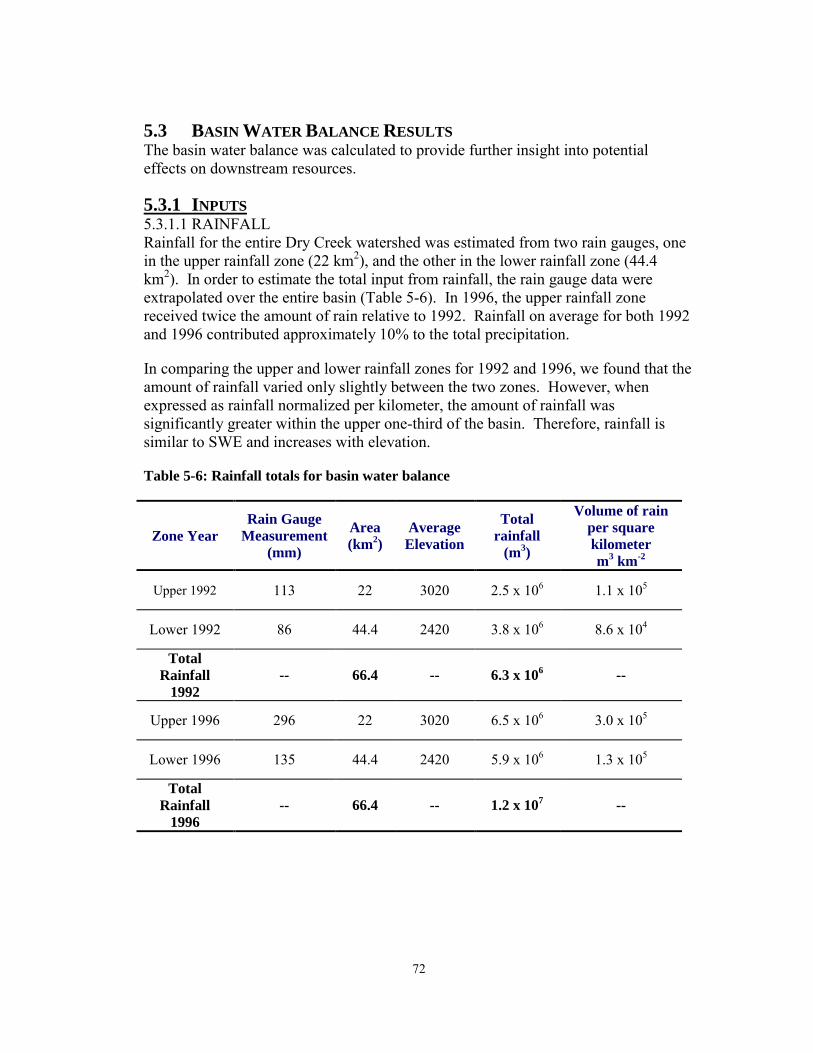
72
5.3 BASIN WATER BALANCE RESULTS The basin water balance was calculated to provide further insight into potential effects on downstream resources.
5.3.1 INPUTS 5.3.1.1 RAINFALL Rainfall for the entire Dry Creek watershed was estimated from two rain gauges, one in the upper rainfall zone (22 km2), and the other in the lower rainfall zone (44.4 km2). In order to estimate the total input from rainfall, the rain gauge data were extrapolated over the entire basin (Table 5-6). In 1996, the upper rainfall zone received twice the amount of rain relative to 1992. Rainfall on average for both 1992 and 1996 contributed approximately 10% to the total precipitation.
In comparing the upper and lower rainfall zones for 1992 and 1996, we found that the amount of rainfall varied only slightly between the two zones. However, when expressed as rainfall normalized per kilometer, the amount of rainfall was significantly greater within the upper one-third of the basin. Therefore, rainfall is similar to SWE and increases with elevation.
Table 5-6: Rainfall totals for basin water balance
Zone Year Rain Gauge
Measurement (mm)
Area (km2)
Average Elevation
Total rainfall
(m3)
Volume of rain per square kilometer m3 km-2
Upper 1992 113 22 3020 2.5 x 10⁶ 1.1 x 10⁵
Lower 1992 86 44.4 2420 3.8 x 10⁶ 8.6 x 10⁴
Total Rainfall
1992 -- 66.4 -- 6.3 x 10⁶ --
Upper 1996 296 22 3020 6.5 x 10⁶ 3.0 x 10⁵
Lower 1996 135 44.4 2420 5.9 x 10⁶ 1.3 x 10⁵
Total Rainfall
1996 -- 66.4 -- 1.2 x 10⁷ --
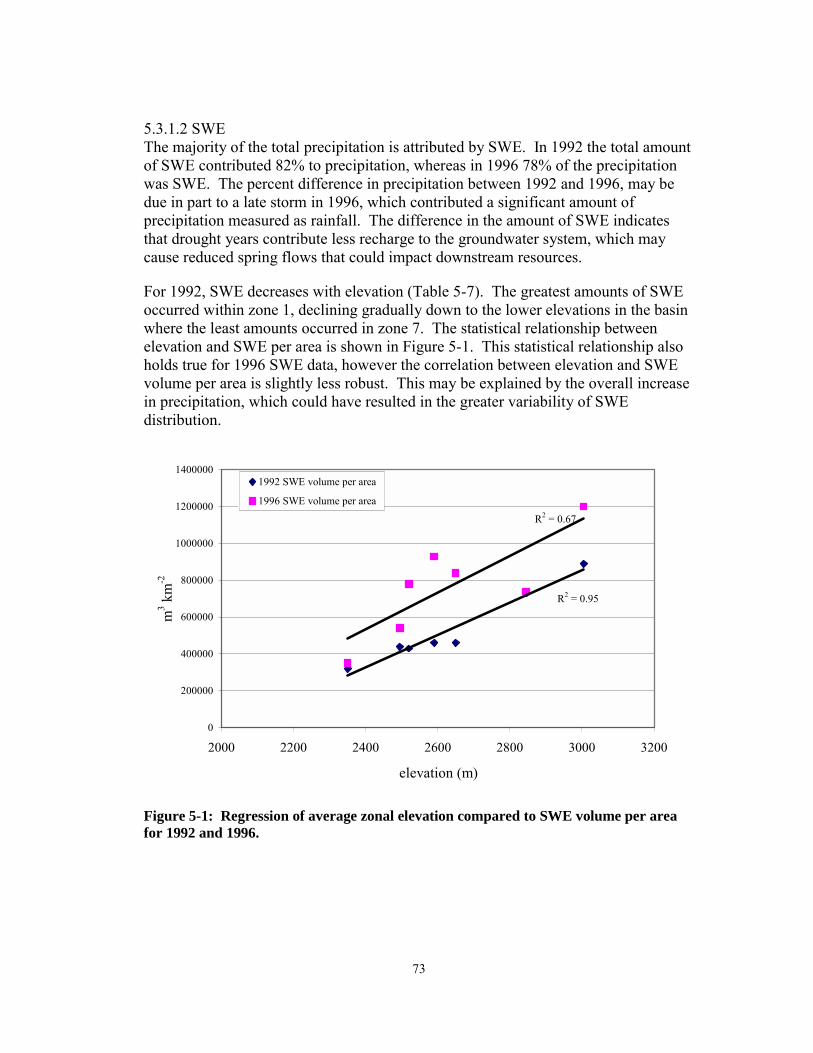
73
5.3.1.2 SWE The majority of the total precipitation is attributed by SWE. In 1992 the total amount of SWE contributed 82% to precipitation, whereas in 1996 78% of the precipitation was SWE. The percent difference in precipitation between 1992 and 1996, may be due in part to a late storm in 1996, which contributed a significant amount of precipitation measured as rainfall. The difference in the amount of SWE indicates that drought years contribute less recharge to the groundwater system, which may cause reduced spring flows that could impact downstream resources.
For 1992, SWE decreases with elevation (Table 5-7). The greatest amounts of SWE occurred within zone 1, declining gradually down to the lower elevations in the basin where the least amounts occurred in zone 7. The statistical relationship between elevation and SWE per area is shown in Figure 5-1. This statistical relationship also holds true for 1996 SWE data, however the correlation between elevation and SWE volume per area is slightly less robust. This may be explained by the overall increase in precipitation, which could have resulted in the greater variability of SWE distribution.
R2 = 0.67
R2 = 0.95
0
200000
400000
600000
800000
1000000
1200000
1400000
2000 2200 2400 2600 2800 3000 3200
elevation (m)
m3 k
m-2
1992 SWE volume per area
1996 SWE volume per area
Figure 5-1: Regression of average zonal elevation compared to SWE volume per area for 1992 and 1996.

74
Table 5-7: SWE for the basin water balance
Zone Year
SWE Measurement
(mm)
Area (km2)
Average Elevation
(m)
Volume of water in zone (m3)
Volume of water relative
to area m3 km-2
Zone 1 1992 890 7.4 3005 6.6 x 10⁶ 8.9 x 10⁵
Zone 2 1992 729 6.3 2845 4.6 x 10⁶ 7.3 x 10⁵
Zone 3 1992 452 5.2 2650 2.4 x 10⁶ 4.6 x 10⁵
Zone 4 1992 439 3.0 2590 1.4 x 10⁶ 4.0 x 10⁵
Zone 5 1992 445 10.4 2520 4.6 x 10⁶ 4.4 x 10⁵
Zone 6 1992 318* 12.9 2495 4.1 x 10⁶ 3.2 x 10⁵
Zone 7 1992 203 21.0 2350 4.3 x 10⁶ 2.0 x 10⁵
Total SWE 1992 -- 66.4 -- 2.8 x 10⁷ --
Zone 1 1996 1250 7.4 3005 9.3 x 10⁶ 1.3 x 10⁶
Zone 2 1996 800* 6.3 2845 5.0 x 10⁶ 8.0 x 10⁵
Zone 3 1996 848 5.2 2650 4.4 x 10⁶ 8.4 x 10⁵
Zone 4 1996 915* 3.0 2590 2.8 x 10⁶ 9.3 x 10⁵
Zone 5 1996 784 10.4 2520 8.1 x 10⁶ 7.8 x 10⁵
Zone 6 1996 541 12.9 2495 7.0 x 10⁶ 5.4 x 10⁵
Zone 7 1996 348 21.0 2350 7.3 x 10⁶ 3.5 x 10⁵
Total SWE 1996 -- 66.4 -- 4.4 x 10⁷ --
* Values interpreted (Section 4.2.)
75
5.3.2 OUTFLOWS 5.3.2.1 EVAPOTRANSPIRATION For the basin wide water balance, the Dry Creek watershed was divided into two evapotranspiration zones, evaporation and evapotranspiration (Chapter 4.2.3). The evaporation zone for the basin is the same as that for the well field water balance, however the loss from the evapotranspiration zone increased since the vegetative area for the basin water balance is larger (approximately 90% of the total basin is vegetated.). As previously mentioned in section 5.2, the amount of evaporation and evapotranspiration were estimated from appropriate literature values. These values were then extrapolated over the entire region to determine the total water loss due to evaporation and evapotranspiration.
For 1992, the total evaporative water loss was 74% of the total precipitation into the basin, with 65% attributable to evapotranspiration and 9% due to evaporation (Table 5-8). According to the amount of water lost through evaporation and evapotranspiration, 26% of the precipitation is available for consumptive use and recharge.
For 1996, 46% of the total precipitation for the basin was lost due to total evapotranspiration, which leaves almost half of the precipitation available for recharge. The total evaporative loss in 1996 was greater than 1992, however this may not accurately represent the actual amount of water loss since we used evaporation data from 1991, which was a drought year (see Chapter 4.2.3.1). This issue is taken into account within our assigned uncertainty value of 50% for evapotranspiration. The uncertainty for evapotranspiration reflects the uncertainty in spatial variability and using a literature value for a basin with varying vegetation and topography.
76
Table 5-8: Evaporation and evapotranspiration for the basin water balance
Process-Year Cited value (mm)
Area (km2)
Water Balance Output (m3)
Percent of total precipitation
Evaporation 1992 419 7.4 3.1 x 10⁶ 9%
Evapotranspiration 1992 373 59 2.2 x 10⁷ 65%
Total Evapotranspiration
1992 -- 66.4 2.5 x 10⁷ 74%
Evaporation 1996 574 7.4 4.2 x 10⁶ 8%
Evapotranspiration 1996 373 59 2.2 x 10⁷ 39%
Total Evapotranspiration
1996 -- 66.4 2.6x 10⁷ 46%
5.3.2.2 CONSUMPTION/USE The amount of consumptive use is the same for both the well field and the total basin water balance, roughly 5.2 x 10⁵ m3 yr-1 (421 AF), which comprises approximately 0.7% of the basin wide water balance output.
As most of this water will be used for snowmaking and irrigation purposes on the Dry Creek side of Mammoth Mountain, the majority of the water will return to the groundwater system as recharge. However, since the usage is such a small percentage (0.7%) of the overall basin water balance, secondary recharge was not taken into account. As in the well field water balance we assumed that uncertainty associated with consumptive use is roughly 10% (Chapter 4.2.4.1).
5.3.3 BASIN ERROR CALCULATIONS Errors for the basin wide water balance were calculated in the same manner as that for the well field water balance (Chapter 5.2.3). The error terms for each term as well as the total inputs and outputs in the water balance were calculated by a weighted RMS error methodology (Table 5-9).
The SWE and rainfall zones in the basin water balance utilize one point for an area almost double in size compared to that of the well field water balance, which may increase the basin wide error for precipitation. The location of the rain gauges and SWE sites for the lower part of the watershed are at a lower elevation than the majority of their respective areas. By extrapolating the precipitation measurements
77
over the entire watershed, the aggregated value may not accurately represent the total precipitation. The uncertainty associated with spatial variability is taken into account within the error calculations. Since the error methodology is a weighted RMS error, the rainfall zones and the SWE zones that contribute the greatest amount of precipitation represent a larger percentage of the error. There is less error associated with the basin input terms since there are more data. There are 7 SWE zones and 2 rainfall zones; therefore the total input error is equal to 7% of the calculated value.
The error relative to the total output value is greater for the basin water balance than the well field water balance since there is the same amount of measurements for a greater area. The output error is equal to approximately 38% of the calculated value. The large error relative to output increases the range in potential recharge for the basin water balance.
The range in groundwater storage (high, low) for the basin wide water balance was also developed in the same manner as the well field balance (Table 5-11). The midpoint potential recharge for 1992 is half of the midpoint potential recharge for 1996, implying that the overall groundwater volume decreases from an average to a dry year. According to the smallest potential recharge for 1992, the combination of drought year conditions and the proposed extraction rate would result in an overall reduction in the amount of groundwater storage (Table 5-10). While the connection between the Dry Creek aquifer and Upper Owens aquifer is understood to be complex, our water balance results for the entire Dry Creek basin indicate that there is the potential for effects on downstream resources since the amount of groundwater will be reduced over consecutive drought years. However this value is based on our most conservative value and the midpoint value states that there is enough potential recharge to support extraction while maintaining downstream resources. We acknowledge that this is an important aspect of this project and we propose recommendations to determine the potential effects on downstream resources in the future (Chapter 7.2.2)
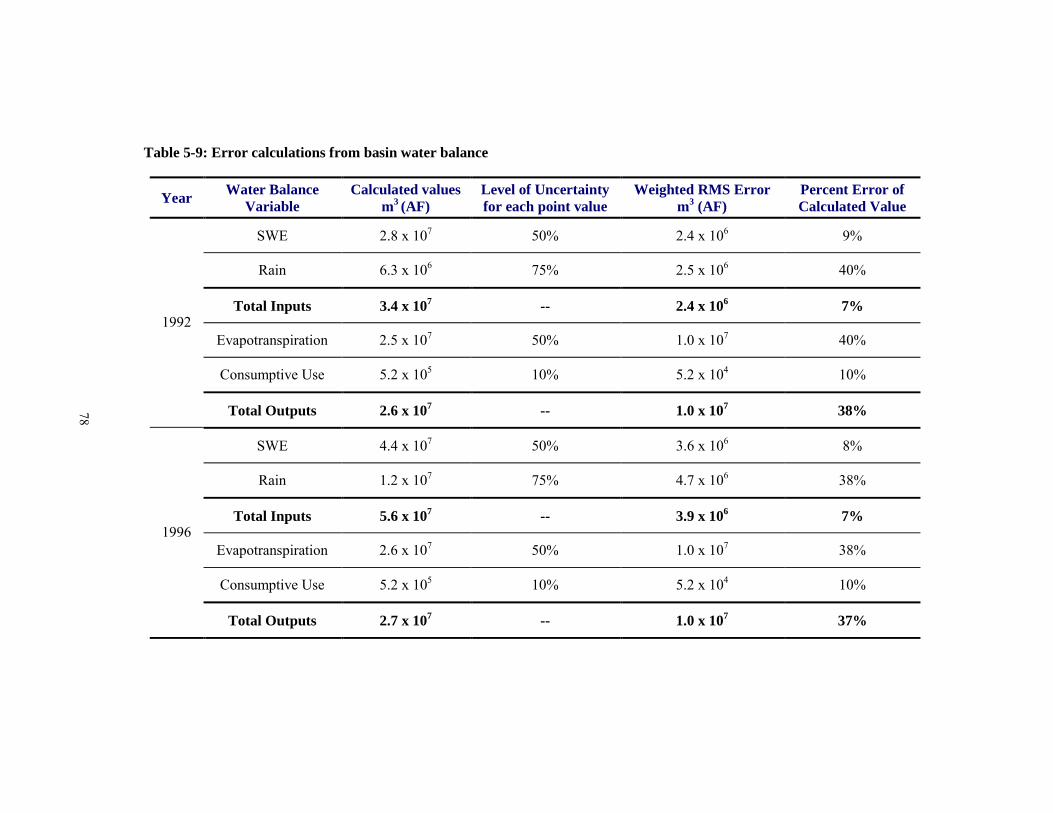
78
Table 5-9: Error calculations from basin water balance
Year Water Balance Variable
Calculated values m3 (AF)
Level of Uncertainty for each point value
Weighted RMS Error m3 (AF)
Percent Error of Calculated Value
SWE 2.8 x 10⁷ 50% 2.4 x 10⁶ 9%
Rain 6.3 x 10⁶ 75% 2.5 x 10⁶ 40%
Total Inputs 3.4 x 10⁷ -- 2.4 x 10⁶ 7%
Evapotranspiration 2.5 x 10⁷ 50% 1.0 x 10⁷ 40%
Consumptive Use 5.2 x 10⁵ 10% 5.2 x 10⁴ 10%
1992
Total Outputs 2.6 x 10⁷ -- 1.0 x 10⁷ 38%
SWE 4.4 x 10⁷ 50% 3.6 x 10⁶ 8%
Rain 1.2 x 10⁷ 75% 4.7 x 10⁶ 38%
Total Inputs 5.6 x 10⁷ -- 3.9 x 10⁶ 7%
Evapotranspiration 2.6 x 10⁷ 50% 1.0 x 10⁷ 38%
Consumptive Use 5.2 x 10⁵ 10% 5.2 x 10⁴ 10%
1996
Total Outputs 2.7 x 10⁷ -- 1.0 x 10⁷ 37%

79
Table 5-10: Calculated range of potential recharge for the Basin water balance based on error analysis
Year Input/ Output High m3 (AF)
Low m3 (AF)
Midpoint m3 (AF)
Input ± error 3.7 x 10⁷ (a)
3.2 x 10⁷ (b)
3.5 x 10⁷
Output ± error 3.6 x 10⁷ (c)
1.5 x 10⁷ (d)
2.6 x 10⁷ 1992
Potential recharge range
2.1 x 10⁷ (17,000)
(a-d)
-4.0 x 10⁶ (-3,200)
(b-c)
8.5 x 10⁶ (6,900)
Input ± error 6.0 x 10⁷ (e)
5.3 x 10⁷ (f)
5.7 x 10⁷
Output ± error 3.7 x 10⁷ (g)
1.7 x 10⁷ (h)
2.7 x 10⁷ 1996
Potential recharge range
4.4 x 10⁷ (35,700)
(e-h)
1.6 x 10⁷ (13,000)
(f-g)
3.0 x 10⁷ (24,400)
5.4 DISCUSSION The water balance method applied in this analysis utilized all water inputs and outputs to the hydrologic system in order to assess the potential hydrologic impacts created by the proposed extraction of 3.7 x 10⁶ m3 yr-1 (3,000 AF). The water balance was used to estimate the amount of potential recharge entering the Dry Creek groundwater system. The results indicate that there is enough potential recharge in the well field area to support extraction from the Dry Creek wells, which is described in Chapter 7. The calculated range of recharge for both the well field and basin water balance varies between -4.0 x 10⁶ m3 (-3,200 AF) and 4.4 x 10⁷ m3 (35,700 AF). A summary of the water balance results is found in Table 5-11.
According to the smallest basin estimate of groundwater recharge, the amount of groundwater within the basin declines during drought years. Reduction in the amount of groundwater for a drought year would be expected. One cannot only look at the smallest number, the range of values is important because it represents the amount of potential recharge that may occur. According to the range of potential recharge, only 30% of the range is less than the proposed extraction amount of 3.7 x 10⁶ m3 (3,000 AF). We did not conduct an analysis of the potential impacts to downstream resources; our recommendations suggest ways to improve the understanding between Dry Creek and Big Springs within Chapter 7.2.2.

80
Table 5-11: Results of well field and basin water budgets
Water Balance and year Potential recharge range m3 (AF)
Well field 1992
3.5 x 10⁶ to 1.3 x 10⁷
(2,800 to 10,500)
Well field 1996
1.2 x 10⁷ to 2.4 x 10⁷
(9,700to 19,500)
Basin 1992
-4.0 x 10⁶ to 2.1 x 10⁷
(-3,200 to 17,000)
Basin 1996
1.6 x 10⁷ to 4.4 x 10⁷
(13,000 to 35,700)
In calculating the basin wide water balance, we assumed that the amount of potential recharge occurs over the entire basin, however the amount of recharge is not uniform throughout. The majority of precipitation occurs within the upper reaches of the basin, which is also where the greatest amount of recharge occurs. Therefore, precipitation may actually enter the groundwater system before it arrives at the lower reaches of the basin. The well field water balance for represents approximately 98% of the basin wide potential recharge (Table 5-12). Since the majority of the precipitation occurs within the well field region, most of the recharge occurs here as well. Therefore, the recharge that occurs within the well field area is available for extraction. If the water has already infiltrated below the vadose zone by the time it reaches the lower regions of the watershed, the loss due to evapotranspiration may be a smaller amount. The error associated with total evapotranspiration is approximately 40% of the calculated output, which depicts a large range in the output term. Therefore, the actual amount of potential recharge may be greater in the basin water balance.

81
Table 5-12: Comparison of basin water balance to well field water balance.
Year Potential Recharge Midpoint Well Field
Potential Recharge Midpoint Basin
Percent Well Field to Basin Water Balance
1992 8.3 x 10⁶ 8.5 x 10⁶ 98%
1996 1.8 x 10⁷ 3.0 x 10⁷ 78%
The well field water balance is our primary concern with respect to the feasibility of extracting 3.7 x 10⁶ m3 yr-1 (3,000 AFY) from the Dry Creek wells. Since the proposed groundwater extraction will be relied upon in times of drought, we based our recommendations on the 1992 results. The basin water balance results are used to assess how this extraction will impact downstream resources in Chapter 7.2.2.
According to the water balance results, the well field recharge to the aquifer in 1992 ranges from 3.5 x 10⁶ m3 (2,800 AF) to 1.3 x 10⁷ m3 (10,500 AF). The proposed extraction of 3.7 x 10⁶ m3 yr-1 (3,000 AFY) is less than the maximum groundwater recharge estimate of 1.3 x 10⁷ m3 (10,500 AF), and greater than the lower recharge estimate of 3.5 x 10⁶ m3 (2,800 AF). These results imply that groundwater levels within the basin under consecutive drought year scenarios would gradually decline, causing a decrease in the proposed extraction amount.
Between 1992 and 1996, there is a potential recharge difference of 9.7 x 10⁶ m3
(7,800 AF), which represents a reduction in the amount of potential recharge from one year to the next. Since an average year generally contributes 9.7 x 10⁶ m3 more than a dry year, during consecutive drought years, the reduction in groundwater storage is greater than the proposed extraction rate of 3.7 x 10⁶ m3 yr-1 (3,000 AFY). Which implies that there may be an impact to downstream resources during consecutive drought years. However, according to our results there is enough potential recharge to support some groundwater extraction, which is discussed in Chapter 7.
The proposed extraction from the Dry Creek aquifer has the potential to supply the MCWD and MMSA with auxiliary water during average water years, however this extraction amount may be limited during consecutive drought year scenarios. Therefore, it will be necessary for the MCWD and MMSA to consider the breadth of their supply alternatives in their efforts to satiate demand in those dry periods. In order to mitigate against potential downstream effects, a conservative pumping regime coupled with further analysis is the recommended extraction approach (Chapter 7).
82
Chapter 6 Water Policy Issues
6.1 STAKEHOLDERS There are a number of stakeholders who share concerns regarding the cumulative effects from groundwater withdrawal in the Dry Creek drainage. While each stakeholder has expressed concerns with respect to their individual interests, the concerns of the stakeholder group as a whole may provide greater insight into how effectively public policy is addressing groundwater extraction in California. These stakeholder concerns have been identified and separated into the following two categories; hydrologic impacts, which include potential impacts to Big Springs and the Upper Owens River, and possible water right infringements. Some of the concerns may not fit entirely within any one category, however for our purpose, the respective overlying significance of those concerns will adequately be incorporated into these categories.
6.1.1 HYDROLOGIC IMPACT CONCERNS The hydrologic impacts that may arise resulting from the groundwater withdrawals in the Dry Creek basin encompass the greatest extent of the stakeholders' concerns, with the largest focus on biologic, economic, and water quantity impacts. These trepidations include possible adverse effects on the biological resources of the area from aquifer overdraft or decreases in spring flow, and any associated economic loss there from. Water quantity concerns are related to the potential adverse affects from aquifer overdraft brought on by not enough annual groundwater recharge, water table changes, and possible decreases in spring and subsurface flow.
6.1.1.1 BIG SPRINGS AND UPPER OWENS RIVER Situated below the Dry Creek drainage, Big Springs, is one of the sources for the Upper Owens River, and is located adjacent to the Alpers Owens River Ranch and the Arcularius Ranch (Appendix A). The water from Big Springs is essential to raising Alpers trout. Stakeholders Tim Alpers, John Arcularius, the Sierra Club, and the CA Sportfishing Protection Alliance have expressed concerns that the groundwater extraction from the Dry Creek basin will divert and use the underflow of the Upper Owens River watershed and Big Springs. This may adversely affect the wild trout fisheries of the area. These concerns are also extended to the possibility of adversely affecting the fisheries by potential changes in water chemistry, which may result from the potential decrease in spring flows. The Mono County Planning Department shares similar concerns regarding the potential impacts to surface waters in the Big Springs area, and has extended their concern to the cumulative impacts on down stream resources, such as the potential for reduced flows from the Mono Basin.
6.1.2 WATER RIGHT CONCERNS The potential impacts on the downstream water resources are tied to the concerns over potential water right infringements. Tim Alpers and John Arcularius utilize the
83
Big Springs water sources for their fisheries under the riparian rights doctrine, since they are landowners overlying the groundwater resource. California Water Law states that this right entitles them to use the water for their own benefit. If the Dry Creek project infringes on their ability to use the water for their own benefit, they have the right to request monetary compensation for their losses. Adjudication of Tim Alpers�s and Arcularius�s production rights establishes private property rights to the safe yield of the basin, but property rights to the stock of groundwater in the basin will be retained by the MCWD. At the same time, the Forest Service has the responsibility of managing surface and groundwater resources located in the National Forest System. The Forest Service also recognizes the role of the States in administering water rights and the validity of private property rights of individuals in their management of water resources. Yet the Forest Service, in its responsibility to maximize use of the federal waters for the public trust, must weigh that responsibility against stakeholder uses. This deliberation may result in a finding that the costs imposed on the stakeholders are not as significant as providing reliable water resources to the greater community.
Mono County also has water right concerns regarding the Dry Creek project with regards to the potential effects on the Upper Owens Area. One of the Mono County Planning Department�s (MCPD) responsibilities is to ensure that the water resources of the Upper Owens River are protected. To carry out this responsibility, the County has developed a policy which reads: "Ensure that direct and indirect impacts of development projects on the water resources of the Upper Owens Area are avoided or mitigated to a point where clearly no significant effects would occur" (Burns and MCPD, 1994). Thus if effects resulting from the groundwater extraction within the Dry Creek drainage cause flows in the Upper Owens area to be diminished, Mono County�s own policies would be compromised. An analysis of the potential reductions in the Upper Owens River resulting from our recommended groundwater extraction quantity of 2.5 x 10⁶ m3 yr-1 (2,000 AFY) is developed in Chapter 7.2.2.1.
6.2 DISCUSSION OF AGENCY RESPONSES CEQA and NEPA guidelines require that environmental documents identify and focus on the potentially significant environmental effects of a proposed project. A significant effect is one that may cause, or will cause �a substantial, or potentially substantial, adverse change in any of the physical conditions within the area affected� by a project. A brief description of these policies is below:

84
NEPA �NEPA directs federal agencies to prepare an EIS for all major federal actions which may have a significant effect on the human environment. It states that it is the goal of the federal government to use all practicable means, consistent with other considerations of national policy, to protect and enhance the quality of the environment. It is a procedural law requiring all federal agencies to consider the environmental impacts of their proposed actions during the planning and decision-making process (CDWR, 1998).�
CEQA
�CEQA, modeled after NEPA, requires California public agency decision-makers to document and consider the environmental impacts of their actions. It requires an agency to identify ways to avoid or reduce environmental damage, and to implement those measures where feasible. CEQA applies to all levels of California government, including the State, counties, cities, and local districts (CDWR, 1998).�
The requirements of CEQA and NEPA state that the responsible public agencies, here the Forest Service and MCWD, must respond to the concerns of the stakeholders, and incorporate those concerns into their final EA. This process allows the stakeholders the opportunity to voice their concerns or opinions for a public works project, ensuring that the regulating bodies will, with "due process", consider their concerns through to construction of the final environmental assessment document.
California Public Resources Code Section 21081.1 (SWRCB, 2000) requires that a reporting and monitoring program be adopted to ensure compliance with project mitigation measures identified in an EIR or other conditions requiring monitoring. According to that section, �the reporting or monitoring program shall be designed to ensure compliance during project implementation.� The Code of Federal Regulations Part 1505.2 (c) states: "A monitoring and enforcement program shall be adopted and summarized where applicable for any mitigation." In addition, 40 CFR Part 1505.3 states: "Agencies may provide for monitoring to assure that their decisions are carried out and should do so in important cases."
As per the requirements of NEPA and CEQA, the 1994 EA included mitigation measures that would be needed to lower the anticipated impacts to acceptable levels.
6.2.1 HYDROLOGIC IMPACT RESPONSE While investigation into the possible effects on biological resources is beyond the scope of this report, the minimal response given to the stakeholders is indicative of the need for such further research. The mitigation measures in the 1994 EA addressed wildlife and vegetation impacts, mainly with regard to land disturbance

85
resulting from construction of the well field pipeline. General impacts to biological resources from the extraction of groundwater were not addressed in the "Environmental Consequences" chapter of the EA, but the concerns were responded to in the correspondences incorporated at the end of the document. The MCWD responded to the biological resource concerns by pointing out how "unlikely it would be for there to be any impact, let alone a substantial impact, on biological resources of the area when the static groundwater level is approximately 500 feet below the ground surface, even if the depth to groundwater were to be increased" (Bontadelli and CDFG, 1989).
The measures that will be taken to mitigate against lowering the water table and aquifer overdraft were more thoroughly addressed. The MCWD will phase the wells into operation so that the incremental changes in resources can be detected and any effects can be analyzed. Moreover the EA stipulated that phasing should allow for not more than 6.1 x 10⁵ m3 yr-1 (500 AFY) to be extracted during the first year with an incremental increase of not more than 3.7 x 10⁵ m3 yr-1 (300 AFY) in each year thereafter (USFS, 1994). Under normal circumstances, MCWD anticipates that water would be extracted during a six-month period, with the field left to rest during the remainder of the year. This review period allows the opportunity to obtain additional information about the drawdown and recovery of the subsurface resource and possible response by subsurface resources. Our water balance results, discussed in Chapter 5, indicate that an extraction up to a maximum of 2.5 x 10⁶ m3 yr-1 (2,000 AFY) has the greatest ability to allow for prolonged pumping. To determine whether this project will impact spring flows in the Big Springs area and affect the underflow of the Upper Owens River, the MCWD will fund and install the monitoring of flows in three locations that could be affected by the withdrawal. The locations (on Deadman Creek above Big Springs, at points determined thereof, at Big Springs, and on the Upper Owens River below Big Springs) are recommended by California Department of Fish and Game, the Long Valley Hydrological Advisory Committee, USGS and USFS (Figure 6-1). In the event that the monitoring program at Big Springs, or in the Upper Owens River, indicates that there is a significant adverse change in the groundwater resources as a result of the pumping, pumping rates will be reduced or halted so that the new information can by analyzed. In addition, specific thresholds will be identified in the special use permit, that when met regardless of the reason, will result in cessation of pumping operations until such time as observed spring or river flows recover (Robertson and USFS, 1992). An environmental document would be written displaying the new data and environmental consequences before water extraction would be authorized again from the Dry Creek Basin.

86
E%[ %[%[
4 0 4 8 Kilometers
N
Stream Gauges%[Big SpringsEDry CreekOwens River
Elevation (meters)2104 - 22132214 - 23222323 - 24322433 - 25412542 - 26512652 - 27602761 - 28702871 - 29792980 - 30893090 - 31983199 - 33083309 - 34173418 - 3527No Data
Legend
Figure 6-1: Recommended stream gauge monitoring for Big Springs
87
The district also acknowledged that there is no information available that indicates the Dry Creek watershed is tributary to Big Springs. Furthermore, the MCWD does know that when surface discharge from the Dry Creek watershed occurs, it enters the Owens River over 1.6 kilometers (1 mile) downstream of Big Springs. Thus even if the MCWD were to assume that the Dry Creek drainage were a tributary to Big Springs, they point out that the drainage area above the proposed well field is only about 10.4 km2 (4 mi2). The area north of Dry Creek and south of June Mountain above the elevation of Big Springs and Highway 395 is over 75 km2 (29 mi2). This area is directly tributary to Big Springs area and the MCWD claims it is a much more probable source of the water at Big Springs. When you further consider that the small area of Dry Creek proposed for the well field is over 11.3 kilometers (7 miles) away from Big Springs (Figure 3-1), the possibility of any measurable change at the springs is unlikely (Bontadelli and CDFG, 1989). The use of chemical tracers and chemical mixing models of Big Springs can aid in developing a better understanding of the linkage between the two watersheds.
The SWRCB provided a similar response to these hydrologic impact concerns by also acknowledging that no evidence has been submitted which would show how the water pumped from the Dry Creek wells could be considered to be �underflow� of the Owens River. Nor does the CDWR believe that such evidence exists since the Owens River is located approximately 14.5 kilometers (9 miles) from the well sites and is almost 457.2m (1500 feet) lower in elevation at that location (Anton, Board et al., 1992). Thus the MCWD concluded that there does not appear to be connection between the groundwater sources and either the Owens River or Mr. Alpers� springs, a position supported by the California Department of Water Resources (Robertson and USFS, 1992).
The ski area has provided similar responses for mitigation against any undesirable effects from the groundwater extraction. The Ski Area currently has authority to extract up to 5.2 x 10⁵ m3 yr-1 (421 AFY) of groundwater from existing wells in the Dry Creek drainage, and is requesting an additional 3.3 x 10⁵ m3 yr-1 (264 AFY) to facilitate additional snowmaking. MMSA would plan on extracting groundwater from the Dry Creek basin as long as the drainage proved to be a reliable source, and noted that even in past drought years, little change was seen in the response of the water levels in the wells. Although the ski area is making more snow now than before, they also have a greater number of wells (w/ greater separation) to extract from and therefore have a greater capability to spread out the withdrawal area. If major groundwater level changes were to occur (i.e. lowering of water table) they would evaluate the impacts to the aquifer, so as to not adversely exacerbate overdraft of the aquifer. In the event of drought year scenarios, MMSA would only make enough snow to access (and maintain access) the base areas in the Mammoth Creek area, and concentrate the snowmaking efforts in the Main Lodge area (T. Heller, MMSA, personal communication, 2000). Since most of the water being requested will be used on the Dry Creek side of Mammoth Mountain, some of that water will
88
percolate down to the groundwater system and eventually flow back to the Mammoth Creek system. This is important to note, as not all of the water extracted by the MMSA will recharge the Dry Creek basin after application, a portion of it will be lost to the Mammoth Creek watershed.
6.2.2 WATER RIGHT RESPONSE Water rights concerns appear to be much more difficult to assess and protect, given the complexity of the project, balancing of riparian rights and what is best for the public trust. There are no similar laws or regulations governing use of pumped groundwater except "groundwater confined in clearly defined underground channels" (SWRCB, 2000). The determination of whether or not groundwater is in a clearly defined channel is often the subject of intense debate with the final determination being subject to many factors. With regard to impacts of groundwater pumping, the determination of impacts on users of surface water (i.e. subject to SWRCB regulation) can be relatively straight forward, as in the case of groundwater in an alluvial river bed in a bedrock canyon; or difficult, as in the case of groundwater found in an extensive alluvial formation or flood plain down gradient of a canyon. In the case of the later, nothing is clear-cut and drawing unambiguous conclusions is often difficult. Only after the snow melts and becomes water, such as a flowing stream, a lake, or groundwater confined within clearly defined channels, does it become subject to California Water Law; but then again, only if it is classified as surface water, not groundwater. Anyone with legal title to a parcel of land overlying an unadjudicated groundwater basin (i.e., Alpers and Arcularius Ranch) can drill a well and pump as much groundwater as they desire as long as the extraction is deemed �reasonable� and use of the groundwater is �beneficial�. Conversely, stakeholder rights as �third parties� are protected by this �reasonable and beneficial� doctrine as well. For the Dry Creek Well Project, a finding of unreasonableness cannot be justified without sufficient evidence to support a prima facie finding that the proposed extraction of 3.7 x 10⁶ m3 yr-1 (3,000 AFY) by the MCWD and MMSA is unreasonable. An analysis of whether the proposed pumping will potentially and unreasonably divert the flow in the Upper Owens River is discussed in Chapter 7.2.2.1.
Most groundwater management programs augment surface supply without reducing demand, and do not eliminate the common property rights to groundwater, which are the cause of most groundwater overdraft. The MCWD alternatively realizes that reductions in demand through water restrictions would have beneficial impacts on supply deficiencies. Currently there are no recycled water users in the Mammoth community except for construction uses such as dust control and compaction purposes, however use of reclaimed water has been identified as a potential source of water supply for golf course and park irrigation (MCWD, 2000). The U.S. Forest Service supports the use of recycled water in the Mammoth Lakes locality, and has signed a Decision Notice and FONSI for MCWD�s EA for the use of recycled water on golf courses and for other landscaping (MCWD, 2000).
89
The dual nature of California water rights, lack of a statewide management plan for groundwater, and uncertainty regarding the surface water-groundwater connection make resolving water right issues more difficult. Conflict caused by competing demands for water in the Mammoth Lakes area has been a subject of considerable public and private debate, for many years, and resolving the issue does not seem to be an easy task (C. Plakos LADWP, personal communication, 2000).
6.3 DISCUSSION OF DISPARITY BETWEEN PUBLIC POLICY AND STAKEHOLDER SOLUTIONS Given the complexity of the geology within the Dry Creek basin, and the lack of scientific research done in the area, the concrete explanations provided by the MCWD and SWRCB seem to be much less substantive. The complexity of the basin�s hydrology, combined with the lack of substantial evidence to justify or explain the connection between the Dry Creek project and downstream water resources (Big Springs, the Upper Owens River, and Mono Lake), has left the stakeholders questioning the validity and certainty of the science used to anticipate future potential effects. To discount the concerns of the stakeholders because of a lack of scientific understanding does not adequately address such concerns if the potential for future adverse impacts knowingly cannot be predicted or even foreseen.
While our research presents a more comprehensive analysis of the hydrology governing the Dry Creek Well Project, it is unable to adequately address the stakeholder concerns. Our water balance results (discussed in Chapter 5) determined the maximum amount of recharge available for extraction to be 1.3 x 10⁷ m3 yr-1
(10,500 AFY). In Chapter 7.2.2.1 we attempt to determine whether these extraction amounts can potentially affect the Upper Owens River beyond a reasonable magnitude. We cannot state with confidence however, how the groundwater extraction from the basin will affect the downstream resources, and so the questions regarding possible effects on Big Springs and the Upper Owens River remain unanswered. The recommendations for further research that are proposed in Chapter 7 stipulate how effects on these downstream resources can be assessed, so these hydrologic concerns do not need to be left unrequited indefinitely.

90
Chapter 7 Recommendations 7.1 RECOMMENDED OPTION Our recommendation regarding the extraction of groundwater from the Dry Creek basin is to extract up to 2.5 x 10⁶ m3 yr-1 (2,000 AFY) during drought years, and in average water years extract the full 3.7 x 10⁶ m3 yr-1 (3,000 AFY). This recommendation will permit the MCWD and MMSA to extract the water they request, while also providing an opportunity for continued research into the area�s hydrogeology. This extraction rate plan allows for the opportunity to obtain additional information about the draw down and recovery of the groundwater resource, the response of the aquifer, and implications for downstream resources.
The recommended extraction quantity in this groundwater pumping scheme will require collaboration between the MCWD and MMSA to divide the initial allocations of groundwater. The MCWD estimates the supply from Dry Creek required at times of peak demand, typically summertime, to be approximately 4.3 x 10⁵ m3 yr-1 (350 AFY) (MCWD Urban Plan, 2000). The MMSA conversely, requires an additional water supply adequate to ensure access (and maintain access) to the base region in the Mammoth Creek area and to concentrate their efforts in the Main Lodge area. Given that peak water demand times for the MCWD are during the summer months, and peak demand times for the MMSA are during the winter, lends flexibility to the use of Dry Creek groundwater.
According to the water balance results, the recharge to the aquifer in 1992 ranges from 3.5 x 10⁶ m3 (2,800 AF) to 1.3 x 10⁷ m3 (10,500 AF). The proposed extraction of 3.7 x 10⁶ m3 yr-1 (3,000 AFY) is greater than our lowest groundwater recharge estimate of 3.5 x 10⁶ m3 (2,800 AF), and smaller than our largest recharge estimate of 1.3 x 10⁷ m3 (10,500 AF). We find that the proposed extraction can supply Mammoth Lakes with the water it needs during average water years and some of the water it needs during drought years. Increased monitoring of both the surface and groundwater hydrology is recommended to better explain the interrelationship between groundwater and spring flows in the region.
7.2 RECOMMENDATIONS FOR FURTHER DATA COLLECTION 7.2.1 SURFACE HYDROLOGY The Dry Creek watershed contains only two rain gauges at elevations of 2,941 m and 2,220 m, and as a consequence rainfall is not measured in the middle region of the basin. In order to improve the calculation of rainfall, especially in the middle region of the watershed, another rain gauge should be placed at an approximate elevation of 2,500 meters. However, the main focus should be on SWE since this represents the greatest input into the water balance. Even though snow naturally falls non-uniformly, the addition of more SWE measurement points would help reduce the amount of error associated with this term.
91
To gain a more definite estimation of the loss associated with runoff from the well field water balance; the streamflow from Dry Creek should be measured at a point below well #6 and the Dry Creek- St. Anton confluence (Figure 5-1). The present site, located 10 meters below Hwy 203 and above well #4 which does not capture total runoff from Zones 1-4.
We also recommend obtaining research of the transpiration rates for Lodgepole, Jeffrey Pine, and Red Fir, in a montane environment. This would facilitate a better understanding of how much water is lost from evapotranspiration in the Dry Creek watershed.
7.2.2 HYDROGEOLOGY In order to provide a complete and thorough analysis of the amount of groundwater available for sustainable extraction, further data collection is necessary, which includes the following:
��Increase the duration of the pump tests while monitoring adjacent wells in order to determine the zone of influence.
��Record monthly static water level measurements in order to determine seasonal variability.
��Keep a more detailed register of future monitoring wells, describing the exact location of the water bearing zones and geological units.
��Chemical analysis should be completed at all of the wells in the watershed, as well as at Big Springs in order to improve the understanding of the interconnectivity between groundwater flows and adjacent groundwater basins.
��Installation of observation wells in order to develop a more thorough understanding of the interference between wells and the hydrogeology of the region. Any effects seen in the spring flows at Big Springs will be revealed by the observation wells.
��Monitor the water temperature of the wells and spring within Dry Creek, which may help determine recharge rates and groundwater flow patterns.
��A chemical tracer test, using SF6, which is not naturally found within the groundwater, or a test using salt, a natural tracer from the MMSA.
The Long Valley Caldera region is a complex hydrogeological system. A more complete sampling regime for surface hydrology and groundwater would improve the understanding of the complex flow patterns within the Dry Creek watershed. While the need for additional water sources to satiate the increasing demand from the expected build-out within Mammoth Lakes is imperative, our recommendations for further data collection and analysis can help in sustaining the town�s water supply sources for the long-term.
92
7.2.3 BIG SPRINGS Big Springs discharge should be monitored by taking multiple stream velocity profiles and stage height measurements. Once baselines are established, measurements should occur less frequently. These measurements should be taken on Deadman Creek directly above Big Springs and below the Glass Creek confluence on the Owens River directly below Big Springs (Figure 7-1). The velocity profiles can then be used to construct discharge curves for that section of the stream, which can aid in determining how much flow emanates towards Big Springs. A more permanent and comprehensive solution would be to install continuous stream height gauges, on Deadman Creek above Big Springs, at points determined thereof, at Big Springs, and on the Upper Owens River below Big Springs (Robertson and USFS, 1992) should then be undertaken so that a discharge for Big Springs can be assessed for any changes in pumping within the Dry Creek watershed. However, we recognize that installing a permanent stream gauge may not be suitable in these locations (C. Farrar, personal communication, 2001). The gauge and measurements may be beneficial to quantify the lag time between the commencement of pumping from the Dry Creek wells and the discharge effects seen at Big Springs. Stream and spring measurements will be able to assess a decrease in Big Springs flow due to pressure changes once pumping commences. Pressure changes may also be assessed with the addition of observation wells throughout the basin and near Big Springs (Figure 7-1). The baseline hydraulic head of the observation wells before and after pumping commences should determine if extraction from Dry Creek is possibly linked to a decrease in spring flows.
To enhance the analysis of the potential effects on Big Springs, and moreover to the effects on Alpers� and Arcularius� properties, we recommend commissioning a study to quantify the flow necessary to sustain their trout hatcheries. This research would aid in determining if the fisheries would be affected given a certain percentage reduction in spring flows due to groundwater extraction.
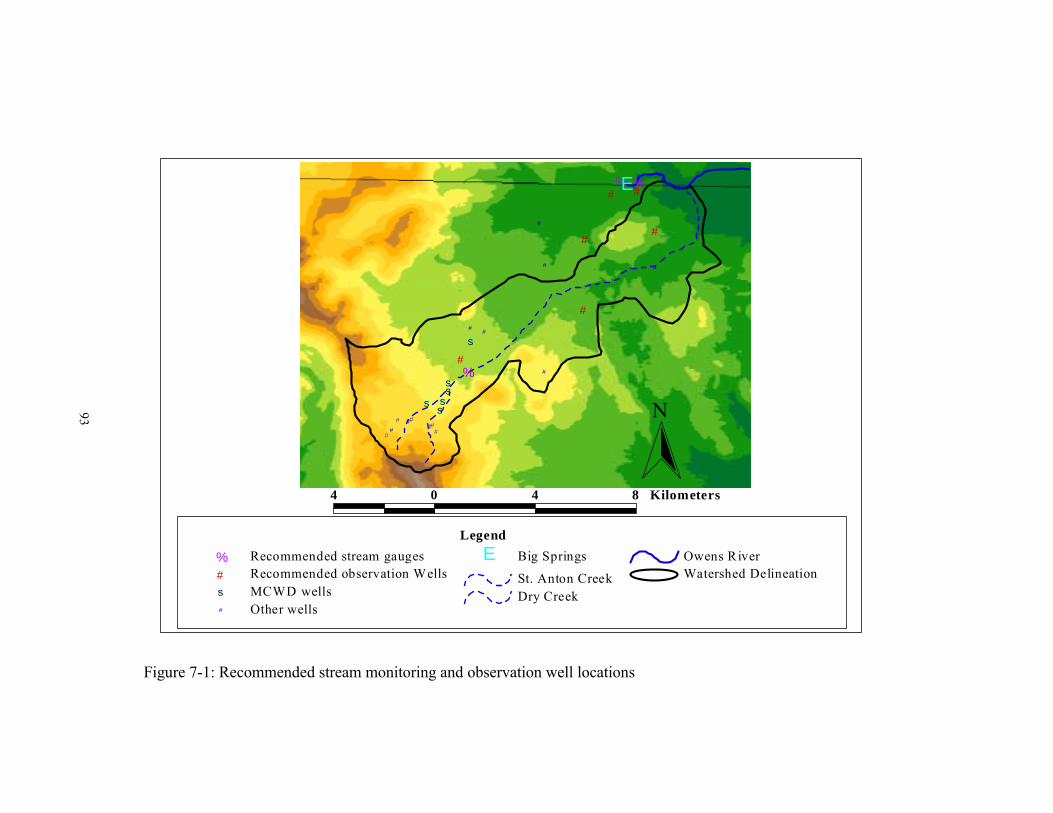
93
#S
#S#S#S
#S
#S
#
##
#
#
#
# #
#
###
##
#
##
##
#
#
% %
%
E
4 0 4 8 Kilometers
N
Recommended stream gauges%Recommended observation Wells#
MCWD wells#S
Other wells#
Big SpringsESt. Anton CreekDry Creek
Owens RiverWatershed Delineation
Legend
Figure 7-1: Recommended stream monitoring and observation well locations
94
7.2.3.1 POLICY EVALUATION (POLICY IMPLICATIONS) Policy implications for our recommendation that limit withdrawal to safe yield, or extraction of 2.5 x 10⁶ m3 yr-1 (2,000 AFY) during drought years and 1.7 x 10⁶ m3 yr-1 (3,000 AFY) during average water years, will result in the individual stakeholders determining whether his/her rights to groundwater are being abused beyond a �reasonable� mean, and may petition the court to protect his/her rights. Thus diversions from Big Springs and the Upper Owens River must be justified as �unreasonable.� However, in a legal context there is no fixed definition of �reasonable�, nor is there a fixed quantifiable standard for determining whether a use is reasonable or unreasonable. It is rather a question to be determined on the facts and circumstances of each case.
According to the SWRCB Division of Water Rights staff (Anton, 1992), flows in the Upper Owens River above the East Portal of the Mono Craters Tunnel (Appendix A) have been:
��Annual Maximum: 9.6 x 10⁷ m3 yr-1 (77,498 AFY) ��Annual Minimum: 2.9 x 10⁷ m3 yr-1 (23,479 AFY) ��50-year Annual Average: 5.2 x 10⁷ m3 yr-1 (42,195 AFY)
Assuming, as conservatively as possible, that the MCWD�s diversions would have a one-to-one impact on flows in the Upper Owens River, the impact of the MCWD�s proposed pumping on the Upper Owens River would be a 14-49% reduction in flows (Table 7-1). Our recommendation to extract up to a maximum of 2.5 x 10⁶ m3 yr-1
(2,000 AFY) during drought years, also as conservatively as possible, could potentially reduce flows in the Upper Owens River by 3-9 percent.
The potential flow reductions in the Upper Owens River by roughly 3-9 percent, by themselves, do not appear to create an unreasonable diversion of water, according to the SWRCB (Anton, 1992). However, this analysis only considers potential effects to the Upper Owens River and not to Big Springs, as flow rates for Big Springs are not currently monitored. A legal action for such an adjudication is usually filed by one of the overlying users to obtain and quantify his legal right to pump a certain amount of water from the basin without being subject to damage claims from other overlying users. It would then be left to the courts to determine whether the groundwater extraction is adversely affecting the stakeholders� ability to benefit from use of their groundwater rights, and weigh that against the responsibility of the district to maximize the resource for the public trust.

95
Table 7-1 Potential flow reductions in Upper Owens River
Water Balance high estimate
m3 yr-1
(AFY)
Water Balance low estimate
m3 yr-1
(AFY)
Recommended extraction amount
m3 yr-1
(AFY) Dry Creek Groundwater Extraction Quantities
1.3 x 10⁷ m3 (10,500 AF)
3.5 x 10⁶ m3 (2,800 AF)
2.5 x 10⁶
(2,000)
Percent Reductions Maximum Potential Flow Reductions in the Upper Owens River: Wettest Year
14% 4% 3%
Maximum Potential Flow Reductions in the Upper Owens River: Driest Year
49% 12% 9%
Maximum Potential Flow Reductions in the Upper Owens River: Average Year
25% 7% 5%
7.3 CONCLUDING REMARKS This project was undertaken with the intent to determine whether the Dry Creek basin can sustain the annual groundwater extraction of 3.7 x 10⁶ m3 (3,000 AF), during consecutive drought years when the MCWD and MMSA need the additional supply. Our analysis of the basin�s surface and groundwater hydrology, associated policy concerns, and resulting water balance, suggests that a reduced extraction amount is recommended during drought years, and extraction of the full amount 3.7 x 10⁶ m3 is recommended for average water years. It is important to state that our analysis of the Dry Creek drainage was undertaken with a focus on the recharge to the upper reaches of the basin, to quantify the amount of groundwater available for extraction. Our analysis did not analyze impacts on downstream resources, however we have provided information that will aid future studies, realizing that potential effects on Big Springs and the Upper Owens River are of serious concern to the stakeholders in the community.
More importantly, our research fosters the need for a more earnest, and comprehensive understanding of the surface-groundwater connection within the region. Thus, our recommendation is coupled with suggestions for further data collection, testing, and analysis surrounding the Dry Creek issue. We offer this conclusion as the most effectual solution, on which the MCWD and MMSA can base future decisions regarding the sustainability of the Dry Creek basin, and acknowledge potential impacts on downstream resources.
96
REFERENCES Abbot, M.D., Lini, A., Bierman, P.R. (2000). δ18O, δD and 3H measurements
constrain groundwater recharge patterns in an upland fractured bedrock aquifer, Vermont, USA. Journal of Hydrology 228: 101-112.
Anderson, H.W., Hoover, M.D., and Reinhart, K.G. (1976). Forests and Water: Effects of Forest Management on Floods, Sedimentation, and Water Supply. USDA Forest Ser. Gen. Tech. Rep. PSW-18, Pacific Southwest Forest and Range Experiment: Berkeley
Anderson, M.P., Woessner, W.W. (1992). Applied Groundwater Modeling: Simulation of Flow and Advective Transport. San Diego, Academic Press, Inc.
Anton, E.C., State Water Resources Control Board. (1992). Letter to Tim Alpers, Regarding The Dry Creek Well Project of the MCWD in Mono County.
Association of California Water Agencies (ACWA) (1999). California Water Facts, Groundwater; http://www.acwanet.com/waterfacts/ground.html [Accessed 8 February 2001].
Bailey, Roy A. (1989). Geologic Map of Long Valley Caldera, Mono-Inyo Craters Volcanic Chain, and Vicinity, Eastern California. Menlo Park, U.S. Geological Survey.
BCI Geonetics (1991). Identification of Potential Bedrock Groundwater Resources on Deadman Ridge, Mammoth Lakes, California. Santa Barbara, BCI GEONETICS INC.
Bontadelli, Pete and CA Dept. of Fish and Game (1989). Letter to MCWD Regarding negative declaration: Dry Creek Groundwater Development.
Burns, Scott and Mono County Planning Department (1994). Letter to Dennis Martin and the Inyo National Forest Regarding the Dry Creek.
California Department of Water Resources (1981). Water Well Resources, Bulletin 74-81. Sacramento.
California Department of Water Resources (1994). California Water Plan Update, Bulletin 160-93, Chapter 8, Environmental Water Use. Sacramento.
California Department of Water Resources (1996). Groundwater Management Districts or Agencies in California, Water Facts. Sacramento.
California Department of Water Resources (1998). California Water Plan Update Bulletin 160-98, Appendix 2A; Institutional Framework for Allocating and Managing Water Resources in California. Sacramento.
California Department of Water Resources (2001). California Data Exchange; http: //www.cdec.water.ca.gov [Accessed 18 February 2001].

97
Committee on Fracture Characterization and Fluid Flow, U.S. Committee for Rock Mechanics (1996). Rock Fractures and Fluid Flow. Washington D.C., National Academy Press.
Dozier, J., Melack, J. and D. Marks (1987). Snow Deposition, Melt, Runoff, and Chemistry in a Small Alpine Watershed, Emerald Lake Basin, Sequoia National Park, Final Report Submitted to California Air Resources Board for Contract A3-106-32. Santa Barbara, University of California-Santa Barbara.
Dunne, T. and Leopold, L.B. (1978). Water in Environmental Planning. New York, W.H. Freeman and Company.
Elder, K., Dozier, J., Michaelsen, J. (1989). �Spatial and Temporal Variation of Net Snow Accumulation in a Small Alpine Watershed, Emerald Lake Basin, Sierra Nevada, California.� Annals of Glaciology 13: 55-63.
Elder, K., Dozier, J., Michaelsen, J. (1991). �Snow Accumulation and Distribution in an Alpine Watershed.� Water Resources Research 27(7): 1541-52.
Evans, W. C. et al. (2000). �Tracing and Quantifying Magmatic Carbon discharge in cold groundwater: Lessons learned from Mammoth Mountain, USA.� unpublished, USGS, Menlo Park.
Farrar, C.D. et al. (1987). �Hydrological and Geochemical Monitoring in Long Valley Caldera, Mono County, California 1985.� Water Resources Investigation Report 87-4090. Sacramento, U.S. Geologic Survey.
Fetter, C.W. (1994). Applied Hydrogeology. New Jersey, Prentice Hall. Grelle, A., Lundberg, A., Lindroth, A., Moren, A.-S., Cienciala, E., (1997).
"Evaporation components of a boreal forest: variations during the growing season." Journal of Hydrology 197: 70-87.
Heim, Kenneth (1991). Hydrologic Study for the Upper Owens River Basin Big Springs to East Portal. Fullerton, CA, California State University.
Johansson, Olof (1988). Methods for Estimation of Natural Groundwater Recharge Directly from Precipitation-Comparative Studies in Sandy Till. Estimation of Natural Groundwater Recharge. I. Simmers. Boston, D. Reidel Publishing Company: 239-70.
Johnson, G.L. and C.L. Hanson (1998). �Topographic and atmospheric influences on precipitation variability over a mountainous watershed.� Journal of Applied Meteorology 35(1): 68-87.
Kattelmann, R. and K. Elder (1991). �Hydrologic characteristics and water balance of an alpine basin in the Sierra Nevada.� Water Resources Research 27(7): 1553-62.
Katz v. Walkinshaw (1903). 74, p. 766, 141 Cal. 116
98
Lee, Jim Yong and Kang-Kun Lee (1999). Use of hydrologic time series data for identification of recharge mechanism in a fractured bedrock aquifer. Journal of Hydrology 229: 190-201.
Leydecker, A. and J.M. Melack (1999). �Evaporation from snow in the Central Sierra Nevada of California.� Nordic Hydrology 30(2): 81-108.
Leydecker, A. and J.M. Melack (2000). �Estimating evaporation in seasonally snow-covered catchments in the Sierra Nevada, California.� Journal of Hydrology 236: 121-38.
Marks, D (1988). Climate, energy exchange, and snowmelt in Emerald Lake watershed, Sierra Nevada. Ph.D. dissertation, 158 pp., Dept. of Geography. and Mechanical Engineering. University of California-Santa Barbara, Santa Barbara.
Mazor, Emanual (1997). Chemical and Isotopic Groundwater Hydrology. New York, Marcel Dekker Inc.
McClung, D. and P. Schaerer (1993). The Avalanche Handbook. Seattle, The Mountaineers.
MCWD (1987). Town of Mammoth Lakes General Plan, Mammoth Lakes, CA. MCWD (1998). MCWD Proposed Reclaimed Water Project, Draft EIR and
Environmental Assessment. Mammoth Lakes, Bauer Environmental Services MCWD (2000). Urban Water Management Plan, Mammoth Lakes, CA. Pruess, K., Faybishenko, B., Bodvarsson, G.S. (1999). Alternative concepts and
approaches for modeling flow and transport in thick unsaturated zones of fractured rocks. Journal of Contaminant Hydrology. 38: 281-322.
Rheiner, T. (1994). Letter to D.L.R. Austin, Regarding Dry Creek Well & Pipeline Project Environmental Assessment. Mammoth Ranger District, Mammoth Lakes, CA, USDA.
Robertson, F. Dale and U.S. Forest Service (1992). Letter to Congressman R.E. Lehman Regarding Dry Creek Groundwater Project. Washington DC.
Schmidt, Kenneth, D. (1988). Dry Creek Test Holes, Kenneth D. Schmidt and Associates, Mammoth Lakes.
Serreze, M.C., Clark, M.P., Armstrong, R.L., McGinnis, D.A., Pulwarty, R.S., (1999). �Characteristics of the western United States snowpack from snowpack telemetry (SNOTEL) data.� Water Resources Research 35(7): 2145-60.
Sorey, M.L, Lewis, R.E. and Olmsted, F.H. (1978). The Hydrothermal System of Long Valley Caldera, California. Geological Survey Professional Paper 1044-A. Washington D.C., U.S. Geological Survey.
State Bar of California (1994). 1994 California Water Law Newsletter.
99
State Water Resources Control Board (1993). Notice of Application to Appropriate Water, Application 30222. Sacramento.
State Water Resources Control Board (2000). California Public Resources Code, Section 21080. Sacramento.
Twiss, R. J. and Moores, E.M. (1992). Structural Geology. New York, W. H. Freeman and Company.
U.S. Army Corps of Engineers (USACE), North Pacific Division, (1956). Snow hydrology: Summary report of snow investigation, Portland.
U.S. Dept. of Agriculture (1995). Soil Survey Inyo National Forest, West Area, California. U.S. Forest Service, Pacific Southwest Region.
USFS-Inyo National Forest (1994). Environmental Assessment for Dry Creek Well and Pipeline Project, Mammoth Lakes, CA, Mammoth Ranger District, USDA Forest Service.
USFS-Inyo National Forest (1997). Existing and Historic Conditions of the Mammoth to June Area, Mammoth Lakes, CA Mammoth Ranger District, USDA Forest Service
USFS-Inyo National Forest (2000). Changes in Mammoth Creek Instream Flow Requirements, Point of Measurement, and Place of Use, Draft EIR/EIS. Mammoth Lakes, CH2M Hill.
U.S. Department of the Interior. [Crestview 7.5 Minute Digital Elevation Model] 1: 24,000. Denver, U.S. Geologic Survey, 1997.
U.S. Department of the Interior. [June Lake 7.5 Minute Digital Elevation Model] 1: 24,000. Denver, U.S. Geologic Survey, 1997.
U.S. Department of the Interior. [Mammoth 7.5 Minute Digital Elevation Model] 1: 24,000. Denver, U.S. Geologic Survey, 1997.
U.S. Department of the Interior. [Old Mammoth 7.5 Minute Digital Elevation Model] 1: 24,000. Denver, U.S. Geologic Survey, 1997.
U.S. Department of the Interior (1997). Hydrology and Water Resources. Status of the Sierra Nevada: The Sierra Nevada Ecosystem Report. Denver, U.S. Geologic Survey.
U.S. Office of Technology Assessment (USOTA) (1993). Preparing for an Uncertain Climate. Government Printing Office, Washington, D.C. OTA-O-567.
Water Education Foundation (WEF) (1998). Layperson’s Guide to Groundwater. Sacramento, Water Education Foundation.
Waterloo Hydrolgeologic Inc. (1999). Visual Modflow Manual. Waterloo, Ontario, Waterloo Hydrogeologic Inc.
100
Whitehead, D. and Jarvis, P.G. (1981). Coniferous Forests and Plantations. Water Deficits and Plant Growth 6: 49-152. T. T. Kozlowski. New York, Academic Press.
Wildermuth, Mark J. (1996). Mammoth Lakes Hydrology Report. Dempsey Corporation, Mammoth Lakes, CA.
Winter, T.C. (1981). Uncertainties in estimating the water balance of lakes. WaterResources Bulletin 17: 82-115.
Work, R.A., Stockwell, H.J., Freeman, T.G. and R.T. Beaumont (1965). Accuracy of Field Snow Surveys: Western United States, Including Alaska, Technical Report 163. Hanover, N.H., U.S. Army Cold Regions and Engineering Laboratory.
101
Appendix A: Referenced Locations
102
Key to Map numbers 1. Alpers Ranch 2. Arcularius Ranch 3. Big Springs 4. Crater Flat Snow Course 5. Crater Meadows Snow Course 6. Deadman Creek 7. Deer Mountain 8. Dry Creek 9. Glass Creek 10. Inyo Crater Lakes 11. Inyo Craters Snow Course 12. June Mountain 13. Lookout Mountain 14. Lookout Mountain Rain Gauge/Snow Pillow 15. Lower Dry Creek East 16. Lower Dry Creek West 17. Mammoth Creek 18. Mammoth Mountain Meteorological Site 19. Mammoth Mountain Ski Area Main Lodge 20. Mammoth Snow Course 21. MCWD well DC-1 22. MCWD well DC-2 23. MCWD well DC-3 24. MCWD well DC-4 25. MCWD well DC-5 26. MCWD well DC-6B 27. Minarets 2 Snow Course 28. Owens River 29. San Joaquin Ridge 30. San Joaquin Ridge Snow Course 31. St. Anton Creek 32. Town of Mammoth Lakes 33. USFS Mammoth Visitor Center 34. Yost Saddle Snow Course
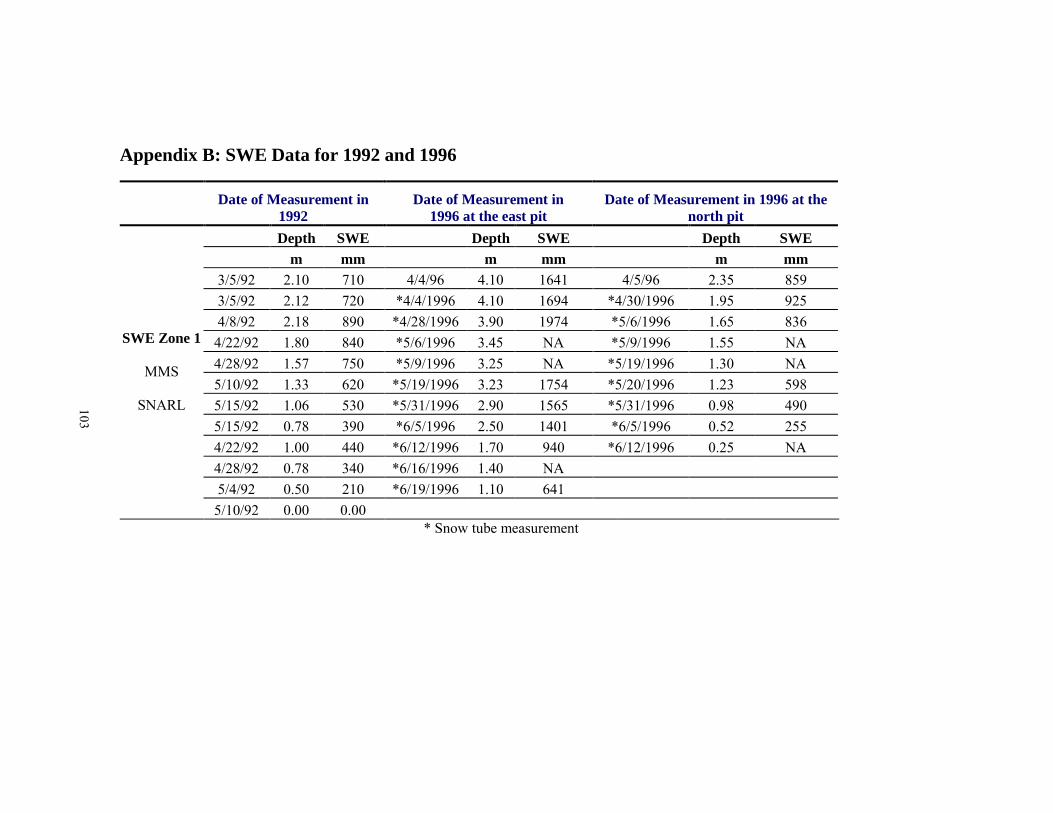
103
Appendix B: SWE Data for 1992 and 1996
Date of Measurement in 1992
Date of Measurement in 1996 at the east pit
Date of Measurement in 1996 at the north pit
Depth SWE Depth SWE Depth SWE m mm m mm m mm
3/5/92 2.10 710 4/4/96 4.10 1641 4/5/96 2.35 859 3/5/92 2.12 720 *4/4/1996 4.10 1694 *4/30/1996 1.95 925 4/8/92 2.18 890 *4/28/1996 3.90 1974 *5/6/1996 1.65 836 4/22/92 1.80 840 *5/6/1996 3.45 NA *5/9/1996 1.55 NA 4/28/92 1.57 750 *5/9/1996 3.25 NA *5/19/1996 1.30 NA 5/10/92 1.33 620 *5/19/1996 3.23 1754 *5/20/1996 1.23 598 5/15/92 1.06 530 *5/31/1996 2.90 1565 *5/31/1996 0.98 490 5/15/92 0.78 390 *6/5/1996 2.50 1401 *6/5/1996 0.52 255 4/22/92 1.00 440 *6/12/1996 1.70 940 *6/12/1996 0.25 NA 4/28/92 0.78 340 *6/16/1996 1.40 NA 5/4/92 0.50 210 *6/19/1996 1.10 641
SWE Zone 1
MMS
SNARL
5/10/92 0.00 0.00 * Snow tube measurement

104
Appendix B: SWE Data for 1992 and 1996 (continued) Date of Measurement in 1992 Date of Measurement in 1996
Depth SWE Depth SWE m mm m mm
1/16/92 1.02 325 NA NA 2/19/92 2.21 714 NA NA 3/29/92 1.76 460 NA NA
SWE Zone 2 San Joaquin Ridge
Snow Survey Associates
SWE Zone 3 MN2
LADWP 3/30/92 1.18 452 3/28/96 2.16 848
1/19/92 0.795 201 1/10/96 0.635 213 2/25/92 1.61 483 2/8/96 1.53 493 3/22/92 1.25 440
SWE Zone 4 Crater Meadows
Snow Survey Associates
Date of Measurement in 1992 Date of Measurement in 1996 Depth SWE Depth SWE m mm m mm
1/8/92 1.16 274 3/21/96 1.98 800 2/5/92 0.86 262 4/24/96 1.52 719 3/6/92 1.71 483
SWE Zone 5 Crater Flats
USFS 4/1/92 1.38 503 1/8/92 1.0 221 3/20/96 1.96 767 2/5/92 0.77 221 3/6/92 1.46 394
SWE Zone 5 Inyo Craters
USFS 4/1/92 1.11 386
SWE Zone 6 Lower Dry West
USFS 3/19/96 1.55 541
1/7/92 0.543 102 3/8/96 1.14 348 2/4/92 0.383 96.5 3/4/92 0.652 198
SWE Zone 7 Lower Dry Creek East
USFS 3/31/92 0.541 203
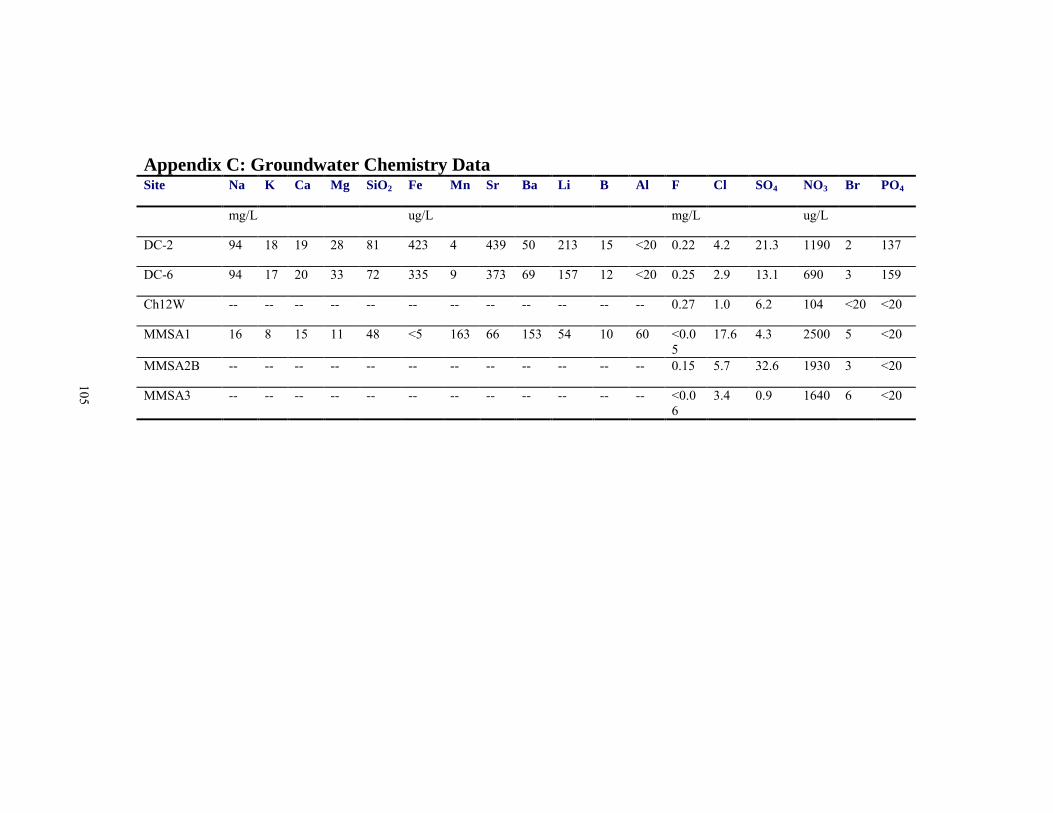
105
Appendix C: Groundwater Chemistry Data Site Na K Ca Mg SiO2 Fe Mn Sr Ba Li B Al F Cl SO4 NO3 Br PO4
mg/L ug/L mg/L ug/L
DC-2 94 18 19 28 81 423 4 439 50 213 15 <20 0.22 4.2 21.3 1190 2 137
DC-6 94 17 20 33 72 335 9 373 69 157 12 <20 0.25 2.9 13.1 690 3 159
Ch12W -- -- -- -- -- -- -- -- -- -- -- -- 0.27 1.0 6.2 104 <20 <20
MMSA1 16 8 15 11 48 <5 163 66 153 54 10 60 <0.05
17.6 4.3 2500 5 <20
MMSA2B -- -- -- -- -- -- -- -- -- -- -- -- 0.15 5.7 32.6 1930 3 <20
MMSA3 -- -- -- -- -- -- -- -- -- -- -- -- <0.06
3.4 0.9 1640 6 <20
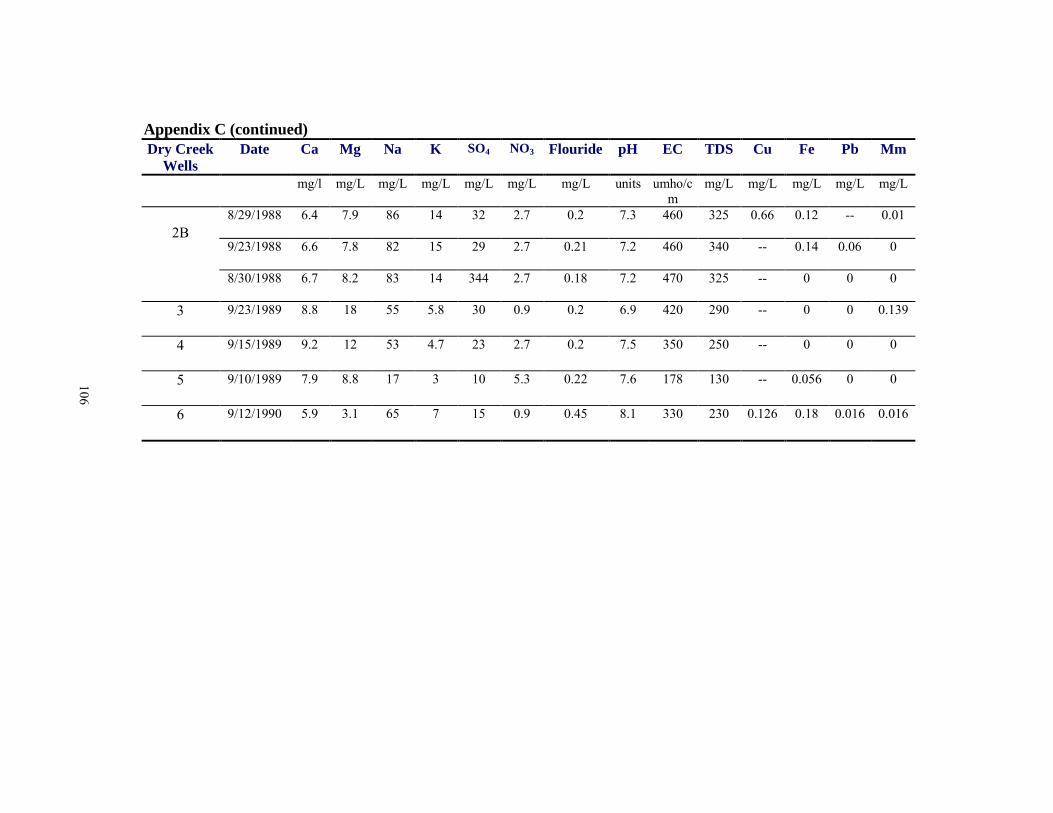
106
Appendix C (continued) Dry Creek
Wells Date Ca Mg Na K SO4 NO3 Flouride pH EC TDS Cu Fe Pb Mm
mg/l mg/L mg/L mg/L mg/L mg/L mg/L units umho/cm
mg/L mg/L mg/L mg/L mg/L
8/29/1988
6.4 7.9 86 14 32 2.7 0.2 7.3 460 325 0.66 0.12 -- 0.01
9/23/1988
6.6 7.8 82 15 29 2.7 0.21 7.2 460 340 -- 0.14 0.06 0
2B
8/30/1988
6.7 8.2 83 14 344 2.7 0.18 7.2 470 325 -- 0 0 0
3
9/23/1989 8.8 18 55 5.8 30 0.9 0.2 6.9 420 290 -- 0 0 0.139
4
9/15/1989 9.2 12 53 4.7 23 2.7 0.2 7.5 350 250 -- 0 0 0
5
9/10/1989 7.9 8.8 17 3 10 5.3 0.22 7.6 178 130 -- 0.056 0 0
6
9/12/1990 5.9 3.1 65 7 15 0.9 0.45 8.1 330 230 0.126 0.18 0.016 0.016

107

108

109

110

111

112