manage financial institutions
TRANSCRIPT
Copyright © 2004 Citigroup Inc. CITIGROUP and the Umbrella Device are trademarks and service marks of Citicorp or its affiliates and are used and registered throughout the world.
Manage Financial Institutions - Credit analytical viewpointShinhwa Chou, Vice President
Relationship Management, Financial Institutions Group
March 16, 2005
2
AgendaAgenda
■ Analysis of banks & insurance companies– From quantitative point of view– From qualitative point of view
■ Industry development trend & focus■ Strategies & Tactics to become a better FI
– Business Development– Cost Management– Risk Management– Capital Adequacy Management
How to Analyze Banks
4
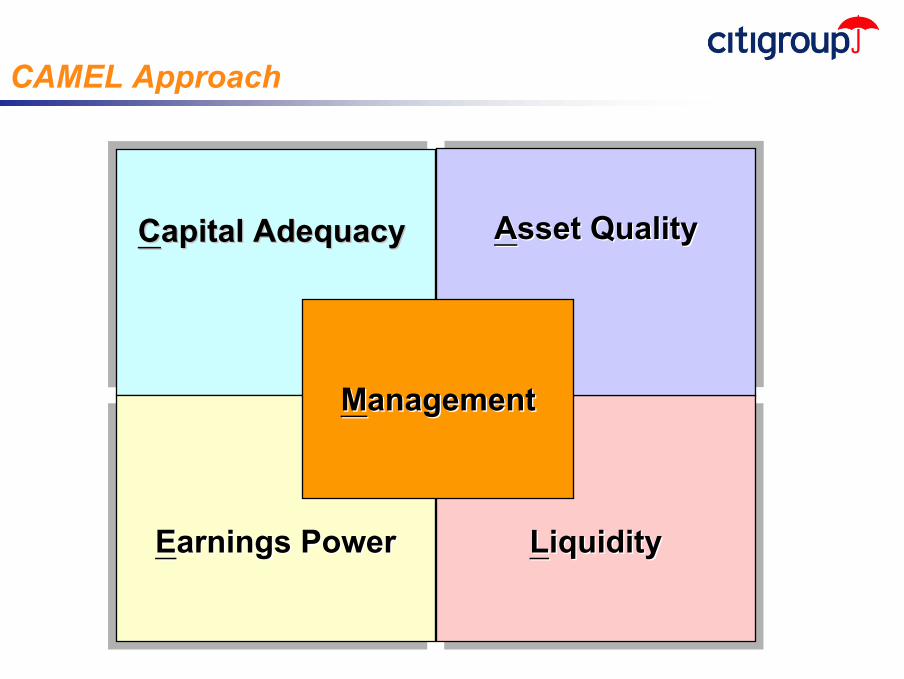
CAMEL Approach
Earnings PowerEEarnings Powerarnings Power LiquidityLLiquidityiquidity
Asset QualityAAsset Qualitysset Quality
MManagementanagement
CCapital Adequacyapital Adequacy
5
Capital Adequacy
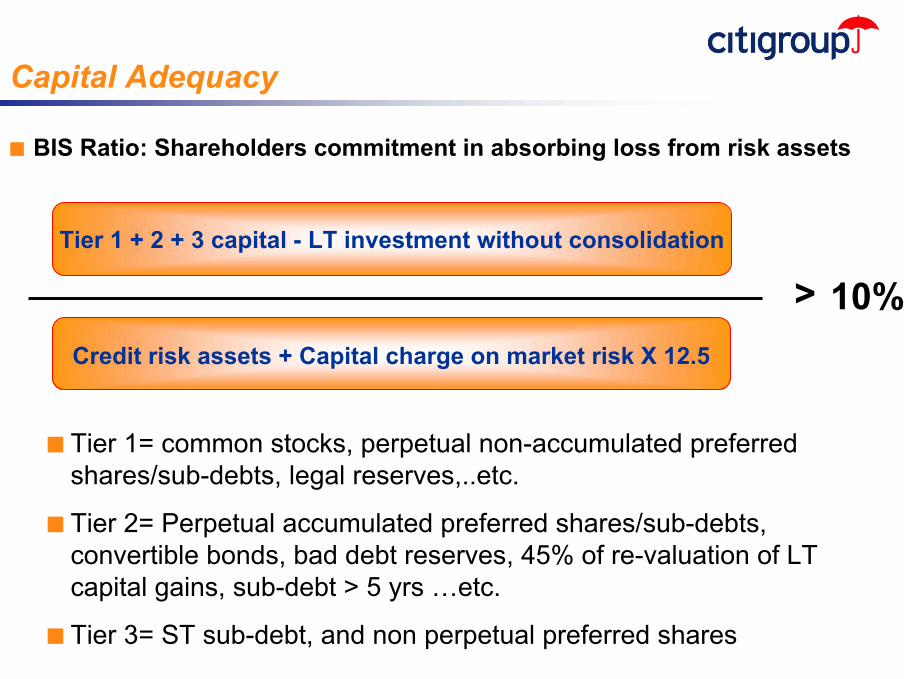
■ BIS Ratio: Shareholders commitment in absorbing loss from risk assets
Tier 1 + 2 + 3 capital - LT investment without consolidation
Credit risk assets + Capital charge on market risk X 12.5
■ Tier 1= common stocks, perpetual non-accumulated preferred shares/sub-debts, legal reserves,..etc.
■ Tier 2= Perpetual accumulated preferred shares/sub-debts, convertible bonds, bad debt reserves, 45% of re-valuation of LT capital gains, sub-debt > 5 yrs …etc.
■ Tier 3= ST sub-debt, and non perpetual preferred shares
> 10%
6
Capital Adequacy
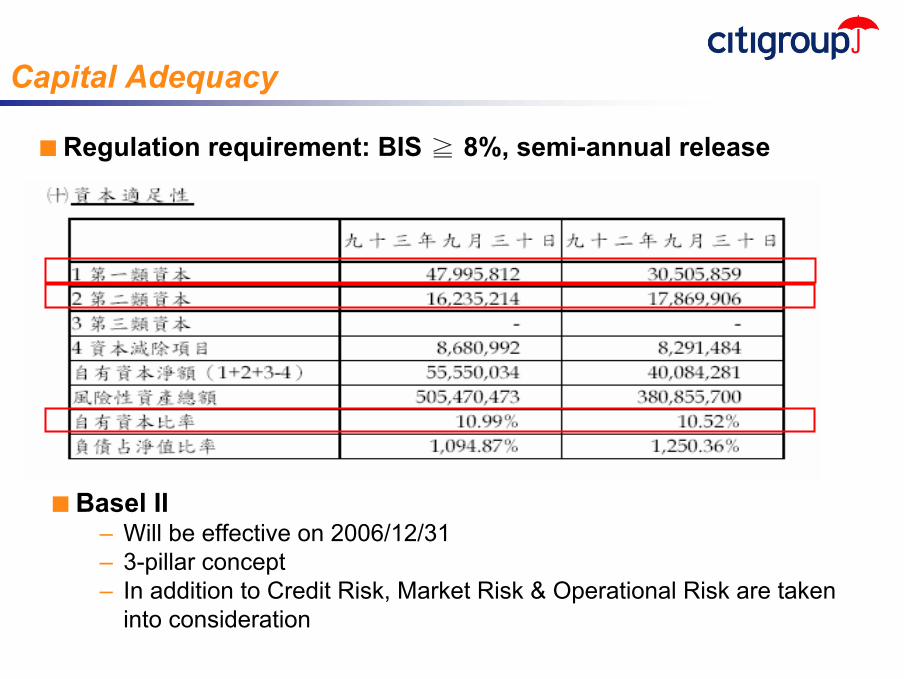
■ Regulation requirement: BIS ≧ 8%, semi-annual release
■ Basel II– Will be effective on 2006/12/31– 3-pillar concept– In addition to Credit Risk, Market Risk & Operational Risk are taken
into consideration
7
Capital Adequacy
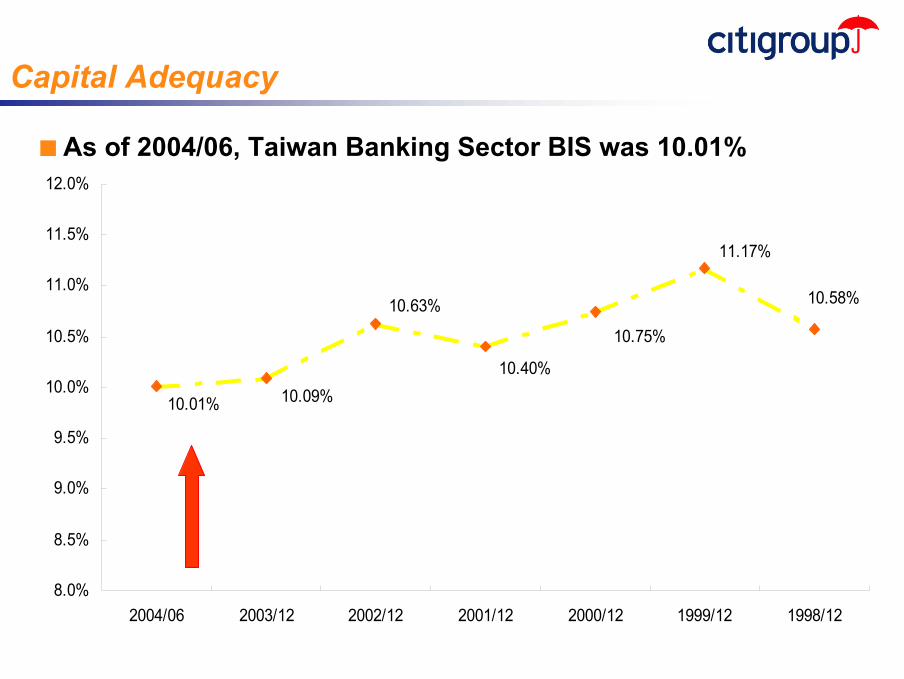
11.17%
10.75%
10.40%
10.63%
10.09%10.01%
10.58%
8.0%
8.5%
9.0%
9.5%
10.0%
10.5%
11.0%
11.5%
12.0%
2004/06 2003/12 2002/12 2001/12 2000/12 1999/12 1998/12
■ As of 2004/06, Taiwan Banking Sector BIS was 10.01%
8
Asset Quality
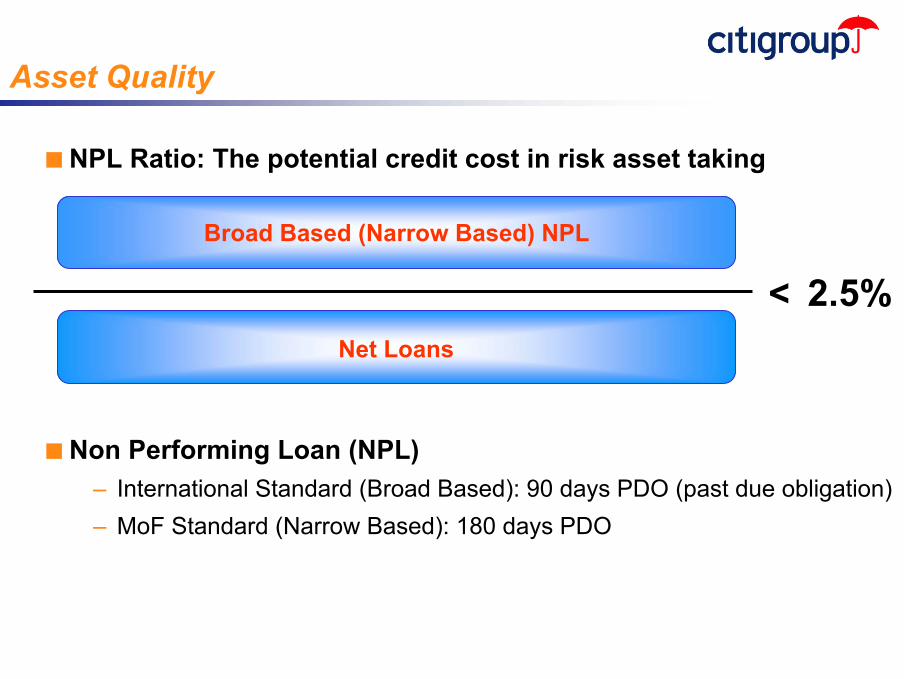
■ NPL Ratio: The potential credit cost in risk asset taking
Broad Based (Narrow Based) NPL
Net Loans
< 2.5%
■ Non Performing Loan (NPL)– International Standard (Broad Based): 90 days PDO (past due obligation) – MoF Standard (Narrow Based): 180 days PDO

9
Asset Quality
■ How to read NPL Ratio on financial statements
180 Days
90 Days
1.46% 2.25%90D NPL Ratio:
10
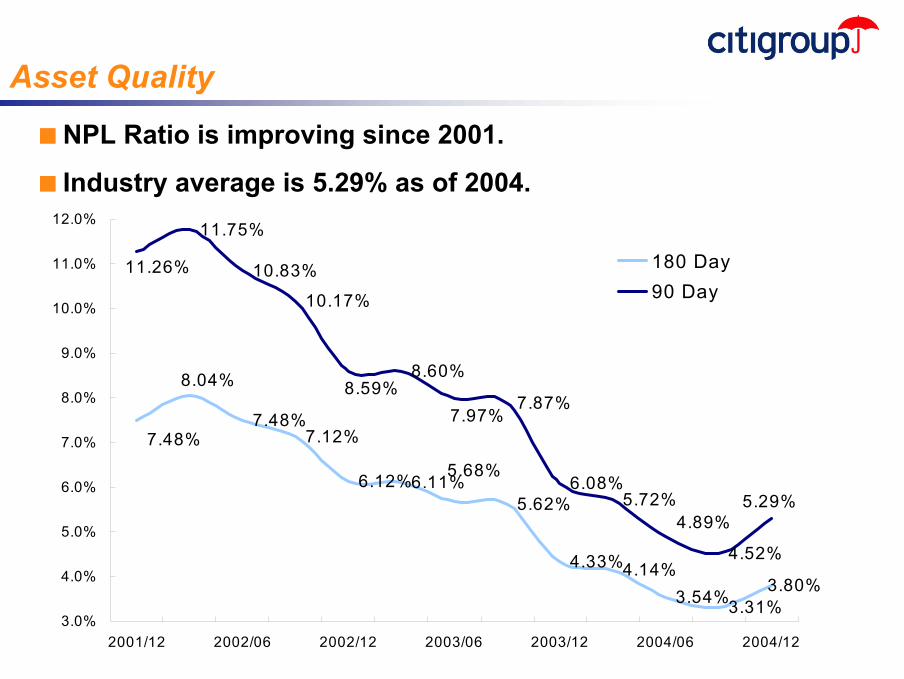
Asset Quality
7.48%7.12%
6.12%6.11%5.62%
4.33%4.14%3.54%3.31%
3.80%
11.75%
10.83%
10.17%
8.60%
7.87%
6.08%5.72%
4.52%
5.68%
7.48%
8.04%
11.26%
8.59%7.97%
5.29%4.89%
3.0%
4.0%
5.0%
6.0%
7.0%
8.0%
9.0%
10.0%
11.0%
12.0%
2001/12 2002/06 2002/12 2003/06 2003/12 2004/06 2004/12
180 Day90 Day
■ NPL Ratio is improving since 2001.
■ Industry average is 5.29% as of 2004.
11
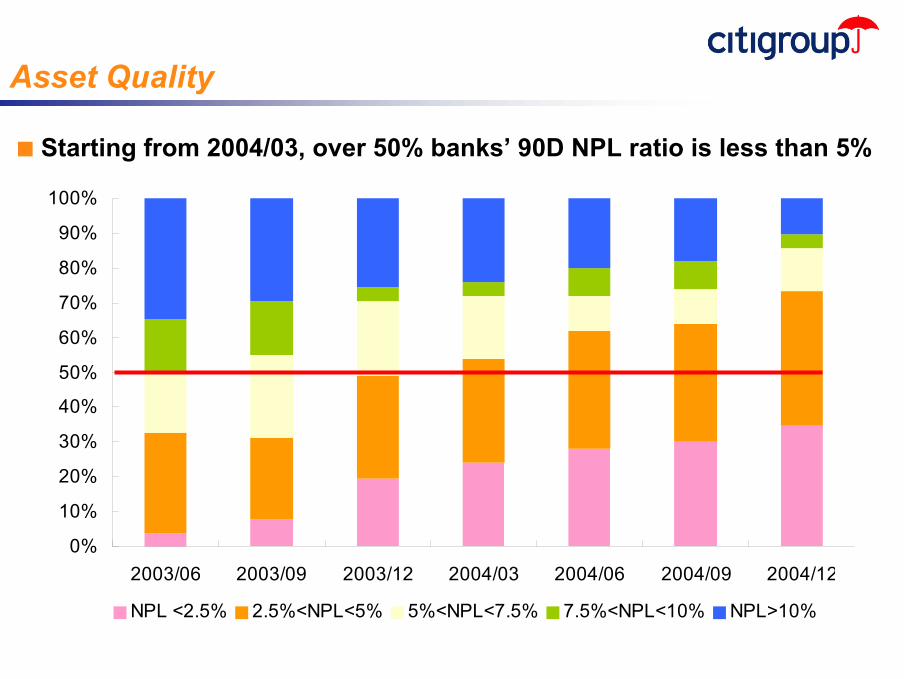
0%
10%
20%
30%
40%
50%
60%
70%
80%
90%
100%
2003/06 2003/09 2003/12 2004/03 2004/06 2004/09 2004/12
NPL <2.5% 2.5%<NPL<5% 5%<NPL<7.5% 7.5%<NPL<10% NPL>10%
Asset Quality
■ Starting from 2004/03, over 50% banks’ 90D NPL ratio is less than 5%
12
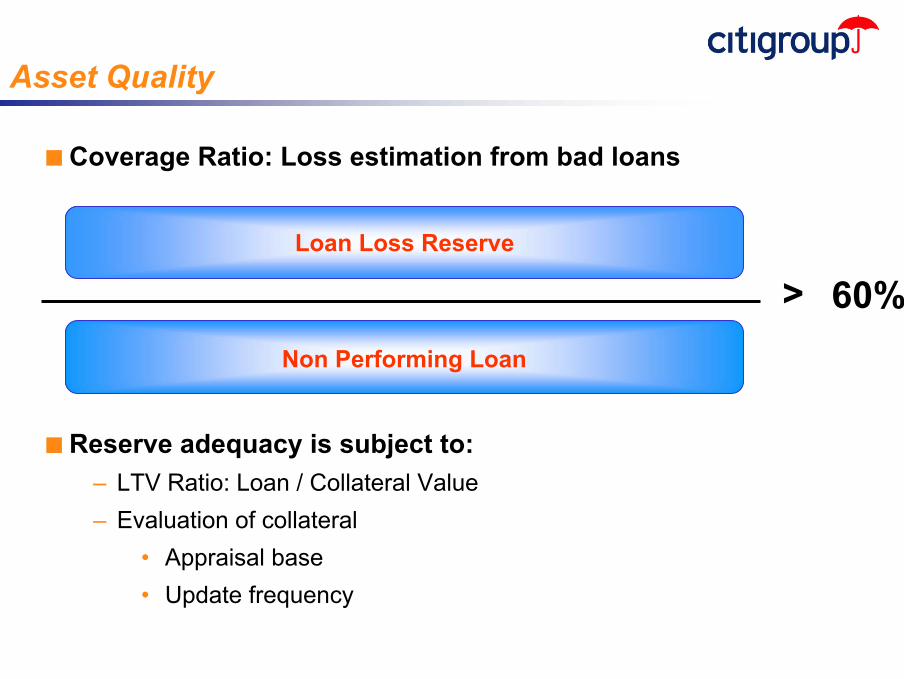
Asset Quality
■ Coverage Ratio: Loss estimation from bad loans
Loan Loss Reserve
Non Performing Loan
> 60%
■ Reserve adequacy is subject to:– LTV Ratio: Loan / Collateral Value– Evaluation of collateral
• Appraisal base• Update frequency
13
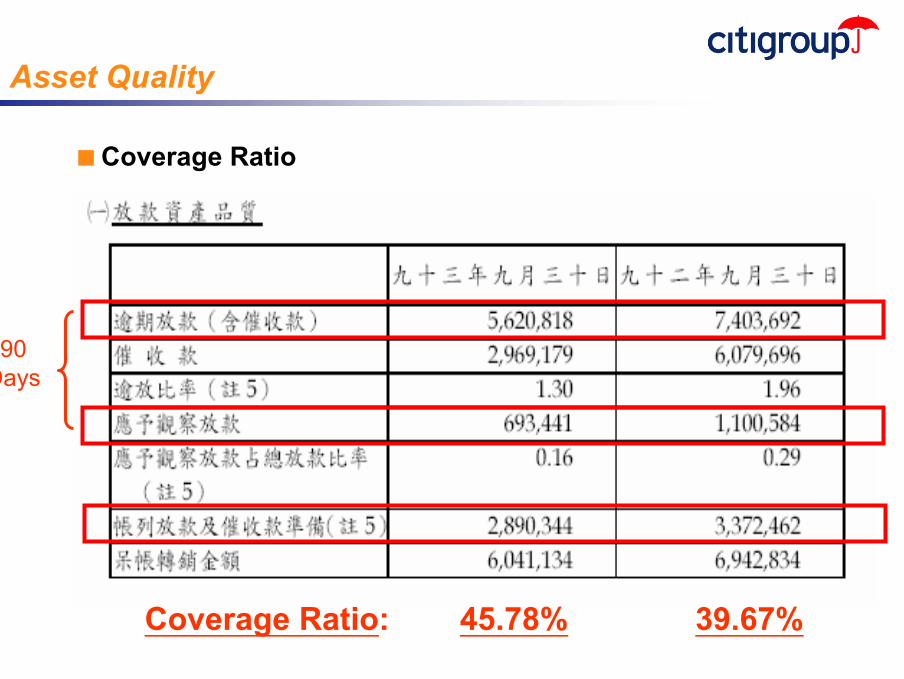
Asset Quality
■ Coverage Ratio
90 Days
45.78% 39.67%Coverage Ratio:
14
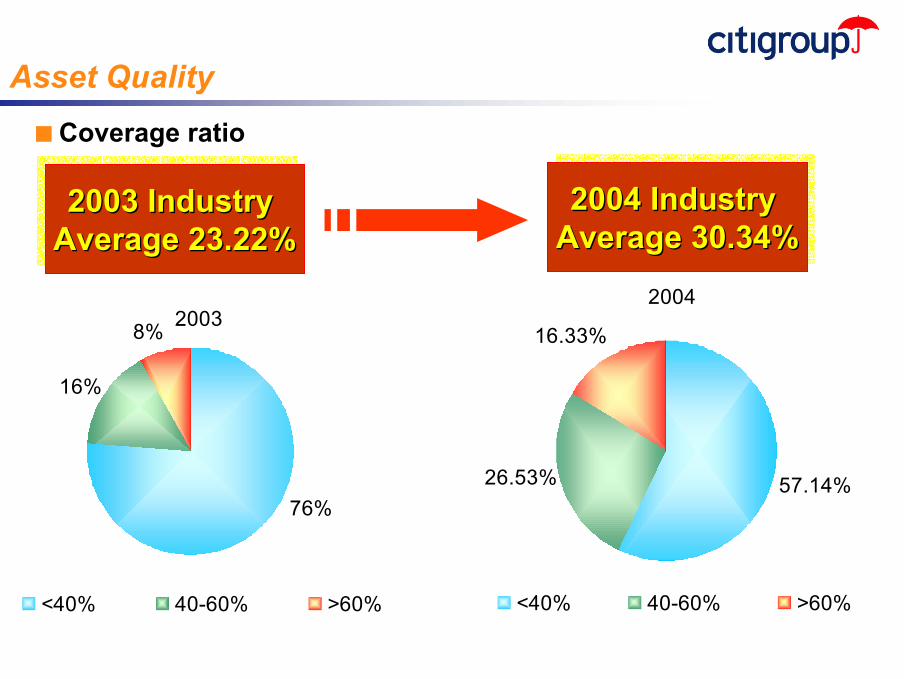
Asset Quality■ Coverage ratio
2004
16.33%
57.14%26.53%
<40% 40-60% >60%
2003 Industry Average 23.22%
2003 2003 Industry Industry Average 23.22%Average 23.22%
2004 Industry Average 30.34%2004 2004 Industry Industry
Average 30.34%Average 30.34%
20038%
76%
16%
<40% 40-60% >60%
15
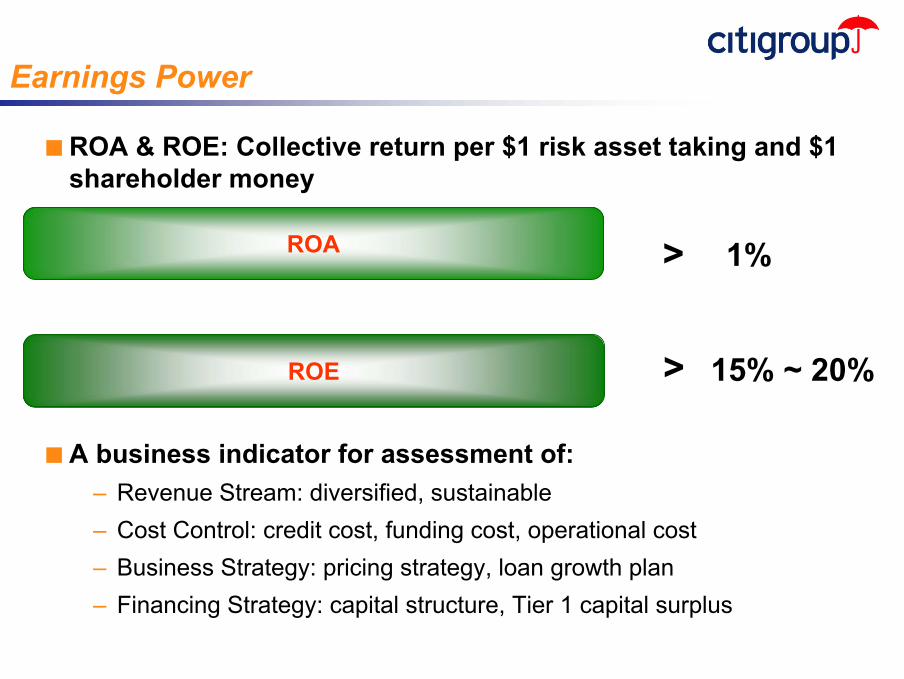
Earnings Power
ROA > 1%
ROE > 15% ~ 20%
■ ROA & ROE: Collective return per $1 risk asset taking and $1 shareholder money
■ A business indicator for assessment of:– Revenue Stream: diversified, sustainable– Cost Control: credit cost, funding cost, operational cost– Business Strategy: pricing strategy, loan growth plan– Financing Strategy: capital structure, Tier 1 capital surplus
16
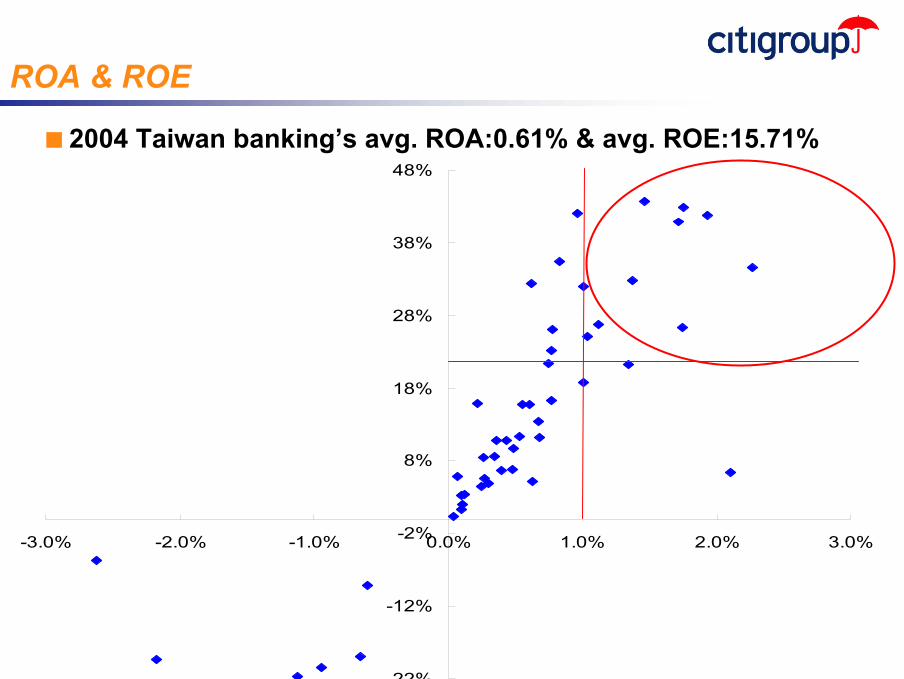
ROA & ROE
■ 2004 Taiwan banking’s avg. ROA:0.61% & avg. ROE:15.71%
-22%
-12%
-2%
8%
18%
28%
38%
48%
-3.0% -2.0% -1.0% 0.0% 1.0% 2.0% 3.0%
17
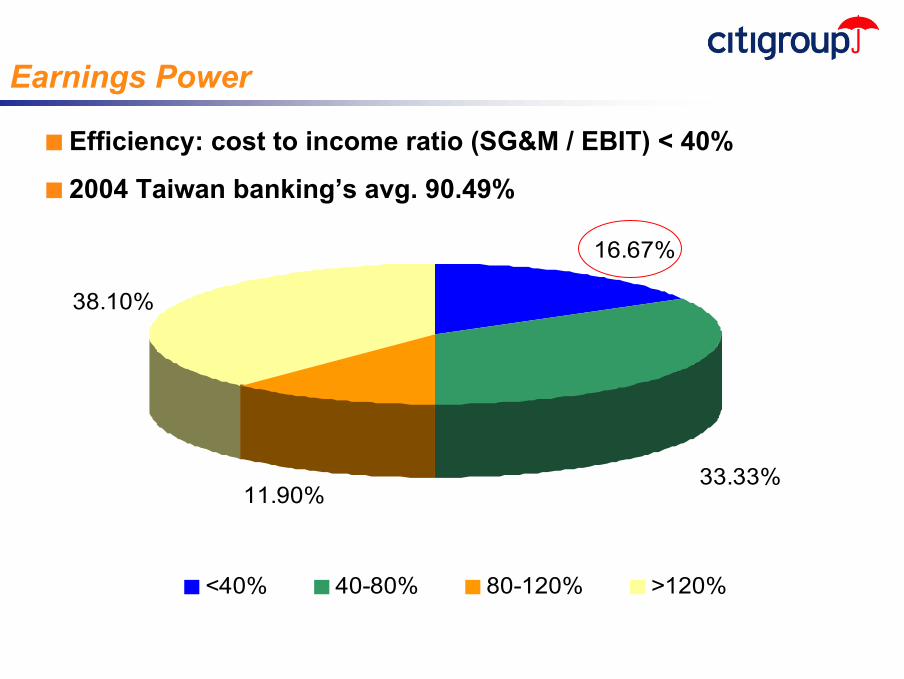
Earnings Power
■ Efficiency: cost to income ratio (SG&M / EBIT) < 40%
■ 2004 Taiwan banking’s avg. 90.49%
11.90%
38.10%
33.33%
16.67%
<40% 40-80% 80-120% >120%
18
Liquidity
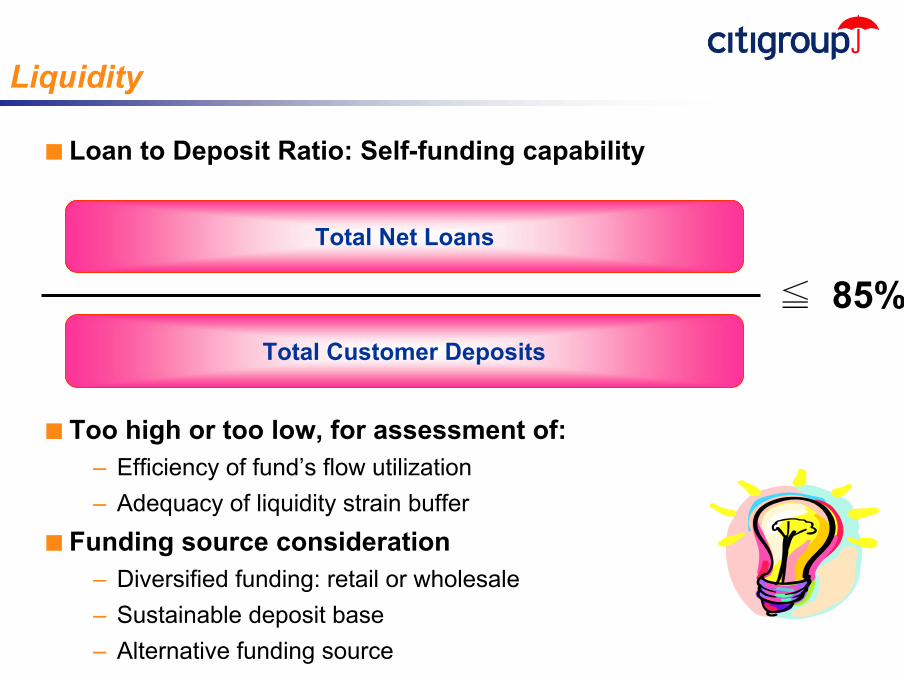
Total Net Loans
Total Customer Deposits
■ Loan to Deposit Ratio: Self-funding capability
■ Too high or too low, for assessment of:– Efficiency of fund’s flow utilization– Adequacy of liquidity strain buffer
■ Funding source consideration– Diversified funding: retail or wholesale– Sustainable deposit base– Alternative funding source
≦ 85%
19
40%
50%
60%
70%
80%
90%
100%
110%
120%
Liquidity
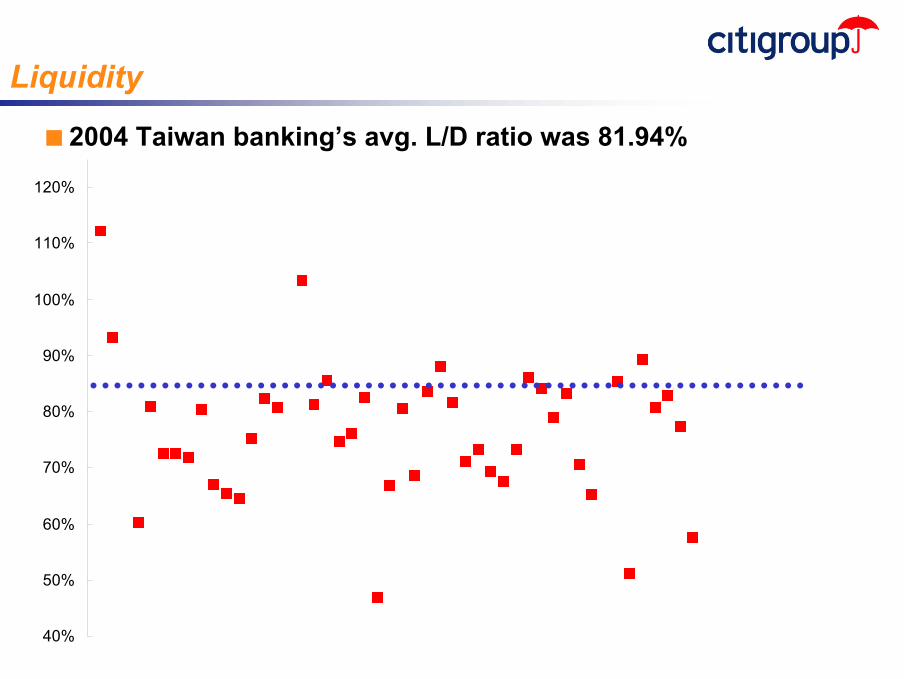
■ 2004 Taiwan banking’s avg. L/D ratio was 81.94%
20
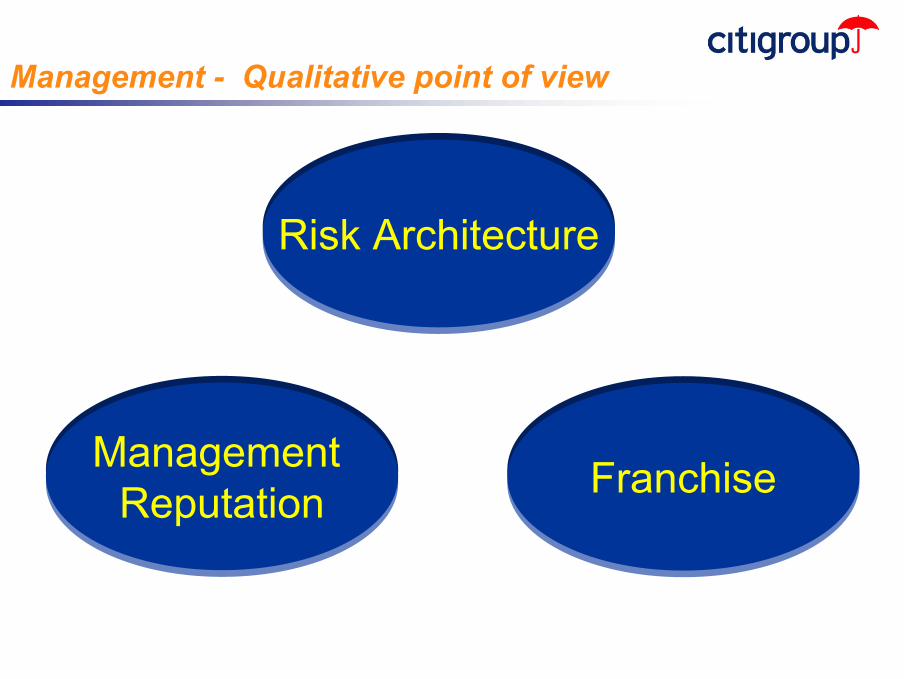
Management - Qualitative point of view
Risk Architecture
Management Reputation Franchise
21
Risk Architecture
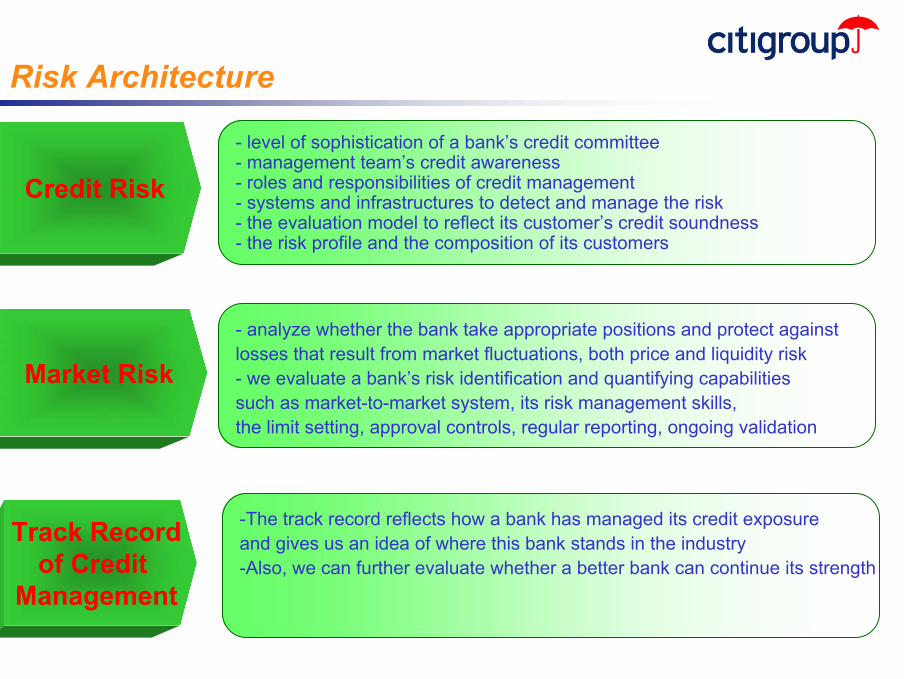
Credit Risk
Market Risk
Track Recordof Credit
Management
- level of sophistication of a bank’s credit committee - management team’s credit awareness- roles and responsibilities of credit management- systems and infrastructures to detect and manage the risk- the evaluation model to reflect its customer’s credit soundness- the risk profile and the composition of its customers
- analyze whether the bank take appropriate positions and protect against losses that result from market fluctuations, both price and liquidity risk- we evaluate a bank’s risk identification and quantifying capabilitiessuch as market-to-market system, its risk management skills, the limit setting, approval controls, regular reporting, ongoing validation
-The track record reflects how a bank has managed its credit exposure and gives us an idea of where this bank stands in the industry-Also, we can further evaluate whether a better bank can continue its strength
22
Management Reputation
IntegrityIntegrity
Strategic Strategic Vision of Vision of BusinessBusiness
Execution Execution and and
LeadershipLeadership
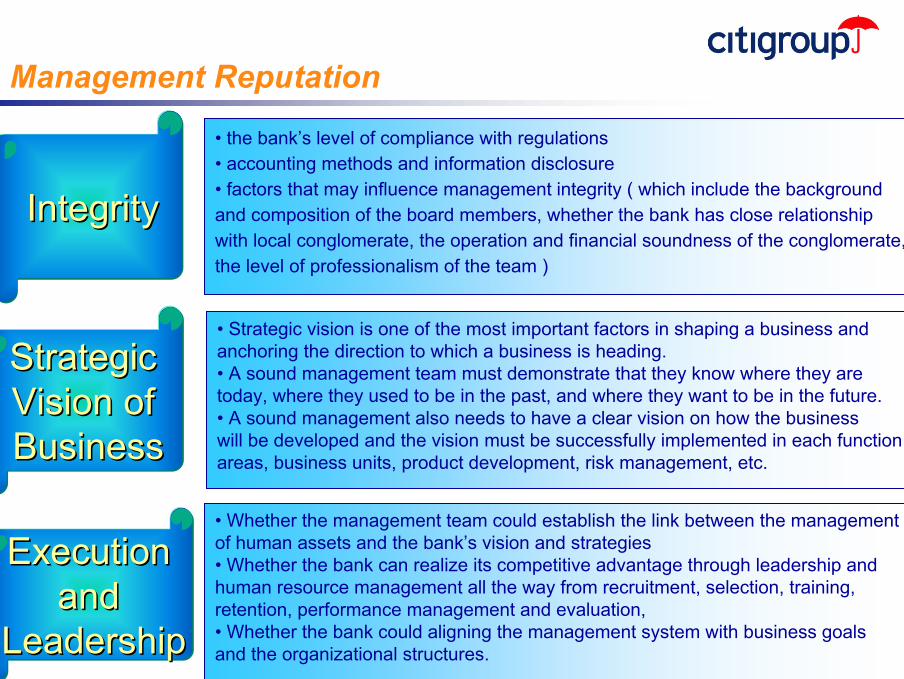
• the bank’s level of compliance with regulations• accounting methods and information disclosure• factors that may influence management integrity ( which include the background and composition of the board members, whether the bank has close relationshipwith local conglomerate, the operation and financial soundness of the conglomerate, the level of professionalism of the team )
• Strategic vision is one of the most important factors in shaping a business and anchoring the direction to which a business is heading. • A sound management team must demonstrate that they know where they are today, where they used to be in the past, and where they want to be in the future.• A sound management also needs to have a clear vision on how the business will be developed and the vision must be successfully implemented in each functionareas, business units, product development, risk management, etc.
• Whether the management team could establish the link between the management of human assets and the bank’s vision and strategies• Whether the bank can realize its competitive advantage through leadership and human resource management all the way from recruitment, selection, training, retention, performance management and evaluation, • Whether the bank could aligning the management system with business goals and the organizational structures.
23
Franchise
Scale Scale / Diversification / Diversification
of Businessof Business
Product Product InnovationInnovation
FinancialFinancialFlexibilityFlexibility
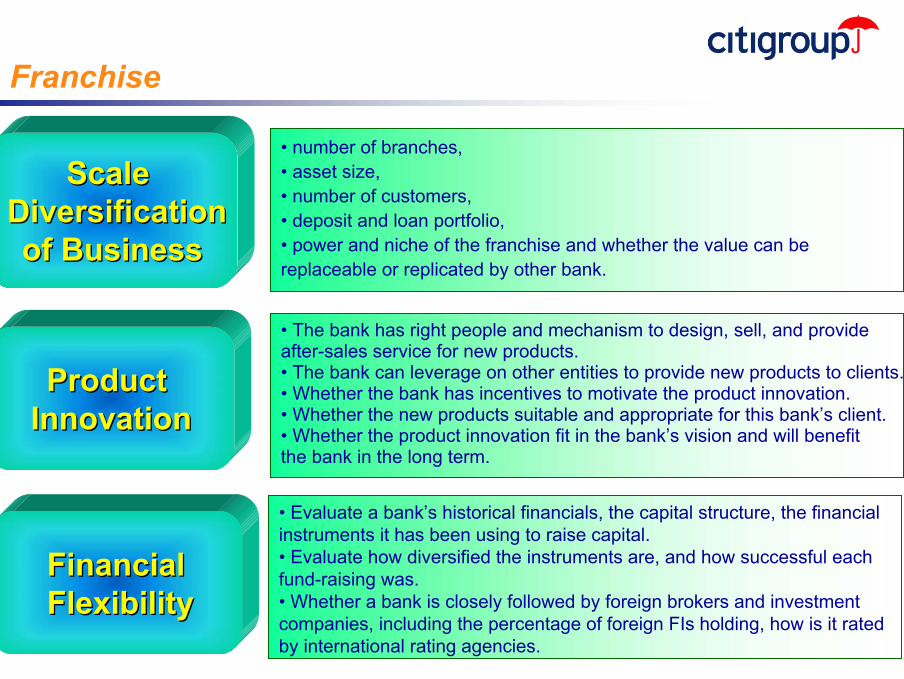
• number of branches, • asset size, • number of customers, • deposit and loan portfolio, • power and niche of the franchise and whether the value can be replaceable or replicated by other bank.
• The bank has right people and mechanism to design, sell, and provide after-sales service for new products.• The bank can leverage on other entities to provide new products to clients. • Whether the bank has incentives to motivate the product innovation.• Whether the new products suitable and appropriate for this bank’s client. • Whether the product innovation fit in the bank’s vision and will benefit the bank in the long term.
• Evaluate a bank’s historical financials, the capital structure, the financial instruments it has been using to raise capital.• Evaluate how diversified the instruments are, and how successful each fund-raising was.• Whether a bank is closely followed by foreign brokers and investment companies, including the percentage of foreign FIs holding, how is it rated by international rating agencies.
24
Quantitative and Qualitative Assessment
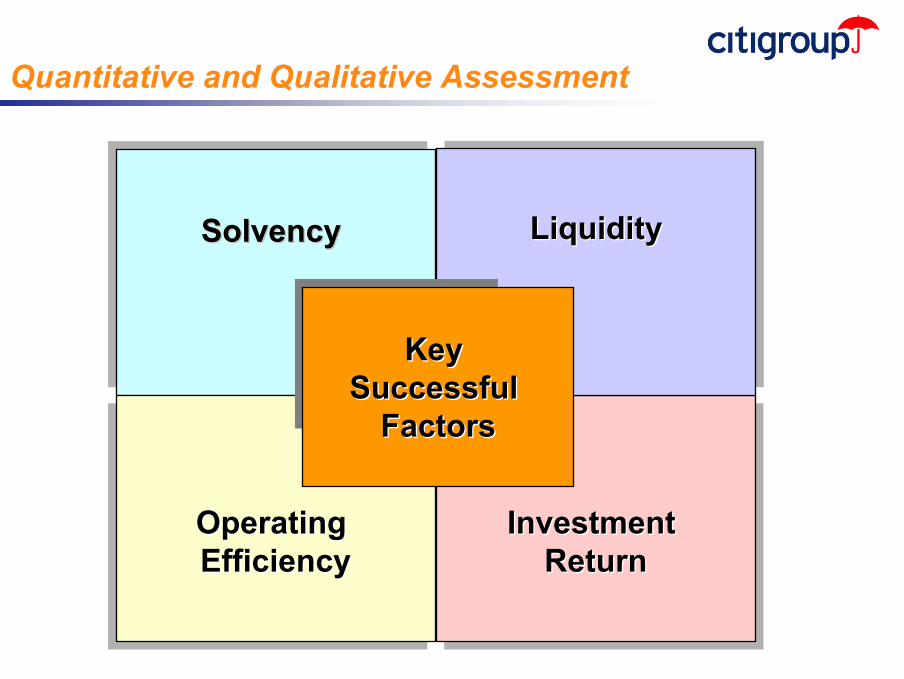
Operating EfficiencyOperating Operating EfficiencyEfficiency
Investment Return
Investment Investment ReturnReturn
LiquidityLiquidityLiquidity
Key Key Successful Successful
FactorsFactors
SolvencySolvency
25
■ Headline Text is 20– Bullet is 18
• Sub-bullet is 14» Footnote is 10.
Subtitle should be placed here (copy/paste this text box onto any slide)
Solvency
Solvency Ratio
= > 12%
Solvency Ratio
= > 12%
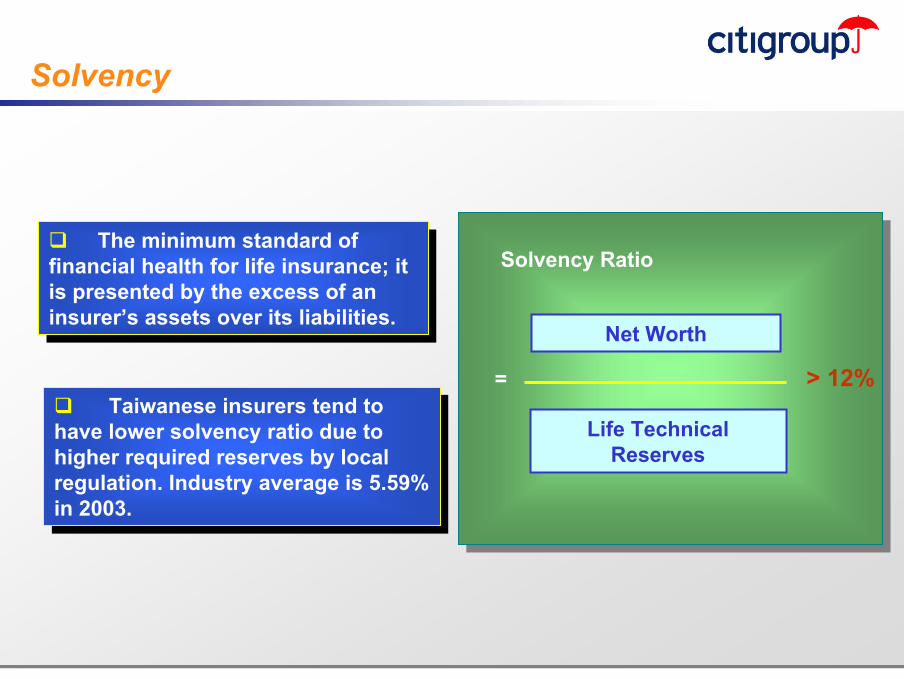
Net Worth
The minimum standard of financial health for life insurance; it is presented by the excess of an insurer’s assets over its liabilities.
The minimum standard of financial health for life insurance; it is presented by the excess of an insurer’s assets over its liabilities.
Taiwanese insurers tend to have lower solvency ratio due to higher required reserves by local regulation. Industry average is 5.59% in 2003.
Taiwanese insurers tend to have lower solvency ratio due to higher required reserves by local regulation. Industry average is 5.59% in 2003.
Life Technical Reserves
26
■ Headline Text is 20– Bullet is 18
• Sub-bullet is 14» Footnote is 10.
Subtitle should be placed here (copy/paste this text box onto any slide)
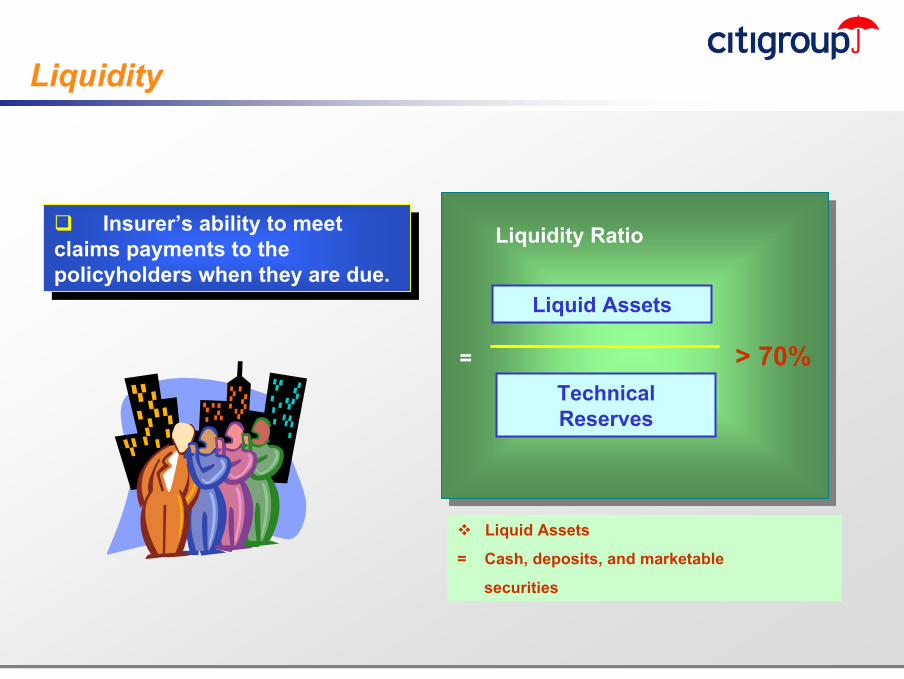
Liquidity
Insurer’s ability to meet claims payments to the policyholders when they are due.
Insurer’s ability to meet claims payments to the policyholders when they are due.
Liquidity Ratio
= > 70%
Liquidity Ratio
= > 70%
Liquid Assets
Technical Reserves
Liquid Assets
= Cash, deposits, and marketable
securities
27
■ Headline Text is 20– Bullet is 18
• Sub-bullet is 14» Footnote is 10.
Subtitle should be placed here (copy/paste this text box onto any slide)
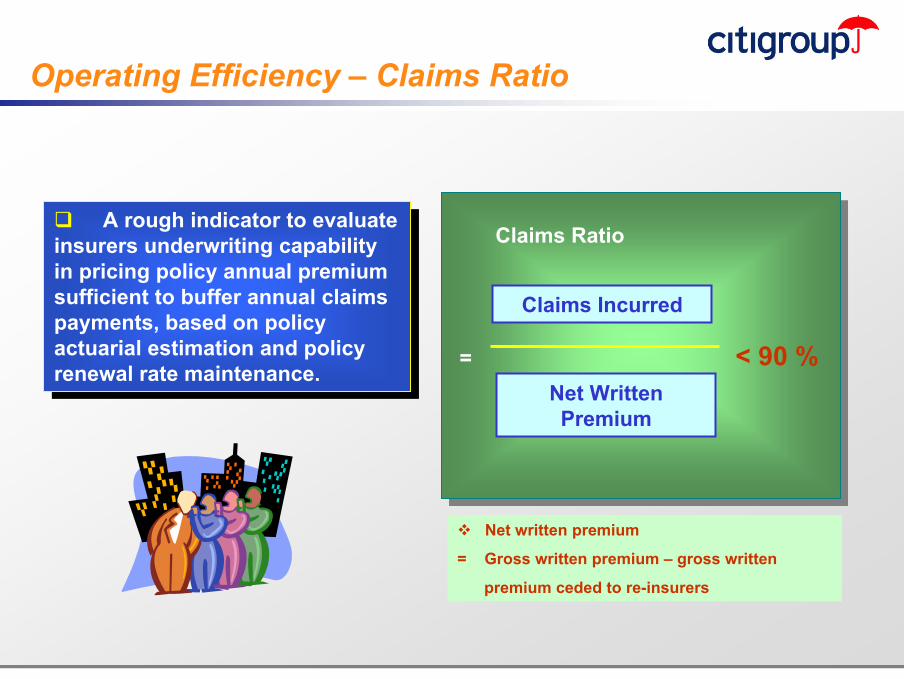
Operating Efficiency – Claims Ratio
A rough indicator to evaluate insurers underwriting capability in pricing policy annual premium sufficient to buffer annual claims payments, based on policy actuarial estimation and policy renewal rate maintenance.
A rough indicator to evaluate insurers underwriting capability in pricing policy annual premium sufficient to buffer annual claims payments, based on policy actuarial estimation and policy renewal rate maintenance.
Claims Ratio
= < 90 %
Claims Ratio
= < 90 %
Claims Incurred
Net Written Premium
Net written premium
= Gross written premium – gross written
premium ceded to re-insurers
28
■ Headline Text is 20– Bullet is 18
• Sub-bullet is 14» Footnote is 10.
Subtitle should be placed here (copy/paste this text box onto any slide)
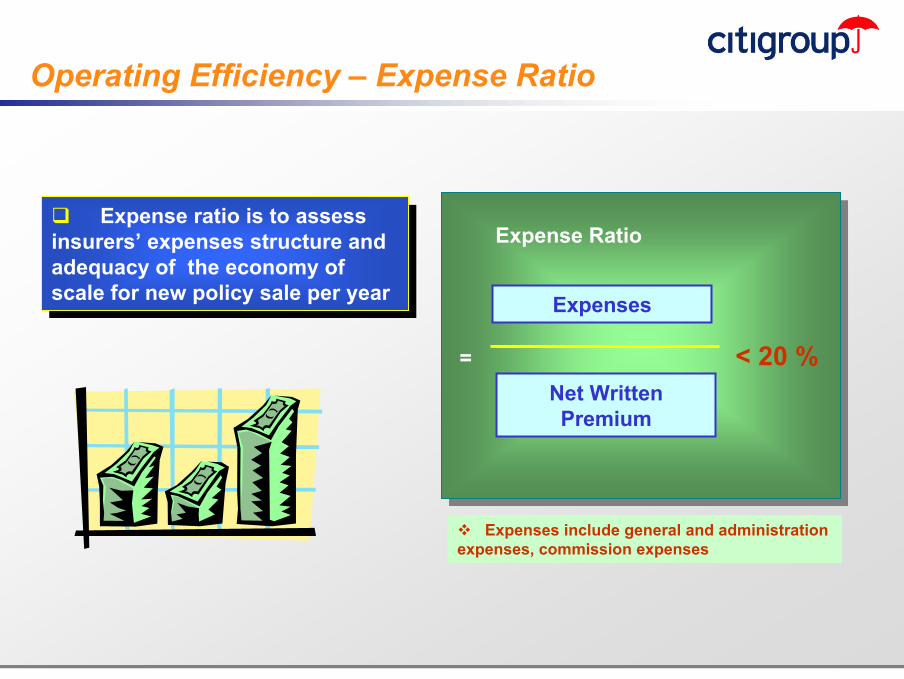
Operating Efficiency – Expense Ratio
Expense ratio is to assess insurers’ expenses structure and adequacy of the economy of scale for new policy sale per year
Expense ratio is to assess insurers’ expenses structure and adequacy of the economy of scale for new policy sale per year
Expense Ratio
= < 20 %
Expense Ratio
= < 20 %
Expenses
Net Written Premium
Expenses include general and administration expenses, commission expenses
29
■ Headline Text is 20– Bullet is 18
• Sub-bullet is 14» Footnote is 10.
Subtitle should be placed here (copy/paste this text box onto any slide)
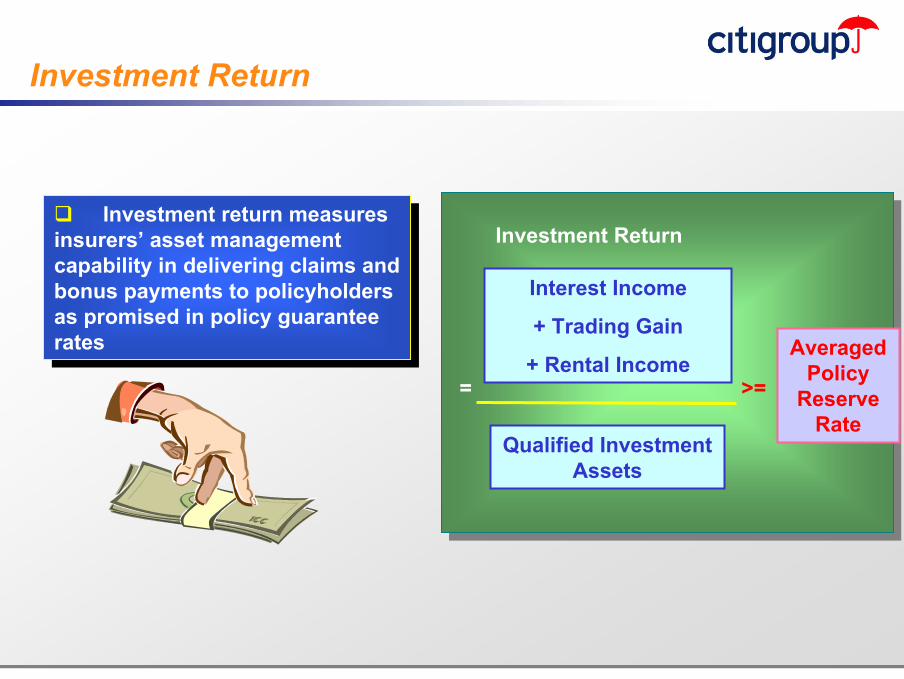
Investment Return
Investment return measures insurers’ asset management capability in delivering claims and bonus payments to policyholders as promised in policy guarantee rates
Investment return measures insurers’ asset management capability in delivering claims and bonus payments to policyholders as promised in policy guarantee rates
Investment Return
= >=
Investment Return
= >=
Interest Income
+ Trading Gain
+ Rental Income
Qualified Investment Assets
Averaged Policy
Reserve Rate
30
■ Headline Text is 20– Bullet is 18
• Sub-bullet is 14» Footnote is 10.
Subtitle should be placed here (copy/paste this text box onto any slide)
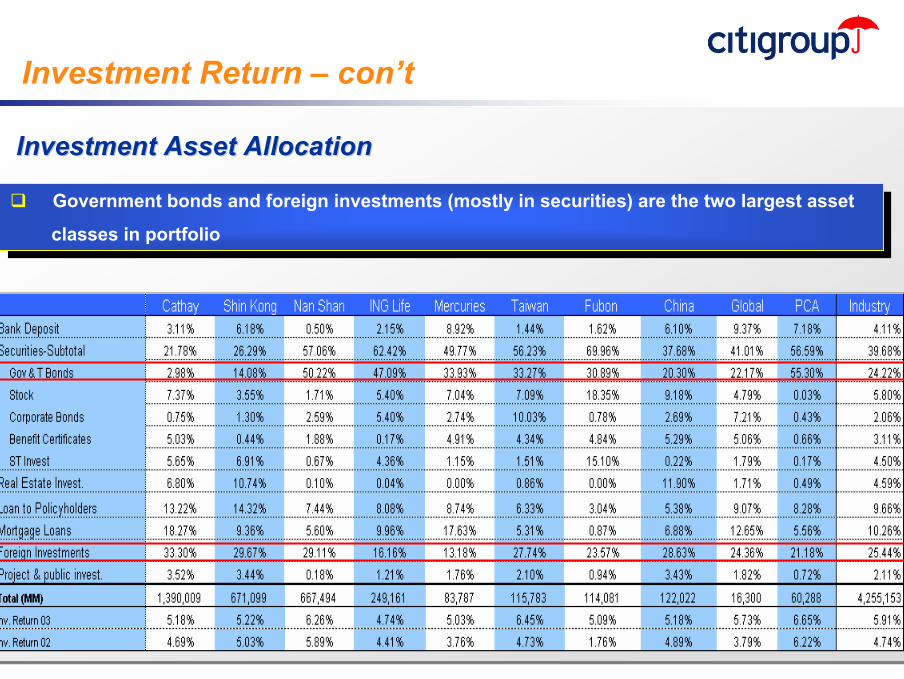
Investment Return – con’t
Investment Asset AllocationInvestment Asset Allocation
Government bonds and foreign investments (mostly in securities) are the two largest asset
classes in portfolio
Government bonds and foreign investments (mostly in securities) are the two largest asset
classes in portfolio
31
■ Headline Text is 20– Bullet is 18
• Sub-bullet is 14» Footnote is 10.
Subtitle should be placed here (copy/paste this text box onto any slide)
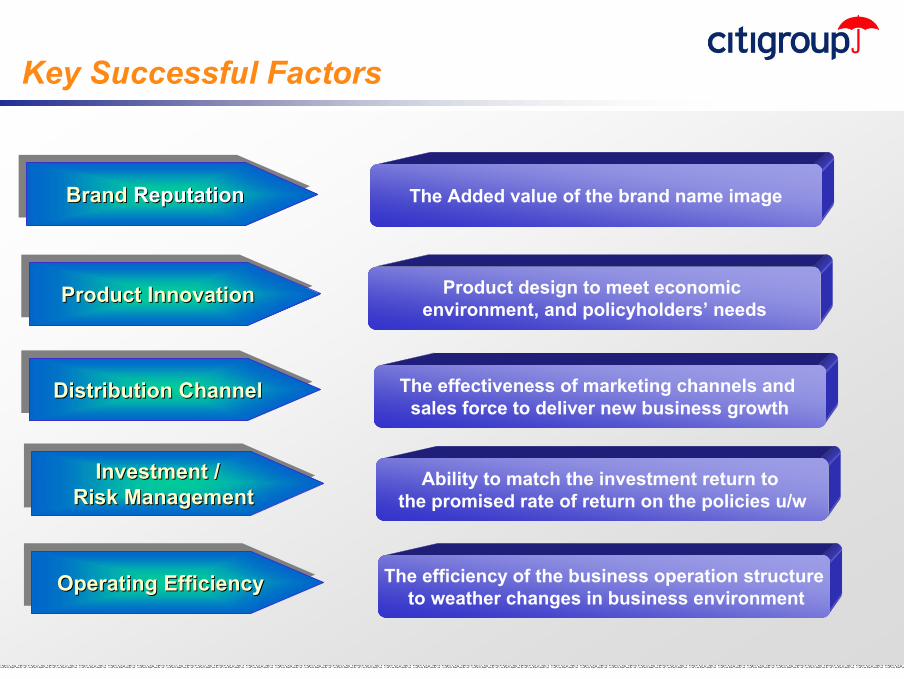
Key Successful Factors
Brand ReputationBrandBrand ReputationReputation The Added value of the brand name image
Investment / Risk Management
Investment / Investment / Risk ManagementRisk Management
Ability to match the investment return to the promised rate of return on the policies u/w
Product InnovationProduct InnovationProduct Innovation Product design to meet economic environment, and policyholders’ needs
Distribution ChannelDistribution ChannelDistribution Channel The effectiveness of marketing channels and sales force to deliver new business growth
Operating EfficiencyOperating EfficiencyOperating Efficiency The efficiency of the business operation structureto weather changes in business environment

Industry Development Trend and Focus
33
■ Headline Text is 20– Bullet is 18
• Sub-bullet is 14» Footnote is 10.
Subtitle should be placed here (copy/paste this text box onto any slide)
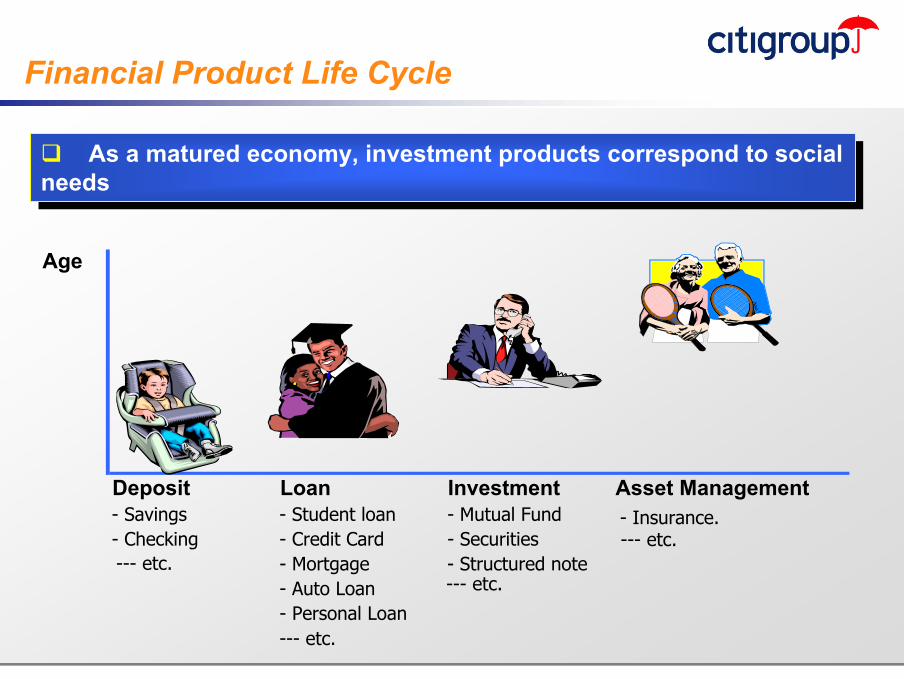
Deposit Loan Investment Asset Management- Savings - Student loan - Mutual Fund- Checking - Credit Card - Securities
- Mortgage - Structured note- Auto Loan- Personal Loan--- etc.
--- etc.--- etc.
- Insurance.--- etc.
Age
Financial Product Life Cycle
As a matured economy, investment products correspond to social needs
As a matured economy, investment products correspond to social needs
34
■ Headline Text is 20– Bullet is 18
• Sub-bullet is 14» Footnote is 10.
Subtitle should be placed here (copy/paste this text box onto any slide)
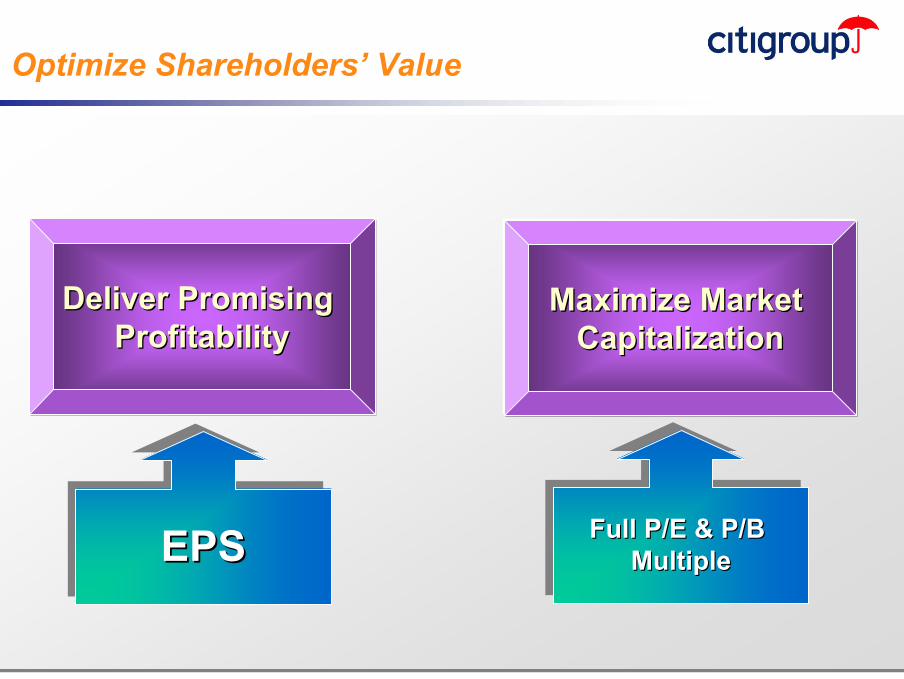
Optimize Shareholders’ Value
Deliver Promising Deliver Promising ProfitabilityProfitability
EPSEPSEPS
Maximize Market Maximize Market CapitalizationCapitalization
Full P/E & P/B Multiple
Full P/E & P/B Full P/E & P/B MultipleMultiple
35
■ Headline Text is 20– Bullet is 18
• Sub-bullet is 14» Footnote is 10.
Subtitle should be placed here (copy/paste this text box onto any slide)
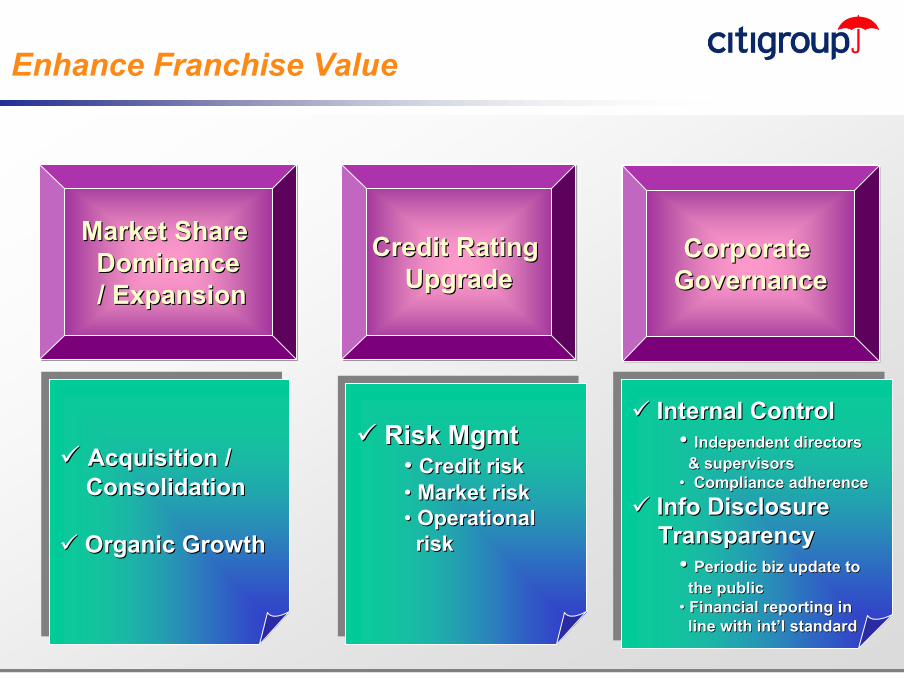
Enhance Franchise Value
Market Share Market Share DominanceDominance/ Expansion/ Expansion
Credit Rating Credit Rating UpgradeUpgrade
Corporate Corporate GovernanceGovernance
Acquisition / Consolidation
Organic Growth
Acquisition / Acquisition / ConsolidationConsolidation
Organic GrowthOrganic Growth
Risk Mgmt• Credit risk• Market risk• Operational
risk
Risk MgmtRisk Mgmt•• Credit riskCredit risk•• Market riskMarket risk•• Operational Operational
riskrisk
Internal Control• Independent directors
& supervisors• Compliance adherence
Info Disclosure Transparency
• Periodic biz update to the public
• Financial reporting in line with int’l standard
Internal ControlInternal Control•• Independent directors Independent directors & supervisors& supervisors
•• Compliance adherenceCompliance adherence
Info Disclosure Info Disclosure TransparencyTransparency
•• Periodic biz update to Periodic biz update to the publicthe public
•• Financial reporting in Financial reporting in line with line with intint’’l standard l standard

Strategies & Tactics to Become a Better FI
37
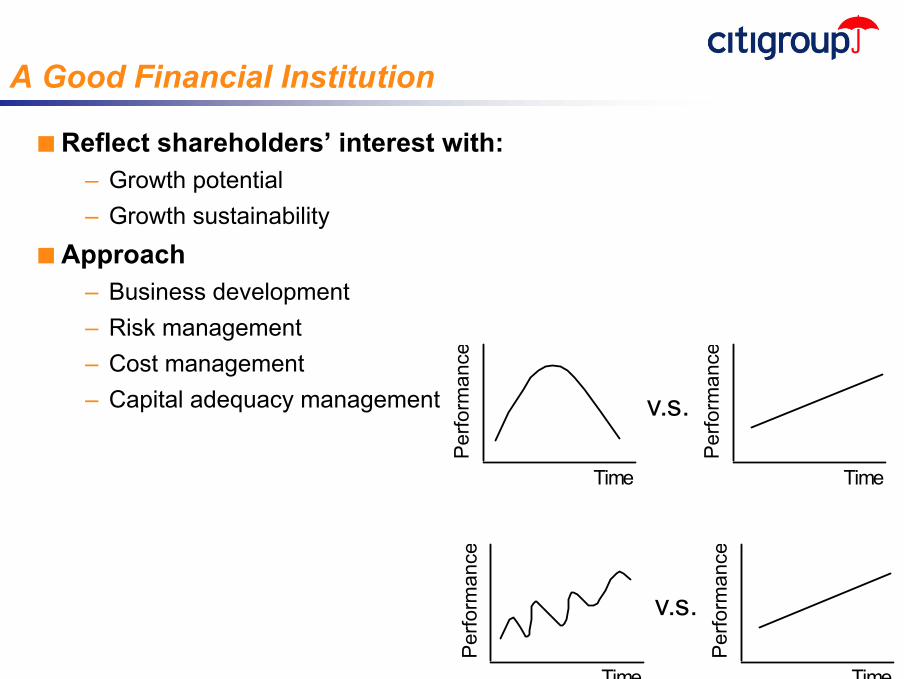
A Good Financial Institution
■ Reflect shareholders’ interest with:– Growth potential– Growth sustainability
■ Approach– Business development– Risk management– Cost management– Capital adequacy management
TimeP
erfo
rman
ceTime
Per
form
ance
v.s.
Time
Per
form
ance
Time
Per
form
ance
v.s.
38
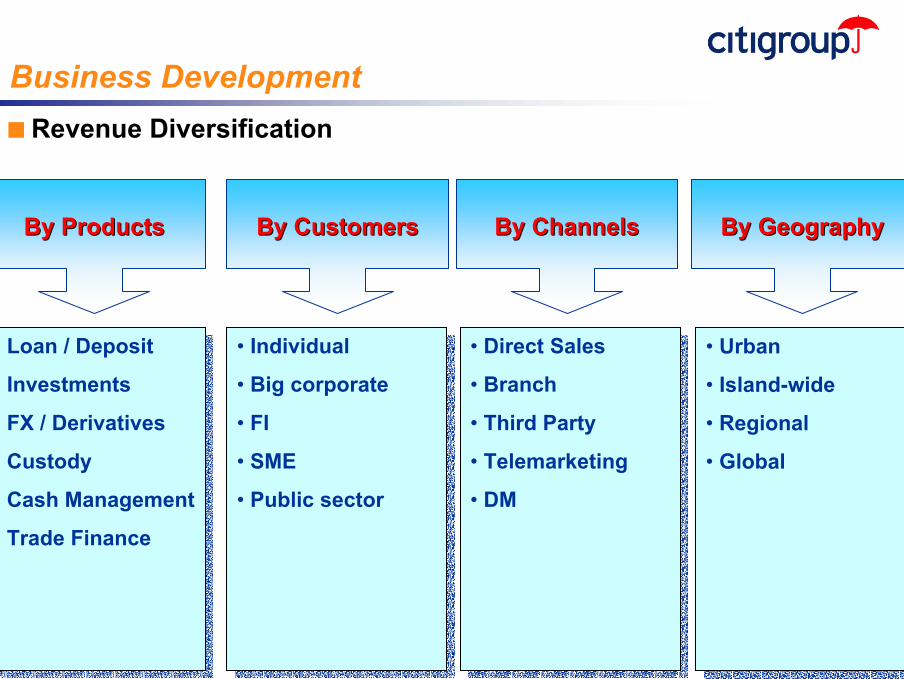
Business Development
By ProductsBy Products
• Loan / Deposit
• Investments
• FX / Derivatives
• Custody
• Cash Management
• Trade Finance
• Loan / Deposit
• Investments
• FX / Derivatives
• Custody
• Cash Management
• Trade Finance
By CustomersBy Customers
• Individual
• Big corporate
• FI
• SME
• Public sector
• Individual
• Big corporate
• FI
• SME
• Public sector
By ChannelsBy Channels
• Direct Sales
• Branch
• Third Party
• Telemarketing
• DM
• Direct Sales
• Branch
• Third Party
• Telemarketing
• DM
By GeographyBy Geography
• Urban
• Island-wide
• Regional
• Global
• Urban
• Island-wide
• Regional
• Global
■ Revenue Diversification
39
Business Development
■ Revenue Sustainability– Create customer loyalty (active card usage, low mortgage attrition,
high insurance retention, less frequent redemption, better x-sell ..etc)– Develop appropriate product mix (annuity revenue v.s. deal revenue)– Build cross-sale to same customer base ( finance v.s. investment v.s.
risk hedging)– Build franchise coverage/value
■ Revenue Growth– New customer / Selective Target Market– New product / Innovation– New market development / penetration– Organic growth vs Inorganic growth (M&A e.g.)
40
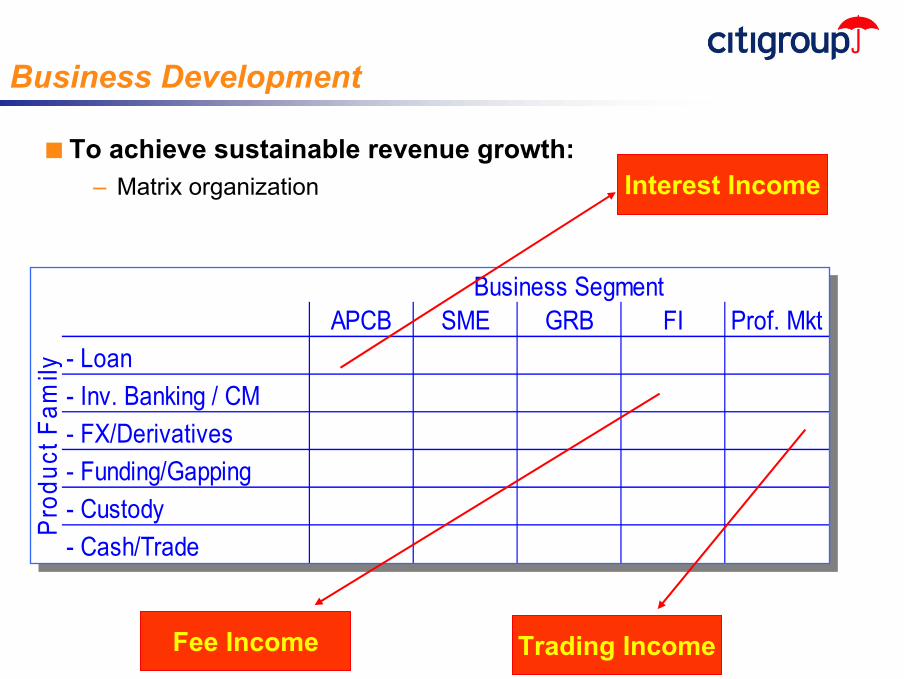
Business Development
■ To achieve sustainable revenue growth:– Matrix organization
APCB SME GRB FI Prof. Mkt- Loan- Inv. Banking / CM- FX/Derivatives- Funding/Gapping- Custody- Cash/Trade
Pro
duct
Fam
ily
Business Segment
Interest Income
Fee Income Trading Income
41
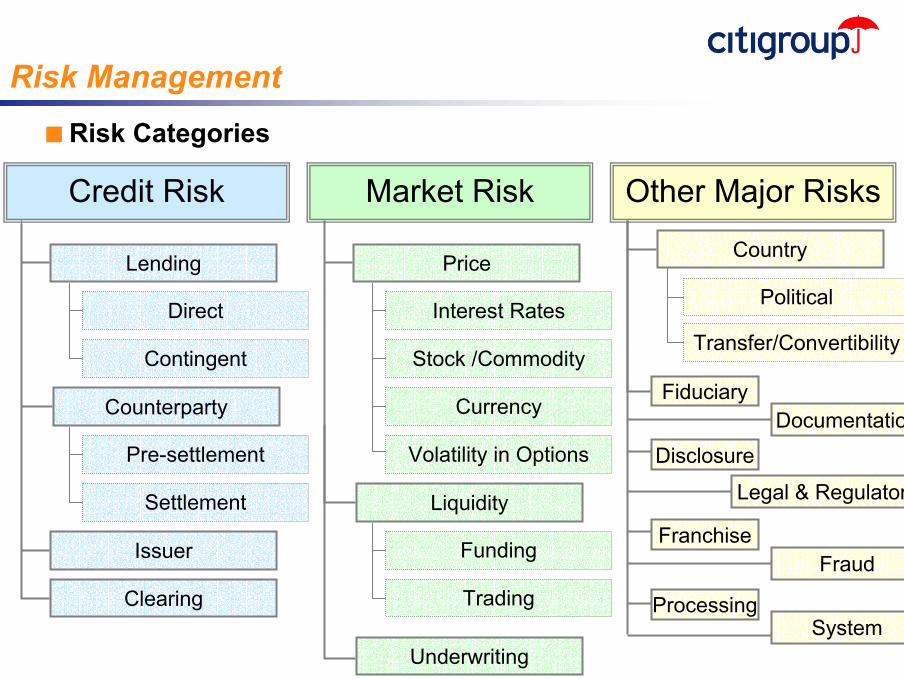
Credit Risk Market Risk Other Major Risks
Lending
Direct
Clearing
Issuer
Counterparty
Contingent
Settlement
Pre-settlement
Price
Liquidity
Interest Rates
Stock /Commodity
Currency
Funding
Trading
Country
FiduciaryDocumentation
Political
Transfer/Convertibility
Underwriting
Volatility in Options Disclosure
Legal & Regulatory
FranchiseFraud
ProcessingSystem
Risk Management■ Risk Categories
42
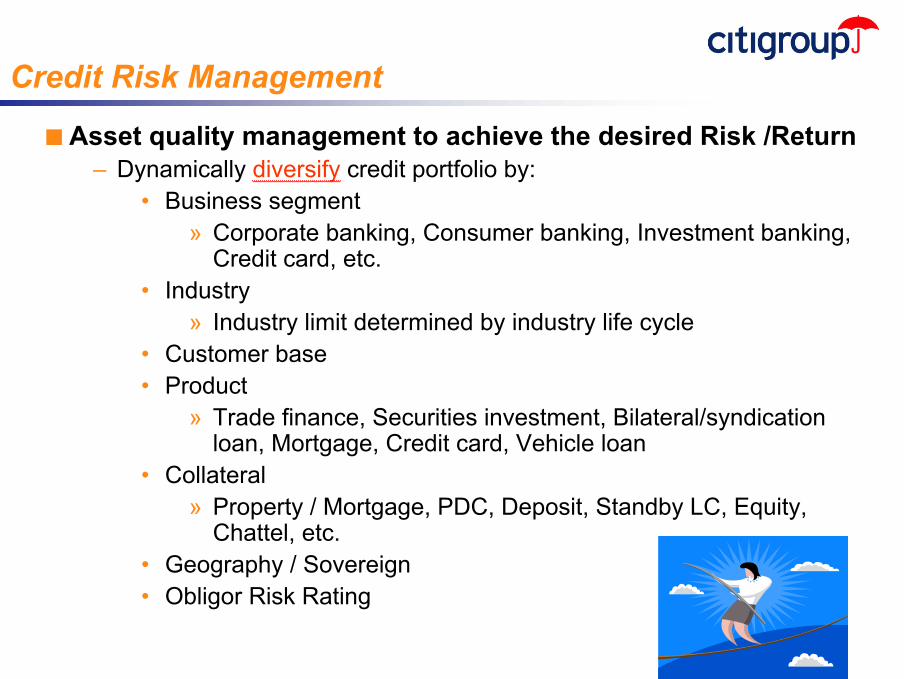
Credit Risk Management
■ Asset quality management to achieve the desired Risk /Return– Dynamically diversify credit portfolio by:
• Business segment» Corporate banking, Consumer banking, Investment banking,
Credit card, etc.• Industry
» Industry limit determined by industry life cycle• Customer base• Product
» Trade finance, Securities investment, Bilateral/syndication loan, Mortgage, Credit card, Vehicle loan
• Collateral» Property / Mortgage, PDC, Deposit, Standby LC, Equity,
Chattel, etc.• Geography / Sovereign• Obligor Risk Rating

43
Credit Risk Management
■ Use risk rating methodology to reflect risk level of the credit portfolio
– Scoring method– Forced ranking method
■ Develop early warning / classification process to proactively monitor the credit quality
■ Establish control limit within portfolio via segment, product
■ Establish effective / efficient remedy management process
■ A required factor for BIS ratio determination under the new Basel Capital Accord
44
Market Risk Management
■ Liquidity Management– Diversified funding sources
• Deposit / interbank borrowing / capital market• committed v.s. un-committed• short-term v.s. long-term
– Appropriate liquid asset level– Dynamic asset/liability management : tenor, interest rate, currency
match– Stress test
■ Rate Risk Management– VAR / Loss Limit / Sensitivity Limit– Stop loss discipline
■ Underwriting / Syndication Risk
45
Operation Risk Management
■ Operational performance– Infrastructure
• System implementation and employee training• Routinely update infrastructure and maintain its reliability and
productivity– Process efficiency
• Standard procedure enhances efficiency• Interfaces for optimum access
– Back-up plan• Business continuity test
■ Compliance risk– Internal control– Regulations
46
Cost Management
■ Marketing & Distribution– Measure the effectiveness & efficiency
• Marketing : DM / Advertisement• Distribution :
» Branch» ATM or other automation platforms» Internet» Telemarketing» Direct sales / RM / AO» 3rd party
47
Cost Management
■ Processing– Regionalization / Centralization / Outsourcing– Automation / Straight-through Processing (STP)– ATM, E-trade, on-line insurance, phone-banking– Back-end automation / rationalization – re-engineering– quality projects
48
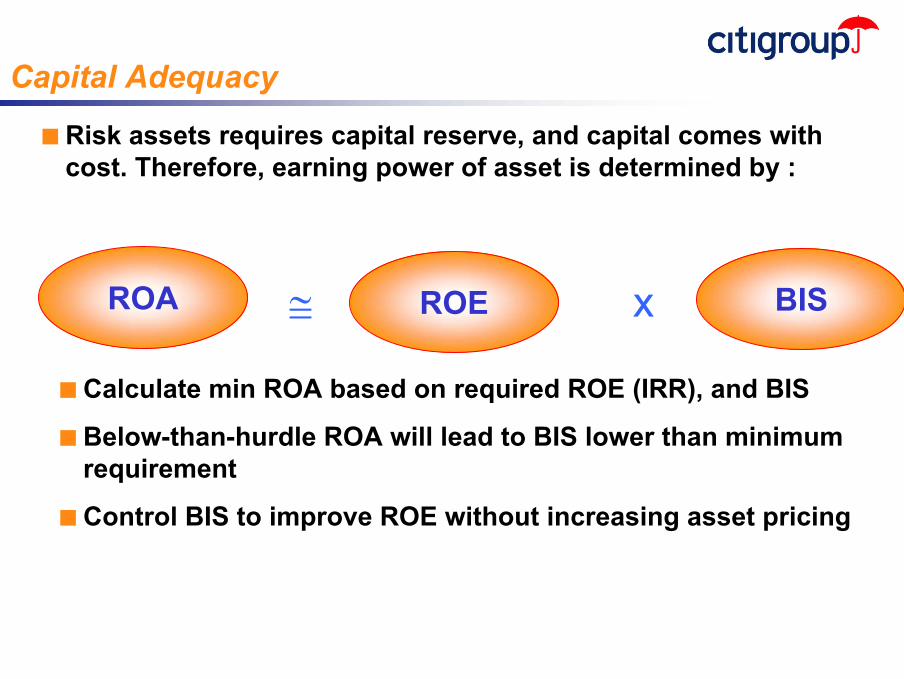
Capital Adequacy
■ Risk assets requires capital reserve, and capital comes with cost. Therefore, earning power of asset is determined by :
ROA ≅ ROE x BIS
■ Calculate min ROA based on required ROE (IRR), and BIS
■ Below-than-hurdle ROA will lead to BIS lower than minimum requirement
■ Control BIS to improve ROE without increasing asset pricing
49
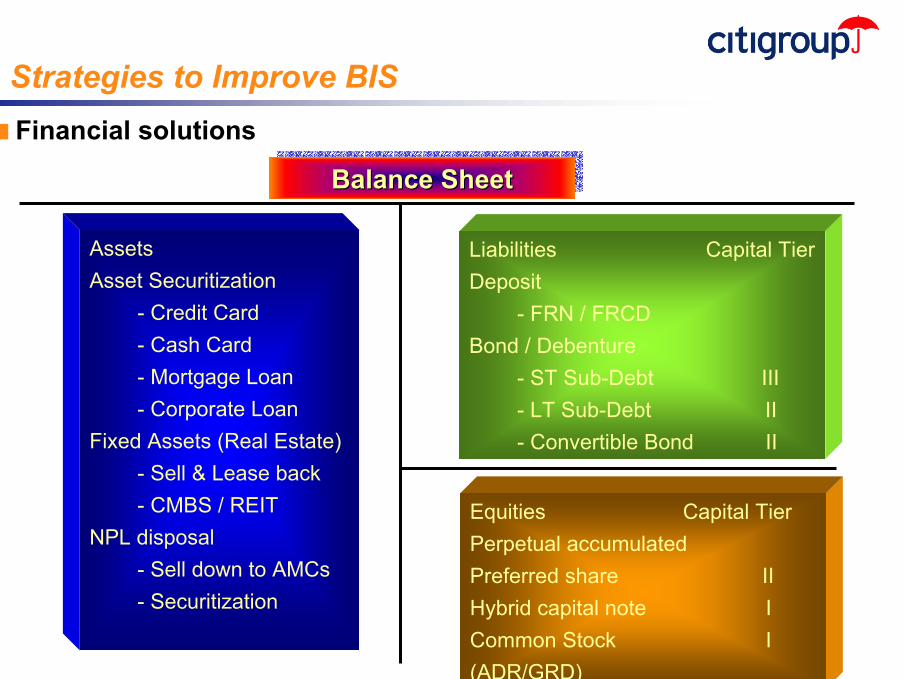
Strategies to Improve BIS
Balance SheetBalance SheetBalance Sheet
AssetsAsset Securitization
- Credit Card- Cash Card- Mortgage Loan- Corporate Loan
Fixed Assets (Real Estate)- Sell & Lease back- CMBS / REIT
NPL disposal- Sell down to AMCs- Securitization
Liabilities Capital TierDeposit
- FRN / FRCDBond / Debenture
- ST Sub-Debt III- LT Sub-Debt II- Convertible Bond II
Equities Capital TierPerpetual accumulatedPreferred share IIHybrid capital note ICommon Stock I(ADR/GRD)
■ Financial solutions
50
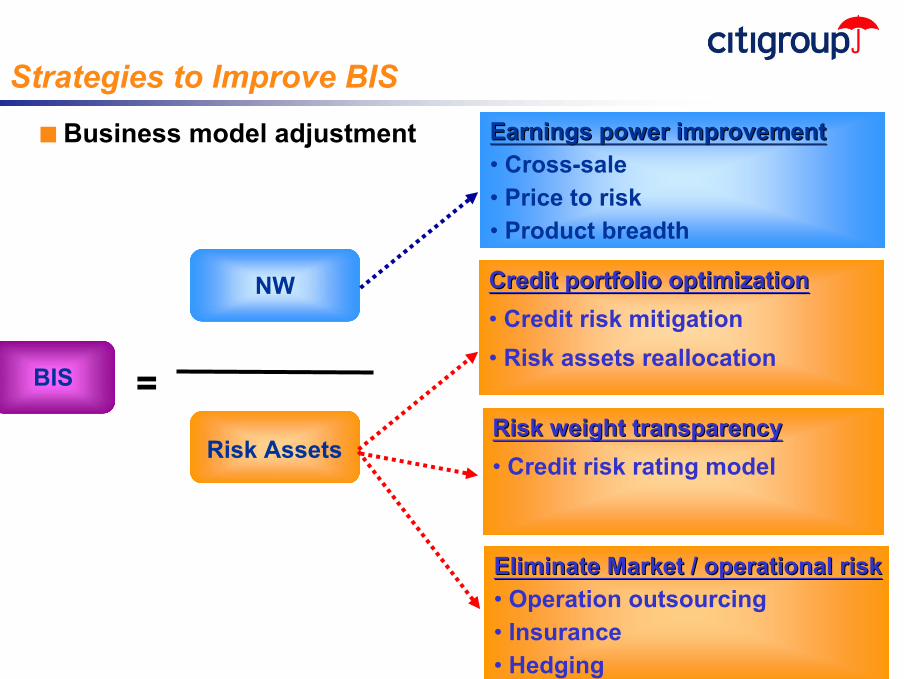
Strategies to Improve BIS■ Business model adjustment
NW
Risk Assets
BIS =
Earnings power improvementEarnings power improvement• Cross-sale• Price to risk• Product breadth
Credit portfolio optimizationCredit portfolio optimization• Credit risk mitigation• Risk assets reallocation
Risk weight transparencyRisk weight transparency• Credit risk rating model
Eliminate Market / operational riskEliminate Market / operational risk• Operation outsourcing• Insurance • Hedging

Q & A
Copyright © 2004. Citigroup,Inc. All rights reserved. CITIGROUP and the Umbrella Device are trademarks and service marks of Citicorp or its affiliates and are used and registered throughout the world.