manage with care: the frailty of self-connections in the
TRANSCRIPT
ORIGINAL PAPER Open Access
Manage with care: the frailty of self-connections in the European airportnetworkMattia Cattaneo, Paolo Malighetti, Stefano Paleari and Renato Redondi*
Abstract
This study evaluates the attractiveness of self-hubbing in terms of the (a) symmetry of itineraries and the consequencesfor passengers in the case of missed flights. We compute the most attractive European origin-destination (O-D) pairsthrough self-connection and evaluate their robustness by estimating the expected delays relative to connecting timesand the travel options available when a connection is missed.Results show that the potential of self-connecting markets is reduced when accounting for asymmetrical travel optionsand the consequences for travelers in the case of missed flights. In terms of frequencies, self-connecting passengers are,on average, found to have fewer alternatives to complete a given O-D pair than in the case of alliance-based connections(− 33%). Our findings moderate the confidence of past evidence on self-hubbing in light of the concrete reliability of self-connections for passengers. The itinerary choice made by passengers inevitably depends on the evaluation of travelquality attributes related to the (a) symmetry of the itineraries and the costs incurred through missed connections.
Keywords: Indirect connectivity, European network, Minimum travel time; Robustness analysis
1 IntroductionWith the development of the European air transportationmarket and the growth of low-cost carriers (LCCs), it hasbecome possible for passengers to travel to a destinationthat is not directly handled by the airlines themselvesthrough the self-connect option. This has become a con-crete, alternative rather fly within Europe [7, 10, 17, 25].In recent years, scholars have investigated the
phenomenon of self-connectivity for passengers flyingwithin the European air transportation network [10, 16,24, 25, 29, 30], highlighting how it represents a concretealternative for passengers. Malighetti et al. [25] show that,in 2006, up to two-thirds of the fastest indirect connec-tions inside Europe were not operated by the airline alli-ances’ system. Most recently, Cattaneo et al. [10] confirmthat 1-transfer quickest paths achievable through self-connecting flights in Europe have remained a valid alter-native in the European framework over the last decade, in-creasing from 66% in 2006 to 69% in 2016 of the fastest
indirect connections inside Europe. The growing popularityof self-connectivity has been highlighted by the implemen-tation of two systems for assisting self-connecting passen-gers between European airports, namely, ViaMilano atMalpensa airport in Milan and GatwickConnect at LondonGatwick airport. Airlines have shown interest in this regardby providing passenger transfers between flights (Vueling,Norwegian, easyJet and Ryanair). Also, the development ofIT platforms, such as Dohop and Kiwi, have facilitated pas-sengers in approaching inter-connections.Nevertheless, after a decade, some perplexities exist
about the growth and sustainability of self-connections.On the one hand, airlines (both LCCs and traditionalcarriers) have been shown to be unable to fully exploitthe opportunities generated by self-connections [31]. In-direct connections have reduced over time along withthe fact that an increasing number of pairs have beendirectly connected by airlines [31]. Furthermore, the in-creasing establishment of LCCs in primary rather thanin peripheral airports has inevitably hindered self-connections over time [13]. On the other hand, airportshave registered difficulties in sustainably implementingsystems that manage all services associated with self-
© The Author(s). 2019 Open Access This article is distributed under the terms of the Creative Commons Attribution 4.0International License (http://creativecommons.org/licenses/by/4.0/), which permits unrestricted use, distribution, andreproduction in any medium, provided you give appropriate credit to the original author(s) and the source, provide a link tothe Creative Commons license, and indicate if changes were made.
* Correspondence: [email protected] of Management, Information and Production Engineering -University of Bergamo, Bergamo, Italy
European TransportResearch Review
Cattaneo et al. European Transport Research Review (2019) 11:50 https://doi.org/10.1186/s12544-019-0387-z
connections, such as dedicated areas for baggage transferservice and the management of insurance packagesagainst the risk of missing flights [30]. Yet, the two casesgenerally mentioned by the literature, namely ViaMilanoand GatwickConnect, have remained isolated examplesin the European framework. Indeed, when an airportdecides to actively facilitate self-connections, it remainsopen the issue of making aware passengers of thesealternatives.1 The efficient promotion of these servicesrequires a stronger cooperation with metasearch enginesor airlines.Though the literature has extensively shown the potential
of self-connectivity inside the European air transportationmarket as an exciting opportunity in air transportation con-nectivity, its robustness in the eyes of passengers is yet tobe demonstrated in detail. In this paper, we aim to analyzethe extent to which the frailties of self-connections makethem a non-valid alternative for European passengers whostrategically evaluate whether to set up flight transfersthemselves. This would contribute to a better understand-ing of the development of self-connection occurred overthe last 10 years and under which conditions they wouldconcretely benefit passengers and operators inside the mar-ket (airlines and airports) in the upcoming years.For this purpose, the paper extensively investigates the
reliability of self-connections for passengers. We considerquality attributes of self-connections, their performance interms of travel times, and their robustness with respect tothe offer made by airlines. We relied on the quickest traveltime approach [25] in order to identify the fastest connec-tions that remained un-managed2 over time in the Euro-pean context. Specifically, we focus on 1-stop connectionsfrom EU airports in a typical off-peak week of the autumnschedule, from September 13th to 19th, 2016. We con-sider both the intra-European market and the market be-tween the EU and major intercontinental destinations.The remainder of the article is organized as follows. Sec-
tion 2 provides a review of the literature. Section 3 describesthe methodology. Section 4 presents the empirical analysisdetailing the robustness analysis on the self-connectingscheduled travels and conclusions are drawn in Section 5.
2 Literature reviewThe significant growth of the air transportation marketin the last two decades has made the efficient manage-ment of airline operations more complicated. The plan-ning of which legs to operate and the optimization offleet and crew assignment have become increasingly com-plex [3]. In terms of these dynamics that have necessitated
the development of new approaches to systematize themanagement of airlines’ and airports’ daily activities, asignificant effort has been made by scientific literature indeveloping more efficient and faster optimizationapproaches [4, 18]. The satisfaction and loyalty of currenttravelers and the attraction of new ones are acknowledgedas being critically influenced by on-time performances [1].Punctuality and reliability are found to be among the mostcrucial factors affecting passengers’ choices (e.g., [2, 15])Nevertheless, irregularities in airline schedules, namely thefact that every flight will not depart/arrive as planned,have become increasingly common and responsible forhasty connections and the increased risk of misconnectionfor passengers. These anomalies, which are generally dueto weather conditions, high levels of congestions at air-ports, and unscheduled maintenance, represent critical is-sues, especially for connecting passengers [6, 22] who riskmissing their connecting flight.With regards to connectivity irregularities, the litera-
ture has largely investigated airlines’ disruption manage-ment processes (see [21]), first focusing on the analysisof their causes, such as delay propagation (e.g., [12, 20,28]), and proposing integrated recovery plans tominimize inconveniences to passengers ([3, 6, 23];). Dif-ferent solutions have been suggested, from preventivelyadding more time in airlines’ schedules, that is, “sched-ule padding” [14], to increasing aircraft speed control [3,11] and retiming departure times within a narrow time-window [22]. However, the significant effort made bythe literature in examining how to limit inconveniencesto passengers and set up reliable schedules has left howmuch schedule disruptions may count for passengerstravelling via self-connections unexplored. Compared tothe connections operated by the alliances system, self-connections are indeed exposed to a higher level of un-certainty due to the potential variation of the scheduleon each leg without any assistance [16].Both the nature and the development of the
phenomenon (more than 2/3 of the fastest connectionsare today made through self-connectivity in the Euro-pean network, as shown by [10]) entail a better under-standing of whether these connections are reliablealternatives for passengers and which potential interven-tions should be implemented due to their sustainability.
3 MethodologyWith the aim of investigating the robustness of self-connections, our study aims to examine the following indepth: 1) their performance in terms of frequency andpresence of reliable return flights; 2) to what extent thepresence of delays on connecting legs could impact theperformance of self-connection compared to other alter-natives; 3) the impact of missing connecting legs in lightof reaching the destination in reasonable time.
1Indeed, passengers do not generally depart/land in these airports,almost neglecting their existence.2The airline does directly manage the risk associated to the inter-connection.
Cattaneo et al. European Transport Research Review (2019) 11:50 Page 2 of 13
The first step of our analysis is to identify all viable con-nections, including both alliance-coordinated and self-connections. The volume of transit passengers may be con-sidered as an alternative to identify connections alreadyundertaken by passengers. However, the transit passengervolume for a specific origin-destination (O-D) pair isunknown for self-connecting passengers. The MarketingInformation Data Tapes (MIDT) data, which provides in-formation on passengers’ bookings made by Global Distri-bution Systems (GDS), does not cover some of the majorLCCs in Europe. However, even if it did, self-connectingpassengers usually have to book the tickets for the differentlegs of their trip separately. In any case, it would not bepossible to measure their volume using specific O-D pairs.Instead, we considered a supply-based measure of hubbingactivities taken from the literature on the connectivity of airtransport networks (see [9] for a review of the differentmeasures in this field). We only focus on 1-stop connec-tions and distinguish three categories of connections basedon the kind of carriers involved:
– Alliance-based connection: The connection isbetween flights operated by carriers belonging to thesame alliance;
– On-line connection: The connection is betweenflights operated by the same carrier, which isunallied but still a traditional carrier. An example ofon-line connections is those involving the independ-ent Gulf airlines such as Emirates and Etihad;
– Self-connection: The connection is not classified inthe two previous groups. It involves a transferbetween independently ticked flights operated byunrelated carriers, belonging to either differentalliances, independent, or low-cost carriers.
Based on schedule information, we computed the num-ber of “viable” connections between incoming and outgoingflights in a given airport. We included the following threeconditions for a connection to be considered “viable”:
– The time between the incoming and outgoing flightsmust be higher than a minimum connecting time(MCT). Table 1 reports the different assumedMCTs for the different connections and differentgeographical regions.
– The routing factor of the one-stop itinerary startingfrom the origin of the incoming flight, passingthrough the considered airport, and arriving at thedestination of the outgoing flight must be 1.4 or lessfor intra-European connections, and 1.2 or less forintercontinental connections [8]. The detour neces-sary to complete the trip must be at most 40% of thedirect distance between the origin and destination inthe case of EU connections, and 20% in the case ofintercontinental connections. This condition aims toexclude some low-quality O-D connections that arenot attractive for passengers due to long detours, suchas going from Rome to Barcelona via London.
– The quickest travel time is implemented followingthe minimum travel time approach ([26]; for adetailed explanation see [25], pp. 56), including bothflight times and waiting times spent in theintermediate airport. It is computed for all O-D pairsthat met the abovementioned two conditions. As inRedondi et al. [27], the last condition for a connec-tion to be considered requires that its travel timedoes not exceed that of the quickest alternative bymore than 40% in the case of EU connections and20% in the case of intercontinental connections. Thislast condition discriminates the quality of connec-tions by considering only those with the highestprobability of being considered by passengers. Itgenerally excludes connections with long waitingtimes spent in intermediate airports.
The analysis considers all scheduled flights operating in atypical off-peak period of the autumn schedule, from Sep-tember 13th to 19th 2016, and computes all viable connec-tions in that period. An off-peak week is chosen to identifyconnections that are persistent over time. Data on sched-uled flights and airlines operating on each route were ob-tained from the Official Airline Guide (OAG) dataset.After selecting all viable connections for passengers in the
considered period, we measure some attributes, such as:
i) their time-performance with respect to the quickestalternatives;
ii) the weekly frequencies of connections;iii) the feasibility of performing a return trip on the
same day;iv) the consequences for passengers of missing the first-
leg flight (first flight of an itinerary composed involv-ing one stop at the hub airport) of their trip in termsof increased waiting times and likelihood of not com-pleting the trip on the same day and during 48 h;
v) the consequences for passengers of missing thesecond-leg flight (second flight of an itinerary in-volving one stop at the hub airport) of their trip,in terms of increased waiting times and
Table 1 Minimum connecting times for type of connectionsand for geographical areas
Minimum connectingtimes (minutes)
Intra-EUconnections
Intercontinentalconnections
Alliance-based andon-line connections
45 60
Self-connections 90 120
Cattaneo et al. European Transport Research Review (2019) 11:50 Page 3 of 13
likelihood of not completing the trip on the sameday and during 48 h;
4 Empirical analysis4.1 Connection performancesTable 2 reports the number of quickest connections bycarrier type. Considering the percentage of viable 2-stepconnections with respect to all 2-step connections for geo-graphical regions, 67.1% of all 2-step connections withinEurope satisfy the conditions reported in the methodologysection. Therefore, the remaining 32.9% are not consid-ered in this analysis as they do not meet the quality criter-ion regarding the maximum routing factor (1.4) toconnect O-D pairs. In the case of intercontinental connec-tions, almost 50% of connections are excluded from theanalysis. At a European level, 63.4% of 2-step connectionsare available through self-connection strategies, while thethree alliances offer a combined total of just 34% of 2-stepconnections. The relevance of self-connections decreasesto 37.4% in the case of intercontinental destinations. StarAlliance is the leader on the intercontinental markets,with 23.2%, followed by Skyteam and OneWorld.Table 3 shows the performance, in terms of travel times,
of the viable connections with respect to the quickest alter-natives. Considering the intra-EU market, self-connectionsincrease travel times above the quickest alternatives by anaverage of 15.8%. This is mainly due to longer connectingtimes as self-connections are not planned by airlines andare often the result of the casual mixing of different, sched-uled offers. Routing factors, defined as the sum of flight dis-tances of the first and second leg flights divided by thedirect distance between the origin and the destination air-ports, are very similar between alliance-based and self-connections. Overall, the difference between the travel timeperformance of self-connections and connections offeredwithin alliances is not as large as one would expect. One-World and Sky Team, the two best performing providers of2-step connections in Europe, show an average increase in
travel times above the quickest alternatives of 12.8–12.9%.Only online connections provided by unallied traditionalcarriers show significantly better performances, but th eyonly marginally cover the intra-EU market.When looking at the intercontinental market, the
most efficient 2-step connections are again those of-fered by unallied independent carriers, followed by SkyTeam and Star Alliance, with average increases abovethe quickest connections of around 6–7%. With respectto these, self-connections take around 3% more traveltime to be completed, with increases of 9.2% above thequickest options.
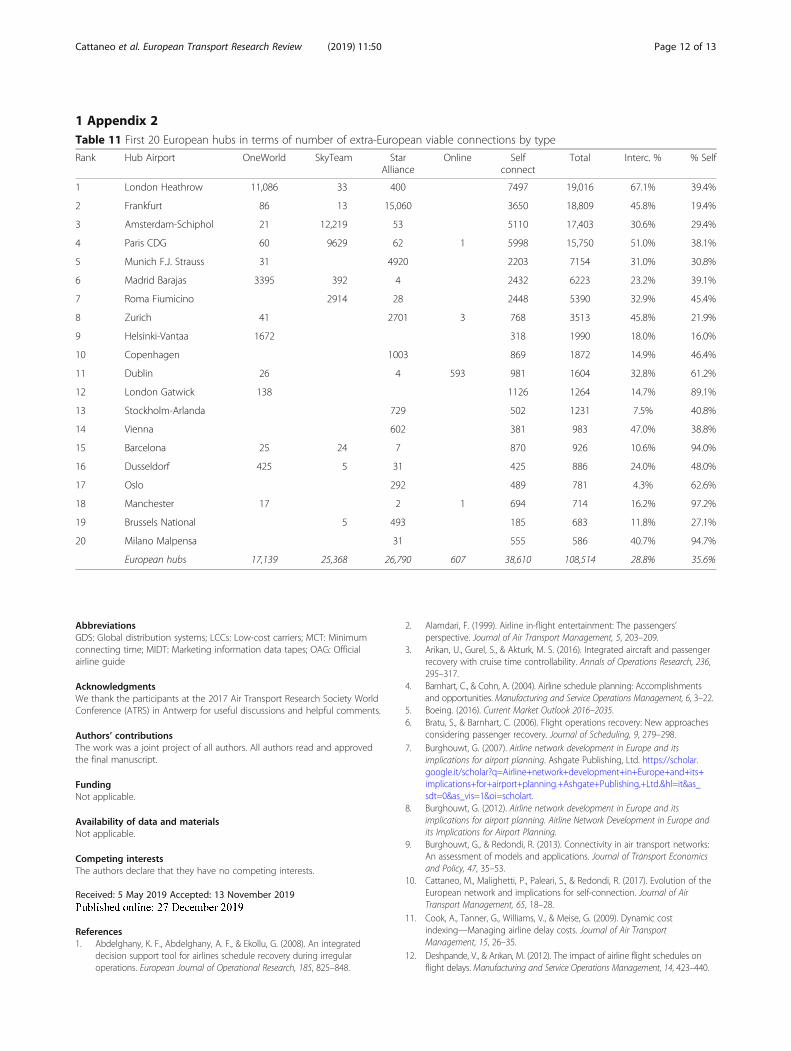
4.2 Frequencies and return trip availabilityTable 4 compares the frequencies of connections offeredby the alliances, online connections, and self-connections. At a European level, viable self-connectionslink 18,515 different O-D pairs. On average, each ofthese connections is offered 7.7 times during the weekconsidered in this analysis, which is more than once perday. The average connection frequency is 9.1 per week,while connections offered by SkyTeam reach 14.8 perweek, more than twice a day. Self-connections are alsooffered with significantly lower frequencies for intercon-tinental destinations under alliance-based connections.Appendix 1 additionally reports numbers of viable con-nections of European O-D pairs at an airport level.Interestingly, the airports with the highest share of self-connections are Oslo, Rome Fiumicino, Stockholm,Copenhagen, Barcelona, and London Gatwick. At anintercontinental level, the airports at the top of the rank-ing for self-connection opportunities are Rome Fiumi-cino, Copenhagen, and Dublin (see Appendix 2).It is interesting to estimate if a viable connection for a
given O-D pair can also be reverted, allowing passengersto make return trips. Table 5 compares the different kindsof connections over four different return trip scenarios.
Table 2 Number of quickest 2-step connections by type of connections and for geographical areas
Quickest 2-step connections by type Intra-EU Extra-EU
No. % No. %
No. of 2-step indirect connections 32,673 10,308
% of 2-step viable connections 67.1% 49.9%
Total no. of viable 2-step connections 21,914 100% 5142 100%
Alliances
OneWorld 2411 11.0% 900 17.5%
Sky Team 1994 9.1% 1136 22.1%
Star Alliance 3046 13.9% 1193 23.2%
Online 789 3.6% 77 1.5%
Self-connection 13,893 63.4% 1923 37.4%
Cattaneo et al. European Transport Research Review (2019) 11:50 Page 4 of 13
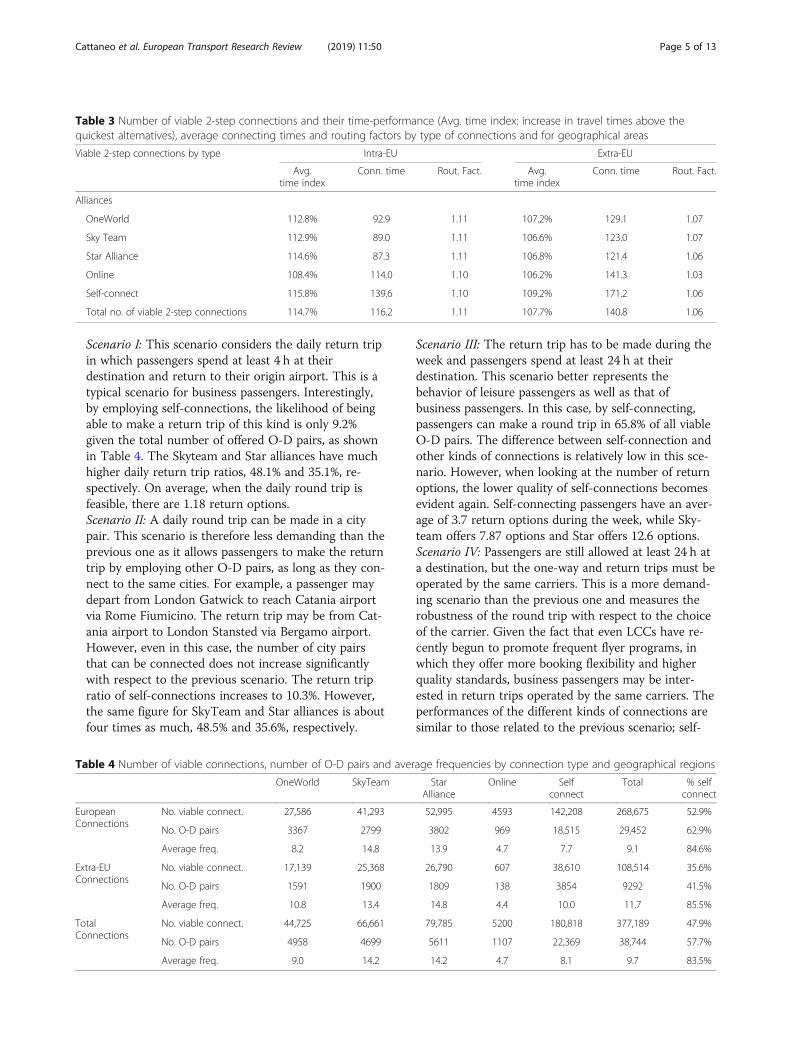
Scenario I: This scenario considers the daily return tripin which passengers spend at least 4 h at theirdestination and return to their origin airport. This is atypical scenario for business passengers. Interestingly,by employing self-connections, the likelihood of beingable to make a return trip of this kind is only 9.2%given the total number of offered O-D pairs, as shownin Table 4. The Skyteam and Star alliances have muchhigher daily return trip ratios, 48.1% and 35.1%, re-spectively. On average, when the daily round trip isfeasible, there are 1.18 return options.Scenario II: A daily round trip can be made in a citypair. This scenario is therefore less demanding than theprevious one as it allows passengers to make the returntrip by employing other O-D pairs, as long as they con-nect to the same cities. For example, a passenger maydepart from London Gatwick to reach Catania airportvia Rome Fiumicino. The return trip may be from Cat-ania airport to London Stansted via Bergamo airport.However, even in this case, the number of city pairsthat can be connected does not increase significantlywith respect to the previous scenario. The return tripratio of self-connections increases to 10.3%. However,the same figure for SkyTeam and Star alliances is aboutfour times as much, 48.5% and 35.6%, respectively.
Scenario III: The return trip has to be made during theweek and passengers spend at least 24 h at theirdestination. This scenario better represents thebehavior of leisure passengers as well as that ofbusiness passengers. In this case, by self-connecting,passengers can make a round trip in 65.8% of all viableO-D pairs. The difference between self-connection andother kinds of connections is relatively low in this sce-nario. However, when looking at the number of returnoptions, the lower quality of self-connections becomesevident again. Self-connecting passengers have an aver-age of 3.7 return options during the week, while Sky-team offers 7.87 options and Star offers 12.6 options.Scenario IV: Passengers are still allowed at least 24 h ata destination, but the one-way and return trips must beoperated by the same carriers. This is a more demand-ing scenario than the previous one and measures therobustness of the round trip with respect to the choiceof the carrier. Given the fact that even LCCs have re-cently begun to promote frequent flyer programs, inwhich they offer more booking flexibility and higherquality standards, business passengers may be inter-ested in return trips operated by the same carriers. Theperformances of the different kinds of connections aresimilar to those related to the previous scenario; self-
Table 3 Number of viable 2-step connections and their time-performance (Avg. time index: increase in travel times above thequickest alternatives), average connecting times and routing factors by type of connections and for geographical areas
Viable 2-step connections by type Intra-EU Extra-EU
Avg.time index
Conn. time Rout. Fact. Avg.time index
Conn. time Rout. Fact.
Alliances
OneWorld 112.8% 92.9 1.11 107.2% 129.1 1.07
Sky Team 112.9% 89.0 1.11 106.6% 123.0 1.07
Star Alliance 114.6% 87.3 1.11 106.8% 121.4 1.06
Online 108.4% 114.0 1.10 106.2% 141.3 1.03
Self-connect 115.8% 139.6 1.10 109.2% 171.2 1.06
Total no. of viable 2-step connections 114.7% 116.2 1.11 107.7% 140.8 1.06
Table 4 Number of viable connections, number of O-D pairs and average frequencies by connection type and geographical regions
OneWorld SkyTeam StarAlliance
Online Selfconnect
Total % selfconnect
EuropeanConnections
No. viable connect. 27,586 41,293 52,995 4593 142,208 268,675 52.9%
No. O-D pairs 3367 2799 3802 969 18,515 29,452 62.9%
Average freq. 8.2 14.8 13.9 4.7 7.7 9.1 84.6%
Extra-EUConnections
No. viable connect. 17,139 25,368 26,790 607 38,610 108,514 35.6%
No. O-D pairs 1591 1900 1809 138 3854 9292 41.5%
Average freq. 10.8 13.4 14.8 4.4 10.0 11.7 85.5%
TotalConnections
No. viable connect. 44,725 66,661 79,785 5200 180,818 377,189 47.9%
No. O-D pairs 4958 4699 5611 1107 22,369 38,744 57.7%
Average freq. 9.0 14.2 14.2 4.7 8.1 9.7 83.5%
Cattaneo et al. European Transport Research Review (2019) 11:50 Page 5 of 13
connection passengers have only 3.82 return optionsavailable. The exception to this is the Star alliance,whose return travel options are 8.65 on average, almostdouble that of the other groups.
4.2.1 The impact of delayed flights and missed connections/flightsAfter having studied some quality attributes of the offer ofself-connections, we aim to assess the impact of adverseevents such as delayed flights, missed connections, andmissed flights either in the first or second leg of the trip.3
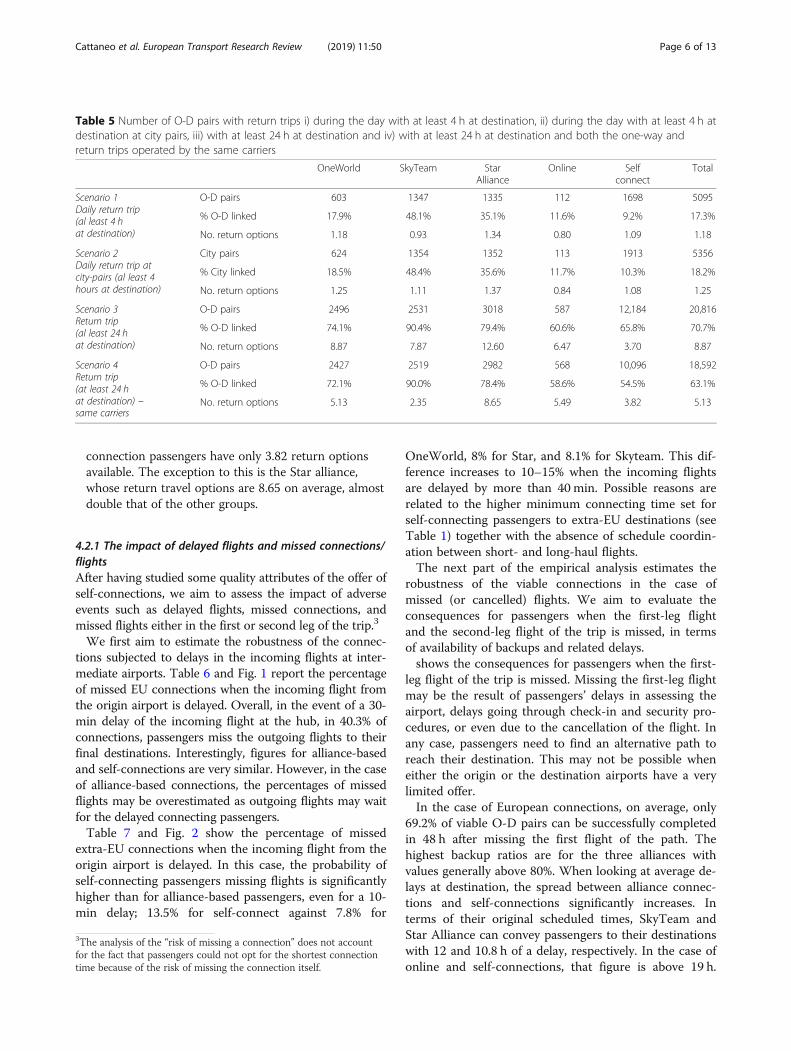
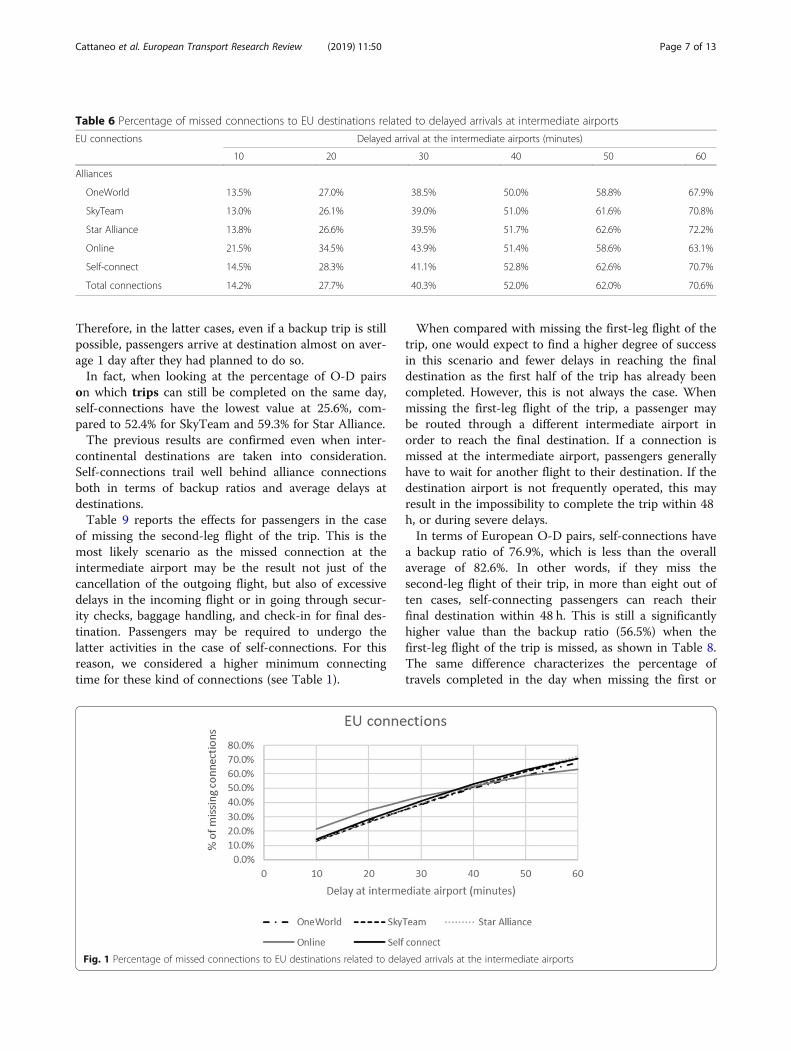
We first aim to estimate the robustness of the connec-tions subjected to delays in the incoming flights at inter-mediate airports. Table 6 and Fig. 1 report the percentageof missed EU connections when the incoming flight fromthe origin airport is delayed. Overall, in the event of a 30-min delay of the incoming flight at the hub, in 40.3% ofconnections, passengers miss the outgoing flights to theirfinal destinations. Interestingly, figures for alliance-basedand self-connections are very similar. However, in the caseof alliance-based connections, the percentages of missedflights may be overestimated as outgoing flights may waitfor the delayed connecting passengers.Table 7 and Fig. 2 show the percentage of missed
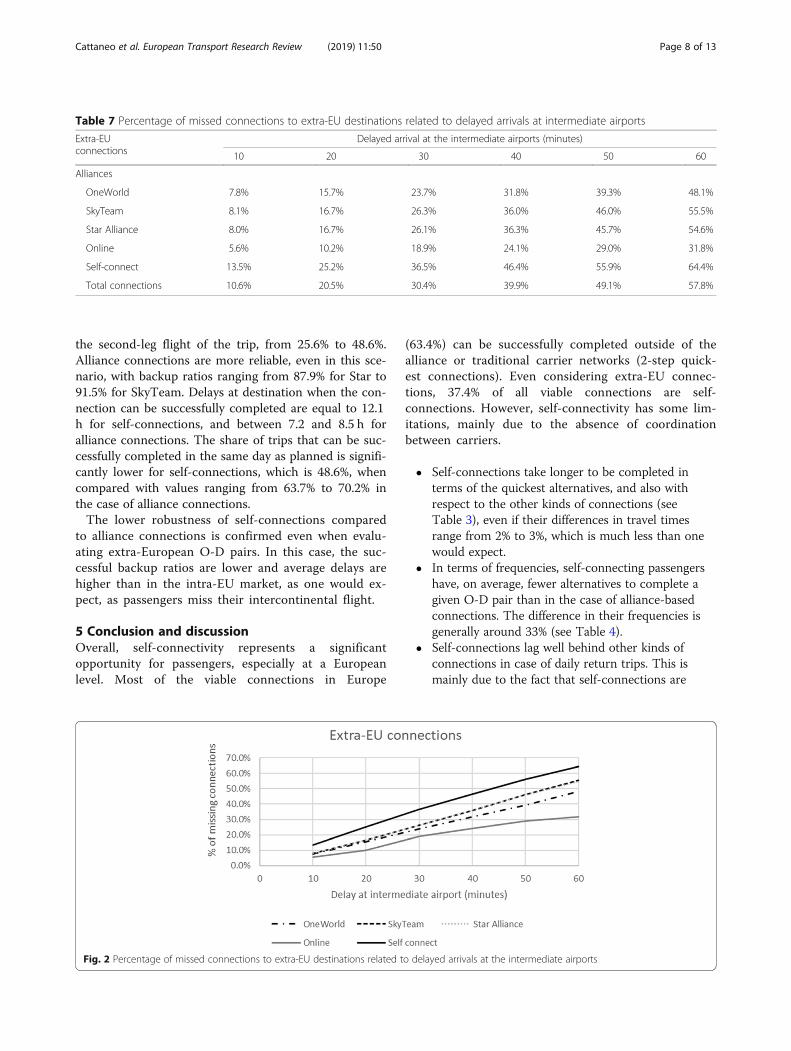
extra-EU connections when the incoming flight from theorigin airport is delayed. In this case, the probability ofself-connecting passengers missing flights is significantlyhigher than for alliance-based passengers, even for a 10-min delay; 13.5% for self-connect against 7.8% for
OneWorld, 8% for Star, and 8.1% for Skyteam. This dif-ference increases to 10–15% when the incoming flightsare delayed by more than 40 min. Possible reasons arerelated to the higher minimum connecting time set forself-connecting passengers to extra-EU destinations (seeTable 1) together with the absence of schedule coordin-ation between short- and long-haul flights.The next part of the empirical analysis estimates the
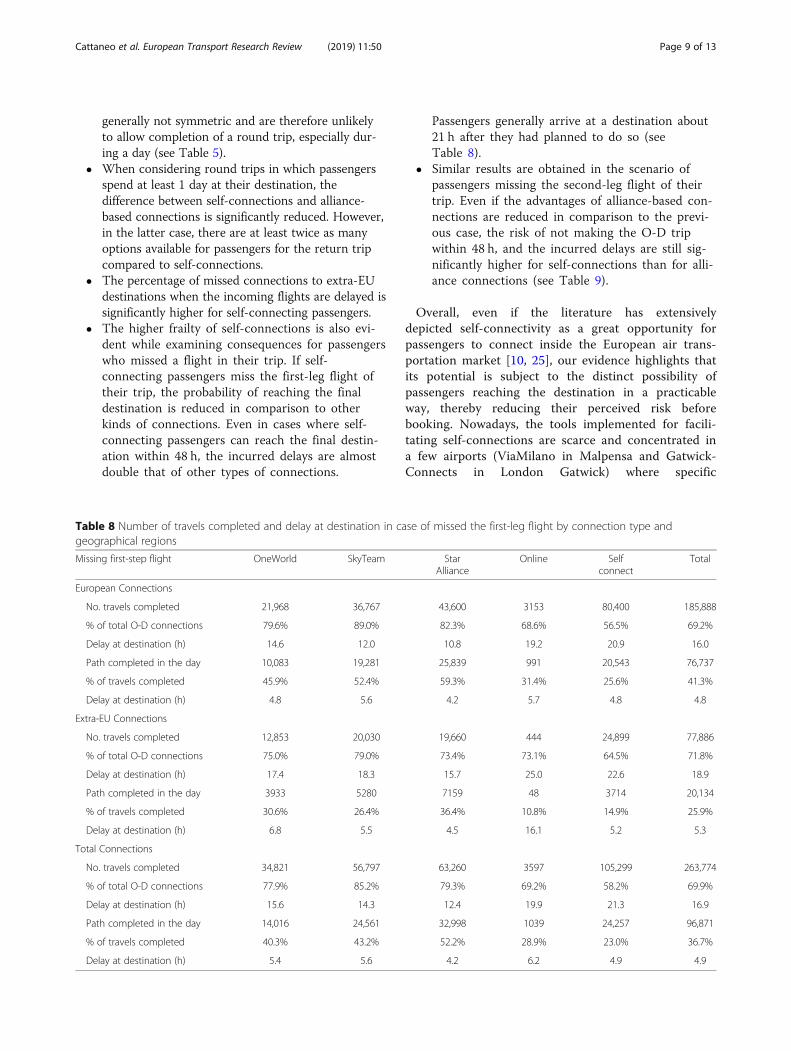
robustness of the viable connections in the case ofmissed (or cancelled) flights. We aim to evaluate theconsequences for passengers when the first-leg flightand the second-leg flight of the trip is missed, in termsof availability of backups and related delays.shows the consequences for passengers when the first-
leg flight of the trip is missed. Missing the first-leg flightmay be the result of passengers’ delays in assessing theairport, delays going through check-in and security pro-cedures, or even due to the cancellation of the flight. Inany case, passengers need to find an alternative path toreach their destination. This may not be possible wheneither the origin or the destination airports have a verylimited offer.In the case of European connections, on average, only
69.2% of viable O-D pairs can be successfully completedin 48 h after missing the first flight of the path. Thehighest backup ratios are for the three alliances withvalues generally above 80%. When looking at average de-lays at destination, the spread between alliance connec-tions and self-connections significantly increases. Interms of their original scheduled times, SkyTeam andStar Alliance can convey passengers to their destinationswith 12 and 10.8 h of a delay, respectively. In the case ofonline and self-connections, that figure is above 19 h.
Table 5 Number of O-D pairs with return trips i) during the day with at least 4 h at destination, ii) during the day with at least 4 h atdestination at city pairs, iii) with at least 24 h at destination and iv) with at least 24 h at destination and both the one-way andreturn trips operated by the same carriers
OneWorld SkyTeam StarAlliance
Online Selfconnect
Total
Scenario 1Daily return trip(al least 4 hat destination)
O-D pairs 603 1347 1335 112 1698 5095
% O-D linked 17.9% 48.1% 35.1% 11.6% 9.2% 17.3%
No. return options 1.18 0.93 1.34 0.80 1.09 1.18
Scenario 2Daily return trip atcity-pairs (al least 4hours at destination)
City pairs 624 1354 1352 113 1913 5356
% City linked 18.5% 48.4% 35.6% 11.7% 10.3% 18.2%
No. return options 1.25 1.11 1.37 0.84 1.08 1.25
Scenario 3Return trip(al least 24 hat destination)
O-D pairs 2496 2531 3018 587 12,184 20,816
% O-D linked 74.1% 90.4% 79.4% 60.6% 65.8% 70.7%
No. return options 8.87 7.87 12.60 6.47 3.70 8.87
Scenario 4Return trip(at least 24 hat destination) –same carriers
O-D pairs 2427 2519 2982 568 10,096 18,592
% O-D linked 72.1% 90.0% 78.4% 58.6% 54.5% 63.1%
No. return options 5.13 2.35 8.65 5.49 3.82 5.13
3The analysis of the “risk of missing a connection” does not accountfor the fact that passengers could not opt for the shortest connectiontime because of the risk of missing the connection itself.
Cattaneo et al. European Transport Research Review (2019) 11:50 Page 6 of 13
Therefore, in the latter cases, even if a backup trip is stillpossible, passengers arrive at destination almost on aver-age 1 day after they had planned to do so.In fact, when looking at the percentage of O-D pairs
on which trips can still be completed on the same day,self-connections have the lowest value at 25.6%, com-pared to 52.4% for SkyTeam and 59.3% for Star Alliance.The previous results are confirmed even when inter-
continental destinations are taken into consideration.Self-connections trail well behind alliance connectionsboth in terms of backup ratios and average delays atdestinations.Table 9 reports the effects for passengers in the case
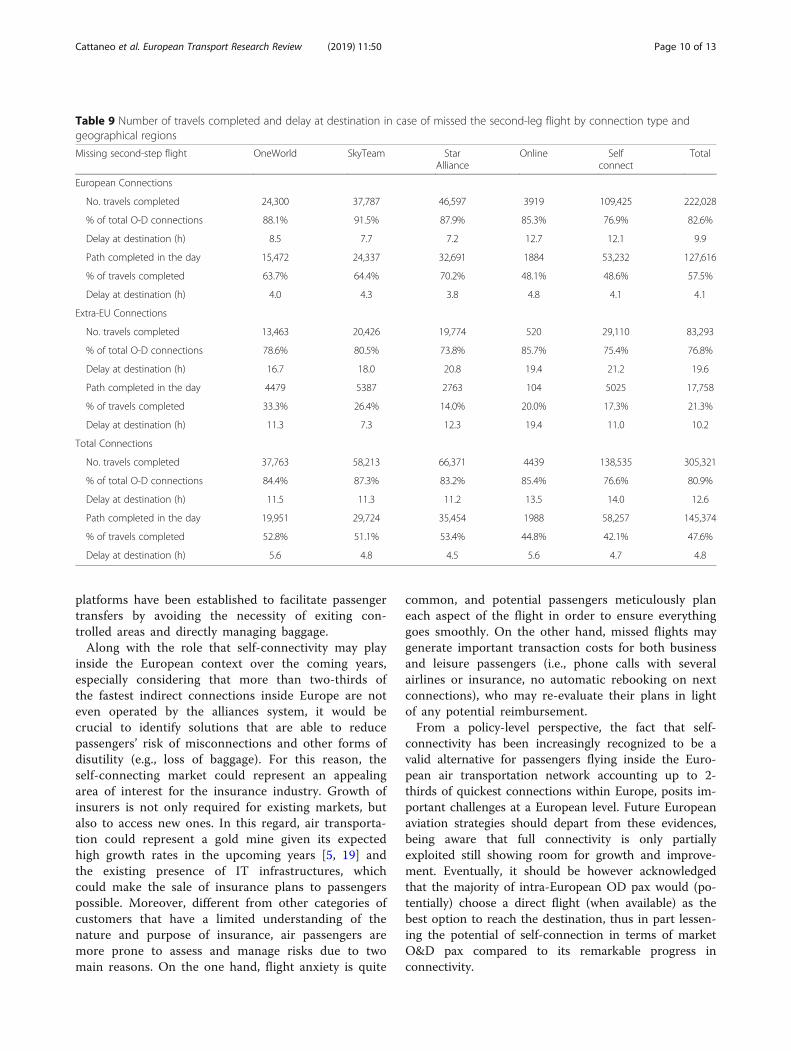
of missing the second-leg flight of the trip. This is themost likely scenario as the missed connection at theintermediate airport may be the result not just of thecancellation of the outgoing flight, but also of excessivedelays in the incoming flight or in going through secur-ity checks, baggage handling, and check-in for final des-tination. Passengers may be required to undergo thelatter activities in the case of self-connections. For thisreason, we considered a higher minimum connectingtime for these kind of connections (see Table 1).
When compared with missing the first-leg flight of thetrip, one would expect to find a higher degree of successin this scenario and fewer delays in reaching the finaldestination as the first half of the trip has already beencompleted. However, this is not always the case. Whenmissing the first-leg flight of the trip, a passenger maybe routed through a different intermediate airport inorder to reach the final destination. If a connection ismissed at the intermediate airport, passengers generallyhave to wait for another flight to their destination. If thedestination airport is not frequently operated, this mayresult in the impossibility to complete the trip within 48h, or during severe delays.In terms of European O-D pairs, self-connections have
a backup ratio of 76.9%, which is less than the overallaverage of 82.6%. In other words, if they miss thesecond-leg flight of their trip, in more than eight out often cases, self-connecting passengers can reach theirfinal destination within 48 h. This is still a significantlyhigher value than the backup ratio (56.5%) when thefirst-leg flight of the trip is missed, as shown in Table 8.The same difference characterizes the percentage oftravels completed in the day when missing the first or
Fig. 1 Percentage of missed connections to EU destinations related to delayed arrivals at the intermediate airports
Table 6 Percentage of missed connections to EU destinations related to delayed arrivals at intermediate airports
EU connections Delayed arrival at the intermediate airports (minutes)
10 20 30 40 50 60
Alliances
OneWorld 13.5% 27.0% 38.5% 50.0% 58.8% 67.9%
SkyTeam 13.0% 26.1% 39.0% 51.0% 61.6% 70.8%
Star Alliance 13.8% 26.6% 39.5% 51.7% 62.6% 72.2%
Online 21.5% 34.5% 43.9% 51.4% 58.6% 63.1%
Self-connect 14.5% 28.3% 41.1% 52.8% 62.6% 70.7%
Total connections 14.2% 27.7% 40.3% 52.0% 62.0% 70.6%
Cattaneo et al. European Transport Research Review (2019) 11:50 Page 7 of 13
the second-leg flight of the trip, from 25.6% to 48.6%.Alliance connections are more reliable, even in this sce-nario, with backup ratios ranging from 87.9% for Star to91.5% for SkyTeam. Delays at destination when the con-nection can be successfully completed are equal to 12.1h for self-connections, and between 7.2 and 8.5 h foralliance connections. The share of trips that can be suc-cessfully completed in the same day as planned is signifi-cantly lower for self-connections, which is 48.6%, whencompared with values ranging from 63.7% to 70.2% inthe case of alliance connections.The lower robustness of self-connections compared
to alliance connections is confirmed even when evalu-ating extra-European O-D pairs. In this case, the suc-cessful backup ratios are lower and average delays arehigher than in the intra-EU market, as one would ex-pect, as passengers miss their intercontinental flight.
5 Conclusion and discussionOverall, self-connectivity represents a significantopportunity for passengers, especially at a Europeanlevel. Most of the viable connections in Europe
(63.4%) can be successfully completed outside of thealliance or traditional carrier networks (2-step quick-est connections). Even considering extra-EU connec-tions, 37.4% of all viable connections are self-connections. However, self-connectivity has some lim-itations, mainly due to the absence of coordinationbetween carriers.
� Self-connections take longer to be completed interms of the quickest alternatives, and also withrespect to the other kinds of connections (seeTable 3), even if their differences in travel timesrange from 2% to 3%, which is much less than onewould expect.
� In terms of frequencies, self-connecting passengershave, on average, fewer alternatives to complete agiven O-D pair than in the case of alliance-basedconnections. The difference in their frequencies isgenerally around 33% (see Table 4).
� Self-connections lag well behind other kinds ofconnections in case of daily return trips. This ismainly due to the fact that self-connections are
Fig. 2 Percentage of missed connections to extra-EU destinations related to delayed arrivals at the intermediate airports
Table 7 Percentage of missed connections to extra-EU destinations related to delayed arrivals at intermediate airports
Extra-EUconnections
Delayed arrival at the intermediate airports (minutes)
10 20 30 40 50 60
Alliances
OneWorld 7.8% 15.7% 23.7% 31.8% 39.3% 48.1%
SkyTeam 8.1% 16.7% 26.3% 36.0% 46.0% 55.5%
Star Alliance 8.0% 16.7% 26.1% 36.3% 45.7% 54.6%
Online 5.6% 10.2% 18.9% 24.1% 29.0% 31.8%
Self-connect 13.5% 25.2% 36.5% 46.4% 55.9% 64.4%
Total connections 10.6% 20.5% 30.4% 39.9% 49.1% 57.8%
Cattaneo et al. European Transport Research Review (2019) 11:50 Page 8 of 13
generally not symmetric and are therefore unlikelyto allow completion of a round trip, especially dur-ing a day (see Table 5).
� When considering round trips in which passengersspend at least 1 day at their destination, thedifference between self-connections and alliance-based connections is significantly reduced. However,in the latter case, there are at least twice as manyoptions available for passengers for the return tripcompared to self-connections.
� The percentage of missed connections to extra-EUdestinations when the incoming flights are delayed issignificantly higher for self-connecting passengers.
� The higher frailty of self-connections is also evi-dent while examining consequences for passengerswho missed a flight in their trip. If self-connecting passengers miss the first-leg flight oftheir trip, the probability of reaching the finaldestination is reduced in comparison to otherkinds of connections. Even in cases where self-connecting passengers can reach the final destin-ation within 48 h, the incurred delays are almostdouble that of other types of connections.
Passengers generally arrive at a destination about21 h after they had planned to do so (seeTable 8).
� Similar results are obtained in the scenario ofpassengers missing the second-leg flight of theirtrip. Even if the advantages of alliance-based con-nections are reduced in comparison to the previ-ous case, the risk of not making the O-D tripwithin 48 h, and the incurred delays are still sig-nificantly higher for self-connections than for alli-ance connections (see Table 9).
Overall, even if the literature has extensivelydepicted self-connectivity as a great opportunity forpassengers to connect inside the European air trans-portation market [10, 25], our evidence highlights thatits potential is subject to the distinct possibility ofpassengers reaching the destination in a practicableway, thereby reducing their perceived risk beforebooking. Nowadays, the tools implemented for facili-tating self-connections are scarce and concentrated ina few airports (ViaMilano in Malpensa and Gatwick-Connects in London Gatwick) where specific
Table 8 Number of travels completed and delay at destination in case of missed the first-leg flight by connection type andgeographical regions
Missing first-step flight OneWorld SkyTeam StarAlliance
Online Selfconnect
Total
European Connections
No. travels completed 21,968 36,767 43,600 3153 80,400 185,888
% of total O-D connections 79.6% 89.0% 82.3% 68.6% 56.5% 69.2%
Delay at destination (h) 14.6 12.0 10.8 19.2 20.9 16.0
Path completed in the day 10,083 19,281 25,839 991 20,543 76,737
% of travels completed 45.9% 52.4% 59.3% 31.4% 25.6% 41.3%
Delay at destination (h) 4.8 5.6 4.2 5.7 4.8 4.8
Extra-EU Connections
No. travels completed 12,853 20,030 19,660 444 24,899 77,886
% of total O-D connections 75.0% 79.0% 73.4% 73.1% 64.5% 71.8%
Delay at destination (h) 17.4 18.3 15.7 25.0 22.6 18.9
Path completed in the day 3933 5280 7159 48 3714 20,134
% of travels completed 30.6% 26.4% 36.4% 10.8% 14.9% 25.9%
Delay at destination (h) 6.8 5.5 4.5 16.1 5.2 5.3
Total Connections
No. travels completed 34,821 56,797 63,260 3597 105,299 263,774
% of total O-D connections 77.9% 85.2% 79.3% 69.2% 58.2% 69.9%
Delay at destination (h) 15.6 14.3 12.4 19.9 21.3 16.9
Path completed in the day 14,016 24,561 32,998 1039 24,257 96,871
% of travels completed 40.3% 43.2% 52.2% 28.9% 23.0% 36.7%
Delay at destination (h) 5.4 5.6 4.2 6.2 4.9 4.9
Cattaneo et al. European Transport Research Review (2019) 11:50 Page 9 of 13
platforms have been established to facilitate passengertransfers by avoiding the necessity of exiting con-trolled areas and directly managing baggage.Along with the role that self-connectivity may play
inside the European context over the coming years,especially considering that more than two-thirds ofthe fastest indirect connections inside Europe are noteven operated by the alliances system, it would becrucial to identify solutions that are able to reducepassengers’ risk of misconnections and other forms ofdisutility (e.g., loss of baggage). For this reason, theself-connecting market could represent an appealingarea of interest for the insurance industry. Growth ofinsurers is not only required for existing markets, butalso to access new ones. In this regard, air transporta-tion could represent a gold mine given its expectedhigh growth rates in the upcoming years [5, 19] andthe existing presence of IT infrastructures, whichcould make the sale of insurance plans to passengerspossible. Moreover, different from other categories ofcustomers that have a limited understanding of thenature and purpose of insurance, air passengers aremore prone to assess and manage risks due to twomain reasons. On the one hand, flight anxiety is quite
common, and potential passengers meticulously planeach aspect of the flight in order to ensure everythinggoes smoothly. On the other hand, missed flights maygenerate important transaction costs for both businessand leisure passengers (i.e., phone calls with severalairlines or insurance, no automatic rebooking on nextconnections), who may re-evaluate their plans in lightof any potential reimbursement.From a policy-level perspective, the fact that self-
connectivity has been increasingly recognized to be avalid alternative for passengers flying inside the Euro-pean air transportation network accounting up to 2-thirds of quickest connections within Europe, posits im-portant challenges at a European level. Future Europeanaviation strategies should depart from these evidences,being aware that full connectivity is only partiallyexploited still showing room for growth and improve-ment. Eventually, it should be however acknowledgedthat the majority of intra-European OD pax would (po-tentially) choose a direct flight (when available) as thebest option to reach the destination, thus in part lessen-ing the potential of self-connection in terms of marketO&D pax compared to its remarkable progress inconnectivity.
Table 9 Number of travels completed and delay at destination in case of missed the second-leg flight by connection type andgeographical regions
Missing second-step flight OneWorld SkyTeam StarAlliance
Online Selfconnect
Total
European Connections
No. travels completed 24,300 37,787 46,597 3919 109,425 222,028
% of total O-D connections 88.1% 91.5% 87.9% 85.3% 76.9% 82.6%
Delay at destination (h) 8.5 7.7 7.2 12.7 12.1 9.9
Path completed in the day 15,472 24,337 32,691 1884 53,232 127,616
% of travels completed 63.7% 64.4% 70.2% 48.1% 48.6% 57.5%
Delay at destination (h) 4.0 4.3 3.8 4.8 4.1 4.1
Extra-EU Connections
No. travels completed 13,463 20,426 19,774 520 29,110 83,293
% of total O-D connections 78.6% 80.5% 73.8% 85.7% 75.4% 76.8%
Delay at destination (h) 16.7 18.0 20.8 19.4 21.2 19.6
Path completed in the day 4479 5387 2763 104 5025 17,758
% of travels completed 33.3% 26.4% 14.0% 20.0% 17.3% 21.3%
Delay at destination (h) 11.3 7.3 12.3 19.4 11.0 10.2
Total Connections
No. travels completed 37,763 58,213 66,371 4439 138,535 305,321
% of total O-D connections 84.4% 87.3% 83.2% 85.4% 76.6% 80.9%
Delay at destination (h) 11.5 11.3 11.2 13.5 14.0 12.6
Path completed in the day 19,951 29,724 35,454 1988 58,257 145,374
% of travels completed 52.8% 51.1% 53.4% 44.8% 42.1% 47.6%
Delay at destination (h) 5.6 4.8 4.5 5.6 4.7 4.8
Cattaneo et al. European Transport Research Review (2019) 11:50 Page 10 of 13
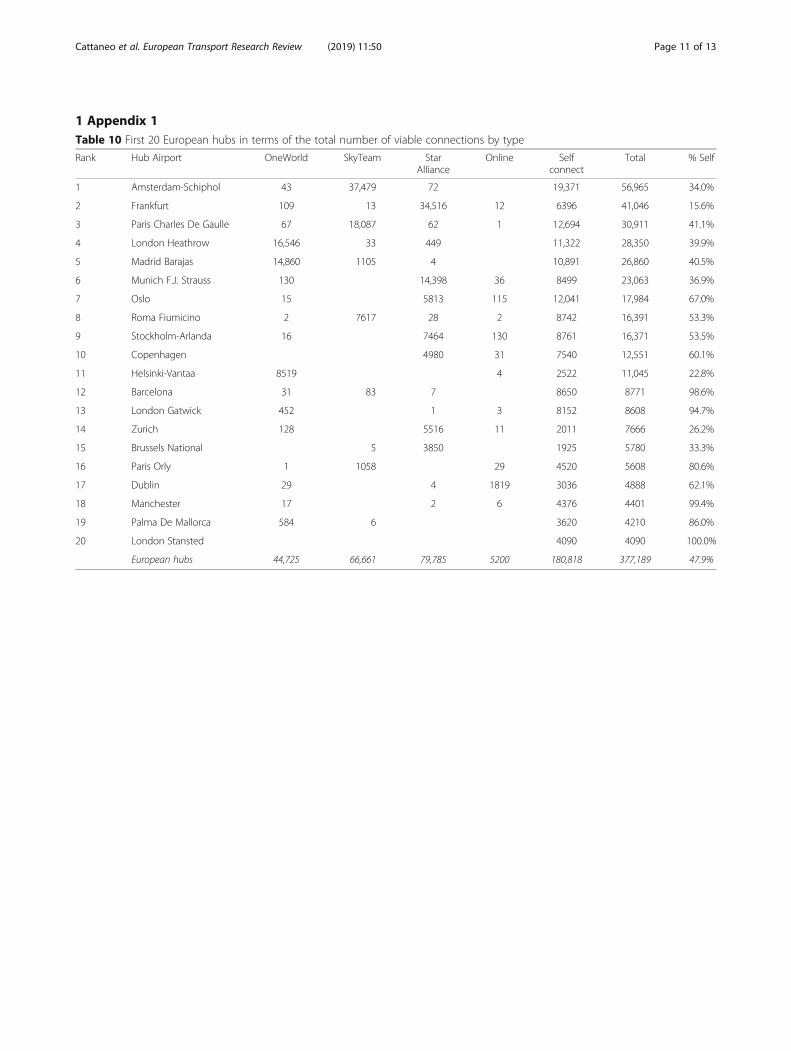
1 Appendix 1Table 10 First 20 European hubs in terms of the total number of viable connections by type
Rank Hub Airport OneWorld SkyTeam StarAlliance
Online Selfconnect
Total % Self
1 Amsterdam-Schiphol 43 37,479 72 19,371 56,965 34.0%
2 Frankfurt 109 13 34,516 12 6396 41,046 15.6%
3 Paris Charles De Gaulle 67 18,087 62 1 12,694 30,911 41.1%
4 London Heathrow 16,546 33 449 11,322 28,350 39.9%
5 Madrid Barajas 14,860 1105 4 10,891 26,860 40.5%
6 Munich F.J. Strauss 130 14,398 36 8499 23,063 36.9%
7 Oslo 15 5813 115 12,041 17,984 67.0%
8 Roma Fiumicino 2 7617 28 2 8742 16,391 53.3%
9 Stockholm-Arlanda 16 7464 130 8761 16,371 53.5%
10 Copenhagen 4980 31 7540 12,551 60.1%
11 Helsinki-Vantaa 8519 4 2522 11,045 22.8%
12 Barcelona 31 83 7 8650 8771 98.6%
13 London Gatwick 452 1 3 8152 8608 94.7%
14 Zurich 128 5516 11 2011 7666 26.2%
15 Brussels National 5 3850 1925 5780 33.3%
16 Paris Orly 1 1058 29 4520 5608 80.6%
17 Dublin 29 4 1819 3036 4888 62.1%
18 Manchester 17 2 6 4376 4401 99.4%
19 Palma De Mallorca 584 6 3620 4210 86.0%
20 London Stansted 4090 4090 100.0%
European hubs 44,725 66,661 79,785 5200 180,818 377,189 47.9%
Cattaneo et al. European Transport Research Review (2019) 11:50 Page 11 of 13
AbbreviationsGDS: Global distribution systems; LCCs: Low-cost carriers; MCT: Minimumconnecting time; MIDT: Marketing information data tapes; OAG: Officialairline guide
AcknowledgmentsWe thank the participants at the 2017 Air Transport Research Society WorldConference (ATRS) in Antwerp for useful discussions and helpful comments.
Authors’ contributionsThe work was a joint project of all authors. All authors read and approvedthe final manuscript.
FundingNot applicable.
Availability of data and materialsNot applicable.
Competing interestsThe authors declare that they have no competing interests.
Received: 5 May 2019 Accepted: 13 November 2019
References1. Abdelghany, K. F., Abdelghany, A. F., & Ekollu, G. (2008). An integrated
decision support tool for airlines schedule recovery during irregularoperations. European Journal of Operational Research, 185, 825–848.
2. Alamdari, F. (1999). Airline in-flight entertainment: The passengers’perspective. Journal of Air Transport Management, 5, 203–209.
3. Arikan, U., Gurel, S., & Akturk, M. S. (2016). Integrated aircraft and passengerrecovery with cruise time controllability. Annals of Operations Research, 236,295–317.
4. Barnhart, C., & Cohn, A. (2004). Airline schedule planning: Accomplishmentsand opportunities. Manufacturing and Service Operations Management, 6, 3–22.
5. Boeing. (2016). Current Market Outlook 2016–2035.6. Bratu, S., & Barnhart, C. (2006). Flight operations recovery: New approaches
considering passenger recovery. Journal of Scheduling, 9, 279–298.7. Burghouwt, G. (2007). Airline network development in Europe and its
implications for airport planning. Ashgate Publishing, Ltd. https://scholar.google.it/scholar?q=Airline+network+development+in+Europe+and+its+implications+for+airport+planning.+Ashgate+Publishing,+Ltd.&hl=it&as_sdt=0&as_vis=1&oi=scholart.
8. Burghouwt, G. (2012). Airline network development in Europe and itsimplications for airport planning. Airline Network Development in Europe andits Implications for Airport Planning.
9. Burghouwt, G., & Redondi, R. (2013). Connectivity in air transport networks:An assessment of models and applications. Journal of Transport Economicsand Policy, 47, 35–53.
10. Cattaneo, M., Malighetti, P., Paleari, S., & Redondi, R. (2017). Evolution of theEuropean network and implications for self-connection. Journal of AirTransport Management, 65, 18–28.
11. Cook, A., Tanner, G., Williams, V., & Meise, G. (2009). Dynamic costindexing—Managing airline delay costs. Journal of Air TransportManagement, 15, 26–35.
12. Deshpande, V., & Arıkan, M. (2012). The impact of airline flight schedules onflight delays. Manufacturing and Service Operations Management, 14, 423–440.
1 Appendix 2Table 11 First 20 European hubs in terms of number of extra-European viable connections by type
Rank Hub Airport OneWorld SkyTeam StarAlliance
Online Selfconnect
Total Interc. % % Self
1 London Heathrow 11,086 33 400 7497 19,016 67.1% 39.4%
2 Frankfurt 86 13 15,060 3650 18,809 45.8% 19.4%
3 Amsterdam-Schiphol 21 12,219 53 5110 17,403 30.6% 29.4%
4 Paris CDG 60 9629 62 1 5998 15,750 51.0% 38.1%
5 Munich F.J. Strauss 31 4920 2203 7154 31.0% 30.8%
6 Madrid Barajas 3395 392 4 2432 6223 23.2% 39.1%
7 Roma Fiumicino 2914 28 2448 5390 32.9% 45.4%
8 Zurich 41 2701 3 768 3513 45.8% 21.9%
9 Helsinki-Vantaa 1672 318 1990 18.0% 16.0%
10 Copenhagen 1003 869 1872 14.9% 46.4%
11 Dublin 26 4 593 981 1604 32.8% 61.2%
12 London Gatwick 138 1126 1264 14.7% 89.1%
13 Stockholm-Arlanda 729 502 1231 7.5% 40.8%
14 Vienna 602 381 983 47.0% 38.8%
15 Barcelona 25 24 7 870 926 10.6% 94.0%
16 Dusseldorf 425 5 31 425 886 24.0% 48.0%
17 Oslo 292 489 781 4.3% 62.6%
18 Manchester 17 2 1 694 714 16.2% 97.2%
19 Brussels National 5 493 185 683 11.8% 27.1%
20 Milano Malpensa 31 555 586 40.7% 94.7%
European hubs 17,139 25,368 26,790 607 38,610 108,514 28.8% 35.6%
Cattaneo et al. European Transport Research Review (2019) 11:50 Page 12 of 13
13. Dobruszkes, F., Givoni, M., & Vowles, T. (2017). Hello major airports, goodbyeregional airports? Recent changes in European and US low-cost airlineairport choice. Journal of Air Transport Management, 59, 50–62.
14. Duran, A. S., Gürel, S., & Aktürk, M. S. (2015). Robust airline scheduling withcontrollable cruise times and chance constraints. IIE Transactions, 47(1), 64–83.
15. Evangelho, F., Huse, C., & Linhares, A. (2005). Market entry of a low costairline and impacts on the Brazilian business travelers. Journal of AirTransport Management, 11(2), 99–105.
16. Fichert, F., & Klophaus, R. (2016). Self-connecting, codesharing and hubbingamong European LCCs: From point-to-point to connections? Research inTransportation Business and Management, 21, 94–98.
17. Franke, M. (2004). Competition between network carriers and low-costcarriers—Retreat battle or breakthrough to a new level of efficiency? Journalof Air Transport Management, 10, 15–21.
18. Gopalan, R., & Talluri, K. T. (1998). Mathematical models in airline scheduleplanning: A survey. Annals of Operations Research, 76, 155–185.
19. IATA (2016). IATA forecasts passenger demand to double over 20 years.20. Jetzki, M. (2009). The propagation of air transport delays in Europe. Master’s
thesis, RWTH Aachen University, Airport and Air Transportation Research.21. Kohl, N., Larsen, A., Larsen, J., Ross, A., & Tiourine, S. (2007). Airline disruption
management— Perspectives, experiences and outlook. Journal of AirTransport Management, 13, 149–162.
22. Lan, S., Clarke, J.-P., & Barnhart, C. (2006). Planning for robust airlineoperations: Optimizing aircraft routings and flight departure times tominimize passenger disruptions. Transportation Science, 40, 15–28.
23. Marla, L., Vaaben, B., & Barnhart, C. (2011). Integrated disruption managementand flight planning to trade off delays and fuel burn. Tech. Rep., DTUmanagement, 2011.
24. Maertens, S., Pabst, H., & Grimme, W. (2016). The scope for low-costconnecting services in Europe – Is self-hubbing only the beginning?Research in Transportation Business and Management, 21, 84–93.
25. Malighetti, P., Paleari, S., & Redondi, R. (2008). Connectivity of the Europeanairport network: “Self-help hubbing” and business implications. Journal of AirTransport Management, 14, 53–65.
26. Miller-Hooks, E., & Patterson, S. S. (2004). On solving quickest time problemsin time-dependent dynamic networks. Journal of Mathematical Modellingand Algorithms, 3, 39–71.
27. Redondi, R., Malighetti, P., & Paleari, S. (2011). Hub competition and travel times inthe world-wide airport network. Journal of Transport Geography, 19, 1260–1271.
28. Rebollo, J. J., & Balakrishnan, H. (2014). Characterization and prediction of airtraffic delays. Transportation research part C: Emerging technologies, 44, 231–241.
29. Suau-Sanchez, P., Voltes-Dorta, A., & Rodríguez-Déniz, H. (2016). The role ofLondon airports in providing connectivity for the UK: Regional dependenceon foreign hubs. Journal of Transport Geography, 50, 94–104.
30. Suau-Sanchez, P., Voltes-Dorta, A., & Rodríguez-Déniz, H. (2017). Anassessment of the potential for self-connectivity at European airports inholiday markets. Tourism Management, 62, 54–64.
31. Zeigler, P., Pagliari, R., Suau-Sanchez, P., Malighetti, P., & Redondi, R. (2017).Low-cost carrier entry at small European airports: Low-cost carrier effects onnetwork connectivity and self-transfer potential. Journal of TransportGeography, 60, 68–79.
Publisher’s NoteSpringer Nature remains neutral with regard to jurisdictional claims inpublished maps and institutional affiliations.
Cattaneo et al. European Transport Research Review (2019) 11:50 Page 13 of 13