managed migration and the labour market the health sector · pdf filemanaged migration and the...
TRANSCRIPT

KATHOLIEKEUNIVERSITEIT
LEUVEN
Managed Migration and the Labour Market The Health Sector The Belgian case Report prepared for the European Migration Network, Small Scale Study II
Authors: Prof. dr. Jozef Pacolet and Sigrid Merckx
FOD Binnenlandse Zaken and European Commission
July, 10th 2006
Hoger instituut voor de arbeid

1
The European Migration Network is established in order to collect and classify information on migration and asylum, provide access to this information and facilitate the exchange of it. The EMN also analyses this kind of information and has its own research projects The intention is to identify similarities and differences in the approaches of the EU Member States towards migration phenomena by comparing studies made on the national level, to stimulate the exchange of information, to promote goodwill and understanding between the Member States and, in this way, to contribute to well-founded and well-informed policy making. More information about the EMN will soon be available on: www.european-migration-network.org
The Belgian Contact Point is financed both by the Belgian Ministry of the Interior and the European Commission. Contact details: Mr Alain Schmitz, tel +32.2.206.19.20 – [email protected]
Mr Benedikt Vulsteke, tel +32.2.206.19.37 – [email protected]
2
1. EXECUTIVE SUMMARY
We documented the information on foreign students in the health education system and medical schools and the information on foreign professionals by their request on recognition of their certificates, their recognition to practice and presence in health professional registers and their real practice. This information remained fragmented. We confronted it with more global information on the health profession labour market as we could obtain it from previous and recent manpower planning studies for the health professions. We observe a limited inflow of foreign professionals, characterised by higher inflows for more qualified professions, which is in line with some theories on migration that make it more rewarding for better qualified professions. However the inflow is to a large extend concentrated to the neighbouring countries in combination with no language barrier (Netherlands, France, Germany) and two traditional immigration countries for Belgium, namely Italy and Morocco (the latter also with limited language barrier since French is a widespread used language). There is limited migration from the new member states up until now. More remarkable, but seeming to be a cross frontier phenomenon is the widespread presence of students of France in the French speaking education system of Belgium, and previously also students from the Netherlands. They are avoiding measures or rationing and supply control in their home country, while other migration flows risk to disturb similar measures in Belgium. For that reason some measures to limit this presence is announced in the French speaking part of the county, while additional measures are announced to include foreign medical doctors in the supply control or to limit the possibilities to acquire complete training here. This Belgian situation and our previous studies on manpower problems at European level made us conclude however that migration of foreign health professionals seems to be in some cases undesirable, unrealistic and unfeasible. It is undesirable if it would imply that there is a brain drain of qualified workers from developing countries that will need those professionals to establish a decent health care system. It is unrealistic when it concerns migration flows from developed and neighbouring countries all confronted with coming shortages, even though those shortages are sometimes created by themselves by rationing in the education system and the supply of new trained personnel and by trying to export their shortage or rationing in education expenditures. Finally it seems to be unfeasible when it is observed how for instance language barriers exist and other reasons restraining people from migration.

3
2. INTRODUCTION THE NATIONAL HEALTH SECTOR
Belgium has an highly developed health care and social care system where as well acute care, long term care, community care as hospital care is well organised. It is characterised by a reasonable high level of public financing and a balanced mix of provision of the care by as well private as public non profit providers and independent workers.
Table 1 Employment in heads in health care in Belgium, 1982-1999
1982 1990 1995 1996 1997 1998 1999
Independent health professions1
35 062 53 674 60 648 62 105 64 364 65 870 67 394
Employees working for a liberal profession in health care2
5 122 6 840 17 493 17 491 16 339 16 413 16 448
Employees in health care 122 052 147 563 146 298 147 378 152 439 156 195 159 880
Total health care 162 236 208 077 224 439 226 974 233 142 238 478 243 722
Proportion independents/total 25 29 35 35 35 35 34
1 Registered persons in RSVZ (NISSE, National institute for the social security of the self-employed) and workers abroad are ignored, besides the statistics contain also the number of veterinarians up to 1994, from 1995 only physicians, dentists, pharmacists and paramedics are considered.
2 This is someone who is paid by physicians, dentists, pharmacists or paramedics.
Source: Calculations HIVA on RSZ and RSVZ, in Pacolet, 2002
A difference can be made between the licence to practise and the organisation of the profession. The practice of the health professions is regulated by the RD nr. 78. Hereafter we give an overview of the health services and the health professions (and some related professions/ not all are regulated by RD nr. 78) which are involved. The control and follow up of this health manpower is the responsibility of national medical commissions, and the ministry of health: Geneeskundige commissie: a commission for specialists and general practitioners, FOD Public Health. The planning of (some of) the medical professions is the responsibility of the Planning commission medical supply.

4
Since 2005 (law 24 November 2004) (Borgions, 54) the visum for the profession will not be recognised by the medical commission, but directly by the FOD Health, (Directoraat-generaal Gezondheidsberoepen, Volksgezondheid, Veiligheid van de Voedselketen en Leefmilieu).
To organise the administrative follow up of the licence to practice, the number, address, and in the future also the real practice, a central register for all health professions has been created. A streamlining of administrative processes and recognition is planned. This administrative process is described in scheme 1. More recently (March 2006) a Central Data Management unit has been created in DG2 to act as a user interface between the FOD, Health professional planning unit and external users (M. Van Hoegaerden, 6 March 2006 Nota).

5
Table 2 Principal sectors for health practitioners
Sector
a. Consulting room of a medical doctor/ dentist / physiotherapist/ district nurse : A room to keep consultations and from where the house calls can be organised
b. General hospitals 0 short stay or acute (including day hospitals, assessment centres, maternity hospitals); 1 long term (including geriatric beds or units in general hospitals).
c. Psychiatric hospitals:
0 short stay or acute; 1 long term (including geriatric beds or units in psychiatric hospitals).
d. Residential services: 'Residential services' refer to non-hospital institutional nursing or care services offered to persons (elderly, disabled, psychiatric patients, ...) who cannot remain in their own home or stay with relatives, friends, etc.. They include nursing homes, old age homes, rehabilitation homes, ... The facilities may provide services on a temporary or on a permanent basis. Most countries make the distinctions between nursing homes or the equivalent for disabled and residential homes or the equivalent for disabled. Remark: the criterion to distinguish hospital and non-hospital services can be the permanent presence of a medical specialist. However, the distinction is not always easy since residential care is becoming more and more 'medicalised'. e. Community care: Encompasses services provided to persons (elderly, disabled, psychiatric or other patients, ...) who live at home or in supported housing schemes (service flats, sheltered housing, ...) but have difficulties in managing activities of daily life or need medical or nursing care. The most important sectors are 'home nursing' (mainly district nursing but also preventive health care such as child care at home) and 'primary care' (general medical practice). f. Other social service sectors: Education (in schools and in school related services, teaching), in industry (medical services in organisations and related services), employment in other public or private institutions (ministries, military services, the Red Cross, aid in developing countries, ..., ) g. Other sectors of the economy: for example, journalism, politics, …
Source: ‘Plus est en vous herbekeken, deel 3’ (Pacolet J. e.a.., 2002) and reports on ’l’offre et la demande’ (Leroy X. e.a., 2002).
6
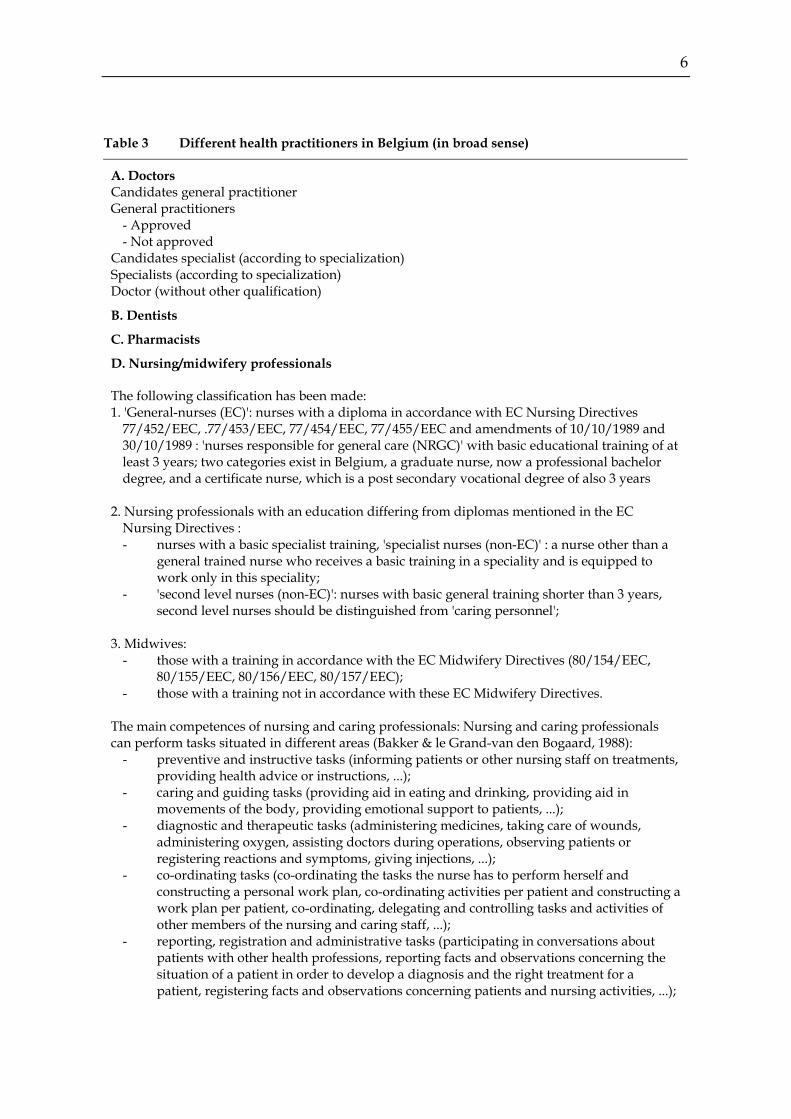
Table 3 Different health practitioners in Belgium (in broad sense)
A. Doctors Candidates general practitioner General practitioners
- Approved - Not approved
Candidates specialist (according to specialization) Specialists (according to specialization) Doctor (without other qualification)
B. Dentists
C. Pharmacists
D. Nursing/midwifery professionals The following classification has been made: 1. 'General-nurses (EC)': nurses with a diploma in accordance with EC Nursing Directives
77/452/EEC, .77/453/EEC, 77/454/EEC, 77/455/EEC and amendments of 10/10/1989 and 30/10/1989 : 'nurses responsible for general care (NRGC)' with basic educational training of at least 3 years; two categories exist in Belgium, a graduate nurse, now a professional bachelor degree, and a certificate nurse, which is a post secondary vocational degree of also 3 years
2. Nursing professionals with an education differing from diplomas mentioned in the EC Nursing Directives : - nurses with a basic specialist training, 'specialist nurses (non-EC)' : a nurse other than a
general trained nurse who receives a basic training in a speciality and is equipped to work only in this speciality;
- 'second level nurses (non-EC)': nurses with basic general training shorter than 3 years, second level nurses should be distinguished from 'caring personnel';
3. Midwives: - those with a training in accordance with the EC Midwifery Directives (80/154/EEC,
80/155/EEC, 80/156/EEC, 80/157/EEC); - those with a training not in accordance with these EC Midwifery Directives.
The main competences of nursing and caring professionals: Nursing and caring professionals can perform tasks situated in different areas (Bakker & le Grand-van den Bogaard, 1988):
- preventive and instructive tasks (informing patients or other nursing staff on treatments, providing health advice or instructions, ...);
- caring and guiding tasks (providing aid in eating and drinking, providing aid in movements of the body, providing emotional support to patients, ...);
- diagnostic and therapeutic tasks (administering medicines, taking care of wounds, administering oxygen, assisting doctors during operations, observing patients or registering reactions and symptoms, giving injections, ...);
- co-ordinating tasks (co-ordinating the tasks the nurse has to perform herself and constructing a personal work plan, co-ordinating activities per patient and constructing a work plan per patient, co-ordinating, delegating and controlling tasks and activities of other members of the nursing and caring staff, ...);
- reporting, registration and administrative tasks (participating in conversations about patients with other health professions, reporting facts and observations concerning the situation of a patient in order to develop a diagnosis and the right treatment for a patient, registering facts and observations concerning patients and nursing activities, ...);

7
E. Caring professionals: The EC directives for nurses do not refer to caring professionals, categories of health professionals who are unqualified as a nurse but of whom the scope of practice can overlap with nurses' tasks (e.g. care for the elderly in old age homes or at home), including a new category of ‘zorgkundige’.
F. Paramedical professionals : Paramedical professionals are non-medical, non-nursing, non-caring allied health professionals Occupational therapist Podiatrist Orthopedist Medical – laboratory technologist Speech therapist Nutritionists – dietician Bandager Orthesist Prothetist Orthopaedist
G. Physiotherapist
H. Social workers Social assistant Psychology assistant
I. Educator
J. Helping Personal and logistic assistant
K. Psychologist (and especially clinical psychologist)
L Others, among others housekeeping tasks (making beds, distributing meals, ...).
Source: Pacolet J. e.a. (2002), Plus est en vous herbekeken and Pacolet, Bouten en Versieck, Manpower problems in the nursing profession.

8
Provincial Medical Commission (10)
1 Visa certificates in the pr ce where
one will be practising
2 Order of doctors
Health
Doctors, veterinary surgeons, dentists,pharmacists, nurses, midwives andparamedics Data
- Name + address - Date of birth - Gender - University - Retraining - ..
Assignment - Visa certificates - Supervision on practising
different professions - Organising “on duty” services
Federal Register of Health Practitioners
3
Graduates
Source: Deliège, Pacolet, Artoisenet, Cattaert
Figure 1 Overview of data flow, in the y
ovin
Insurance
4 Apprenticeship plan
Direction Medical Practice (DG 2)
Committee of Health Care facilities (DG 1)
Unit planning
Centre of data processing
Yearbook 31/12/X for doctors, dentists, veterinary surgeonsandpharmacists
- Gender + date of birth + nationality + region - Classification health practitioners - Number of inhabitants/health practitioner - Clinical practice - Speciality + university
Objective: personnel data care institution per pathology and per health profession (number,
FTE, cost price and time)
Crossroads Bank ofSocial Security
National Register RSZ/RVP … RSVZ/RSZPPO
, Lorant, 2004
ear 2004

9
3. METHODOLOGY
We tried to identify the number of migrant workers in the available sources on health manpower. As well information on the present stock of the workforce, as the newcomers and inflow are closely related with the educational system that provides additional information on present inflow according to nationality. The main information source comes from our own and other present manpower planning studies for the health professionals in Belgium and its Communities, but a further assessment of the relevance of the information of the basic source has been done. A distinction need to be made between those having or acquiring a degree of a health profession, those who are really practicing their profession in the health care sector and finally (for planning and controlling the health expenditures) those eligible for reimbursement by the health insurance. The recognition of the qualification and diplomas is one step. A second step is the recognition for practicing and finally, and it is not al the time identical, the recognition for reimbursement of the health insurance. For the moment no information was found for the latter group. For those licensed to practice, a central register (‘kadaster’) has been further developed and is becoming more easily accessible and it can provide more information on the nationality of the practitioners. We provide information for physicians, dentists and physiotherapists. The information we found for nurses is preliminary. In the coming months this register for nurses will be updated and will become more reliable. In our manpower planning studies we have more detailed information on the nationality of students.

10
4. MIGRATION POLICY AND THE NATIONAL HEALTH SECTOR
Migration and mobility touches the health care sector in the same way as other industries. The European integration results in 3 important freedoms: the free movement of workers, the free provision of services (providing services here as a foreign country) and of establishing abroad (see a.o. HRW, Advies 2006). On top of that we should consider the growing importance of mobility of the patients towards other countries. The freedom of movement of the workers can take the form of salaried employment or of independent work. For the moment the EU regulation makes the distinction between the EU citizen (including the EEA) who does not need a work permit (and neither does the employer), with exception for the moment for 8 New Member states (‘A8’ countries) (Malta and Cyprus are in the same situation as the old MS). Those NMS need a work permission, such as the non EU-migrants. The independent workers do not need a work permission, but there is a need for compliance with the national regulations for independent workers. (HRW, Advies 2006, p. 4). The European citizens do not need a work permit, but they have to register in the population register of the town when they want to stay longer than 3 months (Health Professionals Abroad, they have to apply here for a residence permit (‘verblijfsvergunning’)), Model B Mauve Card for stay up to 1 year, Blue card for more than 5 years. For the non EU a white card is a permit to stay for a limited period, the yellow card is for a non-EU for an unlimited period. The migrants from the NMS and non EU-countries are since the law of 30/4/1999 obliged to have a work permit as an employee: a card A (arbeidskaart) for an unlimited period for all employers and activities, for the migrants who stay here for a longer period. The employer does not require a work permit (arbeidsvergunning). The work permit B is limited to one employer and one profession for 12 months, but extendible. The employer needs a permission but it is issued only in case neither nationals nor other EU15 nationals can fill the position (Traser J. et al, 2005, p. 8). In 2003 a new type C was introduced, with a maximum of 12 months, but extendible, for all employers and professions. The employer is not required to have a permission. The target groups are candidate refugees and students. The request for card A and C must be introduced by the employee, the request for card B and the permission must be introduced by the employer. The request must be introduced at the office of the regional work offices, VDAB in Flanders, BGDA in Brussels and FOREM in Wallonia (HRW, Advies 2006, p. 5).

11
The independent workers of non-EU origin need a professional card (Beroepskaart), attributed by the local municipality of residence, or the Belgian embassy in the country of origin. There are other ways to enter the Belgian labour market than via independent work or being employee in a Belgian firm. Alternatives are as a foreign provider or via direct establishing of an activity in Belgium. The provision of services from abroad can be by direct activities, or via ‘detachering’. The employees of a NMS are not obliged to have a work card in the case of ‘detachering’, and even if they are ‘gedetacheerd’ by a firm of the EEA, and not being a citizen of the EU, they still are exempted when they are well established in the home country. A special case, and well controlled, is interim labour, by national or foreign interim bureaus. For the new MS citizens, the Belgian ‘Dienst Toezicht op de Sociale Wetten’ of FOD WASO (Federal Service Work and Industrial Relations) requires that they have a work permission for Belgium. Further possibilities of ‘detachering’ are subcontracting, for the moment especially existing in the building industry.
A large share of immigration comes from EU-member states. In 2000 the largest group of migrants (23% of total) came from Italy, followed by France, Morocco and the Netherlands (FOD Werkgelegenheid, Arbeid en Sociaal Overleg, 2003, p. 9). Those four groups are also prominent present in the active population (Ibidem., p. 34). The inflow of A8-workers in general has been limited (Traser J. et al, 2005, p. 19) in the first year: in May 2004 the inflow for the Walloon and Brussels Region was stated on 622, compared with 426 for Belgium in the pre-enlargement period (Ibidem,, information from “Office des Etrangers”). In the period 2004-2006 Belgium applied the maintenance of the present system of granting work permits for the 8 new Member States. In 2006-2009 Belgium prefers to maintain this system, but a political compromise has been introduced for so called ‘knelpuntberoepen’, where open shortages apply. A list of such professions has to be made for the different regions, namely the Flemish region, Walloon region, Brussel-Capital region, but also the German-speaking community. ‘Nursing’, that has been called a ‘knelpuntberoep’, is included in these four lists. This will imply that for nursing (and other professions) card B will be awarded after 5 working days, without an investigation of this labour market (http://www.petervanvelthoven.be/article.php?id=320). Since 1991 there is an increased facility to obtain the Belgian nationality for children of the second and third generation, a policy reinforced in 1995 and again in 2000 (in that year 62 000 naturalisations occurred, compound to an average of

12
25 000 - 30 000). This implies that the proportion of foreign nationalities decreased (Ibidem, p. 15).

13
Table 4 Work permits A, B and C, delivered in 2003, 2004 and 2005
2003 2004 2005
Work permit B Work permit B Work permit B
Work permit
A Total
Of which 1st work permit
Work permit
C
Work permi
t A Total
Of which 1st work permit
Work permit
C
Work permit
A Total
Of which 1st work permit
Work permit
C
Total New Member States, of whom for:
15 1 641 1 067 290 17 1 893 1 312 489 17 3 535 2 321 574
- Brussels-Capital Region 5 213 115 73 6 236 129 95 6 241 94 101 - Flemish Region 6 1 211 852 184 2 1 497 1 098 345 1 3 127 2 128 418 - Walloon Region 3 169 88 33 5 116 69 48 5 132 81 51 - German-Speaking
Community 1 48 11 0 4 44 17 1 5 35 18 4
Total foreigners, of whom for:
329 9 362 4 627 24 143 108 9 104 4 320 29 550 154 11 033 5 489 27 720
- Brussels-Capital Region 117 2 407 969 9 025 37 2 455 969 10 375 50 1 990 526 9 035 - Flemish Region 142 5 402 2 799 9 779 35 5 269 2 799 12 581 31 7 551 4 290 12 175 - Walloon Region 62 1 417 507 5 101 27 1 215 507 6 281 41 1 380 643 6 251 - German-Speaking
Community 8 136 44 238 9 165 45 313 32 112 30 259
Source: Hoge Raad voor de Werkgelegenheid, 2006, p. 17-18

14
Table 5 Number of independent workers and helpers who have started their activity in the course of the year
2003 2004
Total New Member States 583 1 320 Total foreigners 6 870 8 716 Pro memoria: Belgians and foreigners
55 031 60 238
Source: Hoge Raad voor de Werkgelegenheid, 2006, p. 19 on information RSVZ

15
5. THE EMPLOYMENT OF IMMIGRANTS IN THE HEALTH SECTOR
5.1 Workforce in total and of foreign origin
Table 6 Total employment of nursing and caring personnel in Belgium, 2000, number of jobs
Dutch - speaking French – German speaking
Belgium
Graduate nurse 34 130 22 849 56 979 Certificate nurse 28 491 13 094 41 585 Second level nurse 5 228 2 011 7 239 Total nurses 67 851 37 954 105 803 Caring personnel 43 771 33 024 76 795 Total nursing and caring personnel 111 622 70 978 182 598
Bron: Pacolet, Deliége, Cattaert, Coudron, 2005
Table 7 Employment of a number of health care professions (ISCO-classification)2 in the health care sector (NACE 85) in Flanders, according to place of residence1, 1999-2000
ISCO-code ISCO-description 1999 2000
222 Health professionals (except nursing)3 22 757 22 647 223 Nursing and midwifery professionals 66 380 69 316 244 Social science and related professionals4 19 978 19 939 322 Modern health associate professionals (except
nursing)5 19 888 23 898
323 Nursing and midwifery associate professionals 1 720 2 228 513 Personal care and related workers6 39 508 43 460
Total considered health care professions7 170 231 181 488
1 In this table people living in Flanders are taken into account. 2 ISCO: International Standard Classification of Occupations 3 Health professionals includes medical doctors, dentists, veterinarians, pharmacists, … 4 Social science and related professionals includes social workers, but also economists,
philosophers, … 5 Health associate professionals includes medical assistants, dental assistants, dieticians,
opticians, … 6 Personal care and related workers includes child-care workers, institution-based personal care
workers, home-based personal care workers 7 Only the health care professions are in the table, so that the total number is different from
table 25.
Source: NIS, Enquête naar de arbeidskrachten (Labour Force Survey)

16
Table 8 Employment of a number of health care professions (ISCO-classification)1 in the health care sector (NACE 85) in Belgium, 2004
ISCO-code ISCO-description 2004
222 Health professionals (except nursing)2 44 798 223 Nursing and midwifery professionals 119 213 244 Social science and related professionals3 33 373 322 Modern health associate professionals (except nursing)4 34 276 323 Nursing and midwifery associate professionals 13 361 411 Secretaries and keyboard-operating clerks 18 014 419 Other office clerks 29 168 512 Housekeeping and restaurant services workers 16 777 513 Personal care and related workers5 67 264 913 Domestic and related helpers, cleaners and launderers 21 838 914 Building caretakers, window and related cleaners 16 064 Total considered health care professions 414 145
Total personnel of NACE 85 508 625
1 ISCO: International Standard Classification of Occupations 2 Health professionals includes medical doctors, dentists, veterinarians, pharmacists, … 3 Social science and related professionals includes social workers, but also economists,
philosophers, … 4 Health associate professionals includes medical assistants, dental assistants, dieticians,
opticians, … 5 Personal care and related workers includes child-care workers, institution-based personal care
workers, home-based personal care workers
Source: NIS, Enquête naar de arbeidskrachten (Labour Force Survey)

17
Table 9 Employment1 in the health care sector (NACE 85) in Belgium according to profession (ISCO-classification)2 and education (ISCED-classification)3, 2004
Primaryschool
Higher secondary education
Lower secondary education
Higher education short type
Higher education long type
University education
Total
ISCO 0 Armed forces 0 0 352 0 0 0 352ISCO 1 Legislators, senior officials and
managers 337 700 1 743 4 696 499 5 222 13 198 ISCO 2 Professionals 329 2 707 36 077 102 356 9 726 60 076 211 271 ISCO 3 Technicians and associate
professionals 779
3 612 28 171 37 222 6 114 7 635 83 532ISCO 4 Clerks 1 333 3 582 27 507 15 700 1 601 3 562 53 284 ISCO 5 Service workers and shop and market
sales workers 7 235 18 060 55 272 4 551 298 448 85 863 ISCO 6 Skilled agricultural and fishery
workers 117 358 375 0 112 0 961ISCO 7 Craft and related traders workers 603 1 466 1 785 0 0 86 3 941 ISCO 8 Plant and machine operators and
assemblers 1 010 1 072 1 193 0 0 0 3 275 ISCO 9 Elementary occupations -
Handicapped persons in sheltered workshops 17 261 16 841 17 432 986 116 311 52 947
Total 29 004 48 397 169 907 165 511 18 466 77 341 508 625
1. Cells with less than 5 000 persons can be unreliable 2. ISCO: International Standard Classification of Occupations 3. ISCED: International Standard Classification of Education
Source: NIS, Sociale statistieken, enquête naar de arbeidskrachten 2004 (Labour Force Survey)

18
According to the newly created register of health professionals, based on the moment of recognition, some 17 to 70 (in 2001) physicians came from abroad between the year 1999 and 2005, of which 11 to 30 from the EU. They were more numerous in the French speaking part of the country (Deliège, Artoisenet, note 17 july 2005). According to the information of the international recognition of diplomas (information Caroline Jadot, quoted in Deliège and Artoisenet) there were some 115 diploma’s recognised in 2003 and 138 in 2004 for medical doctors. Many of them were recognized to obtain further qualifications in Belgium either as a general practitioner or as a specialist. Distinction need to be made between those asking for recognition as a physician with a basic degree, and those qualified as a general practitioner or specialist. Of the latter some additional 17 and 30 physicians are recognized in 2003 and 2004. In the register of medical professions those will however also be licensed to practice. In a preliminary comparison between the register and the recognitions of certificates, about 75% are found in the register, which implies that they are in principle licensed to practice. The register is based on this recognition to practice. There is a growing debate whether or not the national medicine students, confronted with the contingency, are discriminated towards the foreign students with a foreign degree who come here to specialize (sometimes to avoid a numerus clausus in their home country). So the issue is if they should also be subject to a similar contingency. The federal Minister of Health is investigating if there is a need for such a specific contingency on top of those for the national students (Algemene Beleidsnota Minister Demotte, p 73). To maintain the support to developing countries the Minister also considers that MD from non-EU countries can continue to obtain further specialization in our country but no longer for a complete discipline but only for a specific field of specialization, so avoiding there is a misunderstanding that they are obtaining the degree of specialization (Algemene Beleidsnota Minister Demotte, 2005). This will imply that they will not be allowed to follow a complete programme of specialization in Belgium, but only a limited number of years (3, communication D. Deliège, 2006).
The inflow of foreign dentists is considered limited: ± 19 for the Dutch speaking community, 18 for the French-speaking Community over a period of 5 years, and for a total workforce of some 7 984 in 2000 for Belgium (of whom 7 442 practising) (Deliège, Artoisenet, April 2005, p. 23).

19
Table 10 Migrant workers employed in ISCO occupation in the Health Sector in 2004 by nationality including totals for EU-15, the new member states (EU-10), EU/EEA & non-EU/EEA.
Year 2004 Occupation
Nationality and/or country of origin
Medical doctors/
physicians DentistsDental
assistants Pharma-
cists
Pharma-ceutical
assistants
Nurses/ midwives
* Caretaker Psychologists
Physio-therapists &
assoc. professionals Total
Belgium 43 679 0 120 004 27 257 190 940France 881 1 831 752 2 465Germany 268 776 107 171 1 322Italy 311 0 1 165 44 1 520The Netherlands 1 037 0 327 218 1 582Other EU-15 688 95 391 127 1 301Total EU-15 (without Belgium)
3 185 872 2 821 1 312 8 190
Total EU-10 18 0 43 17 78Other EU/EEA-countries 22 1 22 53 98 Total EU/EEA-countries (without Belgium)
3 225 873 2 886 1 382 8 366
Morocco 31 0 510 69 610Other non-EU/EEA-countries
457 17 665 394 1 533
Total non-EU/EEA-countries
488 17 1 175 463 2 143
Total (without Belgium) 3 713 890 4 061 1 845 10 509 Total (including Belgium) 47 392 890 124 065 29 102 201 449
* Preliminary figures.
Source: Federal register of health practitioners

20
Table 11 Migrant workers employed in ISCO occupation in the Health Sector in 2004 by nationality including totals for EU-15, the new member states (EU-10), EU/EEA & non-EU/EEA.
Year 2005 Occupation
Nationality and/or country of origin
Medical doctors/
physicians Dentists Dental
assistants Pharma-
cists
Pharma-ceutical
assistants
Nurses/ midwives
* Caretaker Psychologists
Physio-therapists &
assoc. professionals Total
Belgium 44 455 8 560 120 004 27 564 200 583 France 930 154 831 759 2 674 Germany 302 23 107 174 606 Italy 339 43 1 165 44 1 591 The Netherlands 1 118 73 327 222 1 740 Other EU-15 720 76 391 128 1 315 Total EU-15 (without Belgium)
3 409 369 2 821 1 327 7 926
Total EU-10 44 3 43 17 107 Other EU/EEA-countries 27 5 22 53 107 Total EU/EEA-countries (without Belgium)
3 480 377 2 886 1 397 8 140
Morocco 35 3 510 73 621 Other non-EU/EEA-countries
480 55 665 398 1 598
Total non-EU/EEA-countries
515 58 1 175 471 2 219
Total (without Belgium) 3 995 435 4 061 1 868 10 359 Total (including Belgium) 48 450 8 995 124 065 29 432 210 942
* Preliminary figures.
Source: Federal register of health practitioners

21
Table 12 Nurses and midwives in Belgium, by nationality and year of graduation, 1980 (1995 and earlier) to 2004, preliminary results
Nationality and/or country of origin 1995 and
earlier
1996 1997 1998 1999 2000 2001 2002 2003 2004 Total
Belgium 55 294 3 029 2 716 2 086 1 544 1 291 760 221 32 3 66 976 France 476 50 25 12 14 34 42 37 21 6 717 Germany 60 3 1 1 0 1 6 2 4 1 79 Italy 781 49 28 21 12 10 16 6 2 0 925 The Netherlands 188 7 6 4 0 2 12 12 5 1 237 Other EU-15 264 9 7 4 2 0 7 6 7 3 309 Total EU-15 (without Belgium) 1 769 118 67 42 28 47 83 63 39 11 2 267
Total EU-10 31 2 1 2 1 1 0 0 0 0 38 Other EU/EEA-countries 12 1 1 0 0 0 0 0 0 0 14 Total EU/EEA-countries (without Belgium)
1 812 121 69 44 29 48 83 63 39 11 2 319
Morocco 362 49 25 14 9 1 1 2 0 0 463 Other non-EU/EEA-countries 400 34 30 15 6 8 13 13 8 0 527 Total non-EU/EEA-countries 762 83 55 29 15 9 14 15 8 0 990
Total (without Belgium) 2 574 204 124 73 44 57 97 78 47 11 3 309 Total (including Belgium) 57 868 3 233 2 840 2 159 1 588 1 348 857 299 79 14 70 285
Source: Federal register of health practitioners

22
Table 13 Percentage of foreign nurses and midwives in Belgium, by nationality and year of graduation, 1980 (1995 and earlier) to 2004, preliminary results
Nationality and/or country of origin 1995 and
earlier
1996 1997 1998 1999 2000 2001 2002 2003 2004 Total
France 18,5 24,5 20,2 16,4 31,8 59,6 43,3 47,4 44,7 54,5 21,7 Germany 2,3 1,5 0,8 1,4 0,0 1,8 6,2 2,6 8,5 9,1 2,4 Italy 30,3 24,0 22,6 28,8 27,3 17,5 16,5 7,7 4,3 0,0 28,0 The Netherlands 7,3 3,4 4,8 5,5 0,0 3,5 12,4 15,4 10,6 9,1 7,2 Other EU-15 10,3 4,4 5,6 5,5 4,5 0,0 7,2 7,7 14,9 27,3 9,3 Total EU-15 (without Belgium) 68,7 57,8 54,0 57,5 63,6 82,5 85,6 80,8 83,0 100,0 68,5
Total EU-10 1,2 1,0 0,8 2,7 2,3 1,8 0,0 0,0 0,0 0,0 1,1 Other EU/EEA-countries 0,5 0,5 0,8 0,0 0,0 0,0 0,0 0,0 0,0 0,0 0,4 Total EU/EEA-countries (without Belgium)
70,4 59,3 55,6 60,3 65,9 84,2 85,6 80,8 83,0 100,0 70,1
Morocco 14,1 24,0 20,2 19,2 20,5 1,8 1,0 2,6 0,0 0,0 14,0 Other non-EU/EEA-countries 15,5 16,7 24,2 20,5 13,6 14,0 13,4 16,7 17,0 0,0 15,9 Total non-EU/EEA-countries 29,6 40,7 44,4 39,7 34,1 15,8 14,4 19,2 17,0 0,0 29,9
Total (without Belgium) 100,0 100,0 100,0 100,0 100,0 100,0 100,0 100,0 100,0 100,0 100,0
Source: Federal register of health practitioners
23
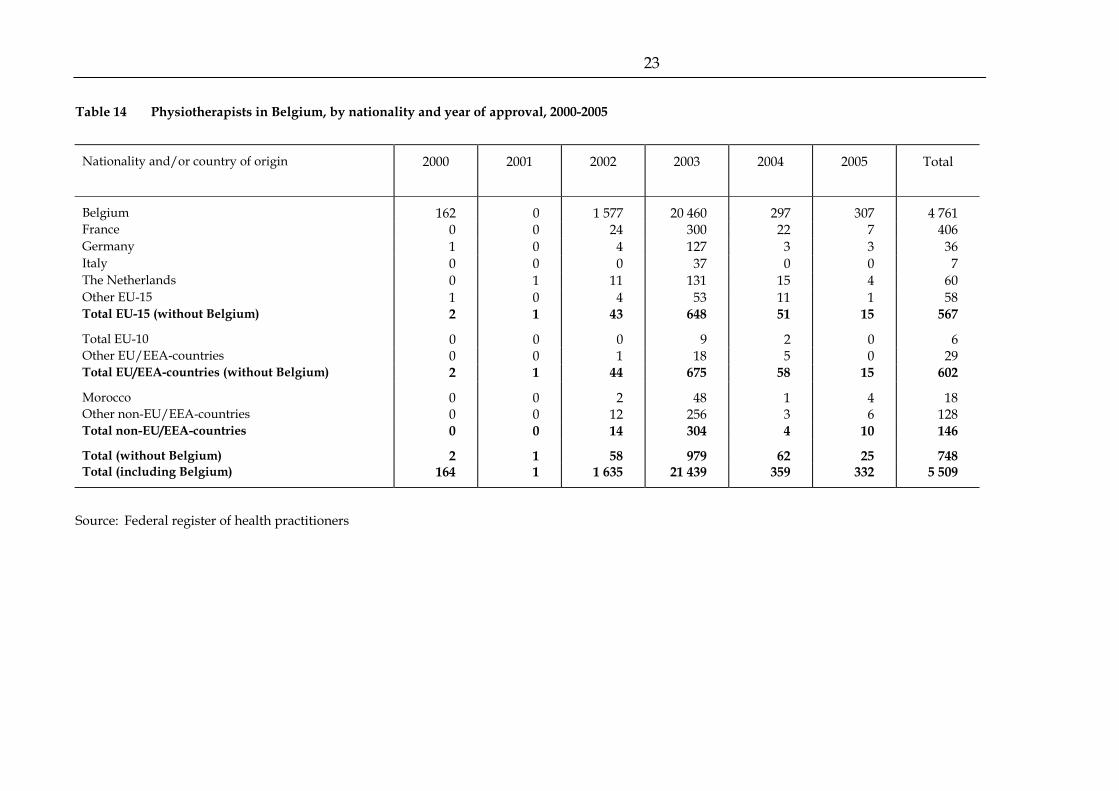
Table 14 Physiotherapists in Belgium, by nationality and year of approval, 2000-2005
Nationality and/or country of origin 2000 2001 2002 2003 2004 2005 Total
Belgium 162 0 1 577 20 460 297 307 4 761France 0 0 24 300 22 7 406Germany 1 0 4 127 3 3 36Italy 0 0 0 37 0 0 7The Netherlands 0 1 11 131 15 4 60Other EU-15 1 0 4 53 11 1 58Total EU-15 (without Belgium) 2 1 43 648 51 15 567
Total EU-10 0 0 0 9 2 0 6Other EU/EEA-countries 0 0 1 18 5 0 29Total EU/EEA-countries (without Belgium) 2 1 44 675 58 15 602
Morocco 0 0 2 48 1 4 18Other non-EU/EEA-countries 0 0 12 256 3 6 128Total non-EU/EEA-countries 0 0 14 304 4 10 146
Total (without Belgium) 2 1 58 979 62 25 748Total (including Belgium) 164 1 1 635 21 439 359 332 5 509
Source: Federal register of health practitioners

24
Table 15 Percentage of foreign physiotherapists in Belgium, by nationality and year of approval, 2000-2005
Nationality and/or country of origin 2000 2001 2002 2003 2004 2005 Total
France 0,0 0,0 41,4 30,6 35,5 28,0 54,3Germany 50,0 0,0 6,9 13,0 4,8 12,0 4,8Italy 0,0 0,0 0,0 3,8 0,0 0,0 0,9The Netherlands 0,0 100,0 19,0 13,4 24,2 16,0 8,0Other EU-15 50,0 0,0 6,9 5,4 17,7 4,0 7,8Total EU-15 (without Belgium) 100,0 100,0 74,1 66,2 82,3 60,0 75,8
Total EU-10 0,0 0,0 0,0 0,9 3,2 0,0 0,8Other EU/EEA-countries 0,0 0,0 1,7 1,8 8,1 0,0 3,9Total EU/EEA-countries (without Belgium) 100,0 100,0 75,9 68,9 93,5 60,0 80,5
Morocco 0,0 0,0 3,4 4,9 1,6 16,0 2,4Other non-EU/EEA-countries 0,0 0,0 20,7 26,1 4,8 24,0 17,1Total non-EU/EEA-countries 0,0 0,0 24,1 31,1 6,5 40,0 19,5
Total (without Belgium) 100,0 100,0 100,0 100,0 100,0 100,0 100,0
Source: Federal register of health practitioners

25
Table 16 Doctors in Belgium, by nationality and year of visa, 1995 (and earlier) to 2005
Nationality and/or country of origin
1995 and
earlier
1996 1997 1998 1999 2000 2001 2002 2003 2004 2005 Un-known
Total
Belgium 33 222 1 289 1 167 1 192 1 283 1 270 1 387 1 117 733 1 011 776 8 44 455 France 442 35 30 44 30 53 50 77 64 56 49 0 930Germany 150 4 13 7 14 11 22 23 11 12 34 1 302Italy 170 11 17 14 14 15 15 13 14 26 28 2 339The Netherlands 473 29 56 33 52 65 84 95 93 57 81 0 1 118Other EU-15 420 23 19 20 27 32 37 37 49 24 32 0 720Total EU-15 (without Belgium)
1 655 102 135 118 137 176 208 245 231 175 224 3 3 409
Total EU-10 1 2 0 3 1 1 0 1 3 6 26 0 44Other EU/EEA-countries 13 0 0 1 0 1 2 2 1 2 5 0 27Total EU/EEA-countries (without Belgium)
1 669 104 135 122 138 178 210 248 235 183 255 3 3 480
Morocco 22 0 0 2 0 0 1 1 3 2 4 0 35Other non-EU/EEA-countries
226 25 19 23 15 19 36 32 35 27 23 0 480
Total non-EU/EEA-countries
248 25 19 25 15 19 37 33 38 29 27 0 515
Total (without Belgium) 1 917 129 154 147 153 197 247 281 273 212 282 3 3 995Total (including Belgium) 35 139 1 418 1 321 1 339 1 436 1 467 1 634 1 398 1 006 1 223 1 058 11 48 450
Source: Federal register of health practitioners

26
Table 17 Percentage of foreign doctors in Belgium, by nationality and year of visa, 1995 (and earlier) to 2005
Nationality and/or country of origin
1995 and
earlier
1996 1997 1998 1999 2000 2001 2002 2003 2004 2005 Un-known
Total
France 23,1 27,1 19,5 29,9 19,6 26,9 20,2 27,4 23,4 26,4 17,4 0,0 23,3Germany 7,8 3,1 8,4 4,8 9,2 5,6 8,9 8,2 4,0 5,7 12,1 33,3 7,6Italy 8,9 8,5 11,0 9,5 9,2 7,6 6,1 4,6 5,1 12,3 9,9 66,7 8,5The Netherlands 24,7 22,5 36,4 22,4 34,0 33,0 34,0 33,8 34,1 26,9 28,7 0,0 28,0Other EU-15 21,9 17,8 12,3 13,6 17,6 16,2 15,0 13,2 17,9 11,3 11,3 0,0 18,0Total EU-15 (without Belgium)
86,3 79,1 87,7 80,3 89,5 89,3 84,2 87,2 84,6 82,5 79,4 100,0 85,3
Total EU-10 0,1 1,6 0,0 2,0 0,7 0,5 0,0 0,4 1,1 2,8 9,2 0,0 1,1Other EU/EEA-countries 0,7 0,0 0,0 0,7 0,0 0,5 0,8 0,7 0,4 0,9 1,8 0,0 0,7Total EU/EEA-countries (without Belgium)
87,1 80,6 87,7 83,0 90,2 90,4 85,0 88,3 86,1 86,3 90,4 100,0 87,1
Morocco 1,1 0,0 0,0 1,4 0,0 0,0 0,4 0,4 1,1 0,9 1,4 0,0 0,9Other non-EU/EEA-countries
11,8 19,4 12,3 15,6 9,8 9,6 14,6 11,4 12,8 12,7 8,2 0,0 12,0
Total non-EU/EEA-countries
12,9 19,4 12,3 17,0 9,8 9,6 15,0 11,7 13,9 13,7 9,6 0,0 12,9
Total (without Belgium) 100,0 100,0 100,0 100,0 100,0 100,0 100,0 100,0 100,0 100,0 100,0 100,0 100,0
Source: Federal register of health practitioners

27
Tabel 18 Dentists in Belgium, by nationality and year of entry in RIZIV (the National Sickness and Disablement Insurance Institute), 1995 (and earlier) to 2005
Nationality and/or country of origin
1995 and
earlier
1996 1997 1998 1999 2000 2001 2002 2005 Un-known
Total
Belgium 7 245 184 161 168 169 152 152 133 3 193 8 560France 57 12 5 13 8 12 14 9 2 22 154Germany 16 1 0 0 2 2 0 2 0 0 23Italy 34 1 2 0 1 1 0 1 0 3 43The Netherlands 41 2 2 1 0 1 1 3 0 22 73Other EU-15 40 8 4 4 1 5 6 1 0 7 76Total EU-15 (without Belgium) 188 24 13 18 12 21 21 16 2 54 369
Total EU-10 0 0 0 0 2 0 0 0 0 1 3Other EU/EEA-countries 4 0 0 0 0 0 0 0 0 1 5Total EU/EEA-countries (without Belgium)
192 24 13 18 14 21 21 16 2 56 377
Morocco 1 0 0 1 1 0 0 0 0 0 3Other non-EU/EEA-countries 26 2 3 6 3 4 5 0 0 6 55Total non-EU/EEA-countries 27 2 3 7 4 4 5 0 0 6 58
Total (without Belgium) 219 26 16 25 18 25 26 16 2 62 435Total (including Belgium) 7 464 210 177 193 187 177 178 149 5 255 8 995
Source: Federal register of health practitioners

28
Table 19 Percentage of foreign dentists in Belgium, by nationality and year of entry in RIZIV, 1995 (and earlier) to 2005
Nationality and/or country of origin
1995 and
earlier
1996 1997 1998 1999 2000 2001 2002 2005 Un-known
Total
France 26,0 46,2 31,3 52,0 44,4 48,0 53,8 56,3 100,0 35,5 35,4Germany 7,3 3,8 0,0 0,0 11,1 8,0 0,0 12,5 0,0 0,0 5,3Italy 15,5 3,8 12,5 0,0 5,6 4,0 0,0 6,3 0,0 4,8 9,9The Netherlands 18,7 7,7 12,5 4,0 0,0 4,0 3,8 18,8 0,0 35,5 16,8Other EU-15 18,3 30,8 25,0 16,0 5,6 20,0 23,1 6,3 0,0 11,3 17,5Total EU-15 (without Belgium) 85,8 92,3 81,3 72,0 66,7 84,0 80,8 100,0 100,0 87,1 84,8
Total EU-10 0,0 0,0 0,0 0,0 11,1 0,0 0,0 0,0 0,0 1,6 0,7Other EU/EEA-countries 1,8 0,0 0,0 0,0 0,0 0,0 0,0 0,0 0,0 1,6 1,1Total EU/EEA-countries (without Belgium)
87,7 92,3 81,3 72,0 77,8 84,0 80,8 100,0 100,0 90,3 86,7
Morocco 0,5 0,0 0,0 4,0 5,6 0,0 0,0 0,0 0,0 0,0 0,7Other non-EU/EEA-countries 11,9 7,7 18,8 24,0 16,7 16,0 19,2 0,0 0,0 9,7 12,6Total non-EU/EEA-countries 12,3 7,7 18,8 28,0 22,2 16,0 19,2 0,0 0,0 9,7 13,3
Total (without Belgium) 100,0 100,0 100,0 100,0 100,0 100,0 100,0 100,0 100,0 100,0 100,0
Source: Federal register of health practitioners

29
5.2 Vacancies and shortages
Especially in Flanders an employment policy indicator has been created to identify the professions where vacancies seem to be more difficult to fill in (‘knelpuntberoepen’). This indicator helps to concentrate on efforts of training and it gives a signal to the general public and the education system where job opportunities occur. However it must be taken into account that those are relative difficulties to fill in those jobs, relative within a context of continued or even massive unemployment (especially in Wallonia and the Brussels Region). For that reason the degree of filling those vacancies does not differ so much between vacancies that are difficult to fill and the rest of the vacancies (see table 24). In Flanders, nurses, but also other caring personnel and educational personnel (the latter two categories that we discover frequently in the unemployment statistics), are already for a long time present in this list.

30
Table 20 “Knelpuntberoepen” in Flanders in 2004 and 2005, in number of vacancies and percentage
2004 2005 Number
of vacancies
Percen-tage
Number of
vacancies
Percen-tage
Nurses, other caring personnel, educators, of which:
2 904 7,1 2 695 6,8
Nurses 1 362 3,3 1 339 3,4 - Head nurse 74 0,2 78 0,2 - Certificate hospital nurse 736 1,8 643 1,6 - Graduate hospital nurse 254 0,6 279 0,7 - Certificate psychiatric nurse 32 0,1 30 0,1 - Graduate geriatric nurse 41 0,1 64 0,2 - Graduate psychiatric nurse 22 0,1 39 0,1 - Graduate nurse palliative care 8 0,0 9 0,0 - Graduate paediatric nurse 8 0,0 6 0,0 - Nurse urgent assistance 2 0,0 3 0,0 - Graduate midwife 7 0,0 145 0,4 - Home nurse 135 0,3 6 0,0 - Graduate social nurse 43 0,1 37 0,1
Other medical and paramedical personnel 233 0,6 376 1,0 - Occupational therapist / / 129 0,3 - Speech therapist 182 0,4 196 0,5 - Pharmaceutical assistant 51 0,1 51 0,1
Qualified caring personnel 860 2,1 752 1,9 - Qualified caretaker 666 1,6 553 1,4 - Child care worker 194 0,5 199 0,5
Educators 449 1,1 228 0,6 - Educator class 1 - remidial educationalist 242 0,6 180 0,5 - Educator class 2 177 0,4 / / - Monitor sheltered workshops 30 0,1 48 0,1
TOTAL ALL ‘KNELPUNTBEROEPEN’ 40 682 100,0 39 538 100,0
Source: VDAB – lijst knelpuntberoepen 2004 en 2005

31
Table 21 “Knelpuntberoepen” in Brussels in 2004, in number of vacancies and percentage
2004 Number of
vacancies Percentage
Nurses, other caring personnel, educators, of which: 149 3,6
Nurses 113 2,8 - Certificate hospital nurse 64 1,6 - Graduate hospital nurse 49 1,2
Qualified caring personnel 14 0,3 - Familial helper 14 0,3
Assistance personnel 22 0,5 - Consultant in the professional orientation 22 0,5
TOTAL ALL ‘KNELPUNTBEROEPEN’ 4 098 100,0
Source: Bron: BGDA - Analyse van de knelpuntberoepen in het Brussels Hoofdstedelijk Gewest in 2004
Table 22 “Knelpuntberoepen” in Wallonia in 2003, in number of vacancies and percentage
2004 Number of
vacancies Percentage
Nurses, other caring personnel, educators, of which: 1 048 6,4
Nurses 1 048 6,4 - Certificate hospital nurse 318 1,9 - Graduate hospital nurse 730 4,5
TOTAL ‘ALL KNELPUNTBEROEPEN’ 16 366 100,0
Source: Forem - Détection des fonctions critiques en Région Wallonne en 2003

32
Table 23 Number of vacancies and fulfilled vacancies1, in Flanders, in 2004
Occupation Vacancies AMI
Vacancies AMI +
jobmanager
Fulfilled AMI Vacancy rate (% fulfilled)
Total vacancies without temporary employment
99 987 148 492 81 426 81,4
Medical doctors/physicians 61 89 49 80,3 Dentists 3 6 3 100,0 Dental assistants Pharmacists 34 88 22 64,7 Pharmaceutical assistants 57 79 43 75,4 Nurses and midwifes 1 710 2 883 1 289 75,4 Clinical psychologists 31 59 27 87,1 Assistant in psychology 14 14 10 71,4 Psychotherapist 17 23 14 82,4 Physiotherapists 236 347 205 86,9 Occupational therapist 289 371 236 81,7 Speech therapist 274 334 190 69,3 Audiologist 6 6 2 33,3 Optometrist 5 5 6 120,0 Podiatrist 2 10 2 100,0
Source: VDAB STUDIEDIENST (Paul Poels: va4836.sas)
1 Excluding temporary employment.

33
Table 24 Number of vacancies and fulfilled vacancies, in Brussels, in 2004
Occupation Vacancies Fulfilled Vacancy rate (% fulfilled)
Total vacancies without temporary employment
911 669 73,4
Medical doctors/physicians 9 4 44,4 Dentists 1 0 0,0 Dental assistants Pharmacists 17 4 23,5 Pharmaceutical assistants 7 3 42,9 Nurses and midwifes 233 110 47,2 Caretaker 520 454 87,3 Clinical psychologists Assistant in psychology Psychotherapist Physiotherapists 22 14 63,6 Occupational therapist 22 18 81,8 Speech therapist 32 24 75,0 Audiologist 1 0 0,0 Optometrist Podiatrist
Source: ORBEM (Patricia Vroman)

34
Table 25 Number of vacancies and fulfilled vacancies, in Wallonia, in 2004
Occupation Vacancies AMI Fulfilled AMI* Vacancy rate (% fulfilled)*
Total vacancies without temporary employment
3 036 / /
Medical doctors/physicians 47 / / Dentists 4 / / Dental assistants / / Pharmacists / / Pharmaceutical assistants 86 / / Nurses and midwifes 1 229 / / Caretaker 562 / / Clinical psychologists 132 / / Assistant in psychology / / Psychotherapist / / Physiotherapists 180 / / Occupational therapist 76 / / Speech therapist / / Audiologist / / Optometrist / / Podiatrist 4 / / Advisory specialist in public health 154 / /
* No information available
Source: Forem - Nathalie Dechèvres

35
5.3 Recognition of foreign certificates
Tabel 26 Recognition of foreign certificates in Belgium and comparison with those in Federal Register of Health Practitioners
A. Foreign Medical Doctors - (2004)
Belgium (Dutch & French) Dutch – speaking French - speaking
Total M1 W2 Un-
known Total M1 W2 Un-
known Total M1 W2 Un-
known
2001 129 36 93 2002 128 39 89 2003 115 59 50 6 35 20 15 0 80 39 35 6 2004 138 68 58 12 31 17 11 3 107 51 47 9
Total 510 141 369
1 M=Men 2 W=Women
Source: calculations Prof. Deliège D, UCL, personal communication based on information “Cellule de reconnaissance” - Caroline Jadot and Federal Register of Health Practitioners
B General Practitioner and specialist
Belgium Dutch -speaking French -speaking Total Men Women Total Men Women Total Men Women
2000 35 11 24 2001 40 14 26 2002 42 12 30 2003 14 7 7 8 3 5 6 4 2 2004 30 17 13 9 8 1 21 9 12 Total 2000-2004- Dipl. UE recognized 161 54 107
Source: calculations Prof. Deliège D, UCL, personal communication based on information “Cellule de reconnaissance” - Caroline Jadot and Federal Register of Health Practitioners

36
C. Summary
Belgium Dutch -speaking French -speaking
EU in register 2004 121 31 89 Total 2000-2004 – Dipl. EU recognized 161 54 107 Total licensed 2001-04 510 141 369 Register versus EU : - medical doctor 23.5% 22% 24% - licensed 75,0% 57% 83%
Source: calculations Prof. Deliège D, UCL, personal communication based on information “Cellule de reconnaissance” - Caroline Jadot and Federal Register of Health Practitioners
Perhaps the numbers for the recent years illustrate that mobility, here shown by the request for recognition of foreign certificates, is higher if the education level is higher. For a labour market of some 28 000 active physicians, about 127 to 201 (it has been growing form 2003 up until 2005) recognitions are counted; for the nursing profession, now roughly 90 000 practising nurses or even 135 000 in the national register of health professionals, ‘only’ 107 to 150 are counted (excluding Belgian citizens – they still can be of foreign origin- asking for recognition of their foreign degree); about 77 000 caring professionals are active in 2000, from whom 32 to 35 are counted. The majority comes from the neighbour countries France and the Netherlands and to a lesser degree also from Germany, these are also the countries where people speak one of the official languages in Belgium. This confirms that language is an important barrier and condition for international migration in health professions.
The number of recognitions of foreign certificates is not representative for the total potential of foreign practitioners in Belgium since there is the phenomenon of huge participation of foreign students in the Belgium education system whose degrees will not need to be certified later on. For instance in the register of physiotherapist we discover a huge number of French nationality, although there is no indication that they are really practising the profession in Belgium.

37
Table 27 Influx foreign diplomas, approved by the unit “International Recognitions” of the FOD Public Health, 2003
Year 2003 Occupation
Nationality and/or country of origin
Medical doctors/
physicians Dentists Dental
assistants Pharma-
cists
Pharma-ceutical
assistants Nurses/
midwives Caretaker Psychol-
ogists
Physio-therapists &
assoc. professionals
Para-medics Total
Belgium 4 0 1 20 6 0 6 37 France 34 4 5 47 10 0 5 105 Germany 25 2 0 20 0 3 3 53 Italy 14 0 4 4 0 1 2 25 The Netherlands 18 4 3 15 12 7 2 61 Other EU-15 24 2 4 20 4 2 4 60 Total EU-15 (without Belgium)
115 12 16 106 26 13 16 304
Total EU-10 0 0 0 0 0 0 0 0 Other EU/EEA-countries 1 0 0 1 0 0 0 2 Total EU/EEA-countries (without Belgium)
116 12 16 107 26 13 16 306
Morocco 0 0 0 1 0 0 0 1 Other non-EU/EEA-countries
7 0 1 4 0 0 0 12
Total non-EU/EEA-countries
7 0 1 5 0 0 0 13
Total (without Belgium) 123 12 17 112 26 13 16 319 Total (including Belgium) 127 12 18 132 32 13 22 356
Source: Federal register of Health Practitioners

38
Table 28 Influx foreign diplomas, approved by the unit “International Recognitions” of the FOD Public Health, 2004
Year 2004 Occupation
Nationality and/or country of origin
Medical doctors/
physicians Dentists Dental
assistants Pharma-
cists
Pharma-ceutical
assistants Nurses/
midwives Caretaker Psychol-
ogists
Physio-therapists &
assoc. professionals
Para-medics Total
Belgium 11 1 0 30 10 2 3 57 France 45 3 9 81 31 4 9 182 Germany 28 6 0 37 2 2 2 77 Italy 32 2 0 0 1 0 2 37 The Netherlands 18 7 2 26 12 16 5 86 Other EU-15 22 5 3 14 4 2 4 54 Total EU-15 (without Belgium)
145 23 14 158 50 24 22 436
Total EU-10 5 2 0 1 1 1 0 10 Other EU/EEA-countries 5 0 0 5 0 1 0 11 Total EU/EEA-countries (without Belgium)
155 25 14 164 51 26 22 457
Morocco 0 0 0 0 0 0 0 0 Other non-EU/EEA-countries
3 0 1 1 0 0 0 5
Total non-EU/EEA-countries
3 0 1 1 0 0 0 5
Total (without Belgium) 158 25 15 165 51 26 22 462 Total (including Belgium) 169 26 15 195 61 28 25 519
Source: Federal Register of Health Practitioners

39
Table 29 Influx foreign diplomas, approved by the unit “International Recognitions” of the FOD Public Health, 2005
Year 2004 Occupation
Nationality and/or country of origin
Medical doctors/
physicians Dentists Dental
assistants Pharma-
cists
Pharma-ceutical
assistants Nurses/
midwives Caretaker Psychol-
ogists
Physio-therapists &
assoc. professionals
Para-medics Total
Belgium 10 0 1 31 2 4 1 49 France 20 5 10 68 24 7 11 145 Germany 28 0 0 19 1 0 0 48 Italy 29 1 1 1 0 1 0 33 The Netherlands 35 3 3 46 17 7 9 120 Other EU-15 35 2 1 16 2 4 1 61 Total EU-15 (without Belgium)
147 11 15 150 44 19 21 407
Total EU-10 32 2 1 1 4 1 1 42 Other EU/EEA-countries 5 0 0 3 1 2 1 12 Total EU/EEA-countries (without Belgium)
184 13 16 154 49 22 23 461
Morocco 0 0 1 0 0 0 0 1 Other non-EU/EEA-countries
7 0 2 7 1 0 0 17
Total non-EU/EEA-countries
7 0 3 7 1 0 0 18
Total (without Belgium) 191 13 19 161 50 22 23 479 Total (including Belgium) 201 13 20 192 52 26 24 528
Source: Federal Register of Health Practitioners

40 40
Nurses are included in a sectoral European regulation (Richtlijn 77/452/EEG, P. Schoukens, p. 40). In Belgium this only applies to the general responsible nurse (which does not include psychiatric nurse) and is not relevant for the second level nurses (ziekenhuisassistente) (Ibidem, p. 41). The recognition of specialized nurses is unclear: within the general diploma it is possible to follow a specialization, but beyond that degree it is also possible to follow an additional specialization (P. Schoukens, ibidem, p. 41). In addition there is also a difference in the Dutch speaking and French speaking education system (see Pacolet, Merckx fur further information). The regulation is applicable for as well salaried as independent work.
A recent manpower planning study for nurses in the Brussels region reveals there is a huge untapped reserve of female immigrants from the second generation who are confronted with high unemployment and lacking education opportunities (Pacolet J., Leroy X., Cattaert G., Coudron V. & Gobert M., 2005). Studies for the nursing and caring profession in Brussels illustrate that there are real opportunities for participation, integration and emancipation in those professions. Improving education trajectories with clear success rates are not only beneficiary to those persons themselves, but to society as a whole since it will help to cope with the growing needs for an adequate workforce for the health and caring sector. It speaks for itself that this participation in education is relevant for all health professions. This observation is in line with a recent general study on the participation of migrant workers in the Belgian labour market. Their share in total employment is one of the highest (8% of the total workforce according to the OECD (quoted in Okkerse, Termote, 2004)) but low compared to the relative workforce and differentiated enormously according to nationality. The employment ratio of women of Turkish and Moroccan origin amounts to 1/5 (only 10%!) of the indigenous employment ratio for female population (table 1 in Okkerse, Termote). The difference in educational level between the autochthonous and the migrant population is, within the exception of two categories, very similar to the indigenous population, because they are most of the time a EU-member. One category is better qualified (those from other non EU countries) and one, the Turkish and Moroccan community, is definitively lower qualified. One final observation confirms those partial observations: the sectoral distribution of the autochthones and migrant population is similar with some under representation of migrants from EU countries and other non EU countries in the service sector in which the health and social care is the most important (also other public services),

41 41
but the most under representative is the share of the Turkish and Moroccan migrants. This is certainly because of the combination of the very low labour market participation of those women and the overall lower labour market participation of this group. This will imply a major problem of under representation of those categories in the caring sector, but hopefully the policy of diversity will improve this. It will certainly have a positive effect to alleviate the real or alleged phenomenon of shortages.

42 42
6. EDUCATION AND TRAINING
The organisation of the education system is the responsibility of the Flemish, French and German-Speaking Communities. They also regulate the conditions of entry and the degrees provided by the education system. For some of the medical professions the ‘numerus clausus’ or ‘contigentering’ is also organised by them.
During recent years more detailed information became available about nationality and of those entering and leaving the education system.
Recent analysis of the medical manpower planning in Belgium for medical doctors, dentists, physiotherapists and nurses and midwifes should be responsive to the growing needs of the population. In the first three professions this implies that if the potential of over supply or over consumption is controlled, the control of medical school intake (or those licensed to practice) could be alleviated. The study of the nursing and caring profession illustrates how the last decennia the profession was characterised by a huge increase in employment, accommodated by, up until now, high or even increasing interest for those professions by the students. The education planning should further maintain this high level of attraction, avoiding rationing in education that could create shortages in the profession later on, which has been shown clearly in our study on the nursing profession. ‘Rationing in the education system creates its own shortage’, we could say paraphrasing ‘supply creates its own demand’.
It could also create unneeded or at some time even undesired mobility because of spill over effects in neighbouring countries. The EU and its free movement of people, students and workers and now its completion of the internal market for services create the maximum of mobility that was intended. But certain types of regulation could create undesired side effects. In order to control costs and plan the supply of health care, health care planning resulted in many countries to rationing in education places, some time with the intended effect of limiting the number of health professionals, but sometime also with the unintended effect of shortages (see above). Some students look even for education opportunities in other countries. Especially when the control of intake in medical schools does not exist in one country, students from other countries where this does exist will be attracted. Belgium is one of the countries that introduced the control of students for MD and dentists rather late, and was one of the last to introduce such a control for physiotherapy (not until 2005 where the first contingency was applicable). For nursing there are no limits in the education system, while it does exist in some

43 43
way in neighbouring countries as France and the Netherlands. This is for the moment extremely the case in physiotherapy, but also for nurses, in the French speaking part of our country. As showing in next table the education system was in the last years flood with students from France
For physiotherapists two trajectories exist in Flanders as well as in the French speaking system: a professional bachelor and master system in a college of higher education and a university degree of at a certain moment five and for the further future again four years (Pacolet, Coudron, Merckx, Cattaert, Peetermans, 2005, p. 24-25). The professional master remains important in as well the Flemish and French speaking community, even though the professional degree was reduced significantly for the first time due to the fact that certain universities stopped organizing this training. This was in view of the announced numerus clausus in physiotherapy. In the French speaking region the professional degree remains important but more than 75% of these students where foreign students (from France). They where found in the recognized certificates. The optimal education system was for more than two decades the subject of much discussion, but in 1999 the federal minister of health announced a numerus clausus as from 2003. Later it was reported to 2005. One of the main reasons for an apprehension for further over consumption, was attributed to the expectation of a significant high inflow of health professionals since the attraction for this profession had reached a historical top. The disappearance of some of those schools in Flanders can be considered as some self regulation. In Wallonia it did not occur, but the bachelor programmes were less present.
For nurses the presence of foreign students is also remarkable in the French speaking educational system. In 2000 Xavier e.a. estimates that 14% of the diplomas of the bachelor degree and 52% of the ‘certificats’ where obtained by foreigners, of which for the latter group 32,9% where members of the EU but non-resident (most of them from France), while from the non-EU foreigners, most of them were resident and probably part of the foreign community (they are of course also within the Belgian student persons of foreign origin). Remark that both groups are attracted by the lower qualified educational trajectory. For the foreign non EU residents in Brussels we observe a greater barrier on all levels. For those coming for France, this is not so evident. Perhaps they choose the easier way, which is also the case for physiotherapy, but any way they choose a way with more chance of success, or perhaps the equivalent trajectory does not exist in their country (Xavier, p. 25). This situation is even more pronounced in Brussels

44 44
(Pacolet, Leroy, Cattaert, Coudron, Gobert, 2005). This situation did not change since then. In 2005 almost half of the students in the vocational training system (‘certificate’) are coming form France. For the moment the Walloon government is negotiating with France to limit this number of students. One conclusion is also clear: this internal migration of students can occur because of restrictions in the education system in the home country. It is of course, as we mentioned already in our previous European study on manpower problems, completely inefficient to mention on one hand shortages, and on the other hand organize limitations in access to the educational system.
The free movement of workers interferes also with the national strategies on contingency of doctors or other professions. It would imply that there is a limit to enter the profession for the inhabitants, while foreign practitioners could not be prohibited to enter the field. On the other hand a contingent of national practitioners, based on national planning and confronted with outward migration, could be confronted with shortages.
Something similar existed in Flanders for the physicians2.
There is also limited information on the emigration of Belgian medical professionals. The last years some 180 physician left Belgium for France, and also from the Dutch speaking side at a certain moment there was a growing emigration towards the Netherlands. Nevertheless, the number of those practitioners remained limited. Language, numerus clausus and migration are recently creating unexpected new problems. In Brussels and the Dutch speaking region around, problems are signalled for medical urgency units (MUG) where the medical staff from Brussels hospitals is sometime, because of numerus clausus, a foreign student specialising in Belgium, but not knowing the Dutch language (what of course can also be the case with staff from the French speaking community). The Health inspection for Brussels and Flemish Brabant (Reginald Moreels, a former state secretary) is
2 This interest from the Netherlands for our education system in the Dutch speaking part is
spread over the complete educational system. From the primary school already there is a growing interest for school participation, another reason of interest for the secondary school system is the attractiveness of technical and vocational schools (‘technisch en beroepsonderwijs’). This creates a growing concern of growing costs for Flanders to finance those Dutch pupils and a European compensation fund is proposed in Flanders. For the higher education, the flows seems to be more balanced and there are agreements between Flanders and The Netherlands WWI in Nieuwsblad, 14 april 2006, see also Vlaams Parlement, Van Baelen, Vanderpoorten in week nadien.

45 45
asking that measures are taken to avoid this, for example requiring also the foreign doctors in training to follow a language course Dutch of one or two weeks (De Standaard, 13 april 2004).

46 46
7. ANY OTHER RELEVANT ASPECTS
In the French speaking community, there is a flood of students from France in several medical professions and the veterinary discipline. Following figures illustrate this situation. For that reason the Minister of higher education from the French Community proposed in February 2006 (Dossier de Presse Marie-Dominique Simonet, 2006), within the possibilities of the European free movement of persons to guarantee a democratic and large access to a system of qualification of high degree, (P. 5) to limit the number of foreign students to 30%. Even with this restriction they qualify Belgium as an education system with a high degree of foreign students. The reason of the presence of those foreign students is mostly because of restrictions in the home country, what makes it an exporting of the need to train adequately their workforce. So the French speaking region in Belgium is confronted with a relatively large number of French speaking students from France which provides a huge inflow, which is similar to the situation that Austria was confronted with because of the inflow from Germany3. Those proposals have been discussed with the authorities in France (La Libre Belgique, 29/09/2005), and by the way are not without discussion in Wallonia itself because some schools (Doornik for instance) are expecting an enormous decline in the number of their students, putting the viability of the institutions at risk and therefore implying a loss of jobs in those institutions (Persoverzicht KU Leuven, 26 february 2006).
3 Austria excluded foreign EU students from medical studies if they were in their home country
confronted with a numerus clausus, as was the case in Germany. The Court of Justice cancelled this regulation in July 2005, leading to a spectacular inflow of German students in Austria. The French Community is taking the arguments of the decision of the Court of Justice into account to propose its own regulation. Dossier de presse 3 februari 2006).

47 47
8. CONCLUSION
Belgium is not sheltered against the discussion about shortages in health professionals on one hand and plethora and so need to control the entrance in the medical schools on the other hand. The policy to control entrance in the education system of medical doctors, dentists and physiotherapists is of recent date, and is going to have its effect from now on. The numerus clausus organised in neighbouring countries created a greater inflow of foreign students and caused demands for applying the supply control also on foreign students in Belgium, or limit them further in those education system (physiotherapy, nursing) where their relative importance becomes problematic for a proper organising of education for the local population.
The migration flows are however limited, as can be expected because of linguistic barriers to entry. Those asking recognition of their foreign certificate are most of the time coming form France, the Netherlands and to a lesser degree from Germany. The lower the level of the health professional, the smaller those groups are. For the nursing profession, where there is a public discourse about the present or future danger of shortages, the migration flow remains limited and does not seem to be a significant factor in avoiding shortages. Several recent manpower planning studies for those professionals indicate furthermore that Belgium succeeds fairly well in providing new practitioners for those professions because of historical high levels of attraction of those studies. Further and improved participation of migrant students could increase the success. The policy should further try to maintain a broad and attractive education system in health professions to accommodate further needs. Since rationing and lack of supply in the national educational system might provoke shortages or international mobility and migration , those side-effects should be taken into account when designing a supply policy for health professions. Migration of foreign health professionals seems to be in some cases undesirable, unrealistic and unfeasible. It is undesirable if it would imply that there is a brain drain of qualified workers from developing countries that will need those professionals to establish a decent health care system, it is unrealistic when it concerns migration flows from developed and neighbouring countries which are confronted with coming shortages, sometimes creating those shortages themselves by rationing in the education system and the supply, and trying to export their shortage or rationing in education expenditures. And finally it seems to be

48 48
unfeasible when it is observed how for instance language barriers remain to exist, and other reasons restraining people from migration.

49 49
ANNEXES
Annex 1: Institutions and organisations involved in managing migration with regard to the health sector.
Provinciale Geneeskundige Commissies Internationale erkenningen Diensten Arbeidsbemiddeling Gewesten Municipalities Dienst Vreemdelingen FOD Binnenlandse Zaken RSVZ- INASTI FOD WASO en TSW RIZIV- INAMI, Dienst voor geneeskundige verzorging FOD Volksgezondheid, Veiligheid van de voedselketen en Leefmilieu, DG Basisgezondheidszorg, Dienst Organisatie en Planning, Cel planning FOD Volksgezondheid, Veiligheid van de voedselketen en Leefmilieu, DG Basisgezondheidszorg, Dienst Organisatie en Planning, Cel kadaster van gezondheidsberoepen FOD Volksgezondheid, Veiligheid van de voedselketen en Leefmilieu, DG Basisgezondheidszorg, Dienst Erkenning Gezondheidszorgberopen, Cel Internationale Zaken
Toekennen beroepskaarten voor vreemdelingen De FOD Economie, KMO, Middenstand en Energie, Algemene Directie KMO- beleid Dienst”beroepskaarten”
WTC III, Simon Bolivarlaan 30 te 1000 BRUSSEL
Tel.: 02/208 51 04 of 208 51 29
Fax: 02/ 208 51 47
Annex 2: An annotated bibliography in accordance with the documentation structure of the EMN.
Annex 3: Relevant statistics.

Table 30 Foreign certificates, approved by the unit “International Recognitions” of the FOD Public Health in 2003
Year 2003 Occupation
Nationality and/or country of origin
Medical doctors/ physicians Dentists
Dental assistants Pharmacists
Pharma-ceutical
assistants Nurses/
midwives Psycho-logists
Physiotherapists & assoc.
Professionals Para-
medics Total
Austria 0 0 0 1 0 0 1Belgium 4 0 1 20 0 6 31Denmark 0 0 0 0 1 0 1Finland 1 0 0 3 0 1 5France 34 4 5 47 0 5 95Germany 25 2 0 20 3 3 53Greece 11 1 0 0 0 0 12Ireland 1 0 0 1 0 0 2Italy 14 0 4 4 1 2 25Luxembourg 0 0 0 1 0 0 1The Netherlands 18 4 3 15 7 2 49Portugal 0 0 1 0 0 0 1Spain 2 0 3 12 1 1 19Sweden 1 1 0 0 0 0 2United Kingdom 8 0 0 2 0 2 12Total EU-15 119 12 0 17 0 126 0 13 22 309Slovakia 0 0 0 0 0 0 0Slovenia 0 0 0 0 0 0 0Poland 0 0 0 0 0 0 0Lithuania 0 0 0 0 0 0 0Latvia 0 0 0 0 0 0 0Malta 0 0 0 0 0 0 0Cyprus 0 0 0 0 0 0 0Czech Republic 0 0 0 0 0 0 0Estonia 0 0 0 0 0 0 0Hongary 0 0 0 0 0 0 0

51 51
Total EU-10 0 0 0 0 0 0 0 0 0 0Norway 0 0 0 0 0 0 0Iceland 0 0 0 0 0 0 0Liechtenstein 0 0 0 0 0 0 0Switzerland 1 0 0 1 0 0 2Total EU/EEA 120 12 0 17 0 127 0 13 22 311Cameroon 1 0 1 1 0 0 3Canada 1 0 0 0 0 0 1Congo 1 0 0 0 0 0 1Cuba 1 0 0 0 0 0 1Philippines 0 0 0 1 0 0 1Iran 0 0 0 1 0 0 1Morocco 0 0 0 1 0 0 1Romania 2 0 0 0 0 0 2Tunisia 0 0 0 1 0 0 1U.S.A. 1 0 0 0 0 0 1Total non-EU/EEA 7 0 0 1 0 5 0 0 0 13
Source: Unit “International Recognitions” FOD Public Health

52 52
Table 31 Foreign certificates, approved by the unit “International Recognitions” of the FOD Public Health in 2004
Year 2004 Occupation
Nationality and/or country of origin
Medical doctors/ physicians Dentists
Dental assistants Pharmacists
Pharma-ceutical
assistants Nurses/
midwives Psycho-logists
Physiotherapists & assoc.
Professionals Para-
medics Total
Austria 2 0 0 0 1 0 3Belgium 11 1 0 30 2 3 47Denmark 0 0 0 0 0 0 0Finland 1 1 0 2 0 0 4France 45 3 9 81 4 9 151Germany 28 6 0 37 2 2 75Greece 7 3 0 0 0 0 10Ireland 0 0 0 0 0 0 0Italy 32 2 0 0 0 2 36Luxembourg 0 0 0 0 0 0 0The Netherlands 18 7 2 26 16 5 74 Portugal 3 0 0 2 0 0 5Spain 6 0 3 5 1 3 18Sweden 1 1 0 0 0 0 2United Kingdom 2 0 0 5 0 1 8 Total EU-15 156 24 0 14 0 188 0 26 25 433 Slovakia 1 0 0 0 0 0 1Slovenia 0 0 0 0 0 0 0Poland 2 2 0 0 1 0 5Lithuania 0 0 0 0 0 0 0Latvia 0 0 0 0 0 0 0Malta 0 0 0 0 0 0 0Cyprus 0 0 0 0 0 0 0Czech Republic 1 0 0 1 0 0 2 Estonia 0 0 0 0 0 0 0Hungary 1 0 0 0 0 0 1

53 53
Total EU-10 5 2 0 0 0 1 0 1 0 9 Norway 0 0 0 1 0 0 1Iceland 0 0 0 0 0 0 0Liechtenstein 0 0 0 0 0 0 0Switzerland 5 0 0 4 1 0 10Total EU/EEA 166 26 0 14 0 194 0 28 25 453 Colombia 1 0 0 0 0 0 1The Dominican Republic
1 0 0 0 0 0 1
Nigeria 0 0 1 0 0 0 1Philippines 0 0 0 1 0 0 1Venezuela 1 0 0 0 0 0 1Total non-EU/EEA
3 0 0 1 0 1 0 0 0 5
Source: Unit “International Recognitions” FOD Public Health

54 54
Table 32 Foreign certificates, approved by the unit “International Recognitions” of the FOD Public Health in 2005
Year 2005 Occupation Nationality and/or country of origin
Medical doctors/ physicians Dentists
Dental assistants Pharmacists
Pharma-ceutical
assistants Nurses/
midwives Psycho-logists
Physiotherapists & assoc.
Professionals Para-
medics Total
Austria 8 0 0 2 0 0 10Belgium 10 0 1 31 4 1 47Denmark 0 1 0 2 0 0 3Finland 2 0 0 0 0 0 2France 20 5 10 68 7 11 121Germany 28 0 0 19 0 0 47Greece 9 0 0 0 0 0 9Ireland 0 0 0 2 0 0 2Italy 29 1 1 1 1 0 33Luxembourg 0 0 0 0 0 0 0The Netherlands 35 3 3 46 7 9 103 Portugal 1 1 0 1 0 0 3Spain 8 0 1 2 3 0 14Sweden 1 0 0 3 0 0 4United Kingdom
5 0 0 3 1 0 9
Total EU-15 156 11 0 16 0 180 0 23 21 407 Slovakia 3 0 1 0 0 0 4Slovenia 0 0 0 0 0 0 0Poland 12 0 0 1 0 1 14Lithuania 2 1 0 0 0 0 3Latvia 0 0 0 0 0 0 0Malta 0 0 0 0 0 0 0Cyprus 0 0 0 0 0 0 0Czech Republic 3 0 0 0 1 0 4Estonia 0 0 0 0 0 0 0

55 55
Hungary 12 1 0 0 0 0 13Total EU-10 32 2 0 1 0 1 0 1 1 38Norway 1 0 0 0 0 0 1Iceland 0 0 0 2 0 0 2Liechtenstein 0 0 0 0 0 0 0Switzerland 4 0 0 1 2 1 8Total EU/EEA 193 13 0 17 0 184 0 26 23 456 Benin 1 0 0 0 0 0 1Bolivia 1 0 0 0 0 0 1Brazil 2 0 0 0 0 0 2Cameroon 0 0 0 1 0 0 1Congo 0 0 1 0 0 0 1India 0 0 0 1 0 0 1Iraq 1 0 0 0 0 0 1Morocco 0 0 1 0 0 0 1Russia 0 0 1 0 0 0 1Turkey 0 0 0 1 0 0 1USA 0 0 0 1 0 0 1Philippines 0 0 0 3 0 0 3Venezuela 1 0 0 0 0 0 1Total non-EU/EEA
6 0 0 3 0 7 0 0 0 16
Belgium and France
0 0 0 1 0 1 2
Germany and France
1 0 0 0 0 0 1
Missing 1 0 0 0 0 0 1
Source: Unit “International Recognitions” FOD Public Health

56 56
Table 33 Migrant workers employed in ISCO occupation in the Health Sector in 2004 by nationality including totals for EU-15, the new member states (EU-10), EU/EEA & non-EU/EEA.
Year 2005 Occupation Nationality and/or country of origin
Medical doctors/
physicians DentistsDental
assistants Pharmacists Pharmaceutical
assistants Nurses/
midwives Psycho-logists
Physiotherapists & assoc. Professionals Total
Austria 15 1 5 Belgium 44 455 8 560 120 004 27 564 Denmark 9 17 1 2 Finland 9 2 6 6 France 930 154 831 759 Germany 302 23 107 174 Greece 133 20 46 15 Ireland 8 2 10 3 Italy 33 9 43 1 165 44 Luxembourg 177 8 52 54 The Netherlands
1 118 73 327 222
Portugal 45 3 37 6 Spain 233 12 187 22 Sweden 17 6 1 5 United Kingdom
74 6 50 10
Total EU-15 47 864 8 929 0 0 0 122 825 0 0 28 891 Total EU-15 (without Belgium)
3 409 369 0 0 0 2 821 0 0 1 327
Slovakia 6 2 Slovenia Poland 21 2 10 27 Lithuania 3 1 Latvia

57 57
Malta Cyprus Czech Republic 7 6 2 Estonia Hongary 7 1 7 5 Total EU-10 44 3 0 0 0 0 43 0 17 Norway 5 3 4 11 Iceland Liechtenstein Switzerland 22 2 18 42 Total EU/EEA 2847 935 8 937 0 0 0 122 890 0 0 961 Total EU/EEA (without Belgium)
3 480 377 0 0 0 2 886 0 0 1 397
Albania 64 2 Algeria 4 3 105 15 Brazil 1 1 3 Burundi 1 1 10 6 Cameroon 4 11 20 Canada 96 12 7 11 Chile 13 14 15 Colombia 5 2 12 Congo 2 88 7 Philippines 77 3 10 44 Gabon 1 2 Indonesia 3 3 3 Iran 29 7 7 Israel 23 9 2 27 Ivory Coast 9 3 4 11 Lebanon 1 2 9 Mauritius 44 13 15 21 Morocco 7 510 1 Romania 35 3 24 73 Rwanda 5 25 3

58 58
Syria 3 0 27 Tunisia 1 1 17 4 U.S.A. 15 1 6 22 Other African countries
33 5 21 12
Other American countries
50 1 42 29
Other Asian countries
22 122 25
Other European countries
27 2 16 57
Total non-EU/EEA
5 1 1 129 3
Missing 515 58 0 0 0 15 366 0 0 471 Displaces persons
920 74 2 4 703
UN-refugee 44
Total: Federal Register of Health Practitioners

59 59
Bibliography
Pacolet J., Merckx S., (2006), Managed Migration and the Labour Market The Health Sector. The Belgian case, Report prepared for the European Migration Network Small Scale Study II, HIVA, 2006
Pacolet J., Merckx S., (2006), Het planningmodel kinesitherapie: vraag en aanbod voor de totale beroepsgroep Federale Overheidsdienst Volksgezondheid, Veiligheid van de Voedselketen en Leefmilieu
Jozef Pacolet, Sigrid Merckx (2006), Het planningmodel verpleegkunde en vroedkunde: vraag en aanbod, Federale Overheidsdienst Volksgezondheid, Veiligheid van de Voedselketen en Leefmilieu
Pacolet J., Cattaert G. , Coudron V., Peetermans A., S. Merckx (2005), ‘Het planningmodel kinesitherapie- The planning model physiotherapy, FOD Volksgezondheid Planningcel Planningcommissie en HIVA KULeuven.
Pacolet J., Deliège D., Cattaert G. & Artoisenet C. (2004), Manpowerplanning voor gezondheidsberoepen. Ressources humaines en santé. Offre, demande et 'besoins' actuellement et à l'avenir, HIVA-K.U.Leuven, SESA-UCL, Leuven/Brussel.( also synthesis report available in Dutch and French)
Schneider M., Pacolet J. & Van der Velden L. (2004), HLA. Implementing the concept of health care manpower in member states on a prototype basis, Basys/Hiva/Nivel, Augsburg/Leuven/Utrecht.
Pacolet J., Leroy X., Cattaert G., Coudron V. (2004), Plus est en vous herbekeken: Manpowerplanning in de zorgsector en de socioculturele sector, Deel 6. Synthese voor de zorgsector 1995-2020 in België, HIVA-K.U.Leuven/SESA-UCL, Leuven/Brussel.
Leroy X., Pacolet J., Cattaert G., Coudron V. (2004), Plus est en vous révisé. Manpower planning dans le champ de la santé et de l’aide sociale, Synthèse pour la Belgique, 1995-2020, SESA-UCL/HIVA-K.U.Leuven, Brussel /Leuven.

60 60
Pacolet J., Leroy X., Cattaert G., Coudron V., Gobert M. (2004), Plus est en vous driemaal. Manpowerplanning in de zorgsector in Brussel – Plus est en vous 3ième. Manpower planning dans le champ de la santé à Bruxelles, HIVA-K.U.Leuven/SESA-UCL, Leuven/Brussel
Pacolet J., Leroy X., Cattaert G., Coudron V., Gobert M. (2004), Plus est en vous herbekeken: Manpowerplanning in de zorgsector en de socioculturele sector, Deel 6. Synthese voor de zorgsector 1995-2020 in België, HIVA-K.U.Leuven/SESA-UCL, Leuven/Brussel.
Pacolet J., Van De Putte I (2004), Zorgplanning voor voorzieningen voor personen met een handicap in Oost-Vlaanderen ,HIVA-K.U.Leuven, Leuven.
Pacolet J., Van De Putte I., Marchal A., Cattaert G., Degreef T., Verbrugghe K., Dewilde S (2002), Plus est en vous herbekeken. Manpowerplanning in de zorgsector en de socioculturele sector, Deel 2. De vraag naar zorgberoepen in de Vlaamse Gemeenschap, 1995-2000, HIVA-K.U.Leuven, Leuven.
Pacolet J., Van De Putte I., Cattaert G., Coudron V., Degreef T., Verbrugghe K. (2002), Plus est en vous herbekeken. Manpowerplanning in de zorgsector en de socioculturele sector, Deel 3. Prognose tot 2005 en scenario’s tot 2020 voor de zorgsector in de Vlaamse Gemeenschap, HIVA-K.U.Leuven, Leuven.
Pacolet J., Van De Putte I., Cattaert G., Coudron V. (2002), Plus est en vous herbekeken. Manpowerplanning in de zorgsector en de socioculturele sector, Deel 5. Synthese voor de zorgsector in de Vlaamse Gemeenschap, 1995-2020, HIVA-K.U.Leuven, Leuven.
Pacolet J., Cattaert G. & Coudron V. (2002), Plus est en vous herbekeken. Manpowerplanning in de zorgsector en de socioculturele sector. De kinesitherapie in Vlaanderen 1995-2020, HIVA-K.U.Leuven, Leuven.
Pacolet J., Versieck K., Bouten R., Deschamps M. (1998), The nursing profession: issues of demand, status and working conditions in OECD, The future of female-dominated occupations.

61 61
OECD, The Nursing Profession: Issues of Demand, Status and Working Conditions, 1998, in OECD, The Future of Female – dominated occupations, OECD, 1998.
Pacolet J., Versieck K., Bouten R., Deschamps M., The Nursing and Midwifery Profession in OECD-Coun-tries, Research Paper, HIVA, 1998.
Versieck K., Bouten R. & Pacolet J., Manpower problems in the nursing/midwifery profession in the EC. Country-comparative report, HIVA-K.U.Leuven, Leuven, 1995.
Versieck K., Bouten R. & Pacolet J., Employment problems in the field of nurses and midwifes in the EC, summary and political recommandations, HIVA-K.U.Leuven, Leuven, 1995.
Versieck K., Bouten R. & Pacolet J., Employment problems for nurses in Belgium and the EC, HIVA-K.U.Leuven, Leuven, 1995.
Versieck K., Bouten R. & Pacolet J., Personalprobleme bei Krankenpflegern und Hebammen in der EG. Zusammenfassung und Empfehlungen zum Betreiben einer Politik, HIVA-K.U.Leuven, Leuven, 1995.
Versieck K., Bouten R. & Pacolet J., Manpower Problems in the Nursing/Midwifery Profession in the EC. Country-comparative report, HIVA-K.U.Leuven, Leuven, 1995.