management accounting (costing)mfmamirror.s3.amazonaws.com/regulationsandgazettes... · • direct...
TRANSCRIPT

Management Accounting(Costing)

Management Accounting• Management Accounting - Industrial revolution
Production cost per unitManagement activities
• Costs - Direct and indirectTrading servicesTariff calculation
• Costing methodology - ABCInternal billingDepartmental charges
• Prerequisites - PolicyBase cost and Formulas
2

Financial and Management Accounting
3
Accounting:RecordingEstimatingOrganisingSummarising
Man. Accounting:Reporting - internalFinancial decisionsRelevance for purposeTimeline is requiredSegment reportingNot GRAP requirementNon-mandatory
Fin. Accounting:Reporting - externalFinancial consequencesObjective, verifiablePreciseSummarised for reportsGRAP complaintMandatory

Primary Transaction – Bulk merge from payroll March 2016
4
Description Project Function Item Fund Costing Region AmountDr Employee related cost: March 2016 Municipal Running
CostAsset Management Basic Salary and
WagesProperty Rates
Default Administrative or Head Office
3 000,00 Employee related cost: March 2016 Municipal Running
CostAsset Management Group Life Insurance Property
RatesDefault Administrative or
Head Office
75,00 Employee related cost: March 2016 Municipal Running
CostAsset Management Medical Property
RatesDefault Administrative or
Head Office
210,00 Employee related cost: March 2016 Municipal Running
CostAsset Management Pension Property
RatesDefault Administrative or
Head Office
270,00 Employee related cost: March 2016 Municipal Running
CostAsset Management Unemployment
InsuranceProperty Rates
Default Administrative or Head Office
30,00 Cr Payment of Employee related cost:
March 2016Municipal
Running CostAsset Management Bank Account:
WithdrawalsProperty
RatesDefault Administrative or
Head Office
-3 585,00 Bulk merge file from payroll system for the month of March 2016. (We pretend that all monies is immediately paid and do not use the clearing accounts for this example -

Secondary Costing Transaction – Departmental charges at a %
5
Description Project Function Item Fund Costing Region Amount
Own Allocation
formulaDr Relocation of costs Default Community Halls and
FacilitiesDefault Default Charges: Departmental
Charges: Asset management
No regional Identifier
28,68 1%Relocation of costs Default Fire Fighting and
ProtectionDefault Default Charges: Departmental
Charges: Asset management
No regional Identifier
28,68 1%Relocation of costs Default Waste Management Default Default Charges: Departmental
Charges: Asset management
No regional Identifier
573,60 20%Relocation of costs Default Waste Water
ManagementDefault Default Charges: Departmental
Charges: Asset management
No regional Identifier
516,24 18%Relocation of costs Default Water Default Default Charges: Departmental
Charges: Asset management
No regional Identifier
860,40 30%Relocation of costs Default Electricity Default Default Charges: Departmental
Charges: Asset management
No regional Identifier
860,40 30%Cr Relocation of Costs Default Asset Management Default Default Recoveries :
Departmental Charges: Asset management
No regional Identifier
-2 868,00 Departmental Charges at a % allocation -

Costing Segment:Activity Based Costing
Types of Costs
• Direct Costs- can be traced directly to one output e.g. number of water kilolitres per household.
• Indirect Costs- in benefit a wide number of outputs e.g. maintenance costs incurred for a pool vehicle.
• Since indirect costs can not be traced and allocated directly to a single output, different methods can be used. One of the methods would be Activity Based Costing (ABC).
• The method requires an identification of activity pool and a cost driver for each activity.
7

Allocation of indirect costs
8
Vehicle maintenance costs
Water consumption
Office lease expense
Cost per kilometre
Cost per kilolitre
Cost per square metre
INDIRECT/ OVERHEAD
COSTS
Activity cost pools Activity cost drivers

Activity Based Costing
9
Cost of Vehicle Maintenance per annumUsage Kilometre per Department (km) Activity cost pools (R)Finance 5,000 Service 5,360 Corporate Services 15,000 Depreciation 40,000 Technical Services 5,000 Insurance 16,800 Community Services 5,000 Licencing 300 Planning and Development 5,000 Fuel 33,600 Municipal Manager 5,000 Breakdown 8,000
Tyres 4,000 40,000 108,060
Cost Driver:Cost per kilometer (R108060/40000km)- Charge Out Rate R2.70
• Tracing resource consumption and allocating costs to an activity based on the number of final outputs.
• Example: space used for office rental, kilometres used on a pool vehicle, number of attendees for training and number of events held.
Costing Segment:Internal Billing

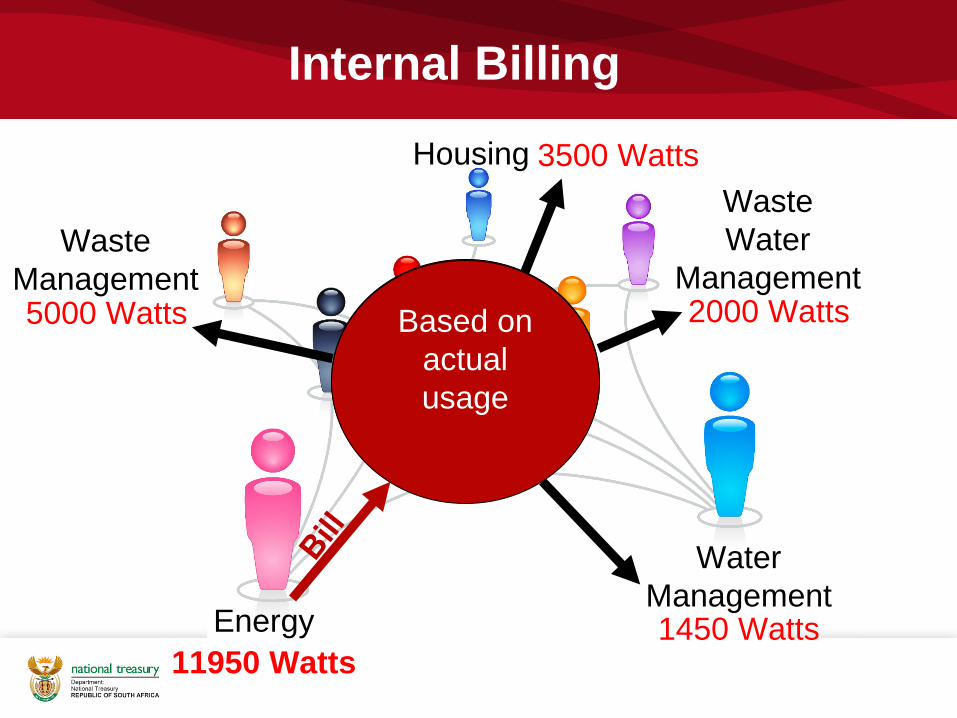
Internal BillingMetered costThe recovery of services and products that are consumed internally by other departments.Example: Electricity consumed by the Water department.
If invoiced, then the billing is considered to be a primary transaction – costing segment is not used
The costing segment is used to recover these costs in the absence of an invoice and will result in a secondary cost which is a below the line cost.Below the line costs are not included in the AFS but are elements of management accounts

Internal Billing
Waste Management
Waste Water
Management
WaterManagement
Energy
Housing
11950 Watts
Total electricity used per
meter readings
This expense need to be billed
to the various departments that
used the electricity
Internal Billing
Waste Management
Waste Water
Management
WaterManagement
Energy
Housing
5000 Watts
1450 Watts
2000 Watts
3500 Watts
As per meters in
each department
11950 Watts
Based on actual usage

Costing Segment:Departmental Charges

Departmental Charges
The distribution of primary costs via a pro-rata approach. All distributed costs results in secondary ,below the line costs
Examples include the distribution of overheads like office rental, ICT costs and security costs. The cost pool can be apportioned by applying a percentage formula.
Cost Drivers- Number of individuals per department- Floor space per department- Any other appropriate activity driver

30/150 = 20%
20% of R450 000 = R90 000
How should we allocate
this expense?
Through an appropriate
activity driver eg. Number of employees per
department
40+20+15+30+35 = 150
employees in total
Audit FeesThus 60/150 =
40%
40% of R450 000 = 180 000
15/150 = 10%
10% of R450 000 = R45 000
Departmental Allocation
Waste Management
Waste Water
Management
WaterManagement
Finance and Administration
Housing
60 employees
30 employees
15 employees
15 employees
R450 000
30 employees

mSCOA Practical Examples
Practical examples
18
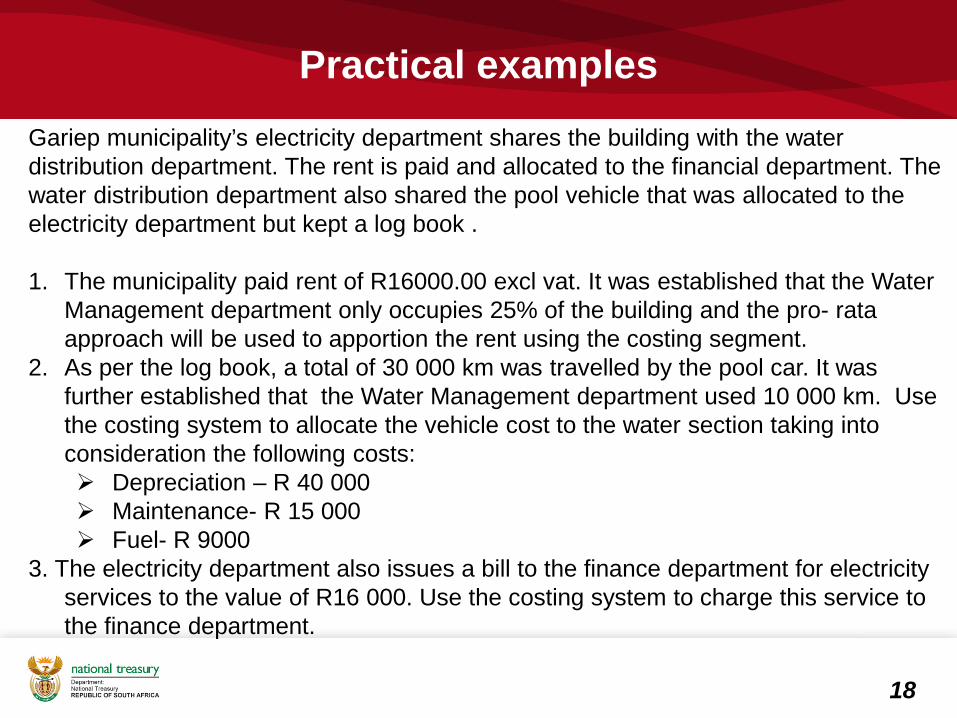
Gariep municipality’s electricity department shares the building with the water distribution department. The rent is paid and allocated to the financial department. The water distribution department also shared the pool vehicle that was allocated to the electricity department but kept a log book .
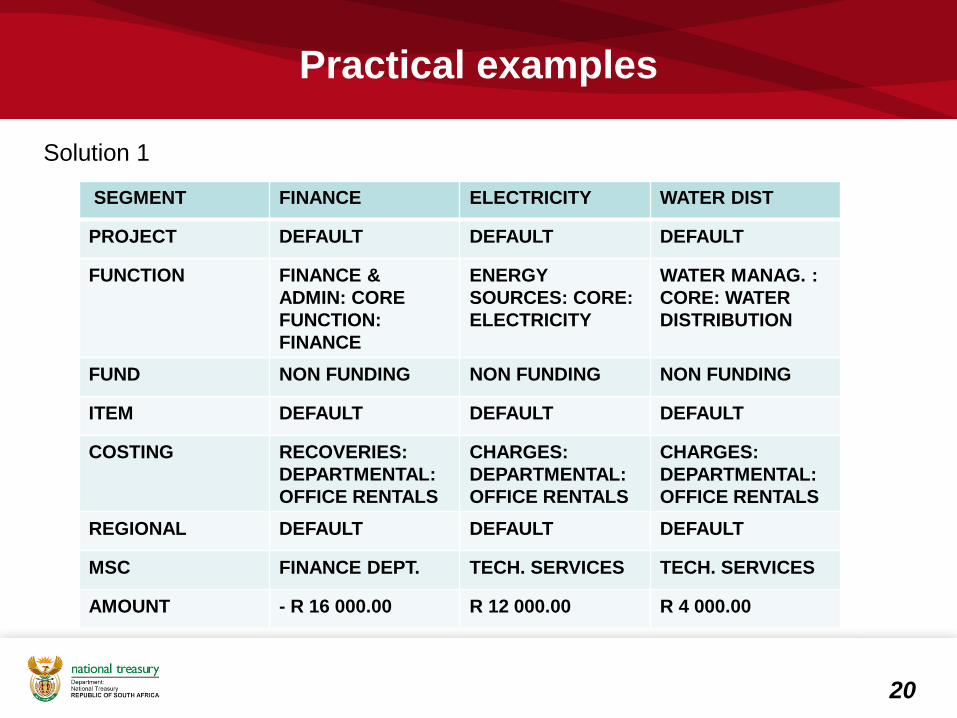
1. The municipality paid rent of R16000.00 excl vat. It was established that the Water Management department only occupies 25% of the building and the pro- rata approach will be used to apportion the rent using the costing segment.
2. As per the log book, a total of 30 000 km was travelled by the pool car. It was further established that the Water Management department used 10 000 km. Use the costing system to allocate the vehicle cost to the water section taking into consideration the following costs: Depreciation – R 40 000 Maintenance- R 15 000 Fuel- R 9000
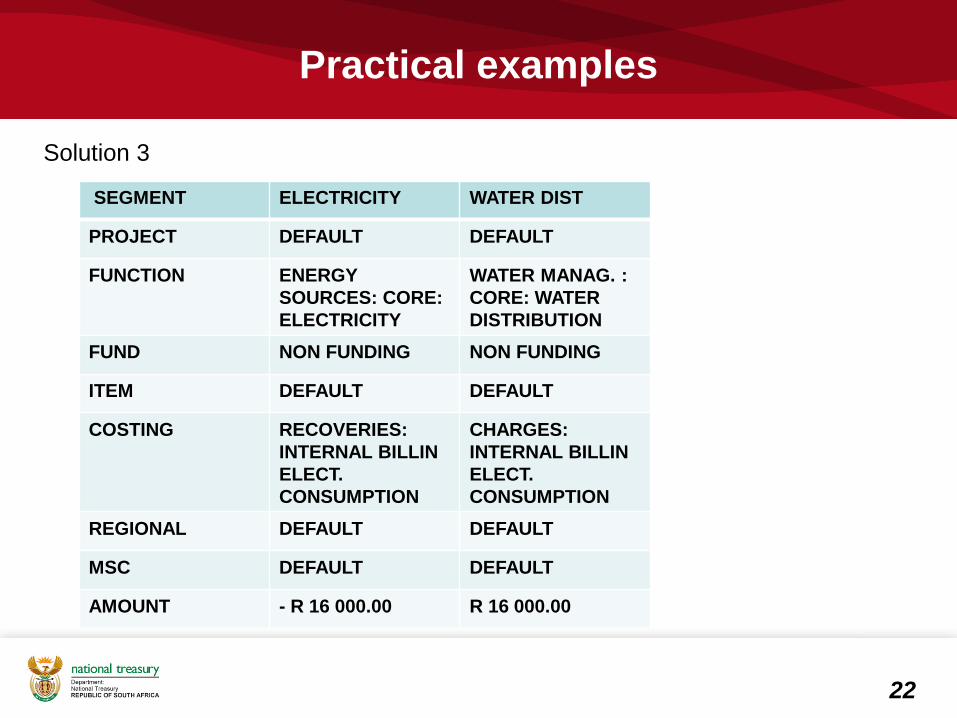
3. The electricity department also issues a bill to the finance department for electricity services to the value of R16 000. Use the costing system to charge this service to the finance department.

Practical examples
19
Solution 1The rent ( R16000) is split by percentage:Water Distribution: 25% - R 4 000Electricity: 75% - R 12 000
Solution 2:Cost Pool = 40 000 + 9 000 + 5 000 = 54 000Cost driver = cost/total mileage = 54 000 / 30 000 KM = R1.80 per KMCost to Water distribution: = 10 000 x R1.80 = R18 000.00
Solution 3Electricity Cost billed to Water distribution= R 16 000
Practical examples
20
Solution 1
SEGMENT FINANCE ELECTRICITY WATER DIST
PROJECT DEFAULT DEFAULT DEFAULT
FUNCTION FINANCE & ADMIN: CORE FUNCTION: FINANCE
ENERGY SOURCES: CORE: ELECTRICITY
WATER MANAG. : CORE: WATER DISTRIBUTION
FUND NON FUNDING NON FUNDING NON FUNDING
ITEM DEFAULT DEFAULT DEFAULT
COSTING RECOVERIES: DEPARTMENTAL: OFFICE RENTALS
CHARGES: DEPARTMENTAL: OFFICE RENTALS
CHARGES: DEPARTMENTAL: OFFICE RENTALS
REGIONAL DEFAULT DEFAULT DEFAULT
MSC FINANCE DEPT. TECH. SERVICES TECH. SERVICES
AMOUNT - R 16 000.00 R 12 000.00 R 4 000.00

Practical examples
21
Solution 2
SEGMENT ELECTRICITY WATER DIST
PROJECT DEFAULT DEFAULT
FUNCTION ENERGY SOURCES: CORE: ELECTRICITY
WATER MANAG. : CORE: WATER DISTRIBUTION
FUND NON FUNDING NON FUNDING
ITEM DEFAULT DEFAULT
COSTING RECOVERIES: ABC: VEHICLES: OPERATING
CHARGES: ABC: VEHICLES: OPERATING
REGIONAL DEFAULT DEFAULT
MSC DEFAULT DEFAULT
AMOUNT - R 18 000.00 R 18 000.00
Practical examples
22
Solution 3
SEGMENT ELECTRICITY WATER DIST
PROJECT DEFAULT DEFAULT
FUNCTION ENERGY SOURCES: CORE: ELECTRICITY
WATER MANAG. : CORE: WATER DISTRIBUTION
FUND NON FUNDING NON FUNDING
ITEM DEFAULT DEFAULT
COSTING RECOVERIES: INTERNAL BILLINELECT. CONSUMPTION
CHARGES: INTERNAL BILLIN ELECT. CONSUMPTION
REGIONAL DEFAULT DEFAULT
MSC DEFAULT DEFAULT
AMOUNT - R 16 000.00 R 16 000.00

Costing Segment:Tariff Setting

Need for Cost Accounting (Cost Reflective Tariffs) By only inflation adjusting tariffs there is no real growth in income Increased real growth in income is essential to:
Improve and sustain service delivery levels Fund repairs and maintenance and renewal of infrastructure.
Assists to realise the full revenue potential of the municipality Ensures that tariff services are adequately funded over the long term, resulting in an efficient, sustainable
and reliable service Full cost recovery is the process of gathering and reporting information about the true cost (direct plus
indirect costs) of providing a service by tracking and accumulating the total cost of the process to providethe service
Planning to recover the full cost of services (cost-reflective tariffs) is a structured, transparentmethodology of setting tariffs that is designed to take both financial sustainability and affordability intoconsideration
Imperative that the full cost of rendering a particular service is known so that tariff decisions are takenwith full knowledge of the cross-subsidy that will be required and provided from other revenue sources
Improved budgeting - Understanding demand and how costs are reflective of demand for a servicesallows municipalities to budget better
Transparency - Citizens need to understand the cost drivers and how tariffs are calculated Municipalities that apply full cost recovery are in general very efficient and provide a high level of service,
contributing to customer satisfaction and thereby encouraging payment for services, resulting ininvestment for replacement and expansion of services.
24

Benefits of Implementing Cost Accounting –(Cost Reflective Tariffs) Provides a better understanding and consistent approach across municipalities with regard to the
principles and techniques of cost allocation, and ability to benchmark costs against municipalities of asimilar size
Provides accurate and complete information on the real cost of managing a tariff service: Increase the accuracy of cost information by identifying secondary costs and assigning it to specific
municipal services Asist with resource allocation for a particular service Provide a basis for tariff setting to implement full cost recovery on tariff services
Ensures that those who are using the services are paying the full cost of the service Provides transparency with regard to cross-subsidisation between consumer groups Managers will have a better understanding of their costs and will be able to predict future costs more
precisely Promotes allocation of internal resources, ensuring that available resources are utilised optimally, and
duplication of services can be identified Identification of and making informed decisions about potential inefficiencies and cost savings, as well as
the types and levels of services provided Ensures correct pricing of services (and will result in consumers not abusing scarce resources)
25

Risks of Not Implementing Full Cost Recovery
Inability to finance network expansions, or properly maintain existing infrastructure resulting in lowservice levels, which in turn will have a negative effect on the willingness of customers to pay
Low levels of cost recovery from the user will result in insufficient income for the effective and efficientoperation and management of the service
Inability to further invest in the service, which can result in a possible loss of scarce resources such aswater if the infrastructure is not maintained properly
Potential for cross-subsidisation from property rates or other services A widening gap between full cost and current expenditure will result in huge tariff increases when
rectified No transparency around tariff determination An increase in emergency repairs against scheduled or preventative maintenance An increased risk of more service outages, as preventative maintenance is not being done, with the
accompanying inconvenience for customers and loss of revenue for the municipality A steady degradation of system infrastructure, resulting in a reduction of service level standards. Reduced ability to attract new business Can result in higher insurance costs, a lower credit rating and higher lending costs
26

Illustration of tariff calculation
27

28