management accounting - marriott school of …marriottschool.net/emp/mrs/files/hyundai/hyundai...
TRANSCRIPT

Hyundai Heavy Industries Executive Program
MANAGEMENT ACCOUNTING
Slides by Monte Swain, PhD, CPA
Brigham Young University
Reprinted with the permission of the author No further copying allowed
August 2012
Page M1
Unit A Topic 1 Cost Terminology
Learning Objectives: • identify and differentiate all cost items reported on the income statement • identify and calculate those costs incurred to complete a product and reported as cost of goods sold • identify and calculate those costs incurred for current operations but not included in cost of goods sold • identify and calculate the components of cost concepts such as prime cost, conversion cost, overhead cost, carrying
cost, sunk cost, discretionary cost, and opportunity cost • demonstrate an understanding of the characteristics that differentiate fixed costs, variable costs, and mixed costs and
evaluate the effect that changes in production volume have on these costs • demonstrate an understanding of the behavior of fixed and variable costs in the long and short terms and how a change
in assumptions regarding cost type or relevant range affects these costs • describe the importance of timely and accurate costing information as a tool for strategic planning and management
decision making
Page M2

Costs on the Income Statement
Sales Revenue $750,000 Cost of Goods Sold (COGS) 425,000 Gross Profit $325,000 Selling, General, Admin (SGA) Exp. 278,000 Operating Income $ 47,000
n Product Costs
o Labor, materials, and production overhead costs o Initially assigned to inventory (balance sheet) o Eventually expensed when “sold” (income statement) o “Above the Line” costs
n Period Costs o Selling, administrative, and other operating costs o Immediately expensed to the income statement o “Below the Line” costs
Remember: Only product costs are assigned to inventory and can be reported on the balance sheet (according to GAAP).
Product Costs
Period Costs
The “Line”
Page M3
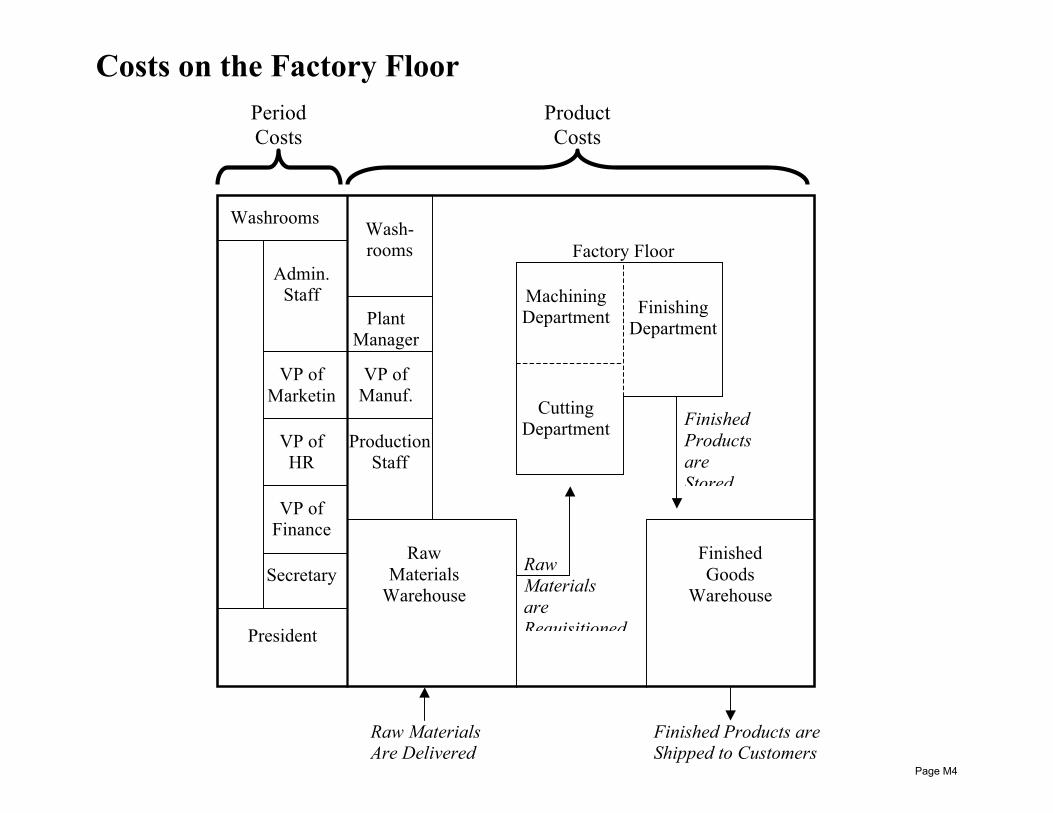
Costs on the Factory Floor
President
Secretary
VP of Finance
VP of HR
VP of Marketin
g
Admin. Staff
Washrooms
Production Staff
VP of Manuf.
Plant Manager
Wash- rooms
Raw Materials
Warehouse
Finished Goods
Warehouse
Cutting Department
Finishing Department
Machining Department
Raw Materials are Requisitioned
Finished Products are Stored
Raw Materials Are Delivered
Finished Products are Shipped to Customers
Factory Floor
Period Costs
Product Costs
Page M4

Cost Classifications
n Direct Costs o Costs that are specifically traceable to the unit or business, or segment,
or product being analyzed § In other words, the costs that will be avoided if we remove the
segment or product
n Indirect Costs o Costs that benefit multiple segments or products that are often allocated
(but not traceable) to individual segments/products § Sometimes called common costs or joint costs
n Direct Materials Costs o Materials that become part of the product and are traceable to it
n Direct Labor Costs o Wages paid to those who physically work on the direct materials and
convert them into finished product § These costs are traceable to the product
n Prime Costs o The costs that can be “primarily seen” in the product
§ Direct labor and direct materials
Page M5
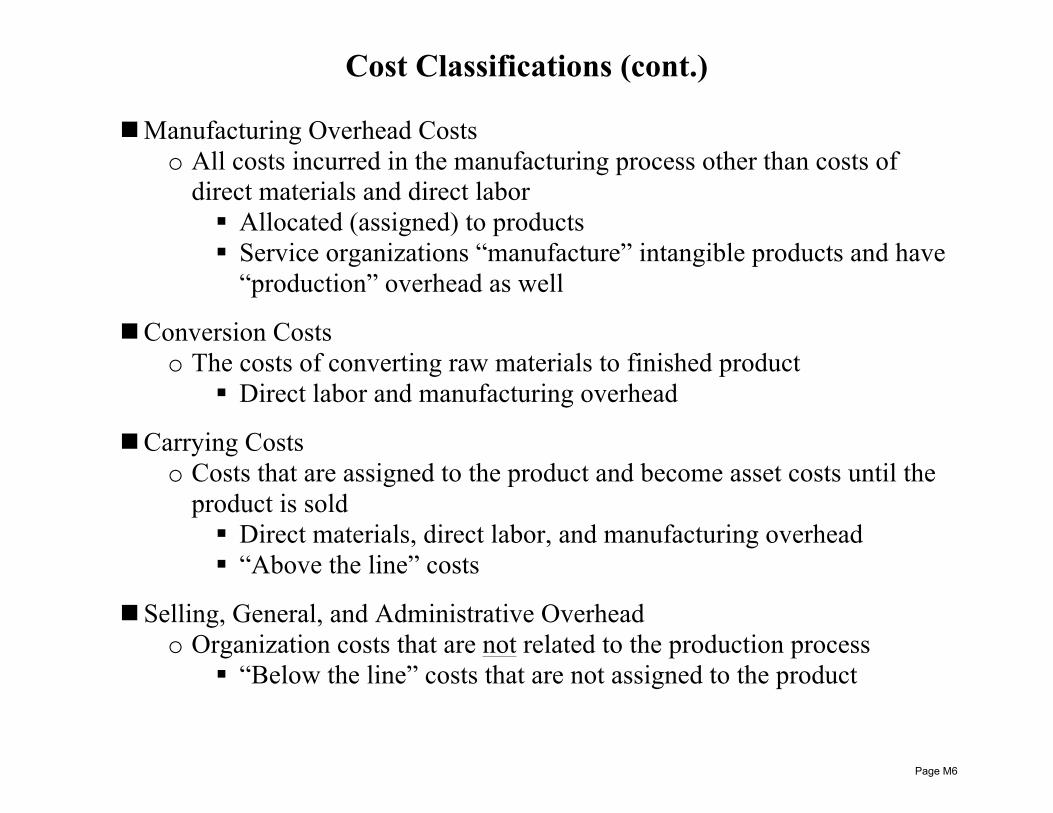
Cost Classifications (cont.) n Manufacturing Overhead Costs
o All costs incurred in the manufacturing process other than costs of direct materials and direct labor § Allocated (assigned) to products § Service organizations “manufacture” intangible products and have
“production” overhead as well
n Conversion Costs o The costs of converting raw materials to finished product
§ Direct labor and manufacturing overhead
n Carrying Costs o Costs that are assigned to the product and become asset costs until the
product is sold § Direct materials, direct labor, and manufacturing overhead § “Above the line” costs
n Selling, General, and Administrative Overhead o Organization costs that are not related to the production process
§ “Below the line” costs that are not assigned to the product
Page M6
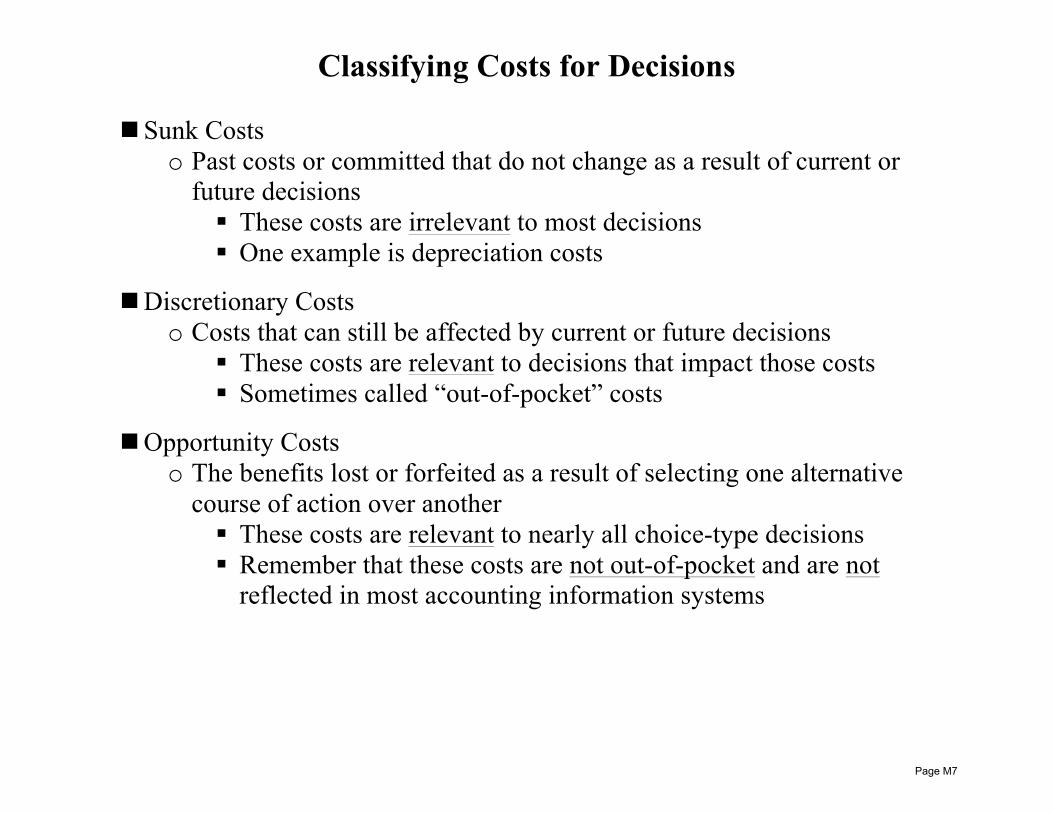
Classifying Costs for Decisions
n Sunk Costs o Past costs or committed that do not change as a result of current or
future decisions § These costs are irrelevant to most decisions § One example is depreciation costs
n Discretionary Costs o Costs that can still be affected by current or future decisions
§ These costs are relevant to decisions that impact those costs § Sometimes called “out-of-pocket” costs
n Opportunity Costs o The benefits lost or forfeited as a result of selecting one alternative
course of action over another § These costs are relevant to nearly all choice-type decisions § Remember that these costs are not out-of-pocket and are not
reflected in most accounting information systems
Page M7
Costs Behavior
n Cost Behavior is Described in relation to Key Activities within the Company o Activity levels are often measured in terms of output, input, or a
combination of both § Traditional examples are units sold, units produced, labor hours,
and machine hours
n Fixed Costs o Costs that remain constant in total regardless of changes in the activity
level
n Variable Costs o Costs that change in total in direct proportion to changes in the activity
level
n Mixed Costs o Costs that include both fixed cost and variable cost components
§ These costs must be segregated before data can be used for most types of decisions
§ Methods that can be used to segregate mixed costs include the graphing and visual fit analysis, high-low analysis, and statistical regression analysis
Page M8
Costs Behavior (cont.) n Relevant Range of Activity
o The normal or expected range of production/sales § Production/sales that occur outside of the relevant range typically
result in significant changes to the cost structure § Fixed costs do not stay constant, nor do variable costs remain
proportional, outside of relevant range (critical assumption!)
n Relevant Range and Time Horizons o The longer the time horizon, the larger the relevant range
§ In the long run, most costs are variable § In the very short run, most costs are fixed
o The critical point is that the distinction between fixed and variable costs is a function of assumptions regarding the relevant range/time horizon
Page M9
Cost-Based Decisions
n Cost data are Necessary for making decisions o As the accuracy and timeliness of cost data improves, decision making
become faster and more confident
n But cost data are usually Not Sufficient for making decisions o Marketing, HR, competitor analysis, technology, etc. all combine to
form the organization’s strategy § Nevertheless, until costs are understood, it is difficult to proceed to
a discussion of issues such as marketing and HR.
Page M10
Unit A Topic 2 Cost Measurement Concepts
Learning Objectives: • recognize cost objects and cost pools and assign costs to appropriate activities • demonstrate an understanding of the nature and types of cost drivers and the causal relationship that exists between
cost drivers and costs incurred • demonstrate a thorough understanding of the various methods for measuring costs and accumulating work-in-process
and finished goods inventories and a basic understanding of how inventories are relieved • identify and calculate the components of cost measurement techniques such as actual costing, normal costing, and
standard costing; recognize the appropriate use of each technique; and describe the benefits and limitations of each technique
Page M11

Cost Assignment Systems
n Cost Assignment is Critical (and Difficult) for both Manufacturing and Service Organizations o Both of these organizations are production based o The critical issue is how to assign costs of materials, labor, and
overhead to work-in-process accounts
n Cost assignment work is not nearly as challenging in a merchandising organization
Direct Materials
Costs
Direct Labor Costs
Production Overhead
Costs
Work-in-Process
Inventory
Finished Goods
Inventory
Cost of Goods Sold
The Balance Sheet
The Income
Statement
Page M12
Cost Assignment Systems (cont.)
n Three types of Cost Accounting Systems o Actual costing o Normal costing o Standard costing
n Actual Costing (rarely used) o Assign costs of materials, labor, and overhead to work-in-process
(WIP) as these costs are actually consumed o Advantages
§ The accounting is easy and inexpensive § Reduced chance for costs to be assigned to the wrong products
o Disadvantages § Many costs (mainly overhead costs) can not be assigned at all to
products because there is no direct relationship between the cost and the production of the product
§ There is no system to budget and control production costs because costs are simply assigned as they incur
Page M13
Cost Assignment Systems (cont.)
n Normal Costing (often used) o Assign actual costs of materials and labor to WIP as these resources are
consumed o Allocate costs of overhead to WIP using a predetermined (budgeted)
overhead rate o Advantages
§ All overhead costs are accounted for and assigned to products § There is some budget and control in the accounting process, but
only for overhead costs o Disadvantages
§ Accounting is more complicated compared to actual costing systems
§ The accuracy and usefulness of the cost system is only as good as the estimates used to create the predetermined overhead rate (this is a major problem!)
§ There is still no system to budget and control materials and labor costs
Page M14

Cost Assignment Systems (cont.)
n Standard Costing (often used, especially in large organizations) o Assign standard costs of materials and labor to WIP as these resources
are consumed o Allocate costs of overhead to WIP using a predetermined (budgeted)
overhead rate o Advantages
§ Budget and control exists within the accounting process for all product costs
o Disadvantages § Accounting is more complicated than actual and normal costing
systems § The accuracy and usefulness of the cost system is only as good as
the cost standards used for materials, labor, and overhead (this is a major problem!)
o The process of reconciling the budgeted (standard) costs with actual costs in the accounting system results in variances (to be discussed in a later topic)
Page M15
Unit A Topic 3 Cost Accumulation Systems
Learning Objectives: • understand the strategic value of cost information regarding products and services, pricing, overhead allocations, and
other issues • define the nature of the system, understand the cost flows of the system, and recognize its appropriate use • calculate inventory values and cost of goods sold • understand the benefits and limitations of each cost accumulation system • understand the concept of life-cycle costing and the strategic value of including upstream costs, manufacturing costs,
and downstream costs
Page M16

Strategic Cost Management
n Classic Strategic Views o Quality products/services at low prices o Unique products/services (sometimes at premium prices) o In either case, accurate cost information is necessary to plan, control,
and evaluate the effectiveness of these strategies
n Strategic Cost Information is Useful in Answering Strategic Questions o Who are our critical customers?
§ How sensitive are these customers to price, quality, and service? o Who are our important suppliers?
§ How do the products/services of our suppliers impact our costs and service?
o What substitute products/services exist? § How are these substitutes different in terms of price and quality?
Page M17
Strategic Cost Management
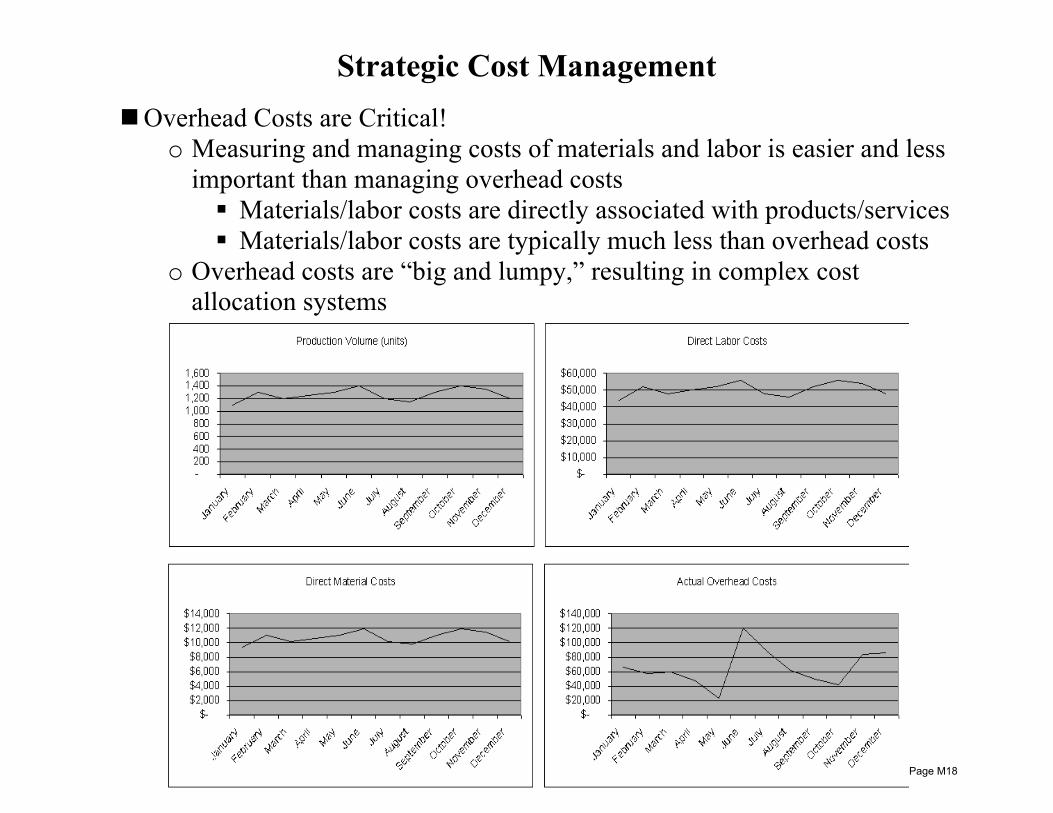
n Overhead Costs are Critical! o Measuring and managing costs of materials and labor is easier and less
important than managing overhead costs § Materials/labor costs are directly associated with products/services § Materials/labor costs are typically much less than overhead costs
o Overhead costs are “big and lumpy,” resulting in complex cost allocation systems
Page M18

Manufacturing Cost Flows
Work-in-Process
Inventory
xx
Cost of Goods Sold
xx
Wages Payable
xx
xx
x
Finished Goods Inventory
xx xx
Manufacturing Overhead
x x
x x x
x
x x x
xxx
xxx
Raw Materials Inventory
x
xx
x
Page M19

Service Cost Flows
Unbilled Services
xx
Cost of Services
xx
Salaries Payable
xx
xx
x
Service Overhead
x x
x x x
x x x
xxx
xxx
Supplies Inventory
x
Page M20
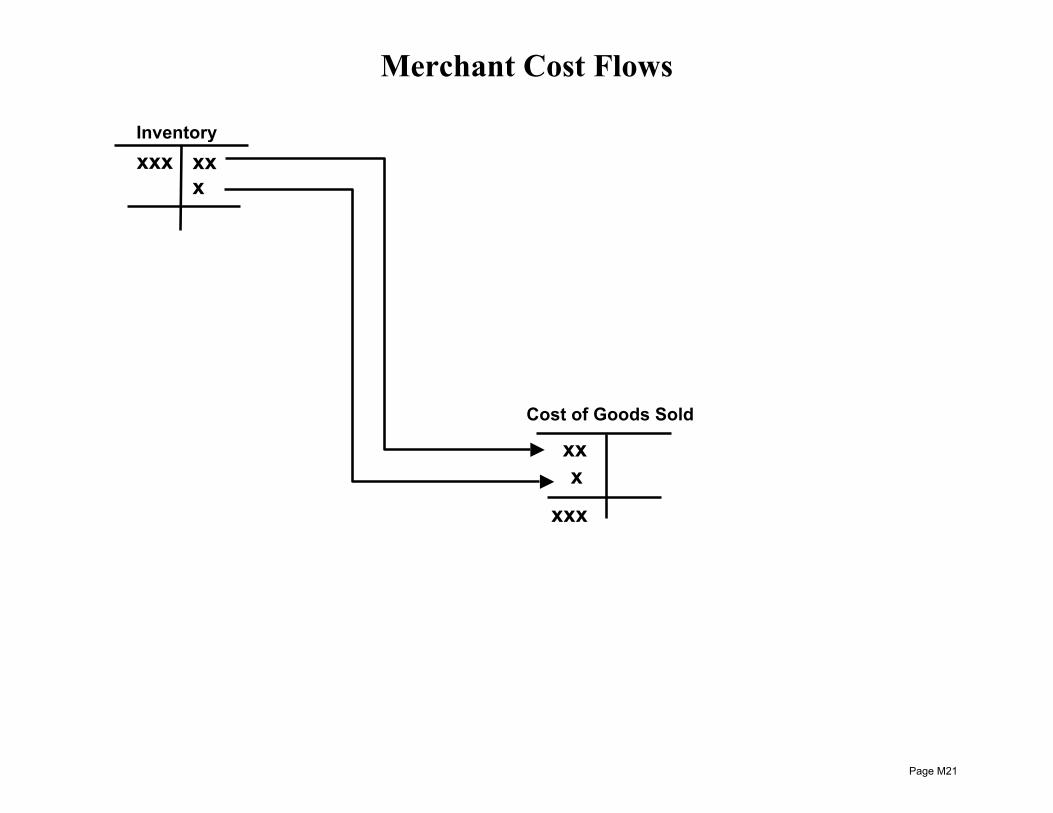
Merchant Cost Flows
Cost of Goods Sold
xx
xx x
x
xxx
xxx Inventory
Page M21

Cost of Goods Manufactured Statement Direct materials costs: Direct materials purchases $ 90,000 Direct materials beginning inventory 14,000 Direct materials ending inventory (16,000) $ 88,000 Direct labor costs 65,000 Manufacturing overhead applied 179,000 Total production costs $332,000 Work-in-process beginning inventory 45,000 Work-in-process ending inventory (13,000) Cost of goods manufactured $364,000 Cost of goods manufactured $364,000 Finished goods beginning inventory 23,000 Finished goods ending inventory (21,000) Cost of goods sold (unadjusted) $366,000 Overapplied manufacturing overhead (9,000) Cost of goods sold (adjusted) $357,000
Page M22

179,000
Work-in-Process Inventory
Cost of Goods Sold
Wages Payable
Finished Goods Inventory
Manufacturing Overhead
14,000 90,000
16,000
Direct Materials Inventory
88,000
45,000 88,000 65,000
179,000
13,000
65,000
8,000 67,000
113,000
9,000
364,000
366,000
23,000 364,000
21,000
366,000
357,000
9,000
Page M23

Accounting for Production Costs
n Job-Order Costing o The production that flows through the system is identifiable (usually
customized per customer) o Direct materials and direct labor costs are assigned directly to jobs as
these costs are used (easy) o Overhead costs are allocated to jobs based on some type of allocation
basis (harder) n Process Costing
o The production that flows through the system is homogenous and is not identifiable
o Direct materials and direct labor costs are assigned to jobs based on the amount of work done during the time period (harder)
o Overhead costs are allocated to jobs based on some type of allocation basis (harder)
Page M24
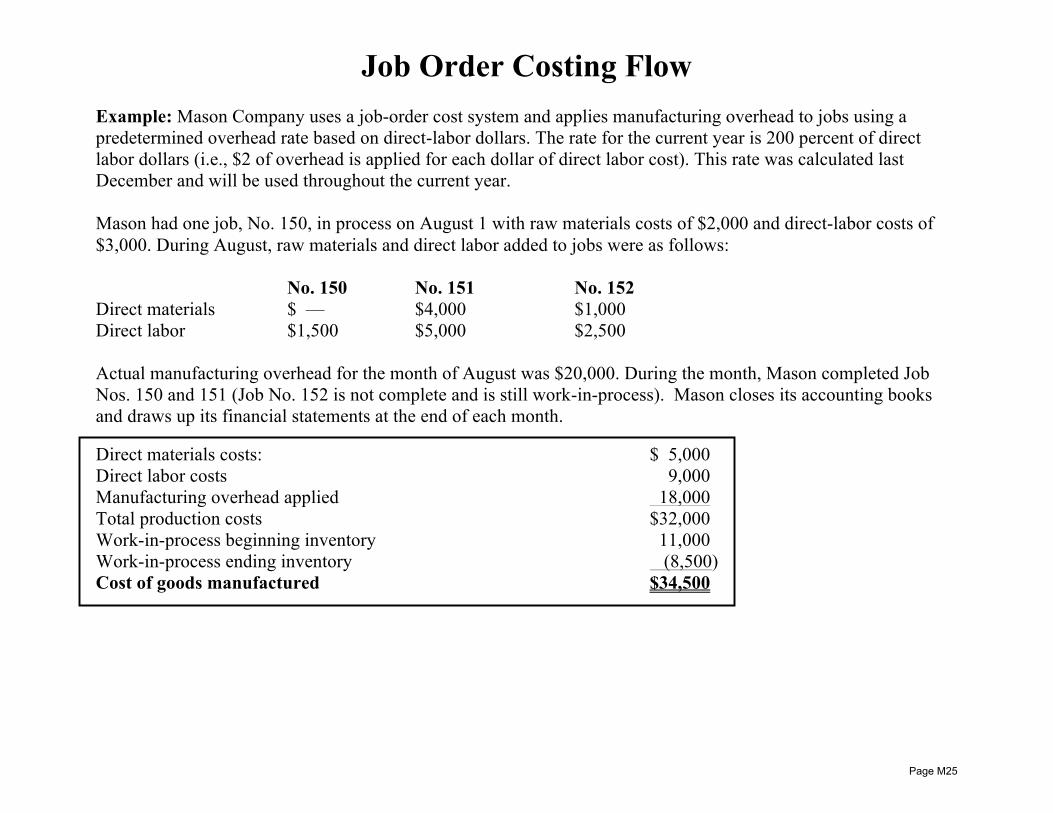
Job Order Costing Flow Example: Mason Company uses a job-order cost system and applies manufacturing overhead to jobs using a predetermined overhead rate based on direct-labor dollars. The rate for the current year is 200 percent of direct labor dollars (i.e., $2 of overhead is applied for each dollar of direct labor cost). This rate was calculated last December and will be used throughout the current year. Mason had one job, No. 150, in process on August 1 with raw materials costs of $2,000 and direct-labor costs of $3,000. During August, raw materials and direct labor added to jobs were as follows: No. 150 No. 151 No. 152 Direct materials $ — $4,000 $1,000 Direct labor $1,500 $5,000 $2,500 Actual manufacturing overhead for the month of August was $20,000. During the month, Mason completed Job Nos. 150 and 151 (Job No. 152 is not complete and is still work-in-process). Mason closes its accounting books and draws up its financial statements at the end of each month. Direct materials costs: $ 5,000 Direct labor costs 9,000 Manufacturing overhead applied 18,000 Total production costs $32,000 Work-in-process beginning inventory 11,000 Work-in-process ending inventory (8,500) Cost of goods manufactured $34,500
Page M25
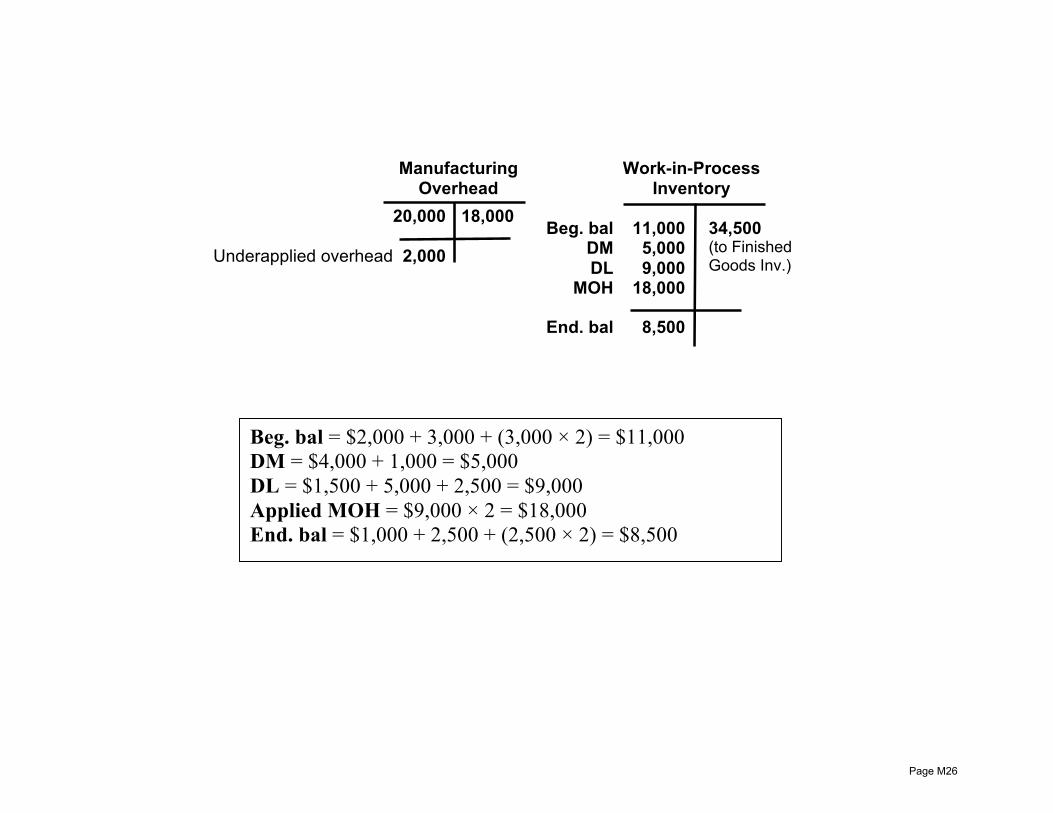
18,000
Manufacturing Overhead
20,000
Underapplied overhead 2,000
Work-in-Process Inventory
11,000 5,000 9,000
18,000
8,500
34,500 (to Finished Goods Inv.)
Beg. bal DM DL
MOH
End. bal
Beg. bal = $2,000 + 3,000 + (3,000 × 2) = $11,000 DM = $4,000 + 1,000 = $5,000 DL = $1,500 + 5,000 + 2,500 = $9,000 Applied MOH = $9,000 × 2 = $18,000 End. bal = $1,000 + 2,500 + (2,500 × 2) = $8,500
Page M26

Life-Cycle Costing (cont.)
n Another Version à The Customer Viewpoint o What does the product cost the customer over the life of the product?
§ Initial purchase price § Upgrade costs § Repair and maintenance costs
o Sometimes called the “Customer Life-Cycle Cost” or “Whole-Life Cost”
n Accounting o These data can not be directly measured and accounted for within the
organization’s system § There are no expenditures
o Requires good market analyses and good estimates o This is very useful competitive analysis information
§ Use to price and market products § Use to assess current and potential markets
n Value Engineering o Most of the life-cycle and customer life-cycle costs are committed in
the R&D process o The theory is that this stage is where real cost control takes place
(versus the production stage) Page M27
Unit A Topic 4 Accumulating and Assigning Overhead Costs
Learning Objectives: • demonstrate an understanding of the fixed and variable nature of overhead expenses • determine the appropriate time frame for both variable and fixed overhead expenses demonstrate an understanding that
overhead rates can be determined in a variety of ways, e.g., plant-wide rates, departmental rates, and individual cost driver rates and describe the benefits and limitations of each of these methods
• demonstrate an understanding of the need to allocate the cost of support departments such as Human Resources or Information Technology to production departments
• understand and use the direct method, the reciprocal method, and the step-down method to allocate support department costs
• identify the components of variable overhead expense • determine the appropriate allocation base for variable overhead expenses • calculate the per unit variable overhead expense • identify the components of fixed overhead expense • identify the appropriate allocation base for fixed overhead expense and demonstrate an understanding that because the
allocation base is generally variable (e.g., direct labor hours), fixed factory overhead is often over or under applied • calculate the fixed overhead application rate • demonstrate an understanding of overhead control accounts, overhead allocation accounts, and the expensing of over
or under applied overhead expenses • compare and contrast traditional overhead allocation with activity-based overhead allocation • calculate overhead expense in an activity-based setting and describe the benefits derived from activity-based overhead
allocation • define the elements of activity-based costing such as cost pool, cost driver, resource driver, activity driver, and value-
added activity • calculate product cost using an activity-based system and compare and analyze the results with costs calculated using a
traditional system
Page M28
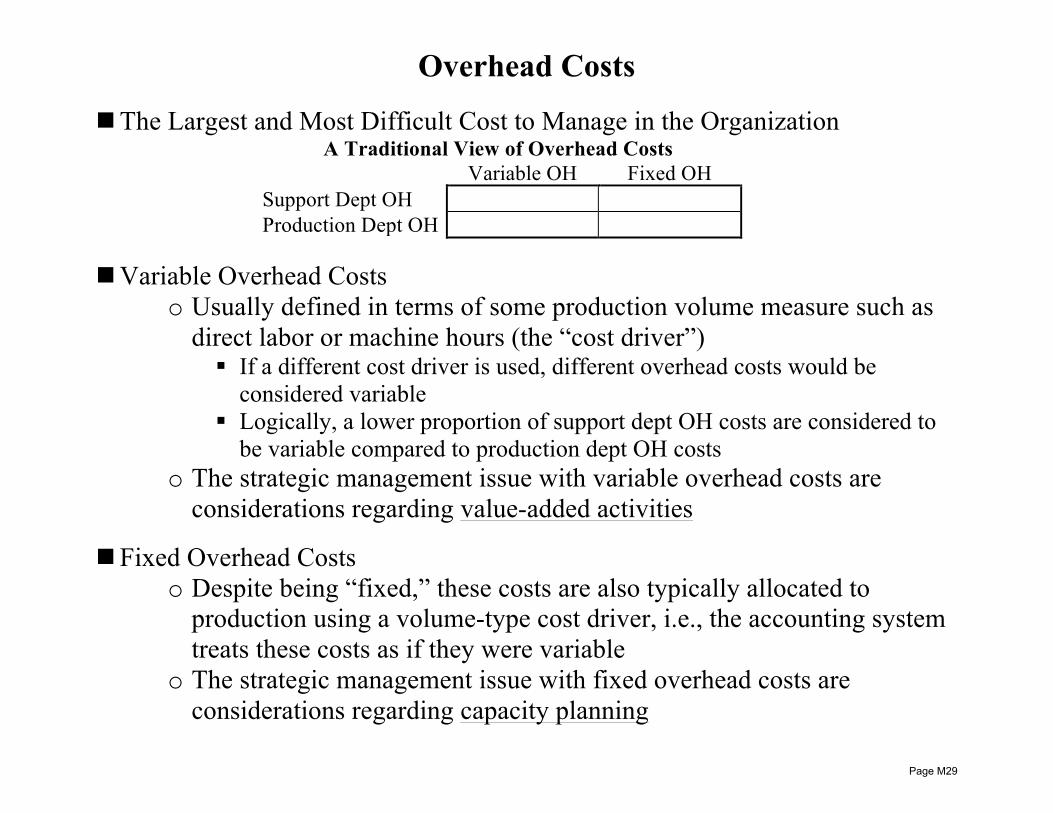
Overhead Costs
n The Largest and Most Difficult Cost to Manage in the Organization A Traditional View of Overhead Costs
Variable OH Fixed OH Support Dept OH Production Dept OH
n Variable Overhead Costs
o Usually defined in terms of some production volume measure such as direct labor or machine hours (the “cost driver”) § If a different cost driver is used, different overhead costs would be
considered variable § Logically, a lower proportion of support dept OH costs are considered to
be variable compared to production dept OH costs o The strategic management issue with variable overhead costs are
considerations regarding value-added activities
n Fixed Overhead Costs o Despite being “fixed,” these costs are also typically allocated to
production using a volume-type cost driver, i.e., the accounting system treats these costs as if they were variable
o The strategic management issue with fixed overhead costs are considerations regarding capacity planning
Page M29

Overhead Costs Allocation
n The Cost Allocation Model o Typically, materials and labor costs can be assigned directly to products
because these costs are direct § Exceptions are process products and joint products
o Only overhead costs are allocated because these costs are indirect o The basic model:
**The activity used in the cost driver rate is based (hopefully) on a relationship that actually exists between the cost pool and the cost object, i.e., the activity “drives” the cost
n The Traditional Single-Stage Plantwide Allocation Process
o Simple, but high potential for inaccuracies
Total Plant Overhead Products
Single Plantwide
Rate
Plantwide Rate = Total Plant Overhead Dollars ÷ Total Activity Basis
Cost Pool
Cost Object
Cost Driver
Cost Driver Rate = Total Cost Pool Dollars ÷ Total Activity Basis
Cost Pool Cost Object
Page M30

Overhead Costs Allocation (cont.)
n The Traditional Two-Stage Departmental Allocation Process
o More complex with multiple cost pools and cost drivers, but still has significant
potential for inaccuracies
n Allocating Support Department Costs (Stage 1) o By definition, all costs are overhead costs o A necessary cost of the product o Support depts. often provide resources to production depts. and other support
depts. § e.g., HR or Information Technology depts. § This complicates the allocation!
Production Departments Products
Support Departments
Allocation Cost Driver
Cost Pools Cost Pools Cost Objects Cost Objects
Production Dept #1
HR Dept
IT Dept
Production Dept #2
Production Dept #3
Janitorial Dept
Page M31

Allocating Support Dept Costs n Direct Method
o No recognition of support provided to other support depts. n Step-Down Method
o Partial recognition of support provided to other support depts. n Reciprocal Method
o Total recognition of support provided to other support depts.
Production Dept #1
HR Dept
Production Dept #2
Janitorial Dept
Production Dept #1
HR Dept
Production Dept #2
Janitorial Dept
Production Dept #1
HR Dept
Production Dept #2
Janitorial Dept
Page M32
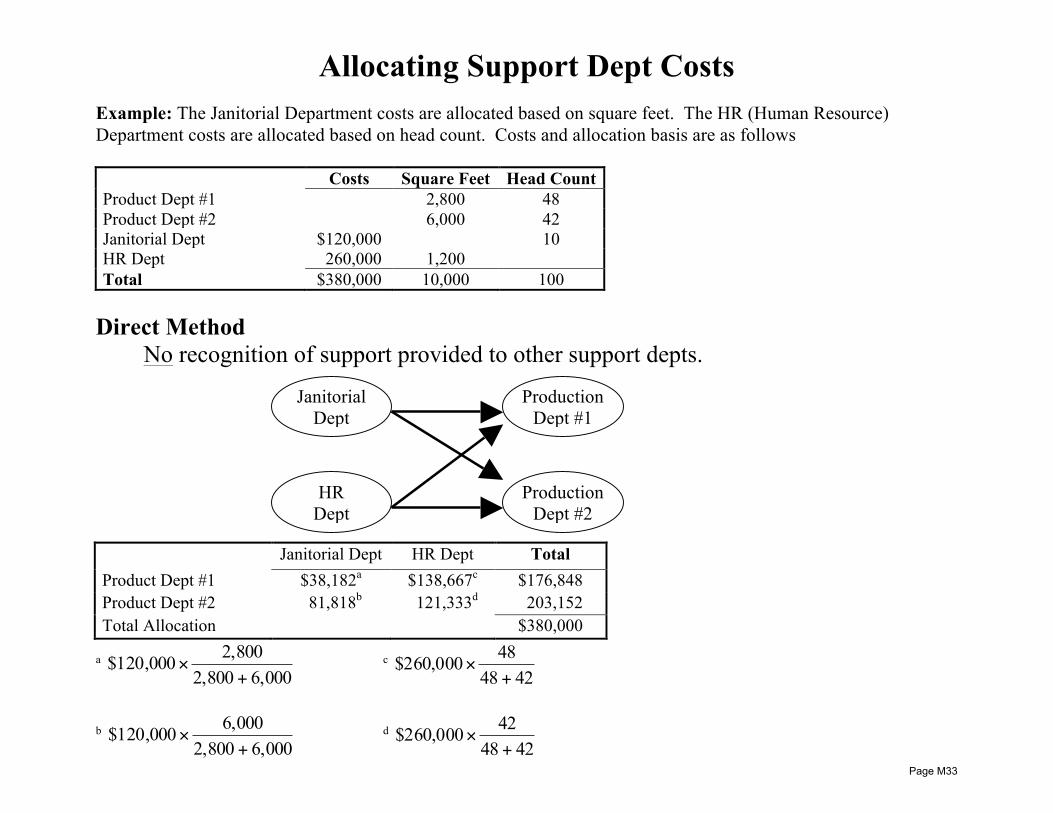
Allocating Support Dept Costs Example: The Janitorial Department costs are allocated based on square feet. The HR (Human Resource) Department costs are allocated based on head count. Costs and allocation basis are as follows Costs Square Feet Head Count Product Dept #1 2,800 48 Product Dept #2 6,000 42 Janitorial Dept $120,000 10 HR Dept 260,000 1,200 Total $380,000 10,000 100
Direct Method
No recognition of support provided to other support depts. Janitorial Dept HR Dept Total Product Dept #1 $38,182a $138,667c $176,848 Product Dept #2 81,818b 121,333d 203,152 Total Allocation $380,000
a 6,000 2,800
2,800 $120,000+
× c 42 48
48 $260,000+
×
b
6,000 2,8006,000 $120,000+
× d 42 48
42 $260,000+
×
Production Dept #1
HR Dept
Production Dept #2
Janitorial Dept
Page M33
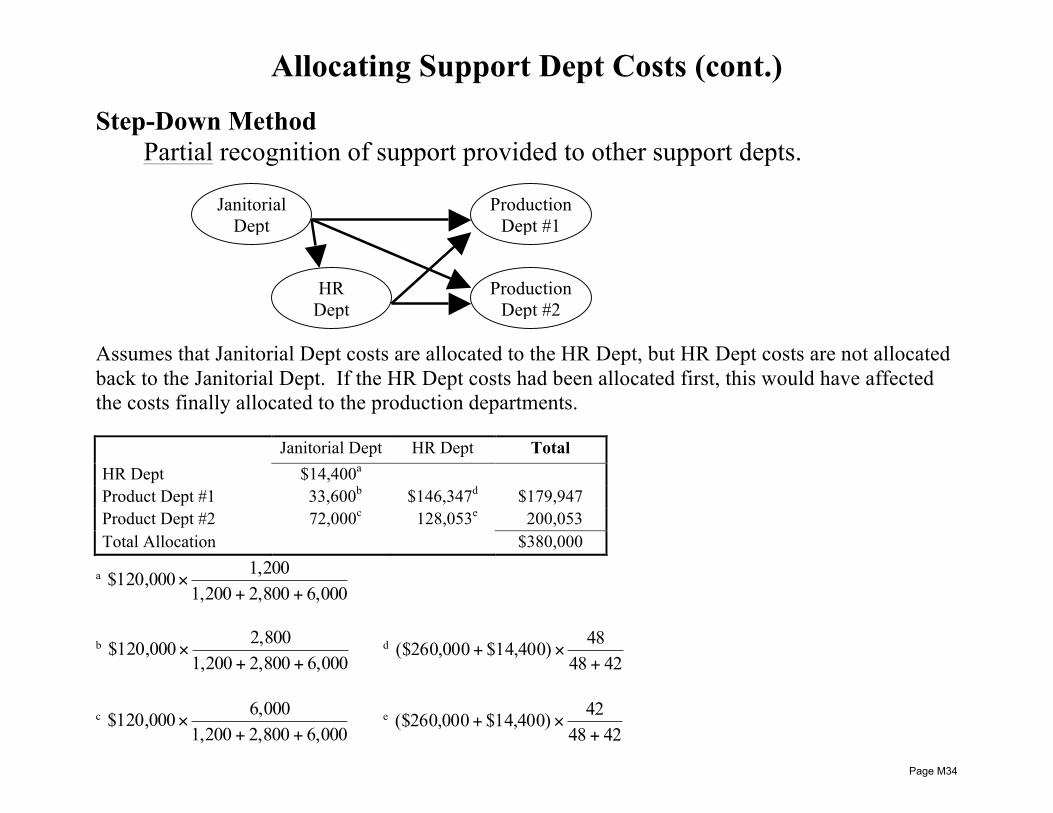
Allocating Support Dept Costs (cont.) Step-Down Method
Partial recognition of support provided to other support depts. Assumes that Janitorial Dept costs are allocated to the HR Dept, but HR Dept costs are not allocated back to the Janitorial Dept. If the HR Dept costs had been allocated first, this would have affected the costs finally allocated to the production departments. Janitorial Dept HR Dept Total HR Dept $14,400a Product Dept #1 33,600b $146,347d $179,947 Product Dept #2 72,000c 128,053e 200,053 Total Allocation $380,000
a 6,000 2,800 1,200
1,200 $120,000++
×
b 6,000 2,800 1,200
2,800 $120,000++
× d 42 48
48 $14,400) ($260,000+
×+
c
6,000 2,800 1,2006,000 $120,000
++× e
42 4842 $14,400) ($260,000+
×+
Production Dept #1
HR Dept
Production Dept #2
Janitorial Dept
Page M34
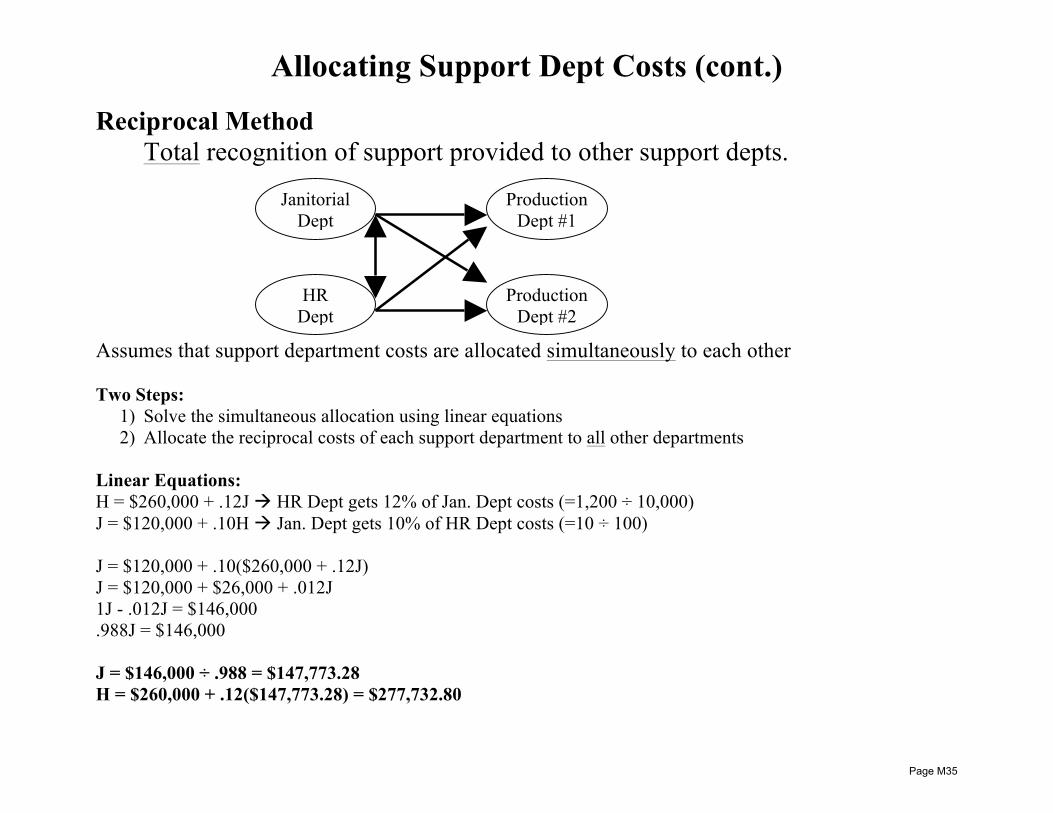
Allocating Support Dept Costs (cont.) Reciprocal Method
Total recognition of support provided to other support depts. Assumes that support department costs are allocated simultaneously to each other Two Steps:
1) Solve the simultaneous allocation using linear equations 2) Allocate the reciprocal costs of each support department to all other departments
Linear Equations: H = $260,000 + .12J à HR Dept gets 12% of Jan. Dept costs (=1,200 ÷ 10,000) J = $120,000 + .10H à Jan. Dept gets 10% of HR Dept costs (=10 ÷ 100) J = $120,000 + .10($260,000 + .12J) J = $120,000 + $26,000 + .012J 1J - .012J = $146,000 .988J = $146,000 J = $146,000 ÷ .988 = $147,773.28 H = $260,000 + .12($147,773.28) = $277,732.80
Production Dept #1
HR Dept
Production Dept #2
Janitorial Dept
Page M35
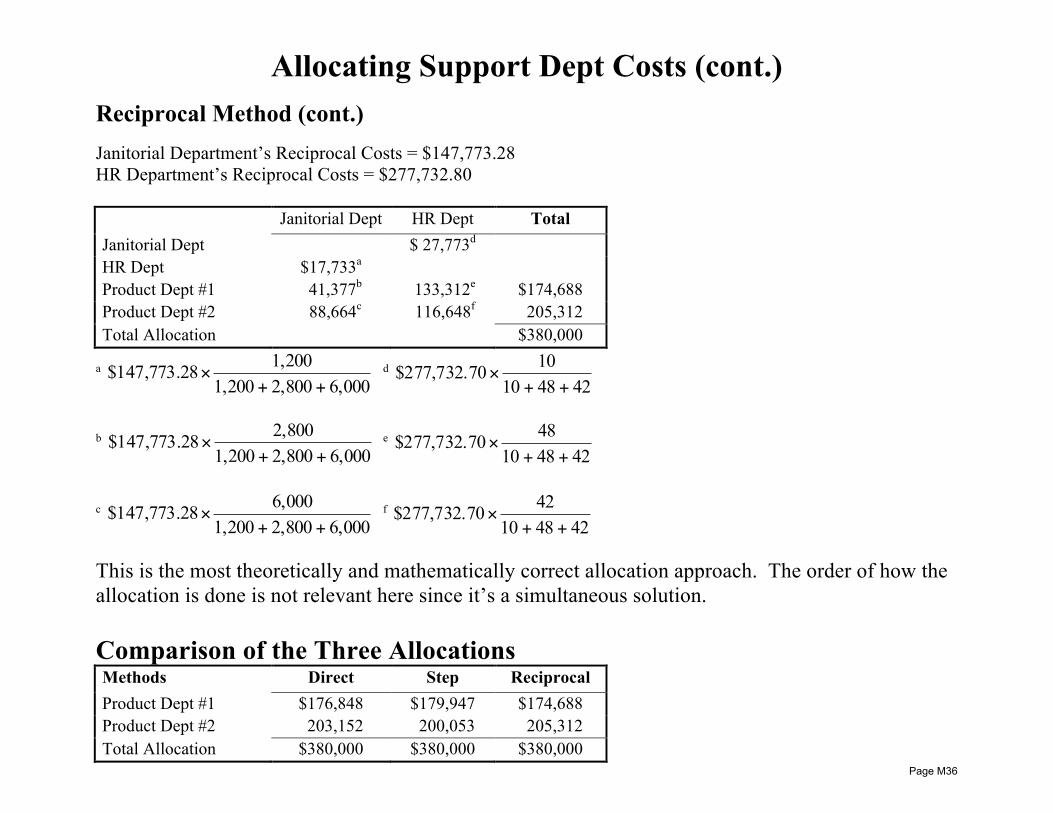
Allocating Support Dept Costs (cont.)
Reciprocal Method (cont.) Janitorial Department’s Reciprocal Costs = $147,773.28 HR Department’s Reciprocal Costs = $277,732.80 Janitorial Dept HR Dept Total Janitorial Dept $ 27,773d HR Dept $17,733a Product Dept #1 41,377b 133,312e $174,688 Product Dept #2 88,664c 116,648f 205,312 Total Allocation $380,000
a 6,000 2,800 1,200
1,200 8$147,773.2++
× d 42 48 10
10 0$277,732.7++
×
b 6,000 2,800 1,200
2,800 8$147,773.2++
× e 42 48 10
48 0$277,732.7++
×
c
6,000 2,800 1,2006,000 8$147,773.2
++× f
42 48 1042 0$277,732.7++
×
This is the most theoretically and mathematically correct allocation approach. The order of how the allocation is done is not relevant here since it’s a simultaneous solution. Comparison of the Three Allocations Methods Direct Step Reciprocal Product Dept #1 $176,848 $179,947 $174,688 Product Dept #2 203,152 200,053 205,312 Total Allocation $380,000 $380,000 $380,000
Page M36
Allocating Production Dept Costs
n Stage 2 of the Two-Stage Allocation Process o First allocate the support department costs in Stage 1
§ In a normal or standard cost system, budgeted support department costs are determined and assigned at the beginning of the operating period
o Combine the allocated support dept charges with the budgeted overhead costs in the production department
o Establish the predetermined overhead rate § Note that a “predetermined” rate means that all costs used in this
rate, including production dept costs, are budgeted, not actual o The predetermined overhead rate is often divided into two rates
§ The variable overhead rate § The fixed overhead rate
o The variable and fixed rates may or may not share the same allocation basis (e.g., direct labor hours)
Page M37
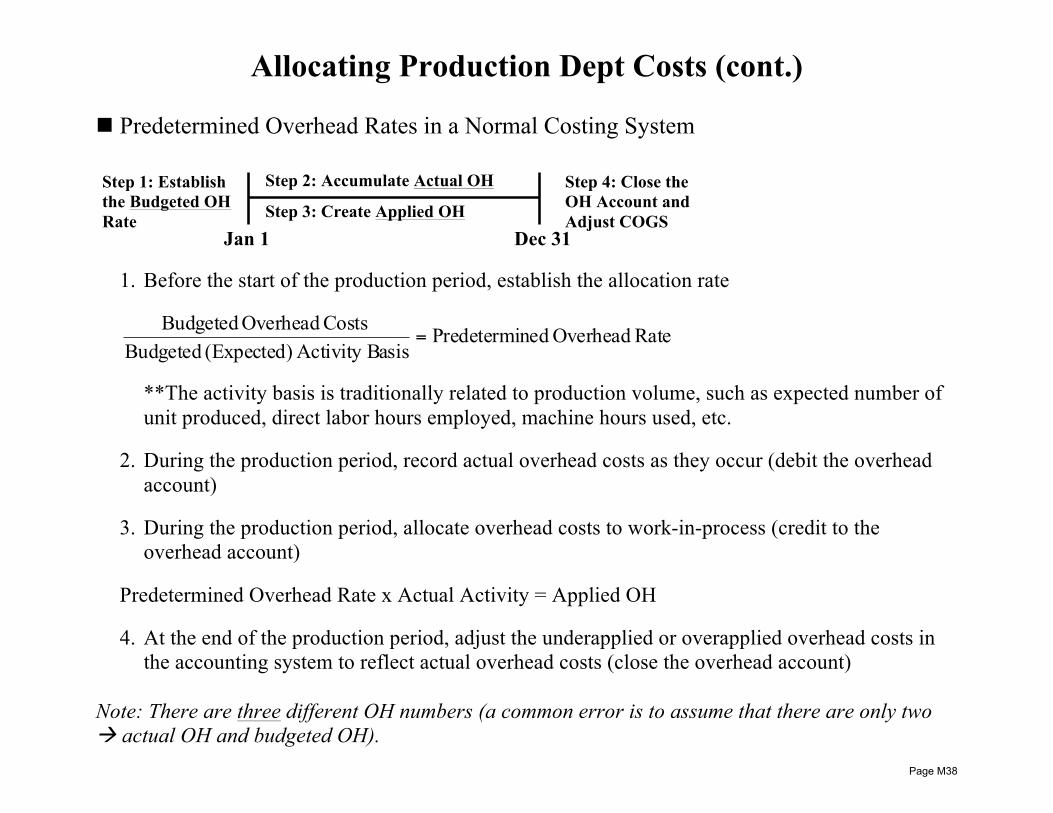
Allocating Production Dept Costs (cont.) n Predetermined Overhead Rates in a Normal Costing System
1. Before the start of the production period, establish the allocation rate
RateOverhead nedPredetermiasisActivity B (Expected) Budgeted
Costs Overhead Budgeted=
**The activity basis is traditionally related to production volume, such as expected number of unit produced, direct labor hours employed, machine hours used, etc.
2. During the production period, record actual overhead costs as they occur (debit the overhead
account) 3. During the production period, allocate overhead costs to work-in-process (credit to the
overhead account)
Predetermined Overhead Rate x Actual Activity = Applied OH 4. At the end of the production period, adjust the underapplied or overapplied overhead costs in
the accounting system to reflect actual overhead costs (close the overhead account) Note: There are three different OH numbers (a common error is to assume that there are only two à actual OH and budgeted OH).
Jan 1 Dec 31
Step 2: Accumulate Actual OH
Step 3: Create Applied OH
Step 1: Establish the Budgeted OH Rate
Step 4: Close the OH Account and Adjust COGS
Page M38
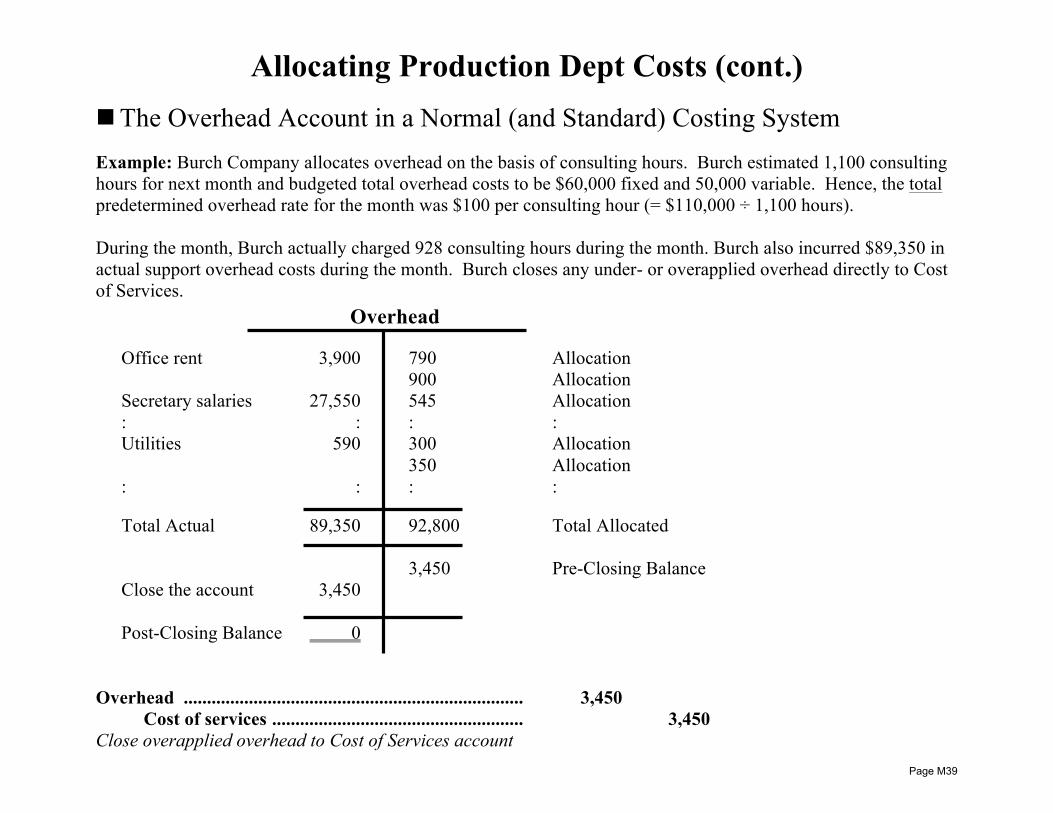
Allocating Production Dept Costs (cont.)
n The Overhead Account in a Normal (and Standard) Costing System Example: Burch Company allocates overhead on the basis of consulting hours. Burch estimated 1,100 consulting hours for next month and budgeted total overhead costs to be $60,000 fixed and 50,000 variable. Hence, the total predetermined overhead rate for the month was $100 per consulting hour (= $110,000 ÷ 1,100 hours). During the month, Burch actually charged 928 consulting hours during the month. Burch also incurred $89,350 in actual support overhead costs during the month. Burch closes any under- or overapplied overhead directly to Cost of Services. Overhead ......................................................................... 3,450 Cost of services ...................................................... 3,450 Close overapplied overhead to Cost of Services account
Total Actual 89,350 92,800 Total Allocated 3,450 Pre-Closing Balance Close the account 3,450 Post-Closing Balance 0
Overhead
Office rent 3,900 790 Allocation 900 Allocation Secretary salaries 27,550 545 Allocation : : : : Utilities 590 300 Allocation
350 Allocation : : : :
Page M39
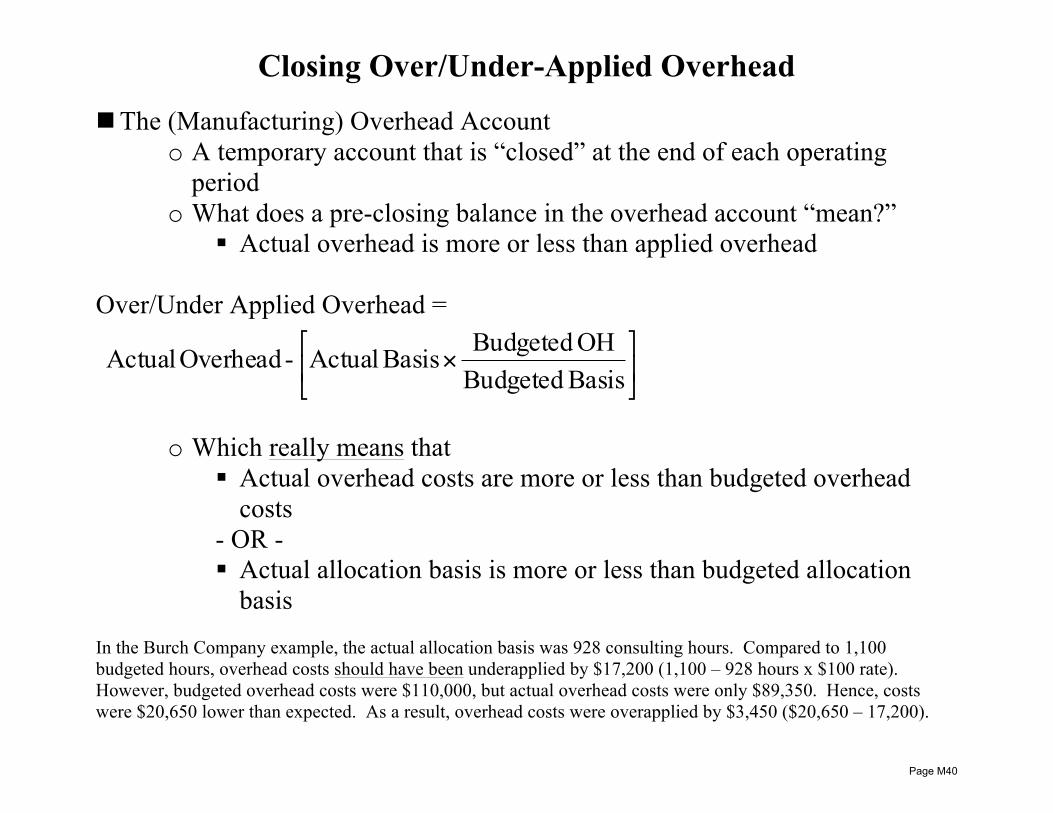
Closing Over/Under-Applied Overhead
n The (Manufacturing) Overhead Account o A temporary account that is “closed” at the end of each operating
period o What does a pre-closing balance in the overhead account “mean?”
§ Actual overhead is more or less than applied overhead
Over/Under Applied Overhead =
⎥⎦
⎤⎢⎣
⎡×
Basis BudgetedOH Budgeted Basis Actual - Overhead Actual
o Which really means that
§ Actual overhead costs are more or less than budgeted overhead costs
- OR - § Actual allocation basis is more or less than budgeted allocation
basis In the Burch Company example, the actual allocation basis was 928 consulting hours. Compared to 1,100 budgeted hours, overhead costs should have been underapplied by $17,200 (1,100 – 928 hours x $100 rate). However, budgeted overhead costs were $110,000, but actual overhead costs were only $89,350. Hence, costs were $20,650 lower than expected. As a result, overhead costs were overapplied by $3,450 ($20,650 – 17,200).
Page M40
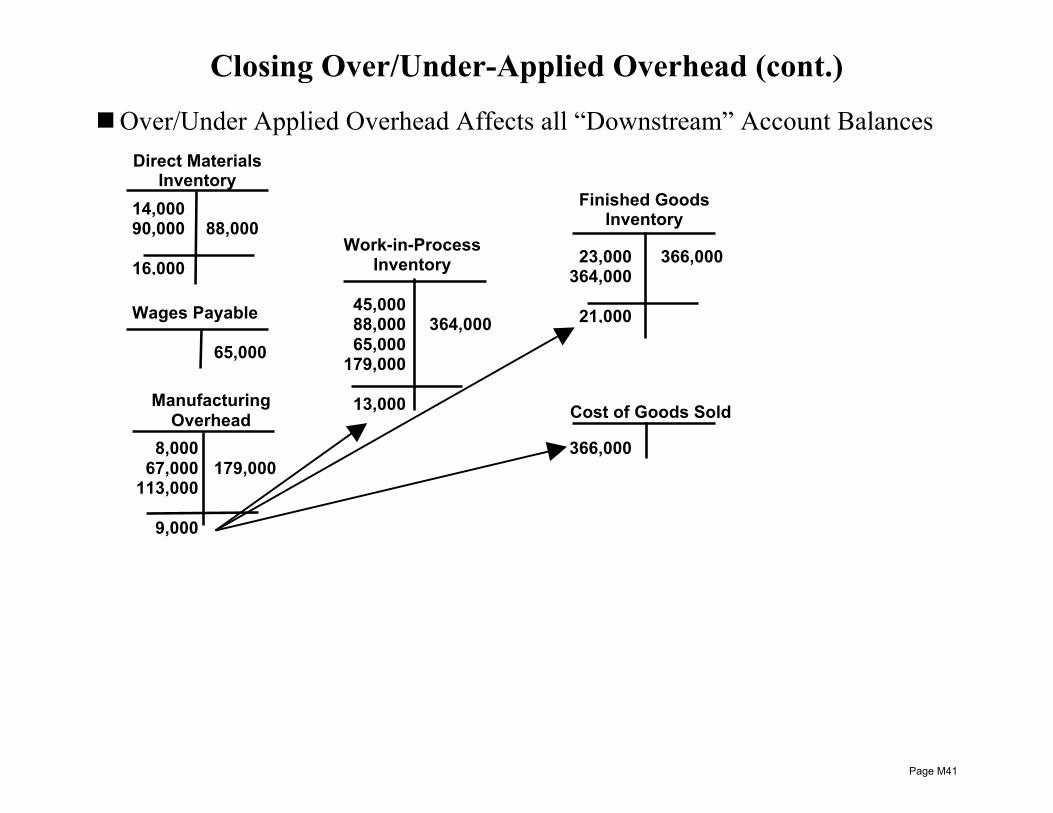
Closing Over/Under-Applied Overhead (cont.)
n Over/Under Applied Overhead Affects all “Downstream” Account Balances
179,000
Work-in-Process Inventory
Cost of Goods Sold
Wages Payable
Finished Goods Inventory
Manufacturing Overhead
14,000 90,000
16,000
Direct Materials Inventory
88,000
45,000 88,000 65,000
179,000
13,000
65,000
8,000 67,000
113,000
9,000
364,000
366,000
23,000 364,000
21,000
366,000
Page M41
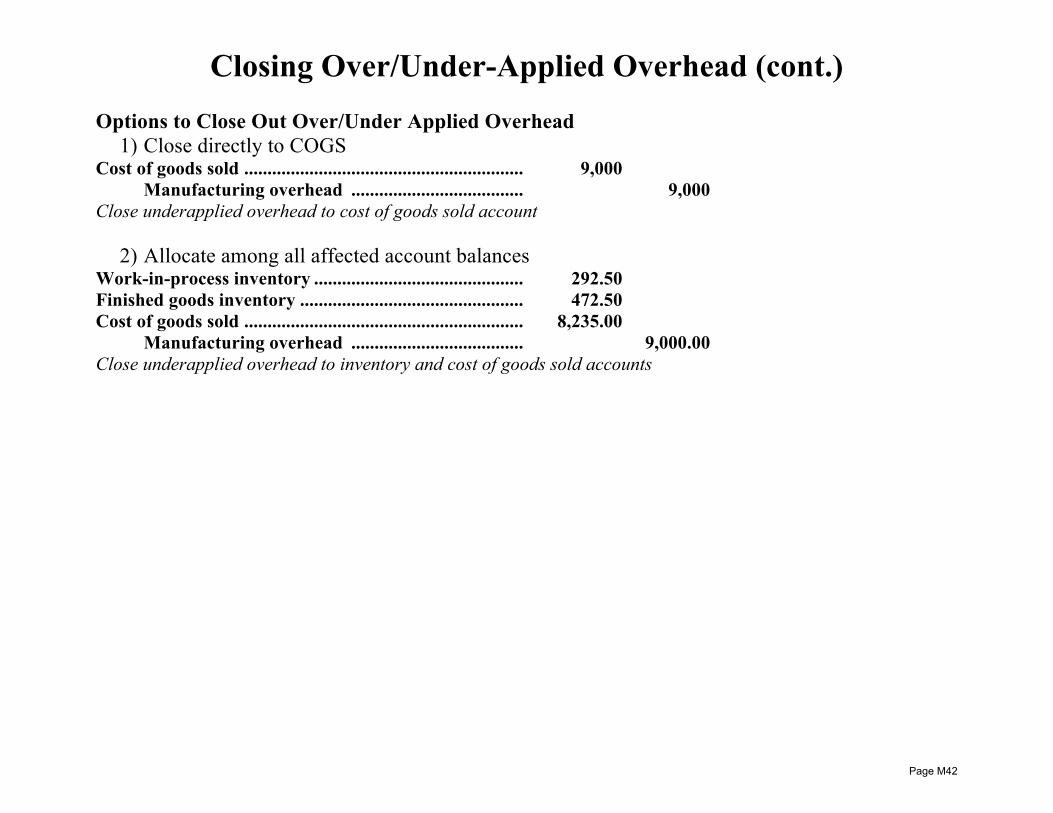
Closing Over/Under-Applied Overhead (cont.) Options to Close Out Over/Under Applied Overhead
1) Close directly to COGS Cost of goods sold ............................................................ 9,000 Manufacturing overhead ..................................... 9,000 Close underapplied overhead to cost of goods sold account
2) Allocate among all affected account balances
Work-in-process inventory ............................................. 292.50 Finished goods inventory ................................................ 472.50 Cost of goods sold ............................................................ 8,235.00 Manufacturing overhead ..................................... 9,000.00 Close underapplied overhead to inventory and cost of goods sold accounts
Page M42
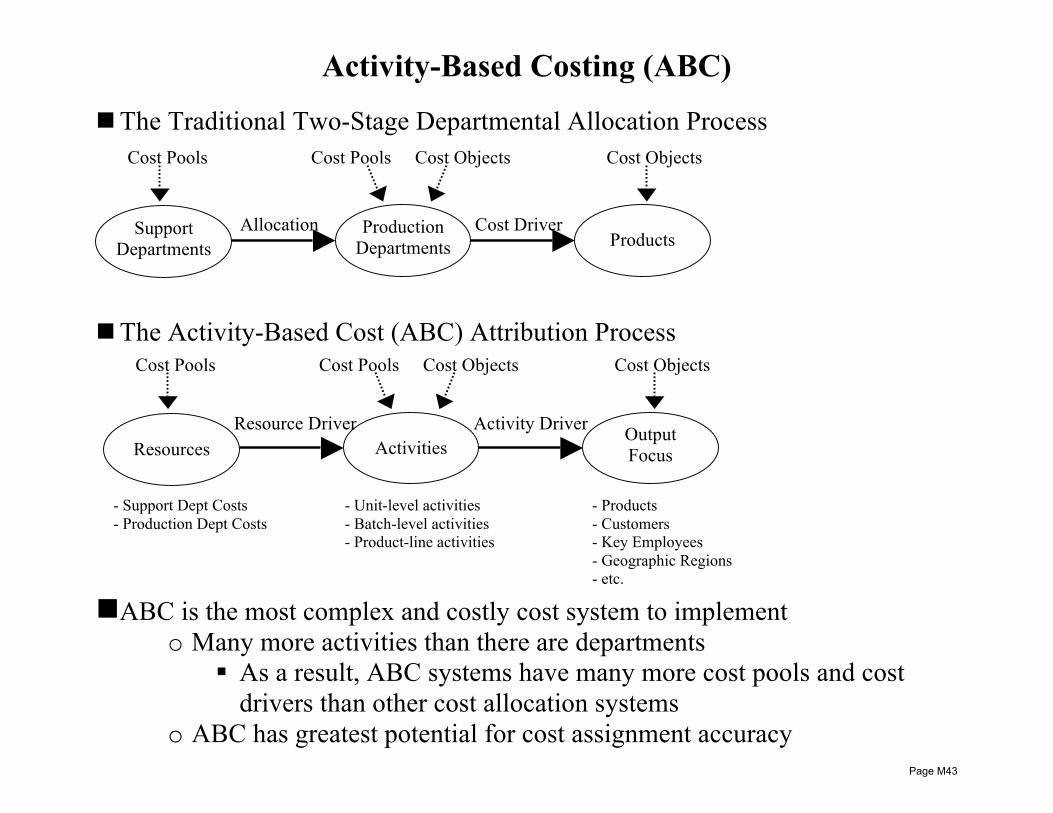
Activity-Based Costing (ABC) n The Traditional Two-Stage Departmental Allocation Process
n The Activity-Based Cost (ABC) Attribution Process
n ABC is the most complex and costly cost system to implement
o Many more activities than there are departments § As a result, ABC systems have many more cost pools and cost
drivers than other cost allocation systems o ABC has greatest potential for cost assignment accuracy
Activities Output Focus Resources
Resource Driver Activity Driver
Cost Pools Cost Pools Cost Objects Cost Objects
- Support Dept Costs - Production Dept Costs
- Unit-level activities - Batch-level activities - Product-line activities
- Products - Customers - Key Employees - Geographic Regions - etc.
Production Departments Products Support
Departments Allocation Cost Driver
Cost Pools Cost Pools Cost Objects Cost Objects
Page M43

Motivation for ABC n Simple is Not Always Best!
o Simple cost allocation systems (i.e., plantwide or departmental) can do great damage in complex organizations with many diversified product lines
n Activity Focus
o Emphasizing an activity view of the organization (versus a departmental view) has the advantage of identifying value-added and non-valued-added activities
n Product Cost Cross-Subsidization
o Costs that are created as a result of the demands of one product are assigned to another product
o In other words, the costs of some products are being subsidized by other products
n Product Cost “Death Spiral”
o Cost having no relationship to products are still allocated “like peanut butter” across all products
o Because of an erroneous income loss reports, products are dropped
n Severe operational and strategic results take place when accounting systems report some products as more or less costly than actuality
Page M44

ABC Hierarchy n The Object of ABC is to Identify One-dimensional Relationships between
Costs and Activities
o Many activities do not have one-to-one relationships with production output volumes
o Many activities do have one-to-one relationships with the volume of batches (e.g., quality inspection) or the number of product lines (e.g., engineering design)
Activities Output Focus Resources
Resource Driver Activity Driver
Total Production Costs
Cost Traceable to Specific Products • Unit Level Activities: direct labor, direct
materials, utility costs, etc. • Batch Level Activities: purchase ordering,
setups, materials handling, etc. • Product-Line Level Activities: engineering,
inventory management, training, etc.
Common Costs • Facility Level Activities: plant security,
property taxes, general administration, etc. Page M45
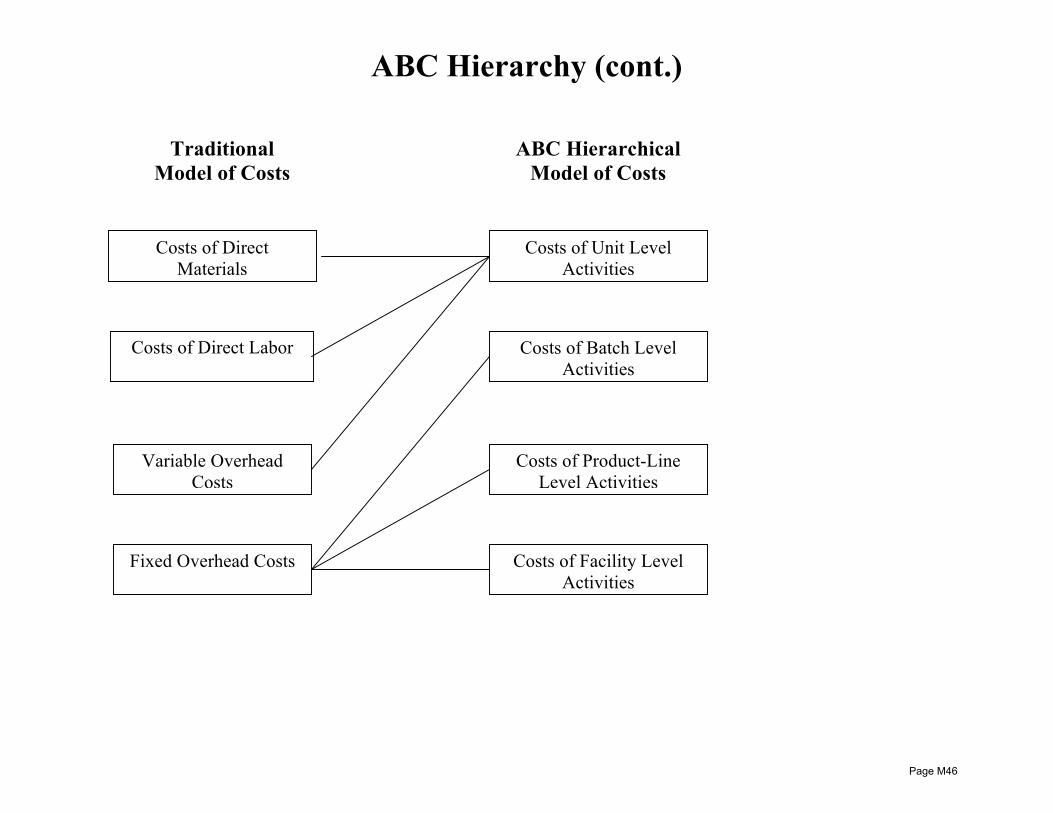
ABC Hierarchy (cont.)
Costs of Direct Materials
Costs of Direct Labor
Variable Overhead Costs
Fixed Overhead Costs Costs of Facility Level Activities
Costs of Product-Line Level Activities
Costs of Batch Level Activities
Costs of Unit Level Activities
Traditional Model of Costs
ABC Hierarchical Model of Costs
Page M46
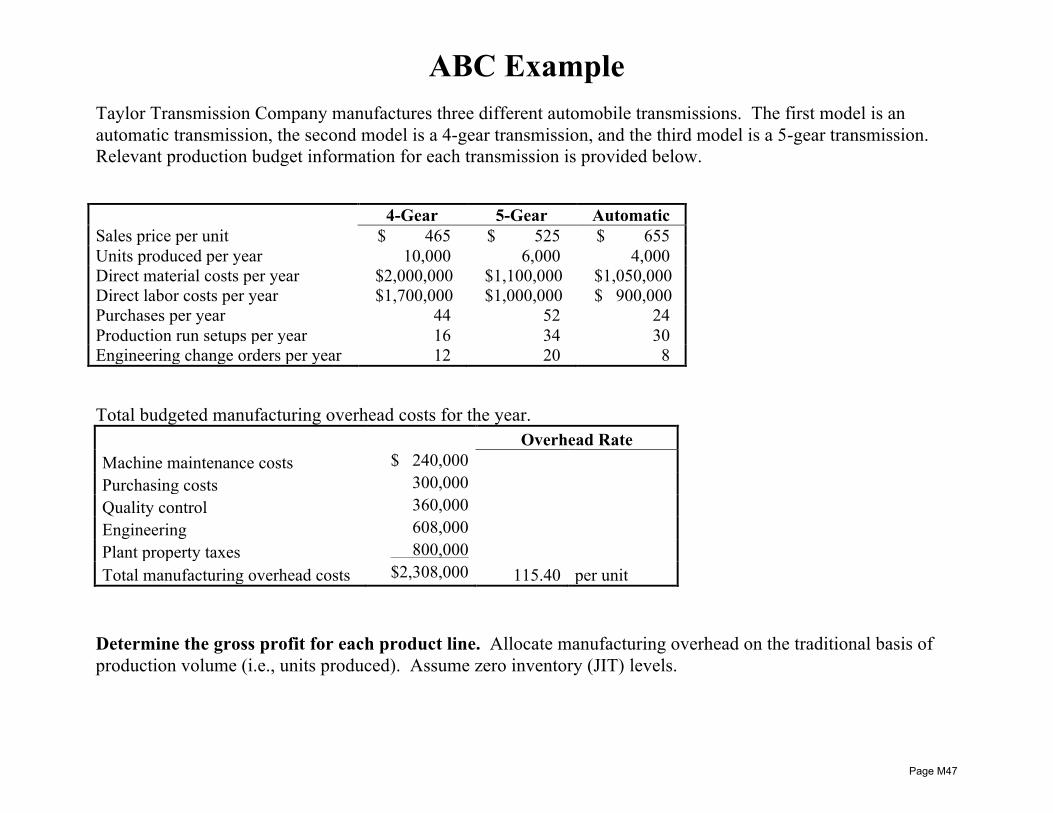
ABC Example Taylor Transmission Company manufactures three different automobile transmissions. The first model is an automatic transmission, the second model is a 4-gear transmission, and the third model is a 5-gear transmission. Relevant production budget information for each transmission is provided below. 4-Gear 5-Gear Automatic Sales price per unit $ 465 $ 525 $ 655 Units produced per year 10,000 6,000 4,000 Direct material costs per year $2,000,000 $1,100,000 $1,050,000 Direct labor costs per year $1,700,000 $1,000,000 $ 900,000 Purchases per year 44 52 24 Production run setups per year 16 34 30 Engineering change orders per year 12 20 8 Total budgeted manufacturing overhead costs for the year. Overhead Rate Machine maintenance costs $ 240,000 Purchasing costs 300,000 Quality control 360,000 Engineering 608,000 Plant property taxes 800,000 Total manufacturing overhead costs $2,308,000 115.40 per unit
Determine the gross profit for each product line. Allocate manufacturing overhead on the traditional basis of production volume (i.e., units produced). Assume zero inventory (JIT) levels.
Page M47
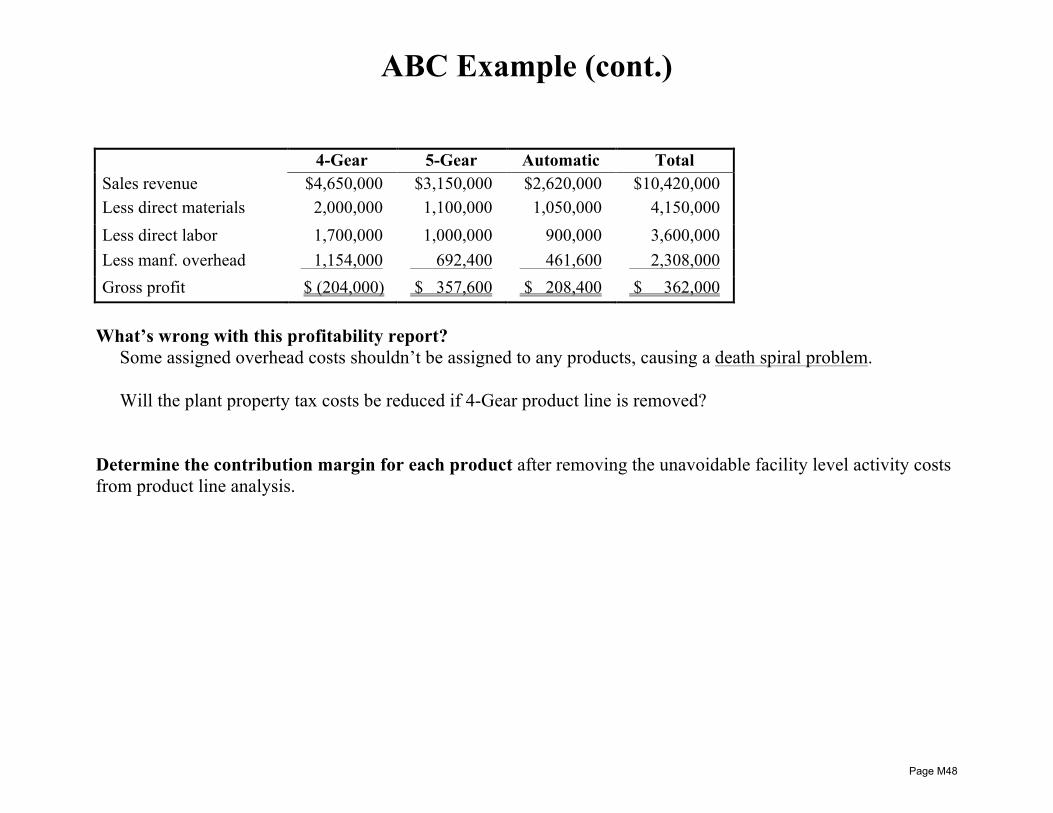
ABC Example (cont.) 4-Gear 5-Gear Automatic Total Sales revenue $4,650,000 $3,150,000 $2,620,000 $10,420,000 Less direct materials 2,000,000 1,100,000 1,050,000 4,150,000 Less direct labor 1,700,000 1,000,000 900,000 3,600,000 Less manf. overhead 1,154,000 692,400 461,600 2,308,000 Gross profit $ (204,000) $ 357,600 $ 208,400 $ 362,000
What’s wrong with this profitability report?
Some assigned overhead costs shouldn’t be assigned to any products, causing a death spiral problem. Will the plant property tax costs be reduced if 4-Gear product line is removed?
Determine the contribution margin for each product after removing the unavoidable facility level activity costs from product line analysis.
Page M48
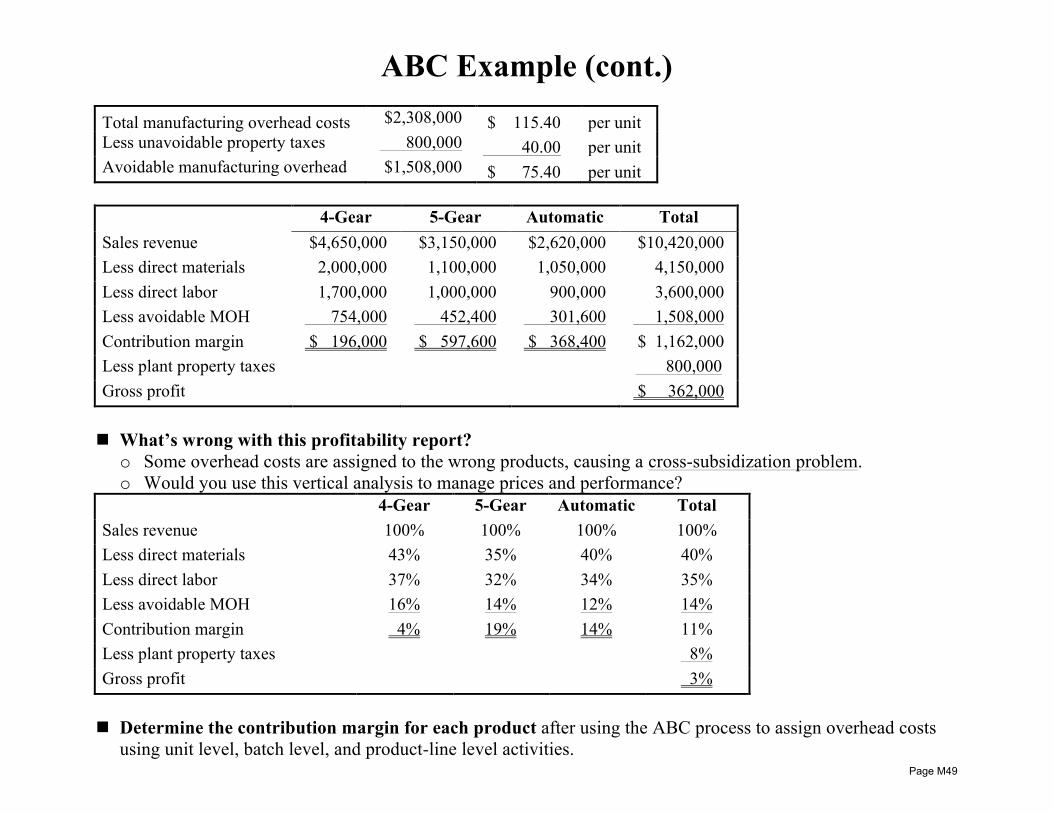
ABC Example (cont.) Total manufacturing overhead costs $2,308,000 $ 115.40 per unit Less unavoidable property taxes 800,000 40.00 per unit Avoidable manufacturing overhead $1,508,000 $ 75.40 per unit
4-Gear 5-Gear Automatic Total Sales revenue $4,650,000 $3,150,000 $2,620,000 $10,420,000 Less direct materials 2,000,000 1,100,000 1,050,000 4,150,000 Less direct labor 1,700,000 1,000,000 900,000 3,600,000 Less avoidable MOH 754,000 452,400 301,600 1,508,000 Contribution margin $ 196,000 $ 597,600 $ 368,400 $ 1,162,000 Less plant property taxes 800,000 Gross profit $ 362,000
n What’s wrong with this profitability report?
o Some overhead costs are assigned to the wrong products, causing a cross-subsidization problem. o Would you use this vertical analysis to manage prices and performance?
4-Gear 5-Gear Automatic Total Sales revenue 100% 100% 100% 100% Less direct materials 43% 35% 40% 40% Less direct labor 37% 32% 34% 35% Less avoidable MOH 16% 14% 12% 14% Contribution margin 4% 19% 14% 11% Less plant property taxes 8% Gross profit 3%
n Determine the contribution margin for each product after using the ABC process to assign overhead costs
using unit level, batch level, and product-line level activities. Page M49

ABC Example (cont.) Overhead Rates
Machine maintenance costs $ 240,000 12.00 per unit (unit level)
Purchasing costs 300,000 2,500.00 per purchase (batch level)
Quality control 360,000 4,500.00 per setup (batch level)
Engineering 608,000 15,200.00 per change (product-line level) Total avoidable MOH costs $1,508,000
4-Gear 5-Gear Automatic Total Sales revenue $4,650,000 $3,150,000 $2,620,000 $10,420,000 Less direct materials 2,000,000 1,100,000 1,050,000 4,150,000 Less direct labor 1,700,000 1,000,000 900,000 3,600,000 Less maintenance overhead 120,000 72,000 48,000 240,000 Less purchasing overhead 110,000 130,000 60,000 300,000 Less quality control overhead 72,000 153,000 135,000 360,000 Less engineering overhead 182,400 304,000 121,600 608,000 Contribution margin $ 465,600 $ 391,000 $ 305,400 $ 1,162,000 Less plant property taxes 800,000 Gross profit $ 362,000
Page M50

ABC Example (cont.) 4-Gear 5-Gear Automatic Total Sales revenue 100% 100% 100% 100% Less direct materials 43% 35% 40% 40% Less direct labor 37% 32% 34% 35% Less maintenance overhead 3% 2% 2% 2% Less purchasing overhead 2% 4% 2% 3% Less quality control overhead 2% 5% 5% 3% Less engineering overhead 4% 10% 5% 6% Contribution margin 10% 12% 12% 11% Less plant property taxes 8% Gross profit 3%
Is this information useful for management?
Page M51
Unit B Topic 5 Behavioral Issues in Developing Budgets and Standards
Learning Objectives: • differentiate between authoritative (top-down) and participative (bottom-up) processes for developing budgets and
standards • identify the advantages and disadvantages of authoritative budget/standards development • describe the likely behavior of employees responsible for implementing and achieving authoritative budgets and
standards • describe the role that top management should play in an effective participative budget process • identify the advantages and disadvantages of participative budget and standards development • describe the likely behavior of employers responsible for implementing and achieving participative budgets and
standards • demonstrate an understanding of the role that communication plays in effective budgeting and standard setting • define the term budgetary slack • describe how budgetary slack can have both positive and negative effects on the budgeting process • describe the behavioral issues that should be considered when adopting ideal (theoretical) standards • describe the likely behavior of employees being measured by practical (currently attainable) standards • recognize that feedback provides the link between planning, control, and evaluation • recognize that the timing and frequency of feedback is dependent on how critical the measures are to the success of the
business • demonstrate an understanding of the purposes of feedback and alternative means of feedback such as reports,
interviews, and team meetings
Page M52
Authoritative vs. Participative Budgeting
n Authoritative Budgeting is a Top-Down Process o Top management prepares budgets for the entire organization
n Advantages o Better decision-making control o Less costly and faster to prepare
n Disadvantages o Those responsible often lack commitment o Can cause resentment and lack of effort o Poor communication device
§ Instead, it’s a one-way command process
Page M53

Authoritative vs. Participative Budgeting (cont.)
n Participative Budgeting is a Bottom-Up Process o Involves everyone (lower- and mid-level managers)
n Advantages o Encourages goal congruence o Better commitment to the budget o Better information on which to prepare the budget o Provides communication of issues to top management
n Disadvantages o Costly and time-intensive o Political maneuvering o Employees may perceive top management as uninvolved and uncommitted to
the budget o Creation of budgetary slack
n Effective Budgeting tries to combines both Authoritative and Participative Processes
o Typical process 1. Divisions prepare initial budgets 2. Top management reviews and comments 3. Divisions make revisions
Page M54

Budgeting Behavior
n Budgetary Slack o Excess of resource inputs requested over the actual resources necessary o Shortage of production outputs committed below the actual outputs
possible
n Managing Budgetary Slack o Significant involvement by top management in understanding the
business processes, including resource inputs and production outputs, can help minimize slack
o A pattern by top management of consistently adjusting submitted budgets can encourage slack
Page M55
Budget Standards
n Ideal Standards o Demands perfect implementation and maximum efficiency o Uncontrollable external factors can undermine attainment of ideal
standards o Over the long run, ideal standards put stress on the organization, which
leads to moral and productivity problems o Ideal standards can be used infrequently for certain situations
§ Severe economic or competitive pressures o Ideal standards can be constantly used if performance is measured in
terms of progress rather than attainment (the Kaizen principle)
n Currently Attainable (Practical) Standards o These standards can be attained most of the time given proper training,
equipment, and experience o Practical standards include, by definition, some expected inefficiencies o Budgets based on practical standards are more susceptible to budgetary
slack o Constant use of practical standards can lead to problems staying
competitive
Page M56
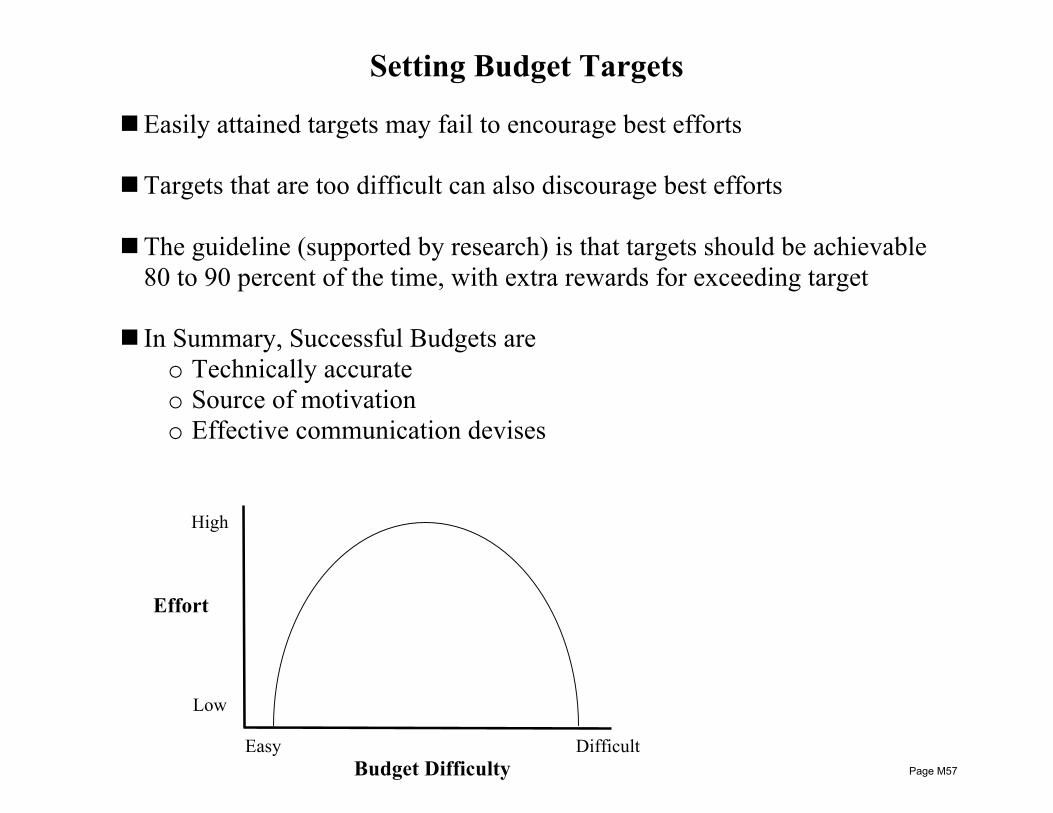
Setting Budget Targets
n Easily attained targets may fail to encourage best efforts n Targets that are too difficult can also discourage best efforts
n The guideline (supported by research) is that targets should be achievable
80 to 90 percent of the time, with extra rewards for exceeding target n In Summary, Successful Budgets are
o Technically accurate o Source of motivation o Effective communication devises
Effort
High
Low
Easy Difficult Budget Difficulty Page M57

Unit B Topic 1 Planning Processes
Learning Objectives: • demonstrate an understanding that strategic planning determines the path an organization chooses for attaining its
long-term goals and missions • identify the time frame appropriate for a strategic plan • identify the external factors that should be analyzed during the strategic planning process and understand how this
analysis leads to recognition of organizational opportunities, limitations, and threats • identify the internal factors that should be analyzed during the strategic planning process and understand how this
analysis leads to recognition of organizational strengths, weaknesses, and competitive advantages • demonstrate an understanding that the analysis of external and internal factors leads to the development of the overall
organizational mission and that this mission leads to the formulation of long-term business objectives such as business diversification, the addition or deletion of product lines, or the penetration of new markets
• recognize the role of capital budgeting and capacity planning in the strategic planning process • recognize that short-term objectives, tactics for achieving these objectives, and operational planning (master budget)
must be congruent with the strategic plan and contribute to the achievement of long-term strategic goals • define value chain analysis • identify the steps in value chain analysis • show how value chain analysis is used to better understand a firm’s competitive advantage • define contingency planning • demonstrate an understanding of the importance of contingency planning, particularly where changes in external
factors might adversely impact strategic plans
Page M58
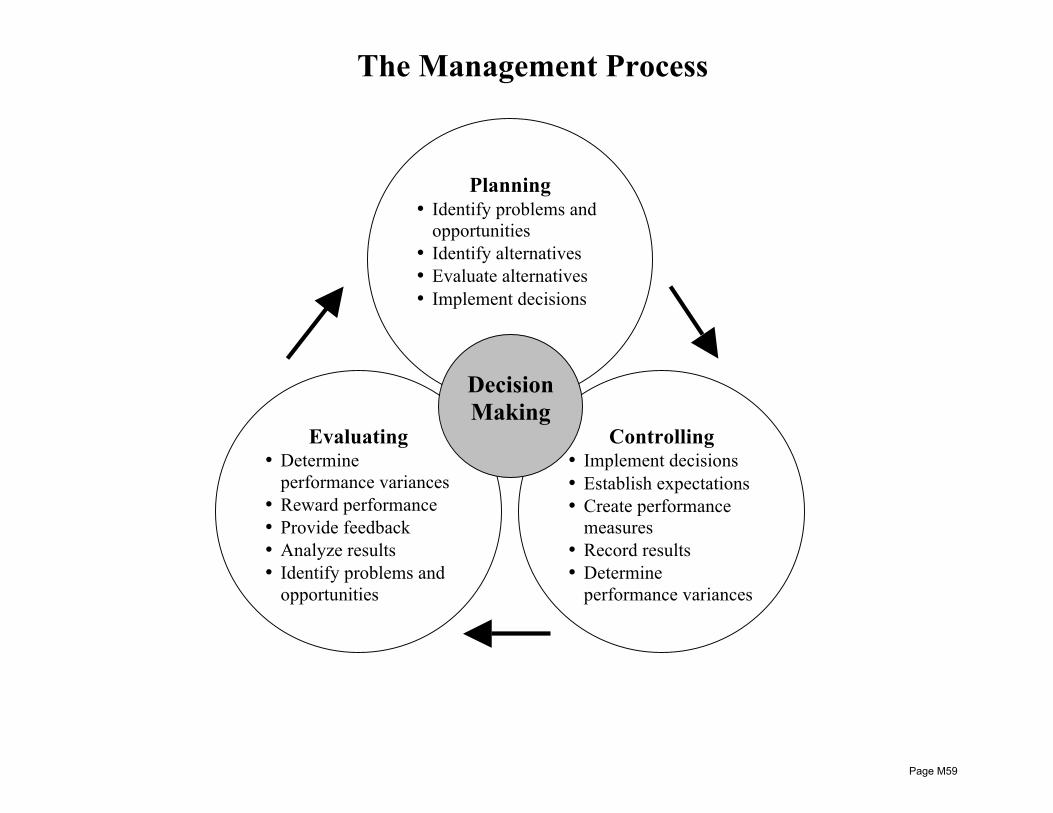
The Management Process
Planning • Identify problems and
opportunities • Identify alternatives • Evaluate alternatives • Implement decisions
Evaluating • Determine
performance variances • Reward performance • Provide feedback • Analyze results • Identify problems and
opportunities • Learn!
Controlling • Implement decisions • Establish expectations • Create performance
measures • Record results • Determine
performance variances
Decision Making
Page M59

Planning
n Long-Run Planning (3- to 5-year horizon, or more) o Strategic Planning
§ Executive-level decision making § Assess the competitive market (external) and organization mission
(internal) § Formulate the action steps
o Capital Budgeting § With strategic plans in place, decisions regarding long-term capital
assets § Sometimes called structure planning and purchase
n Short-Run Planning (current period horizon) o Production and process prioritization
§ With capital structure commitments in place, decisions regarding how to maximize the return on capital investments
§ Results in prioritized goods and services for the current market o Operational budgeting (profit planning)
§ With current period priorities in place, development of operational budgets and schedules
§ Used to establish and communicate daily/weekly/monthly goals (i.e., standards)
Page M60
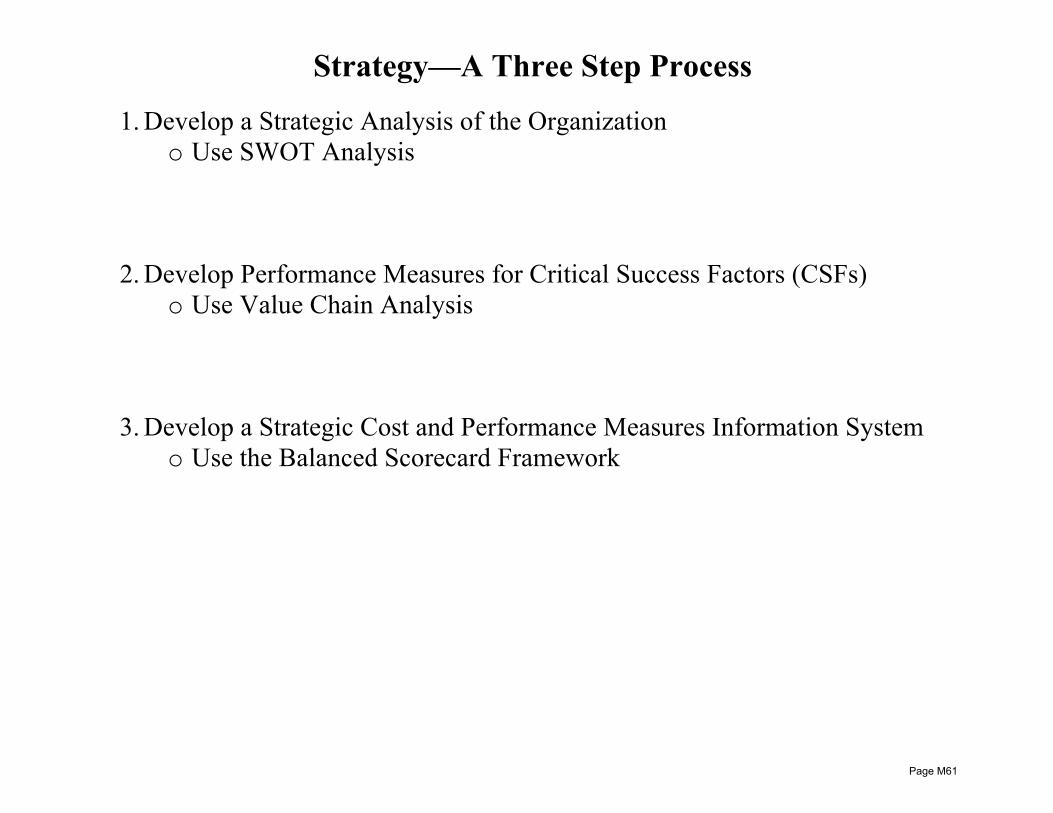
Strategy—A Three Step Process
1. Develop a Strategic Analysis of the Organization o Use SWOT Analysis
2. Develop Performance Measures for Critical Success Factors (CSFs) o Use Value Chain Analysis
3. Develop a Strategic Cost and Performance Measures Information System o Use the Balanced Scorecard Framework
Page M61
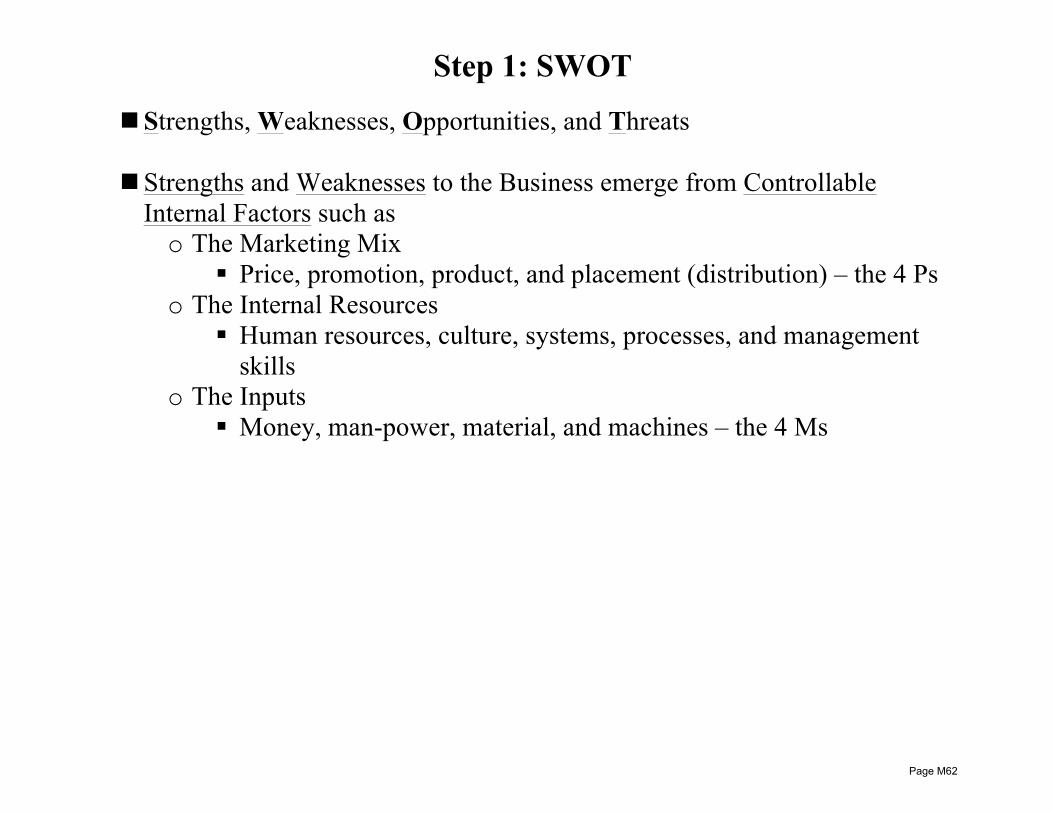
Step 1: SWOT
n Strengths, Weaknesses, Opportunities, and Threats n Strengths and Weaknesses to the Business emerge from Controllable
Internal Factors such as o The Marketing Mix
§ Price, promotion, product, and placement (distribution) – the 4 Ps o The Internal Resources
§ Human resources, culture, systems, processes, and management skills
o The Inputs § Money, man-power, material, and machines – the 4 Ms
Page M62
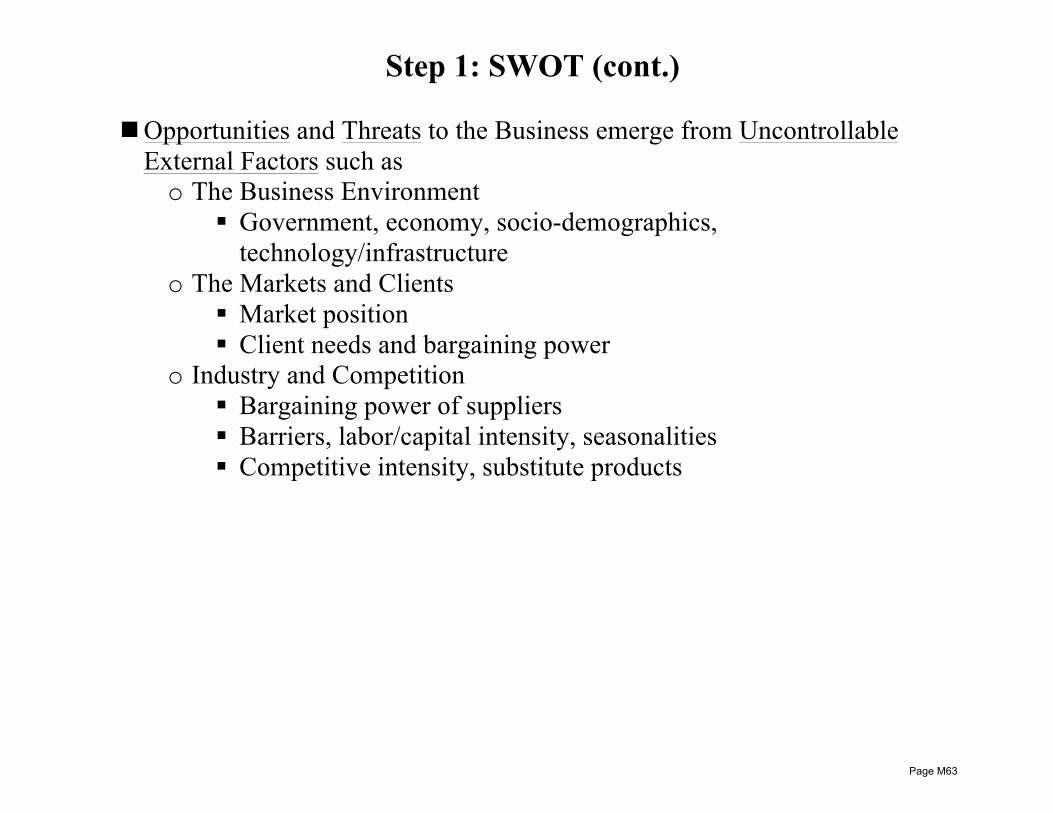
Step 1: SWOT (cont.) n Opportunities and Threats to the Business emerge from Uncontrollable
External Factors such as o The Business Environment
§ Government, economy, socio-demographics, technology/infrastructure
o The Markets and Clients § Market position § Client needs and bargaining power
o Industry and Competition § Bargaining power of suppliers § Barriers, labor/capital intensity, seasonalities § Competitive intensity, substitute products
Page M63
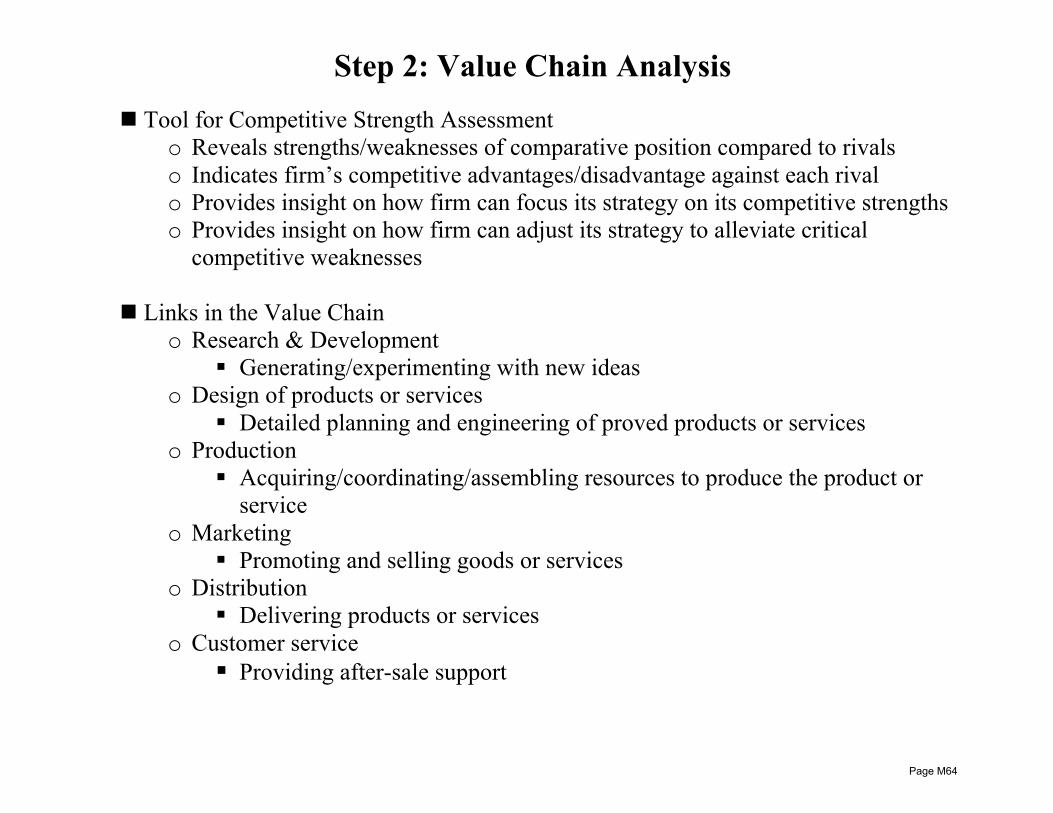
Step 2: Value Chain Analysis
n Tool for Competitive Strength Assessment o Reveals strengths/weaknesses of comparative position compared to rivals o Indicates firm’s competitive advantages/disadvantage against each rival o Provides insight on how firm can focus its strategy on its competitive strengths o Provides insight on how firm can adjust its strategy to alleviate critical
competitive weaknesses
n Links in the Value Chain o Research & Development
§ Generating/experimenting with new ideas o Design of products or services
§ Detailed planning and engineering of proved products or services o Production
§ Acquiring/coordinating/assembling resources to produce the product or service
o Marketing § Promoting and selling goods or services
o Distribution § Delivering products or services
o Customer service § Providing after-sale support
Page M64
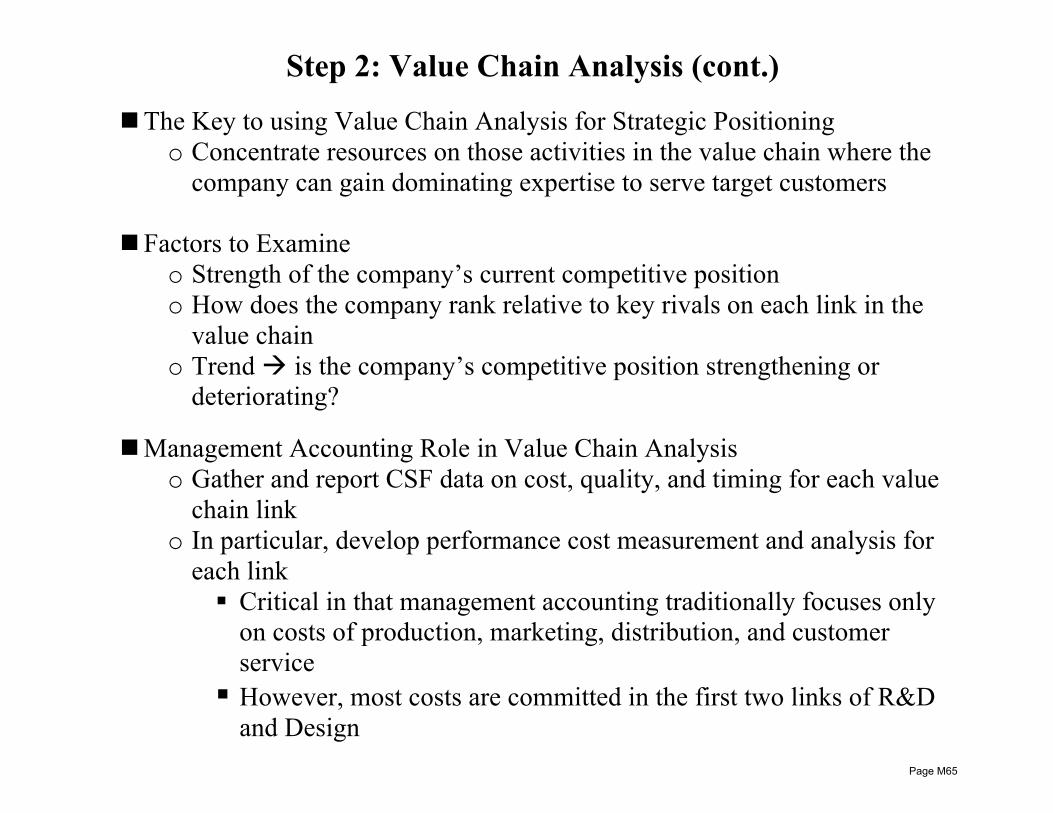
Step 2: Value Chain Analysis (cont.)
n The Key to using Value Chain Analysis for Strategic Positioning o Concentrate resources on those activities in the value chain where the
company can gain dominating expertise to serve target customers
n Factors to Examine o Strength of the company’s current competitive position o How does the company rank relative to key rivals on each link in the
value chain o Trend à is the company’s competitive position strengthening or
deteriorating?
n Management Accounting Role in Value Chain Analysis o Gather and report CSF data on cost, quality, and timing for each value
chain link o In particular, develop performance cost measurement and analysis for
each link § Critical in that management accounting traditionally focuses only
on costs of production, marketing, distribution, and customer service
§ However, most costs are committed in the first two links of R&D and Design
Page M65
Step 3: The Balanced Scorecard
n Critical Success Factors (CSF) can be Organized and Linked as Performance Measures across Four Areas o Financial factors
§ Examples: profitability, liquidity, sales, market value o Customer factors
§ Examples: customer satisfaction, dealer/distributor strength, marketing/selling o Internal Business factors
§ Examples: quality, timeliness, productivity, flexibility, process efficiency, safety o Learning and Growth factors
§ Examples: product innovation, skill development, morale, communication
Page M66
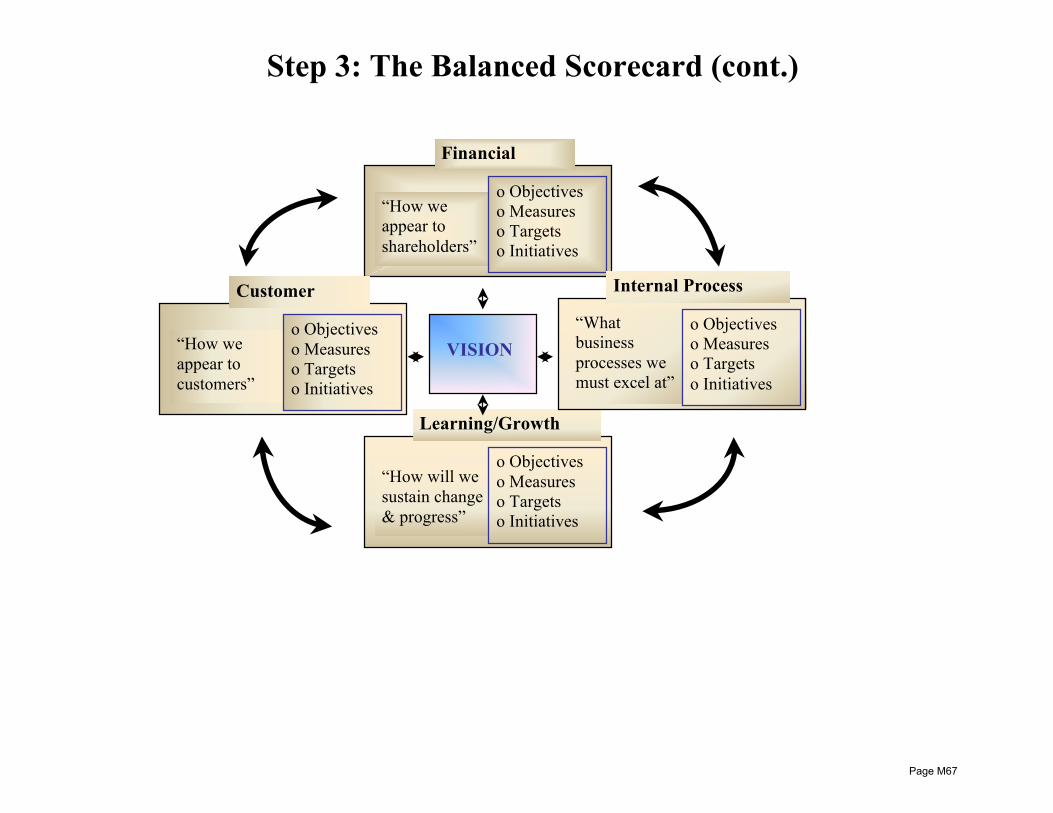
Step 3: The Balanced Scorecard (cont.)
“How we appear to shareholders”
o Objectives o Measures o Targets o Initiatives
Financial
“How we appear to customers”
o Objectives o Measures o Targets o Initiatives
Customer
“How will we sustain change & progress”
o Objectives o Measures o Targets o Initiatives
Learning/Growth
“What business processes we must excel at”
o Objectives o Measures o Targets o Initiatives
Internal Process
VISION
Page M67

Contingency Planning
n Risk Management o A broad range of activities to identify, control, and mitigate risks to the
business n Risks to the Business
o Natural disasters o Human error or sabotage o Technological breakdowns o Change in regulation o Disruptive technologies o Competitor shifts o Economic downturns
n Contingency Plans o Conduct business impact analysis (BIA) o Identify preventative controls (if possible) o Develop recovery operation plans or adaptation strategic plans o Train management and personnel o Maintain the plan (regular updates)
Page M68
Unit B Topic 2 Planning and Budgeting Concepts
Learning Objectives: • demonstrate an understanding of the role that budgeting plays in formulating short-term objectives and planning and
controlling operations to meet those objectives • identify the characteristics that define successful budgeting • demonstrate an understanding of the role that budgets play in measuring performance against established goals • show how the budgeting process facilitates communication among organizational units • demonstrate how the budgeting process enhances coordination of organizational activities • define a responsibility center (strategic business unit) and identify various types of responsibility centers (strategic
business units) • explain the concept of a controllable cost as it relates to both budgeting and performance evaluation • prepare an operational budget for a responsibility center (strategic business unit) • demonstrate an understanding of the concept of management-by-objective and how it relates to performance evaluation • identify the benefits and limitations of management-by-objective • demonstrate an understanding of how the planning process coordinates the efficient allocation of organizational
resources • recognize the appropriate time frame for various types of budgets • identify who should participate in the budgeting process for optimum success • describe the role of top management in successful budgeting • identify the role of top management or the budget committee in providing appropriate guidelines for the budget and
identify items that should be included in these guidelines • demonstrate an understanding of the use of cost standards in budgeting • differentiate between ideal standards and currently attainable standards • differentiate between authoritative standards and participative standards • identify the steps to be taken in developing standards for both direct material and direct labor • define the role of benchmarking in standard setting • identify the benefits of benchmarking in creating a competitive advantage • show an understanding of the need to have a policy that allows budget revisions that accommodate the impact of
significant changes in budget assumptions
Page M69
The Role of Budgeting
n Successful Budgeting Factors o Compels strategic planning and implementation of plans
§ Also provides feedback on the strategy o Provides a framework for judging performance
§ Past performance is a poor measuring stick § Past results incorporate miscues and substandard performance § Future conditions may be different from the past
o Motivates managers and employees § Challenging goals can improve performance § Unreasonable goals create anxiety without motivation
o Establishes communication among subunits within the organization § Communication is getting goals to be understood in meaningful
terms and establishing expectations among and between people and business units
§ Coordination is meshing and balancing all factors of production or service
o Promotes coordination of shared resources § All resources are limited and must be assigned (allocated) to
business units that provide the most strategic value
Page M70
Responsibility Accounting
n Responsibility Centers o Subunits of an organization whose managers are accountable for
specific set of activities o The organizational chart defines the responsibility centers for a
particular company o Responsibility centers are also called strategic business units (SBUs)
n Responsibility Accounting o A system that reports plans (budgets) and actions (results) for each
responsibility center o Key point: Costs and activities assigned to the responsibility of the
SBU are controllable by the SBU
n Types of Responsibility Centers (defined by accountability, i.e., controllability) o Cost Center: Manager is accountable for costs only o Revenue Center: Manager is accountable for revenues only o Profit Center: Manager is accountable for both costs and revenues o Investment Center: Manager is accountable for costs, revenues, and
investments (i.e., assets)
Page M71

Management-by-Objective
n Performance Evaluation and Control o Operational Control is the evaluation of operating level employees by
mid-level managers § Focus on short-term performance
o Management Control is the evaluation of mid-level managers by upper-level managers § Focus on long-term strategic issues
n Operational Control follows a Management-by-Exception Approach o Identification of units or individuals whose performance is not in
compliance with expectations (variance analysis) o Correct the problem efficiently and effectively
n Management Control follows a Management-by-Objective Approach o Establish long-term strategic objectives (i.e., growth, customer
satisfaction, employee development) and periodically measure against these goals
Page M72
Management-by-Objective (cont.)
n Objectives of Management Control o Motivate mid-level managers to focus on organizational goals
(strategies) o Provide incentives to mid-level managers to make decisions consistent
with organizational goals o Fairly determine the rewards that managers receive for effort and
effective decision-making
n Challenges of Management-by-Objective Systems o Uncertainty
§ Unavoidable internal factors (e.g., machine breakdowns) and unexpected external factors (e.g., market demand) create uncertainty about the effectiveness of the manager’s actions
o Lack of observability § Mid-level managers often possess private information not known
by top-level management § Efforts and most decisions of mid-level managers are unobservable
n Bottom Line: Evaluating SBUs based solely on outcomes creates efficiency and equity problems in the performance evaluation system
Page M73
Management-by-Objective (cont.) n Three Principles of Effective Employment Contracting
1. Separate the outcome of the manager’s action from the effort and decision-making skill of the manager § The performance of the manager ≠ the performance of the SBU
2. Exclude known uncontrollable factors from the performance evaluation § Obviously, fairness is still not guaranteed
3. Make adjustments for the expected risk aversion of the manager § Because of uncertainty, managers are biased to avoid decisions
with uncertain outcomes § In contrast, top-level managers have a greater tolerance for risk in
decisions that don’t affect them personally n Budgetary Slack
o Overestimating expensing and underestimating sales o Effective employment contracting helps minimize budgetary slack
Page M74
Time Coverage of Budgets n Long-Term Planning
o Strategy analysis and capital budgeting o 3- to 5-year horizon (or more)
n Master Budgets o Includes operating budgets and financial budgets o Time frame depends on the purpose of the project/process/SBU being
budgeted § A large construction project or total profitability of a new product
line may have a budget extending over several years § The budget for a small construction project or special research
project may only last for several months o Traditional time horizons are one year
§ Subdivided by months for the first quarter § Subdivided by quarters for remaining year § Many organizations have 3- to 5-year annual budgets as well (these
are quite general)
n Rolling Budget (i.e., Continuous Budget) o Disciplines the organization to perpetually maintain the budget o Perpetually adds a month or quarter to the future budget as the month
or quarter just ended is dropped Page M75

Overview of the Master Budget
Sales Revenue Budget*
Selling and Administrative
Expense Budget*
Capital Expenditures
Budget
Cash Budget
Budgeted#
Balance Sheet
Budgeted# Statement of Cash Flows
Strategic Goals and
Plans
Short-Term Objectives
Manufacturing Overhead
Costs Budget*
Production Budget
Direct Labor Costs Budget*
Direct Materials Costs
Budget*
Costs of Goods Sold
Budget
Budgeted# Income
Statement * * * * *
*These budgets all flow into the Cash Budget
#Also known as pro forma financial statements
OPERATING
BUDGET
FINANCIAL
BUDGET
Capital Project Plans
Page M76
The Management Role in the Budgeting Process
n An Informal Simple Process in a Small Firm
n A Lengthy Procedure in a Large Organization n The Budget Committee
o Typically composed of CEO or designated VP, CFO, and heads of critical SBUs
n Budget Guidelines
o Set by budget committee o Determines the “tone” for the budgeting process o Based on multiple factors
§ Organization strategy § Outlook of the market and economy § Specific current period goals § Operating results of the year to date § Etc.
n Initial Budget Proposals o Each SBU provides its initial budget proposal
Page M77

The Management Role in the Budgeting Process (cont.)
n Budget Negotiation o Occur across all levels of the organization o The core of the budgeting process o Can take the bulk of the budget preparation time
n Review and Approval o Proposals are examined by budget committee for consistency with
guidelines o Budget is approved and submitted to the board of directors (if relevant)
n Revision o Uncertainty regarding internal and external factors creates need for
subsequent budget revisions o How (and if) budget revisions are accommodated is specific to the
organization § Periodic revision is an advantage in dynamic operations § Regular revisions may cause a loss of rigor in subsequent
budgeting processes
Page M78
Standard Costs
n The “Golfer’s Par” in the Operating Budget o A standard of performance o The foundation for planning and control within the budgeting process
n In Theory, standard costs exists for all production, selling, and administrative activities
n In Traditional Practice, standard costs exists for the direct materials, direct
labor, and production overhead budget o Direct costs are traced to production output by:
Standard prices x standard inputs allowed o Indirect costs are allocated to production output by:
Standard allocation rates x standard bases allowed o “Allowed” means what should have been used or allocated based on
actual production output
Page M79
Standard Costs (cont.)
n Ideal Standards o Perfect implementation and maximum efficiency o Use of ideal standards can be controversial o Best use is when ideal standards are used to measure improvement, not
attainment § The concept of continuous improvement (Kaizen)
n Currently Attainable (Normal) Standards
o Employees with proper training and experience can generally attain without extraordinary effort
o Assumes some inefficiencies and deviations o Can create problems in a highly competitive market
n Setting Standard Costs o Authoritative standards are “top down”
§ Used to ensure consideration of all operating factors and management expectations
§ Expedites the standard setting process o Participative standards involves everybody (“bottom up”)
§ Ensures that all available info is used § Helps establish “buy in” by all § Slows down the standard setting process
Page M80
Standard Costs (cont.) n Setting Standards for Direct Materials Costs
o Specify the Quality § Impacts quantity needed (scrap) § Processing time § Amount of supervision required
o Determine the Quantity § Purchase discounts and shipping/handling costs are included and are
impacted o Establish the price
§ Supplier negotiations/bidding, dependability of suppliers, commitments, etc.
n Setting Standards for Direct Labor Costs
o Assess the type of work and complexity of product or service o Determine the type and condition of equipment used o Determine the skill level of workers o Factor in strategy issues regarding company culture, labor unions, etc. o Includes fringe benefits and payroll taxes
n Setting Standards for Manufacturing Overhead Costs
o This is the predetermined overhead rate process o Perhaps the most complex standard cost issue
Page M81
Benchmarking n The Search for Best Practices both Within and Across Industries
o A theory of competition developed in the last 25 years o Used as a important mechanism for continuous improvement and
effective competition
n Benchmarking is a very effective means of establishing cost (and other performance) standards! o Can help avoid the tension between ideal and normal standards o Can help avoid the tension between authoritative and participative
standards
n The Benchmarking Process o Identify critical success factors (CSFs) o Study the best practices of competitors or organizations in other
industries (or other SBUs within the organization) o Implement improvements to beat the performance of competitors or to
match the performance of organizations in other industries § The idea of using benchmark standards from other industries is a
more recent and important innovation on the benchmarking process
Page M82
Unit B Topic 3 Types of Budget Systems
Learning Objectives: • For each of the budget systems identified (Annual/Master budgets, Project budgeting, Activity-based budgeting, Zero-
based budgeting, Continuous budgeting, Kaizen budgeting, and Flexible budgeting), the candidate should be able to: • define its purpose, appropriate use, and time frame • identify the budget components and explain the interrelationships among the components • demonstrate an understanding of how the budget is developed • compare and contrast the benefits and limitations of the budget system • calculate budget components on the basis of information presented • evaluate a business situation and recommend the appropriate budget solution
Page M83
Budgeting Systems
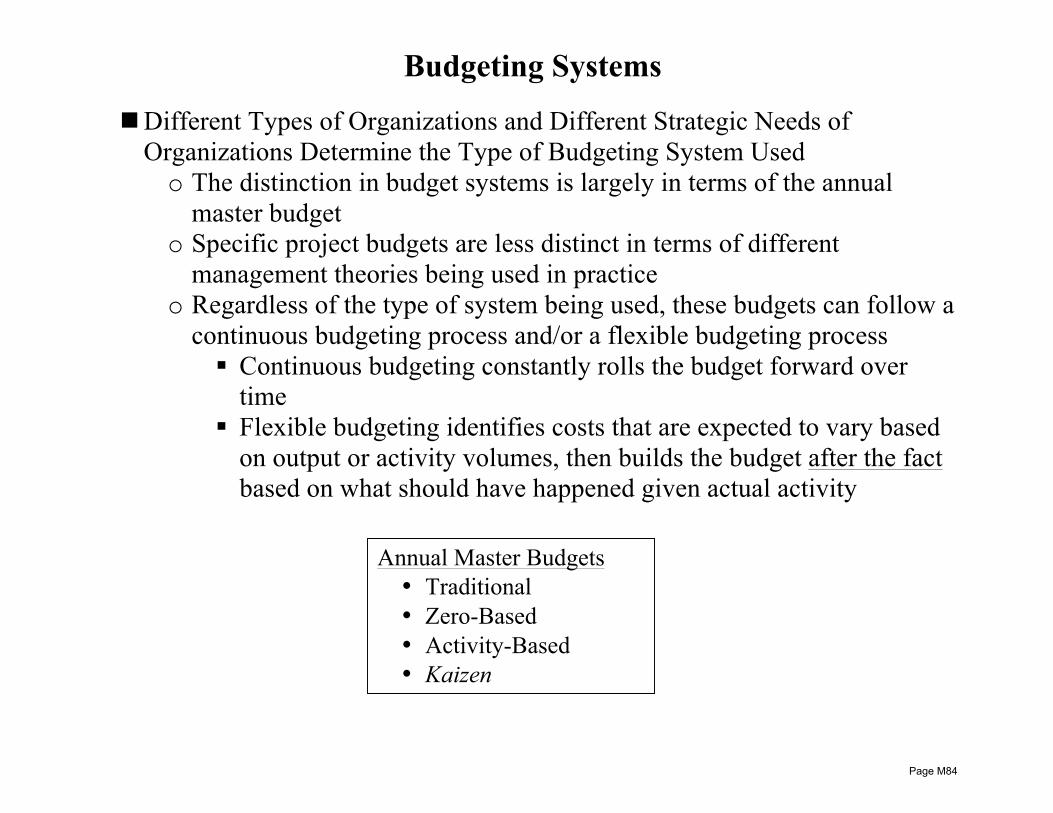
n Different Types of Organizations and Different Strategic Needs of Organizations Determine the Type of Budgeting System Used o The distinction in budget systems is largely in terms of the annual
master budget o Specific project budgets are less distinct in terms of different
management theories being used in practice o Regardless of the type of system being used, these budgets can follow a
continuous budgeting process and/or a flexible budgeting process § Continuous budgeting constantly rolls the budget forward over
time § Flexible budgeting identifies costs that are expected to vary based
on output or activity volumes, then builds the budget after the fact based on what should have happened given actual activity
Annual Master Budgets
• Traditional • Zero-Based • Activity-Based • Kaizen
Page M84
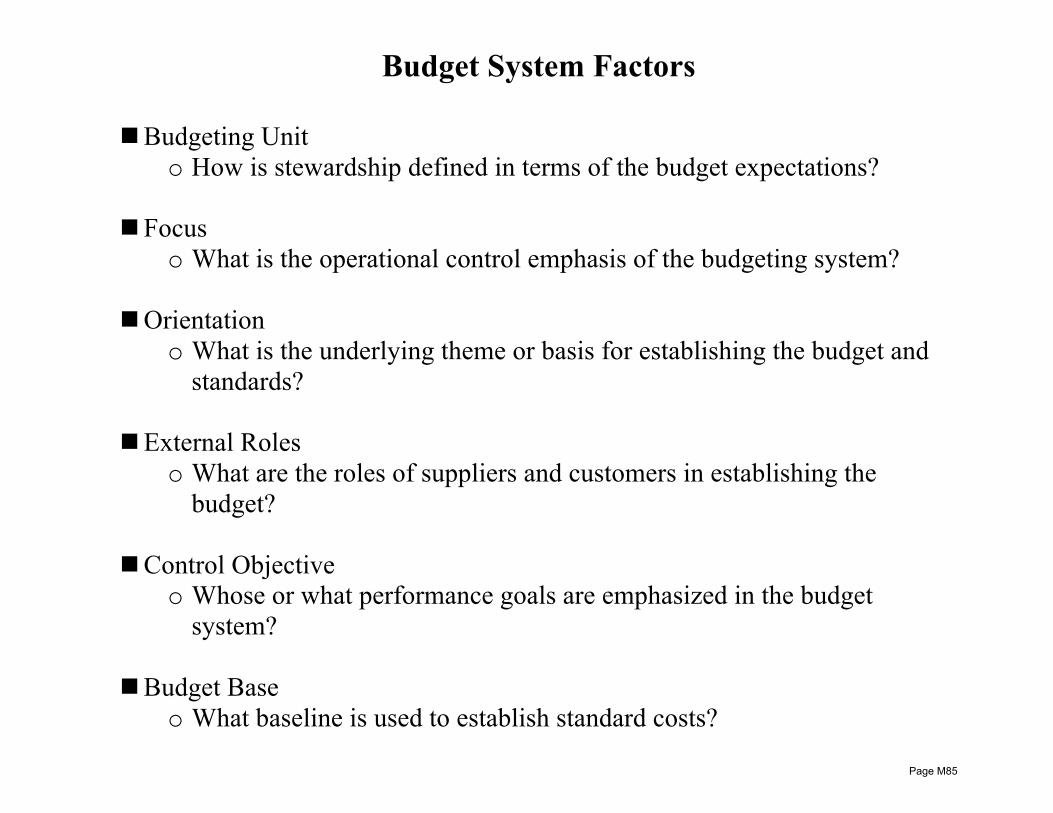
Budget System Factors
n Budgeting Unit o How is stewardship defined in terms of the budget expectations?
n Focus o What is the operational control emphasis of the budgeting system?
n Orientation o What is the underlying theme or basis for establishing the budget and
standards?
n External Roles o What are the roles of suppliers and customers in establishing the
budget?
n Control Objective o Whose or what performance goals are emphasized in the budget
system?
n Budget Base o What baseline is used to establish standard costs?
Page M85
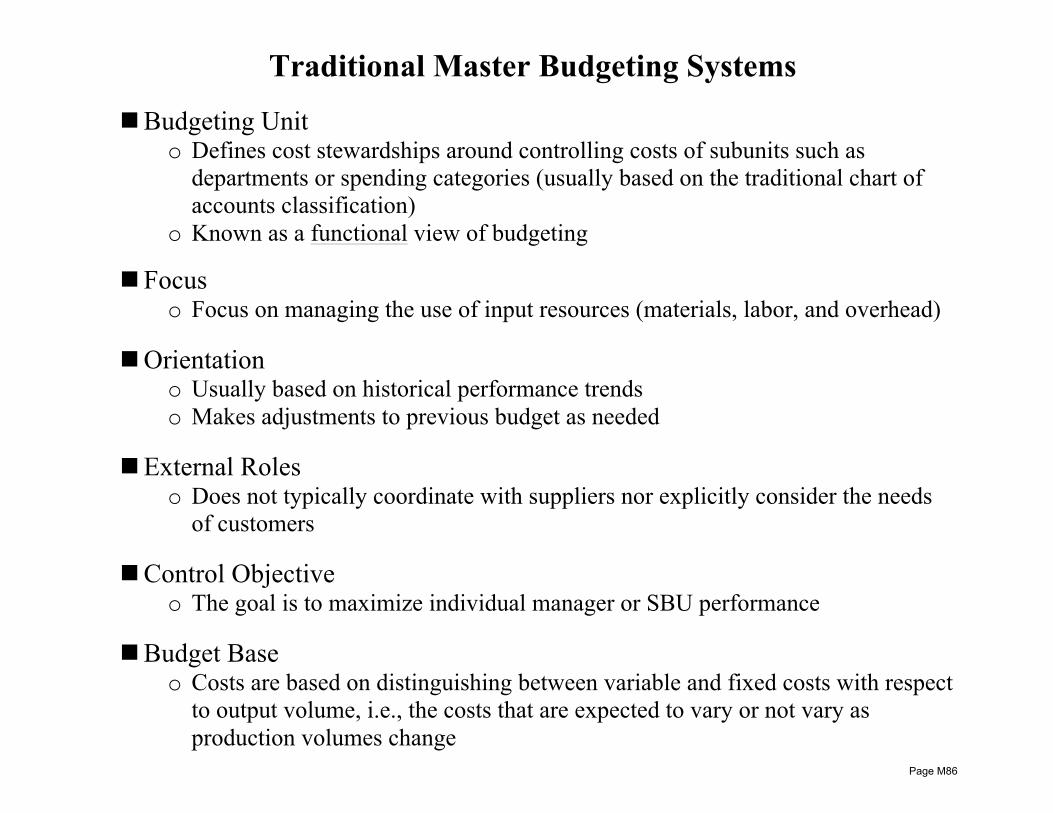
Traditional Master Budgeting Systems
n Budgeting Unit o Defines cost stewardships around controlling costs of subunits such as
departments or spending categories (usually based on the traditional chart of accounts classification)
o Known as a functional view of budgeting
n Focus o Focus on managing the use of input resources (materials, labor, and overhead)
n Orientation o Usually based on historical performance trends o Makes adjustments to previous budget as needed
n External Roles o Does not typically coordinate with suppliers nor explicitly consider the needs
of customers
n Control Objective o The goal is to maximize individual manager or SBU performance
n Budget Base o Costs are based on distinguishing between variable and fixed costs with respect
to output volume, i.e., the costs that are expected to vary or not vary as production volumes change
Page M86

Zero-Based Budgeting Systems
n Very Similar to Traditional Budgeting n Only Difference is Orientation
o Unlike traditional budgeting systems, requires that analysis and justification for every cost and subunit take place annually
o Creates awareness of activities or functions that have outlived their usefulness
n Very Popular in the 1970s o Although popularity has faded, still used in many government and not-for-
profit organizations today
n The Principle of Zero-Based Budgeting is Alive and Well! o Many organizations find it impossible to perform and complete a review every
year on every activity and function o Many organizations schedule zero-based budgeting reviews periodically or
rotate these reviews through the organizations on a multi-year basis
Page M87
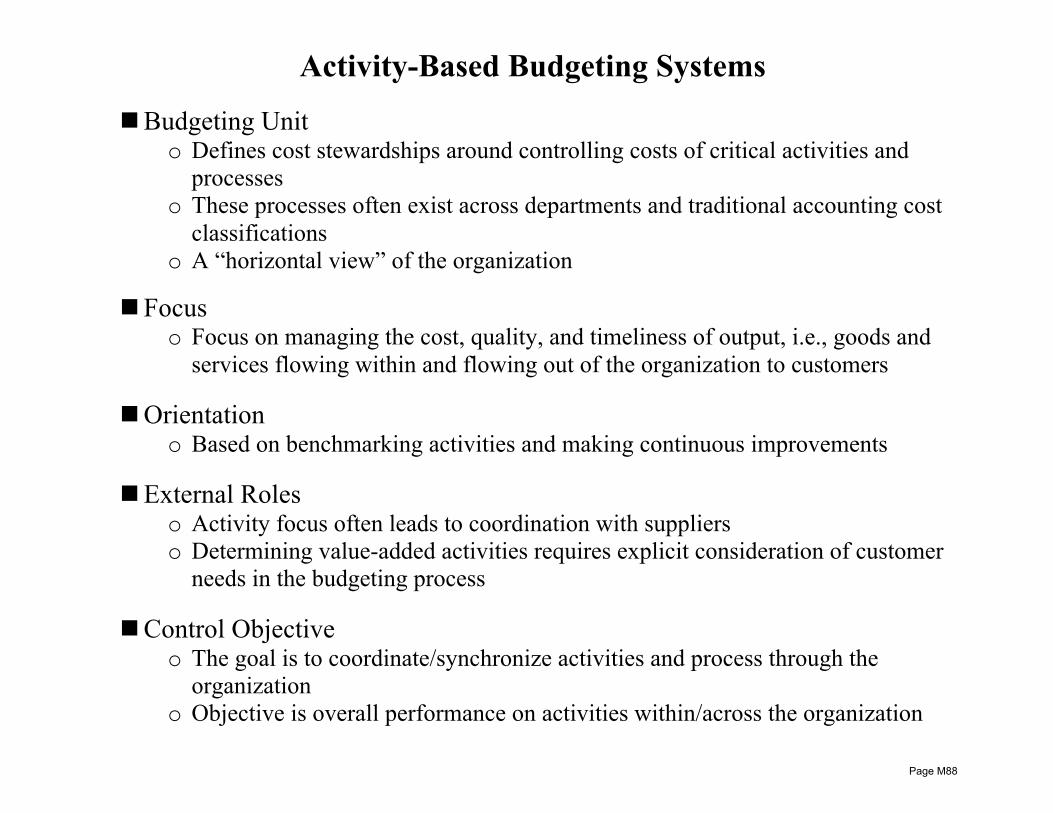
Activity-Based Budgeting Systems
n Budgeting Unit o Defines cost stewardships around controlling costs of critical activities and
processes o These processes often exist across departments and traditional accounting cost
classifications o A “horizontal view” of the organization
n Focus o Focus on managing the cost, quality, and timeliness of output, i.e., goods and
services flowing within and flowing out of the organization to customers
n Orientation o Based on benchmarking activities and making continuous improvements
n External Roles o Activity focus often leads to coordination with suppliers o Determining value-added activities requires explicit consideration of customer
needs in the budgeting process
n Control Objective o The goal is to coordinate/synchronize activities and process through the
organization o Objective is overall performance on activities within/across the organization
Page M88
Activity-Based Budgeting Systems (cont.)
n Budget Base o Defines activity cost pools that respond linearly to changes in activity volumes
§ Hence, unit level, batch level, and product-line level costs are all considered variable
§ Hence, the “fixed versus variable” issue is not critical o Costs are often based on distinguishing between utilized and unutilized
activity/process capacity
n Activity-Based Budgeting Changes the Stewardship Structure o Complete implementation defeats the purpose of functional/departmental lines o Requires establishment of activity/process managers rather than department
managers
Page M89
Kaizen Budgeting Systems
n Budgeting Unit o A process (horizontal) view of the organization
n Focus o Focus on desired future operating process results o Cost, quality, and timeliness
n Orientation o Orientation is on finding improvements o Hence, budget variances are not based on improvement from past results, but
variance from future desired results
n External Roles o Kaizen is not limited to internal improvements o Suppliers and partners are often required to constantly improve by cutting
costs, improving quality, and improving timeliness
n Control Objective o Objective is overall performance within/across the organization
n Budget Base o The baseline is progress towards ideal standards of performance
Page M90

Unit B Topic 4 Alignment of Managerial and Organizational Goals
Learning Objectives: • differentiate between responsibility and authority • demonstrate an understanding of the issues surrounding responsibility without authority • identify ways in which authority is established • identify the purposes for goal setting as they relate to employee behavior (motivation) • explain how goal congruence relates to the success or failure of budgetary plans • describe the relationship between employee goals and needs and the goals of the firm • define the concept of goal congruence and recognize the concept of agency theory and how it relates to goal
congruence
Page M91
Authority
n The Management by Objectives Process o Motivate managers to exert high effort in the business process o Provide incentives to managers to make decisions consistent with
organizational goals o Fairly determine the rewards managers receive for high effort and
effective decision-making
n The Key to Management by Objectives is delegating both responsibility and authority for decisions made and effort expended o Responsibility is often granted for cost, revenues, and/or assets in
SBUs o Authority to make decisions the impact costs, revenues, and assets is
sometimes not granted
n Responsibility and authority disconnects happen when performance measures are misaligned o An SBU is treated like a profit center (e.g., segment margin measures),
but doesn’t have the authority to make revenue decisions (price, customer focus, etc.)
An SBU is treated like an investment center (e.g., ROI measures), but doesn’t have authority to make asset decisions (e.g., acquisition and replacement decisions)
Page M92
Goal Congruence
n Consistency between the Goals of the Firm and the Goals of its Employees o A simple concept in theory o Difficult to achieve in practice o Management systems, particularly budgeting systems, that don’t strive for goal
congruence throughout the organization will fail § However, there will always be some conflicts of interest between
employers and employees throughout the organization
n Employee Desires o High compensation o Low effort o Minimal risks
n Employer (Owner) Desires o Low costs o High productivity o Balance between risks and rewards
n The Approach to Conflict of Interest is Governed by the Organization’s View of Employees o Theory X holds that employees are uncommitted, lack self-control, and
incapable of good decisions and creativity o Theory Y holds the opposite view of employees
Page M93

Agency Theory
n Two Key Factors in the Relationship between the Employer (the Principal) and Employee (the Agent)
1. Uncertainty in the environment § No matter what the agent does, the agent cannot completely
control the outcome of the business process § External factors such as machine breakdowns and market price
swings are typically uncontrollable 2. Lack of Observability
§ The principal cannot observe the agent’s true effort, nor many of the agent’s decisions
§ The principal can only observe the outcome of the business process § Outcome is a function of the agent’s decisions and effort and other
uncontrollable factors
n Incentive Compensation Systems o Fixed wages create an incentive to shirk o Compensation should be linked to outcomes of the business process
(e.g., residual income) o Nevertheless, system should be designed to reduce the negative effect
on agent’s compensation due to uncertainty in the environment and its effect on the agent’s risk aversion
Page M94
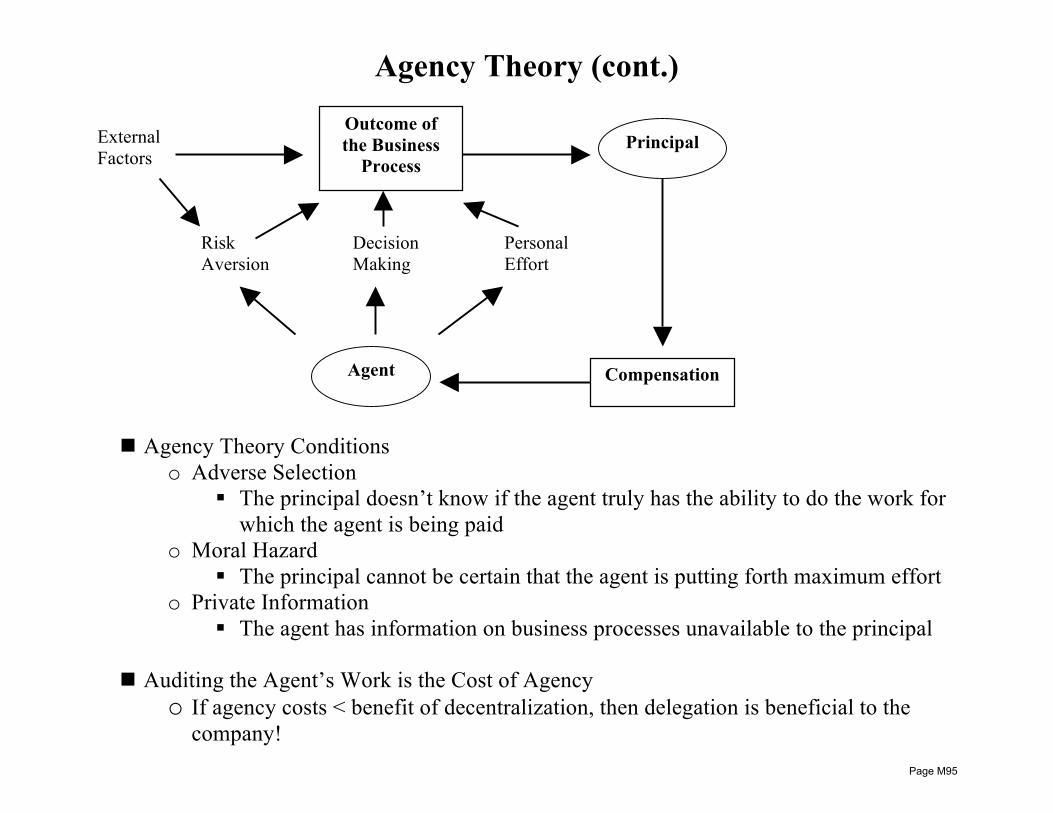
Agency Theory (cont.)
n Agency Theory Conditions o Adverse Selection
§ The principal doesn’t know if the agent truly has the ability to do the work for which the agent is being paid
o Moral Hazard § The principal cannot be certain that the agent is putting forth maximum effort
o Private Information § The agent has information on business processes unavailable to the principal
n Auditing the Agent’s Work is the Cost of Agency o If agency costs < benefit of decentralization, then delegation is beneficial to the
company!
External Factors
Outcome of the Business
Process
Risk Aversion
Decision Making
Personal Effort
Agent
Principal
Compensation
Page M95

Unit C Topic 1 Factors for and Techniques to Control and Evaluate Operations
Learning Objectives: • demonstrate an understanding that performance against operational goals can be measured by a variety of methods
including measures based on revenue, manufacturing costs, non-manufacturing costs, and profit depending on the type of center or unit being measured
• recognize that performance evaluation measures should be directly related to the factors that drive the element being measured, e.g., cost drivers and revenue drivers
• demonstrate an understanding that responsibility centers or business units are often measured on the effectiveness of asset usage and describe the benefits of treating all centers as investment units
• recognize that performance is frequently evaluated on the basis of non-financial performance measures such as customer satisfaction, quality, and innovation
• Understand that traditional evaluation is based on comparing actual results to the master budget and calculating favorable and unfavorable variances from budget
• define a standard cost system and identify the reasons for adopting a standard cost system • Understand the concept of Management by Exception
Page M96

Performance Evaluation
n Effectiveness o Most organizations have multiple strategic goals
§ Profits, growth, quality, community, etc. o An operation (business unit) within the organization is effective if it
meets the goals set for the operation § Alignment of business unit goals with the organization is critical!
n Efficiency
o Organizations with efficient operations waste no resources o Efficiency assessments are independent of effectiveness assessments
Example: The production department’s goal is to produce 10,000 widgets at a standard cost of $10 per widget. The department is ineffective but efficient if it actually produces 9,000 widgets and spends $85,000. On the other hand, department is effective but inefficient if it actually produces 11,000 widgets and spends $120,000.
n The master budget is based on effectively and efficiently achieving the
goals of the organization
Strategic Goals and
Plans
Short-Term Objectives
Page M97

Performance Evaluation and Responsibility Accounting
n Relevant Factors to Measure Performance o Business units have different stewardships within the context of
organizational strategy § Hence, operational goal performance can be measured using a
variety of measures § Be sure that the performance measure used is based on relevant
factors that the business unit can control o Performance measures should include (if relevant) all three types of
strategic issues à financial, quality, timeliness
n Remember there are Three Types of Business Units Cost centers à cost stewardship Profit centers à cost and revenue stewardship Investment centers à cost, revenue, and asset stewardship o The nature of the business unit should help determine the types of
performance measures used for that business unit
Page M98
Performance Evaluation and Investment Centers n The Overall Organization is an Investment Center
o The organization obviously cares about costs, revenues, and assets § These performance factors involve both effectiveness and
efficiency issues o Alignment of goals and measures within the organization is important
§ Cost centers and profit centers do not necessarily have the same incentive as the overall organization
§ For example, efficient use of assets is not the incentive of a business unit that is evaluated as a cost or profit center
n One Solution: Make Every Business Unit an Investment Center
o Assign responsibility for asset management to each business unit (can be hard to do)
o Assign responsibility for revenue management to each business unit (harder!) § How can an internal service unit (e.g., janitorial) create and
manage revenues? § Use Transfer pricing (a topic we’ll discuss later)
Page M99
Flexible versus Static Budgets
Example: The production department’s goal is to produce 10,000 widgets at a standard cost of $10 per widget. The department actually produced 9,000 widgets and spent $85,000.
n The Static Budget is Predetermined,
o The production department originally budgeted to spend $100,000 to produce 10,000 widgets. § What is the size of the cost variance above? Is it $15,000? § Is this a good or bad result (that is, a favorable or unfavorable
variance)? o The static budget does not separate well the issue of effective
performance from efficient performance § Was the department effective in achieving its goal? § Was the department efficient in using its resources?
n The Flexible Budget is Based on Actual Performance
o If the department actually produced 9,000 widgets, what should its costs have been?
o The answer to this question is the flexible budget § Because of the presence of both variable and fixed costs, the
answer is not simple
Page M100
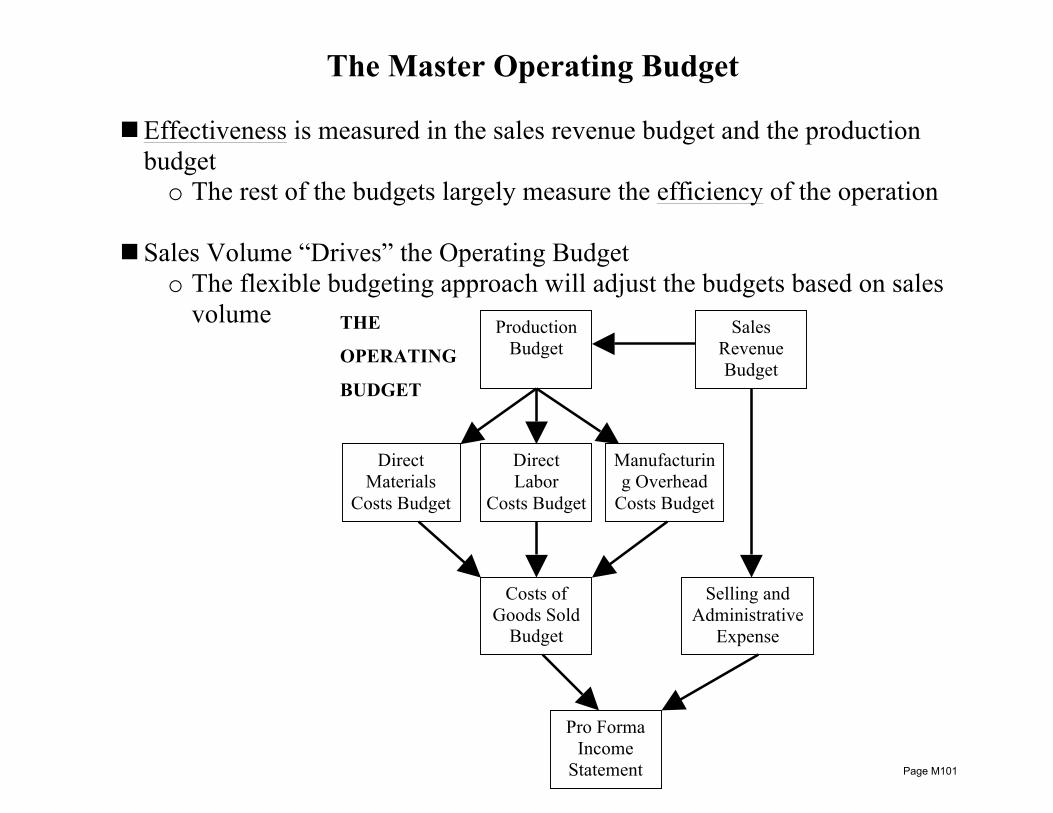
The Master Operating Budget n Effectiveness is measured in the sales revenue budget and the production
budget o The rest of the budgets largely measure the efficiency of the operation
n Sales Volume “Drives” the Operating Budget o The flexible budgeting approach will adjust the budgets based on sales
volume
Sales Revenue Budget
Selling and Administrative
Expense Budget
Manufacturing Overhead
Costs Budget
Production Budget
Direct Labor
Costs Budget
Direct Materials
Costs Budget
Costs of Goods Sold
Budget
THE
OPERATING
BUDGET
Pro Forma Income
Statement Page M101
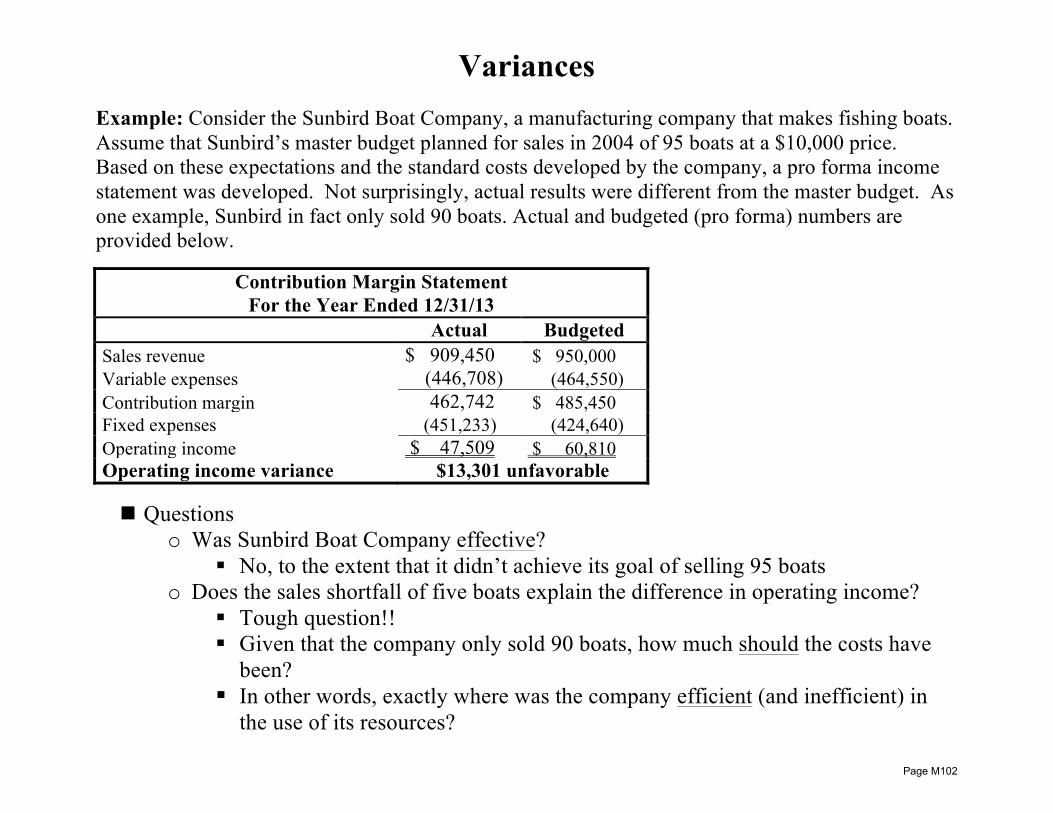
Variances Example: Consider the Sunbird Boat Company, a manufacturing company that makes fishing boats. Assume that Sunbird’s master budget planned for sales in 2004 of 95 boats at a $10,000 price. Based on these expectations and the standard costs developed by the company, a pro forma income statement was developed. Not surprisingly, actual results were different from the master budget. As one example, Sunbird in fact only sold 90 boats. Actual and budgeted (pro forma) numbers are provided below.
Contribution Margin Statement For the Year Ended 12/31/13
Actual Budgeted Sales revenue $ 909,450 $ 950,000 Variable expenses (446,708) (464,550) Contribution margin 462,742 $ 485,450 Fixed expenses (451,233) (424,640) Operating income $ 47,509 $ 60,810 Operating income variance $13,301 unfavorable
n Questions o Was Sunbird Boat Company effective?
§ No, to the extent that it didn’t achieve its goal of selling 95 boats o Does the sales shortfall of five boats explain the difference in operating income?
§ Tough question!! § Given that the company only sold 90 boats, how much should the costs have
been? § In other words, exactly where was the company efficient (and inefficient) in
the use of its resources?
Page M102
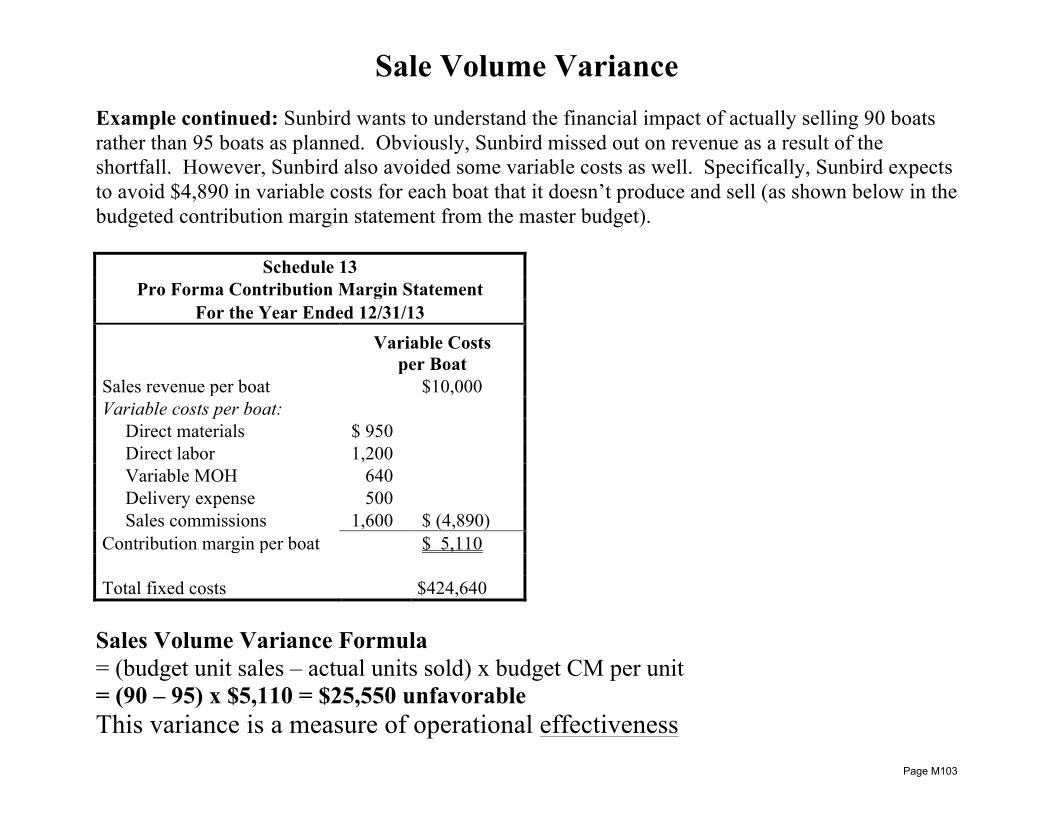
Sale Volume Variance Example continued: Sunbird wants to understand the financial impact of actually selling 90 boats rather than 95 boats as planned. Obviously, Sunbird missed out on revenue as a result of the shortfall. However, Sunbird also avoided some variable costs as well. Specifically, Sunbird expects to avoid $4,890 in variable costs for each boat that it doesn’t produce and sell (as shown below in the budgeted contribution margin statement from the master budget).
Schedule 13 Pro Forma Contribution Margin Statement
For the Year Ended 12/31/13
Variable Costs
per Boat Sales revenue per boat $10,000 Variable costs per boat: Direct materials $ 950 Direct labor 1,200 Variable MOH 640 Delivery expense 500 Sales commissions 1,600 $ (4,890) Contribution margin per boat $ 5,110 Total fixed costs $424,640
Sales Volume Variance Formula = (budget unit sales – actual units sold) x budget CM per unit = (90 – 95) x $5,110 = $25,550 unfavorable This variance is a measure of operational effectiveness
Page M103
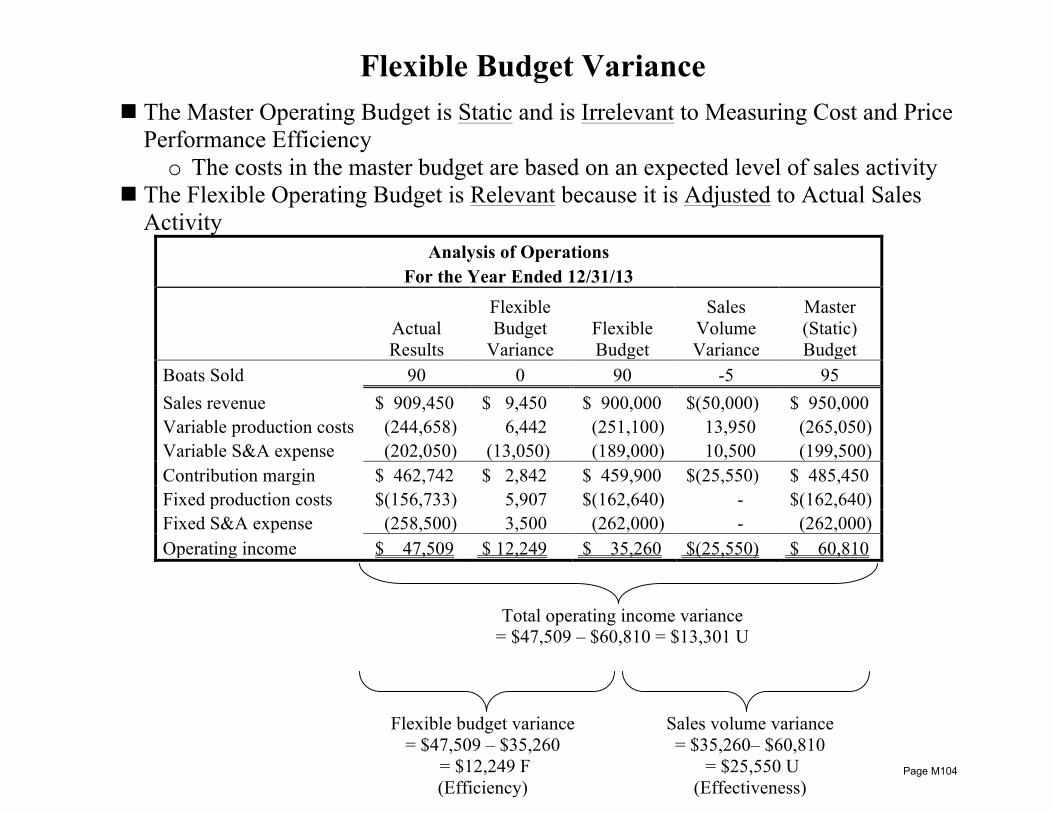
Flexible Budget Variance
n The Master Operating Budget is Static and is Irrelevant to Measuring Cost and Price Performance Efficiency o The costs in the master budget are based on an expected level of sales activity
n The Flexible Operating Budget is Relevant because it is Adjusted to Actual Sales Activity
Analysis of Operations For the Year Ended 12/31/13
Actual Results
Flexible Budget
Variance Flexible Budget
Sales Volume Variance
Master (Static) Budget
Boats Sold 90 0 90 -5 95 Sales revenue $ 909,450 $ 9,450 $ 900,000 $(50,000) $ 950,000 Variable production costs (244,658) 6,442 (251,100) 13,950 (265,050) Variable S&A expense (202,050) (13,050) (189,000) 10,500 (199,500) Contribution margin $ 462,742 $ 2,842 $ 459,900 $(25,550) $ 485,450 Fixed production costs $(156,733) 5,907 $(162,640) - $(162,640) Fixed S&A expense (258,500) 3,500 (262,000) - (262,000) Operating income $ 47,509 $ 12,249 $ 35,260 $(25,550) $ 60,810
Total operating income variance
= $47,509 – $60,810 = $13,301 U
Flexible budget variance = $47,509 – $35,260
= $12,249 F (Efficiency)
Sales volume variance = $35,260– $60,810
= $25,550 U (Effectiveness)
Page M104

Hierarchy of Variances
n The Flexible Budget Variance decomposes into many important efficiency variances across the organization o Simply stated, efficiency variances are based on the difference between
standard costs and actual results
Operating Income Variance
Flexible Budget Variance Sales Volume Variance
Sales Price Variance Manufacturing Cost Variances S&A Expense Variances
Labor Variances
Variable S&A Variance
Fixed S&A Variance
MOH Variances
Fixed MOH Variances
Variable MOH Variances
Materials Variances
Budget Variance
VolumeVolume VarianceVariance
Spending Variance
Efficiency Variance
Usage Variance
Price Variance
Rate Variance
Efficiency Variance
Page M105

Management by Exception
n Management Time and Attention is a Scarce Resource n Use Variance Reporting to Target the Managers’ Time
n Procedure
o Establish standard costs for each input o Establish acceptable limits for each variance o Only investigate those variances outside of acceptable limits
§ Both unfavorable and favorable variances n Limitations
o Variances are traditionally focused directly on profits § Quality and timeliness issues may not get sufficient attention
o Management by exception” is a divide and conquer approach that investigates individual variances § Some problems exist across (rather than within) certain
stewardships o Ignoring small variances until they get big enough to demand
management effort virtually ensures that small problems will get big!
Page M106
Unit C Topic 2 Techniques to Control and Evaluate Production
Learning Objectives: • define a just-in-time system and describe its central purpose • identify the operational benefits of implementing a just-in-time system • define the term kanban and describe how kanban is used in a just-in-time system • demonstrate an understanding of work cells and how they relate to just-in-time processes • demonstrate an understanding of the concept of outsourcing and identify the benefits and limitations of choosing this
option • demonstrate an understanding of the concept of continuous improvement (kaizen) and how it relates to implementing
ideal standards and quality improvements • demonstrate an understanding of the theory of constraints and the steps involved in theory of constraints analysis • define the term throughput and understand its relationship to theory of constraints • understand the drum-buffer-rope system as a tool for managing product flow • analyze a theory of constraints report and recommend corrective action • recognize that theory of constraints and activity-based costing are complementary analytical tools
Page M107
Inventory Issues
n Materials Requirements Planning (MRP) Systems o A traditional “push through” system based on anticipated demand o Uses demand forecasts and lead time estimates to build a master budget
of needs o Using these preset inventory ordering and production schedules
requires inventory stockpiling à a “just in case” method
n Inventory is Costly! o The financial cost of inventory
§ Holding inventory ties up money § Money has an opportunity cost
o The timeliness cost of inventory § Inventory, particularly WIP inventory, slows down the
production/deliver cycle § Production must queue up and work through inventory stockpiles
o The quality cost of inventory § Quality problems are hidden as long as inventory is stockpiled
without anyone inspecting it § Inventory used as a “just in case” security allows some quality
problems to exist in the system by definition
Page M108
Just-in-Time (JIT) Inventory Systems
n The JIT System is a more Modern Production Management Method o A “pull” system based on current demand o A highly disciplined system that demands zero inventory defects and
zero process breakdowns o Requires close coordination with suppliers
§ Allows for close coordination with customers o Requires empowered and multi-trained employees
§ JIT success is largely in the hands of the workers on the floor n JIT Benefits
o Elimination of waste from the system o Inventory reduction o Strong supplier relationships o Increased employee involvement o Improved customer focus
Page M109
JIT Inventory Systems (cont.)
n The JIT Process o Each operation produces only what is needed by the next operation o Materials, components, and finished goods arrive just in time to be
used internally by other operations or delivered externally to the customer
o Referred to as “lean production systems”
n JIT Signaling o Close coordination is required between suppliers, internal operations,
and customers o Nothing is done without a “pull signal” from the downstream operation o The signal is called a Kanban (Japanese for “card”)
§ A communication to the upstream process that requests that more production be sent
Page M110

JIT Inventory Systems (cont.) n Work Cells
o Related processes organized in coordinated clusters o Emphasizes total completion of the product or service within the work cell
§ Allows visual communication and control o Workers in the cell are cross trained and perform most support activities
§ Workers are also empowered to manage quality and timeliness issues within the process
o Work cells are an important facilitator of JIT
n Outsourcing o Work cells can help an organization identify and develop core competencies o Production and service processes that are not core competencies are candidates
for outsourcing o Outsourcing can assure consistent quality in some production at reasonable
prices § Even when it saves money to produce internally, outsourcing can help a
firm better focus on core competencies that have competitive value o Outsourcing does relinquish control of costs, quality, and timelines to another
party
Page M111
Kaizen (Continuous Improvement) n Kaizen is the Japanese Word for “Continuous Improvement”
o A total commitment to continuous improvement in quality and other critical success factors
o Quality in a Kaizen system is not a destination, but a way of life § “We will never arrive; there is no finish!”
o Cost and performance standards are either constantly updated in a Kaizen system or the organization sets ideal standards § Hence, ideal standards can never be reached
o Performance is not measure in terms of attaining the standard, but in making progress towards the standard
o The driving force beyond Kaizen is ever-increasing competition
Page M112
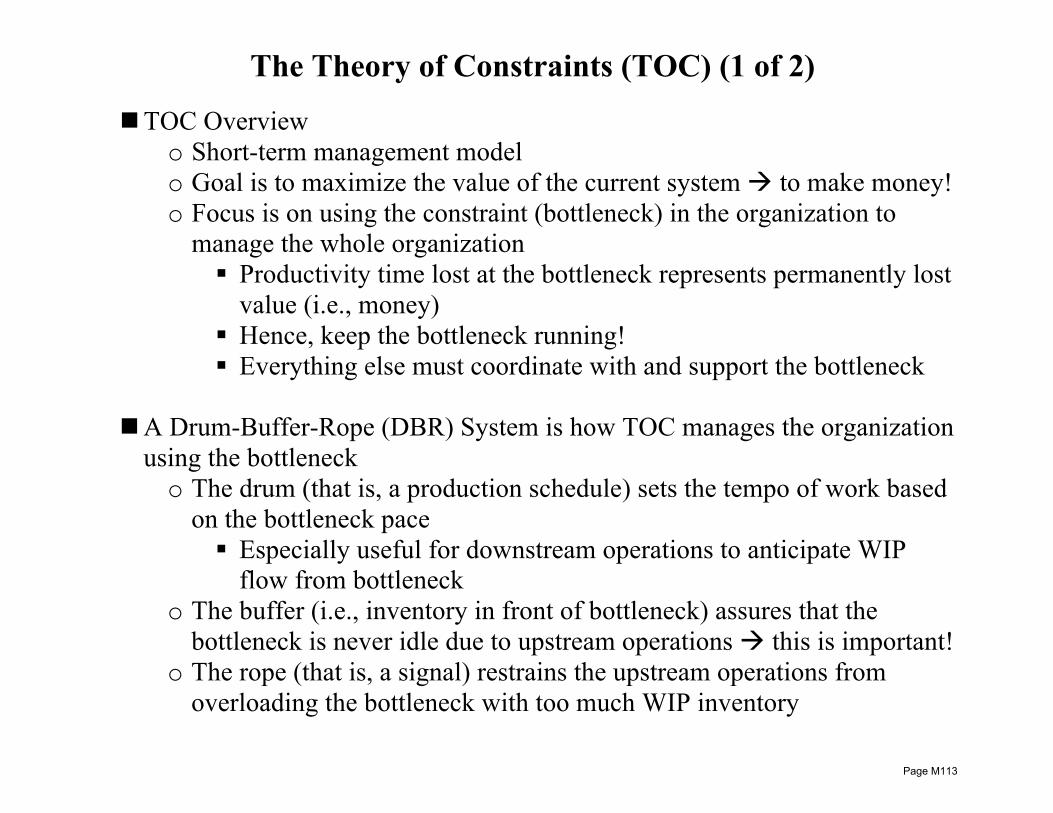
The Theory of Constraints (TOC) (1 of 2) n TOC Overview
o Short-term management model o Goal is to maximize the value of the current system à to make money! o Focus is on using the constraint (bottleneck) in the organization to
manage the whole organization § Productivity time lost at the bottleneck represents permanently lost
value (i.e., money) § Hence, keep the bottleneck running! § Everything else must coordinate with and support the bottleneck
n A Drum-Buffer-Rope (DBR) System is how TOC manages the organization
using the bottleneck o The drum (that is, a production schedule) sets the tempo of work based
on the bottleneck pace § Especially useful for downstream operations to anticipate WIP
flow from bottleneck o The buffer (i.e., inventory in front of bottleneck) assures that the
bottleneck is never idle due to upstream operations à this is important! o The rope (that is, a signal) restrains the upstream operations from
overloading the bottleneck with too much WIP inventory
Page M113

TOC (2 of 2)
n The Five-Step TOC Process 1. Identify the organization’s constraint
§ Internal constraints includes bottlenecks due to process limitations or policies
§ External constraints include bottlenecks due to limited material or labor availability or limited market demand
2. Decide how to exploit the constraint § Calculate the throughput yield per unit of the constrained resource
(e.g., the profit created by each hour on the bottleneck machine or each unit of limited raw material inventory)
§ This measures the value of effectively managing (exploiting) the constraint
3. Subordinate everything else to the constraint § This is where the DBR system is used § Increasing the productivity of a non-bottleneck operation does not
contribute to profits, and can cause inefficiencies 4. Elevate the constraint
§ The best way to make money in the operation is to elevate (improve) the capacity of the constraint or bottleneck.
5. If the constraint is broken, go back to Step 1 § A Kaizen (continuous improvement) concept
Page M114
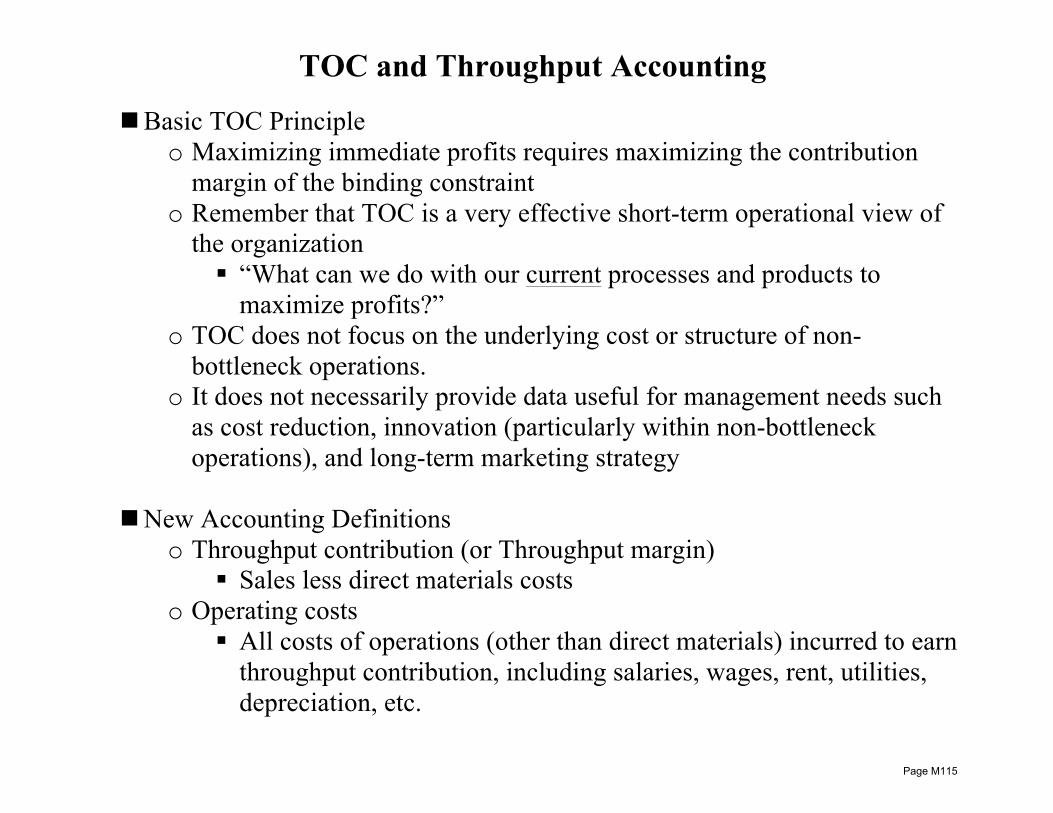
TOC and Throughput Accounting
n Basic TOC Principle o Maximizing immediate profits requires maximizing the contribution
margin of the binding constraint o Remember that TOC is a very effective short-term operational view of
the organization § “What can we do with our current processes and products to
maximize profits?” o TOC does not focus on the underlying cost or structure of non-
bottleneck operations. o It does not necessarily provide data useful for management needs such
as cost reduction, innovation (particularly within non-bottleneck operations), and long-term marketing strategy
n New Accounting Definitions
o Throughput contribution (or Throughput margin) § Sales less direct materials costs
o Operating costs § All costs of operations (other than direct materials) incurred to earn
throughput contribution, including salaries, wages, rent, utilities, depreciation, etc.
Page M115
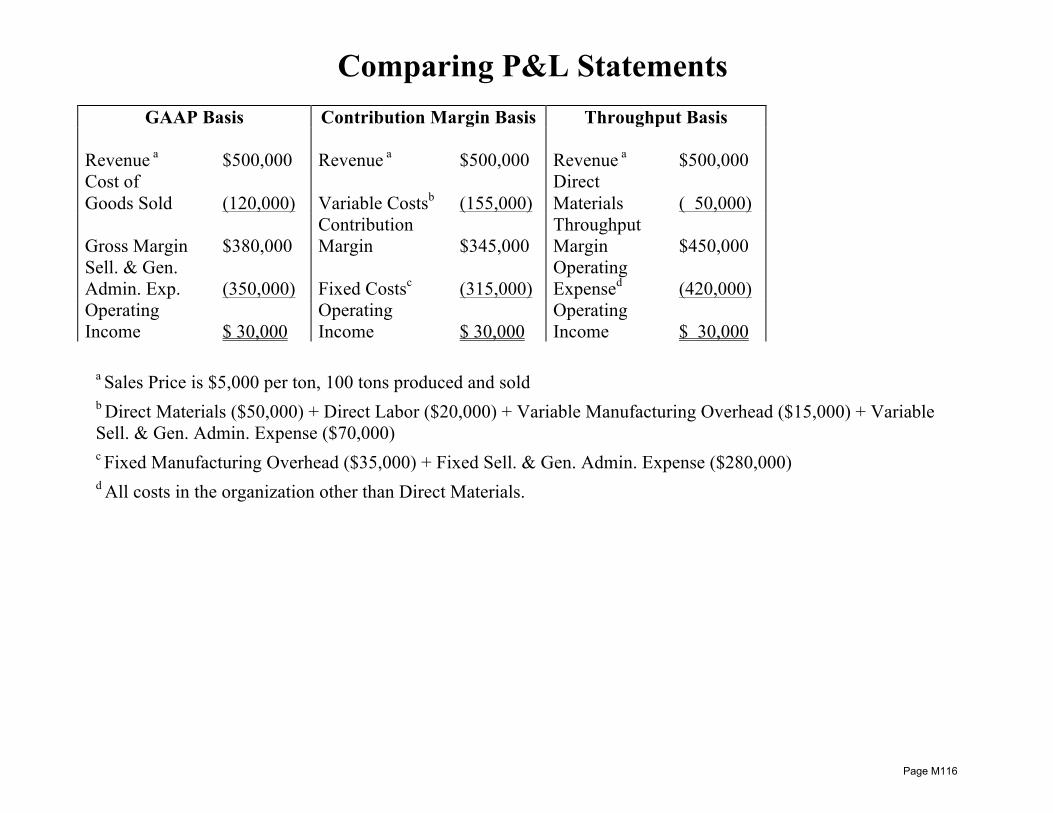
Comparing P&L Statements
GAAP Basis Contribution Margin Basis Throughput Basis Revenue a
$500,000
Revenue a
$500,000
Revenue a
$500,000
Cost of Goods Sold
(120,000)
Variable Costsb
(155,000)
Direct Materials
( 50,000)
Gross Margin
$380,000
Contribution Margin
$345,000
Throughput Margin
$450,000
Sell. & Gen. Admin. Exp.
(350,000)
Fixed Costsc
(315,000)
Operating Expensed
(420,000)
Operating Income
$ 30,000
Operating Income
$ 30,000
Operating Income
$ 30,000
a Sales Price is $5,000 per ton, 100 tons produced and sold b Direct Materials ($50,000) + Direct Labor ($20,000) + Variable Manufacturing Overhead ($15,000) + Variable Sell. & Gen. Admin. Expense ($70,000) c Fixed Manufacturing Overhead ($35,000) + Fixed Sell. & Gen. Admin. Expense ($280,000) d All costs in the organization other than Direct Materials.
Page M116
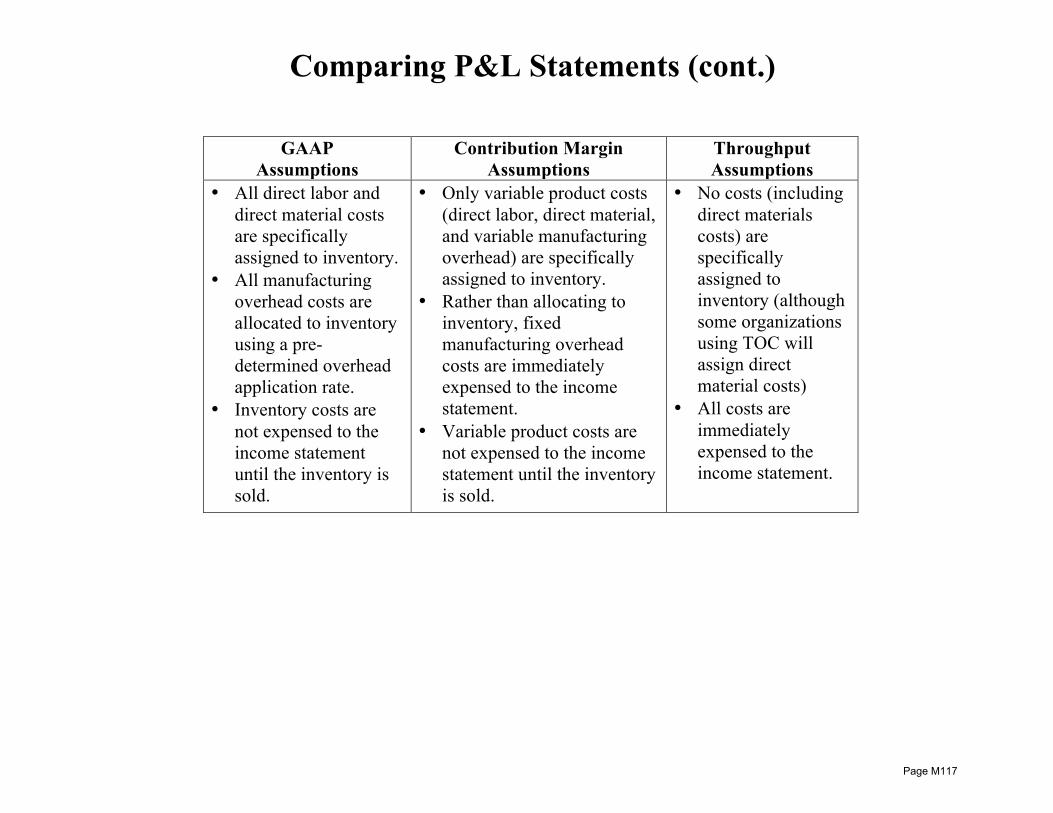
Comparing P&L Statements (cont.)
GAAP Assumptions
Contribution Margin Assumptions
Throughput Assumptions
• All direct labor and direct material costs are specifically assigned to inventory.
• All manufacturing overhead costs are allocated to inventory using a pre-determined overhead application rate.
• Inventory costs are not expensed to the income statement until the inventory is sold.
• Only variable product costs (direct labor, direct material, and variable manufacturing overhead) are specifically assigned to inventory.
• Rather than allocating to inventory, fixed manufacturing overhead costs are immediately expensed to the income statement.
• Variable product costs are not expensed to the income statement until the inventory is sold.
• No costs (including direct materials costs) are specifically assigned to inventory (although some organizations using TOC will assign direct material costs)
• All costs are immediately expensed to the income statement.
Page M117
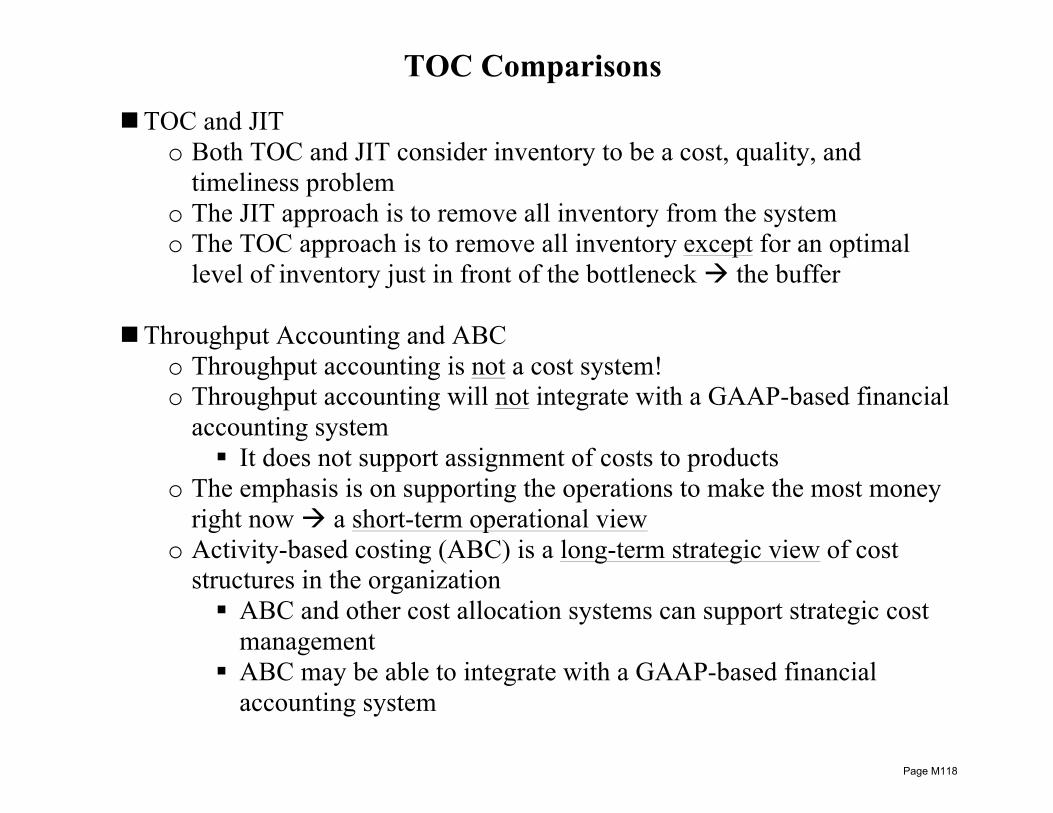
TOC Comparisons
n TOC and JIT o Both TOC and JIT consider inventory to be a cost, quality, and
timeliness problem o The JIT approach is to remove all inventory from the system o The TOC approach is to remove all inventory except for an optimal
level of inventory just in front of the bottleneck à the buffer
n Throughput Accounting and ABC o Throughput accounting is not a cost system! o Throughput accounting will not integrate with a GAAP-based financial
accounting system § It does not support assignment of costs to products
o The emphasis is on supporting the operations to make the most money right now à a short-term operational view
o Activity-based costing (ABC) is a long-term strategic view of cost structures in the organization § ABC and other cost allocation systems can support strategic cost
management § ABC may be able to integrate with a GAAP-based financial
accounting system
Page M118
Unit C Topic 3 Techniques to Evaluate and Report Performance
Learning Objectives: • demonstrate an understanding that responsibility centers (strategic business units) represent effective units for
performance evaluation and recognize the various types of responsibility centers • recognize that firms may evaluate customers on the basis of profitability and investigate ways to improve profitability
or drop unprofitable customers • recognize the role that feedback reporting plays in linking planning, control, and performance evaluations • recognize the importance of timing in feedback reporting • recognize the value of contribution reporting for performance evaluation • analyze a contribution report and evaluate performance • recognize that organizations may evaluate performance on the basis of segments such as product lines, geographical
areas, or other meaningful segments • demonstrate an understanding that the allocation of common costs among segments can be an issue in performance
evaluation • recognize that performance measurement reports should be tailored to the audience and level of management to which
they are directed • define transfer pricing and identify the objectives of transfer pricing • recognize the methods for determining transfer prices and identify the advantages and disadvantages of each method • recognize how transfer pricing is affected by business issues such as the presence of outside suppliers and the
opportunity costs associated with capacity usage • recognize how special issues such as tariffs, exchange rates, and the availability of materials and skills affect
performance evaluation in multinational companies • recognize how special issues such as taxes, currency restrictions, and expropriation risk affect transfer pricing in
multinational companies
Page M119
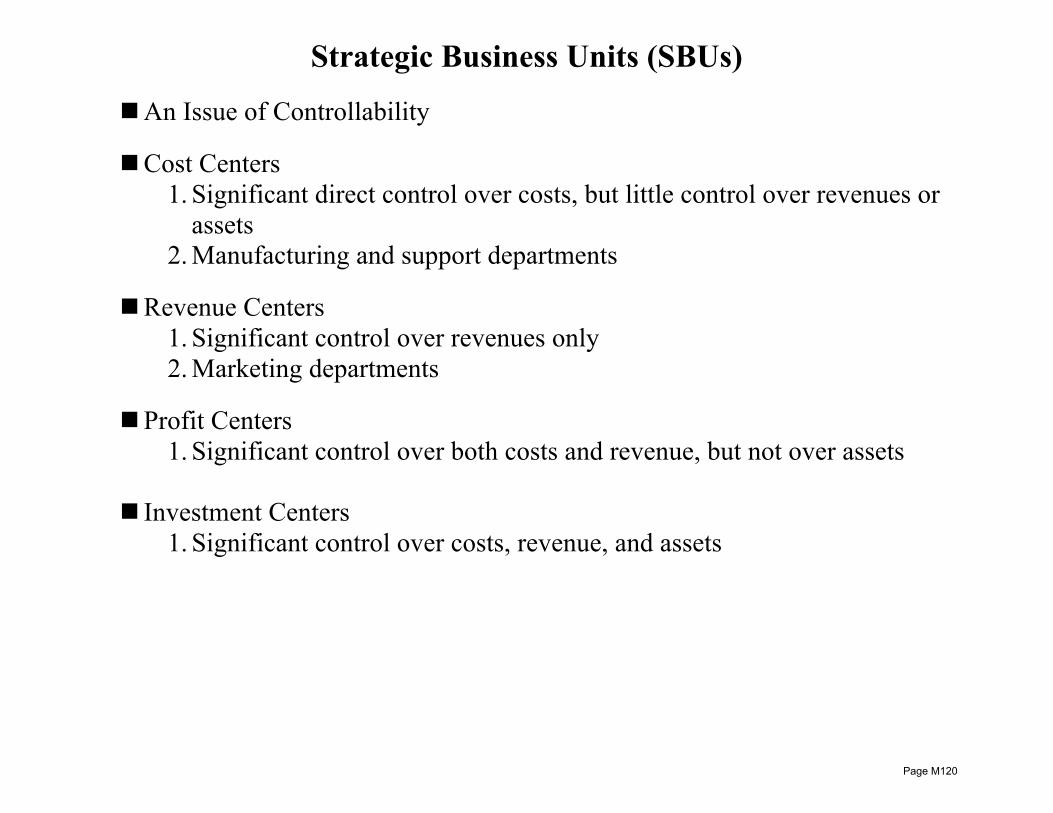
Strategic Business Units (SBUs)
n An Issue of Controllability n Cost Centers
1. Significant direct control over costs, but little control over revenues or assets
2. Manufacturing and support departments
n Revenue Centers 1. Significant control over revenues only 2. Marketing departments
n Profit Centers 1. Significant control over both costs and revenue, but not over assets
n Investment Centers 1. Significant control over costs, revenue, and assets
Page M120
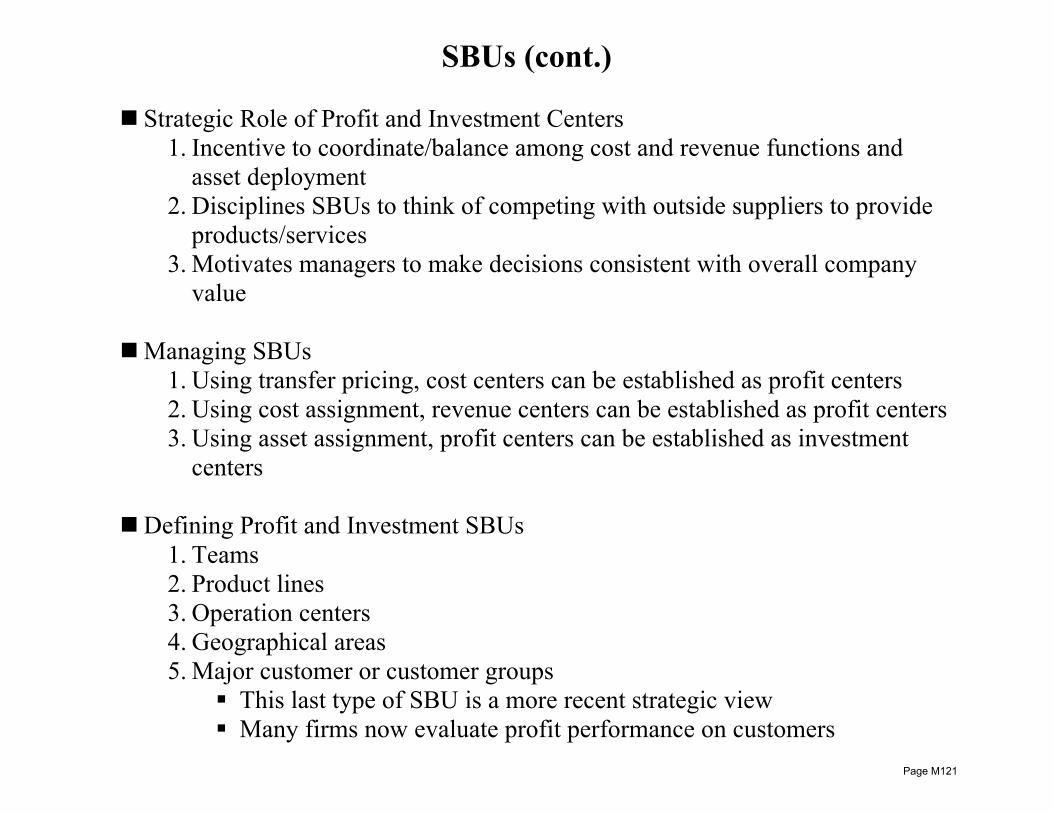
SBUs (cont.)
n Strategic Role of Profit and Investment Centers 1. Incentive to coordinate/balance among cost and revenue functions and
asset deployment 2. Disciplines SBUs to think of competing with outside suppliers to provide
products/services 3. Motivates managers to make decisions consistent with overall company
value
n Managing SBUs 1. Using transfer pricing, cost centers can be established as profit centers 2. Using cost assignment, revenue centers can be established as profit centers 3. Using asset assignment, profit centers can be established as investment
centers
n Defining Profit and Investment SBUs 1. Teams 2. Product lines 3. Operation centers 4. Geographical areas 5. Major customer or customer groups
§ This last type of SBU is a more recent strategic view § Many firms now evaluate profit performance on customers
Page M121
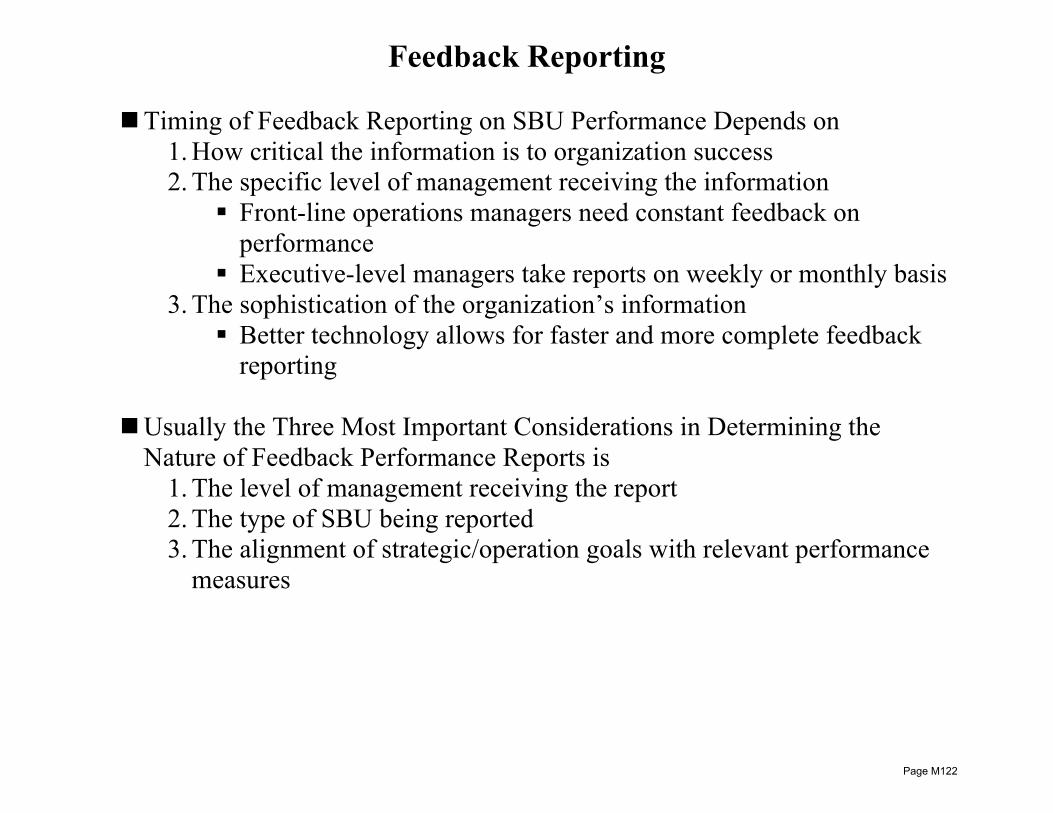
Feedback Reporting n Timing of Feedback Reporting on SBU Performance Depends on
1. How critical the information is to organization success 2. The specific level of management receiving the information
§ Front-line operations managers need constant feedback on performance
§ Executive-level managers take reports on weekly or monthly basis 3. The sophistication of the organization’s information
§ Better technology allows for faster and more complete feedback reporting
n Usually the Three Most Important Considerations in Determining the
Nature of Feedback Performance Reports is 1. The level of management receiving the report 2. The type of SBU being reported 3. The alignment of strategic/operation goals with relevant performance
measures
Page M122
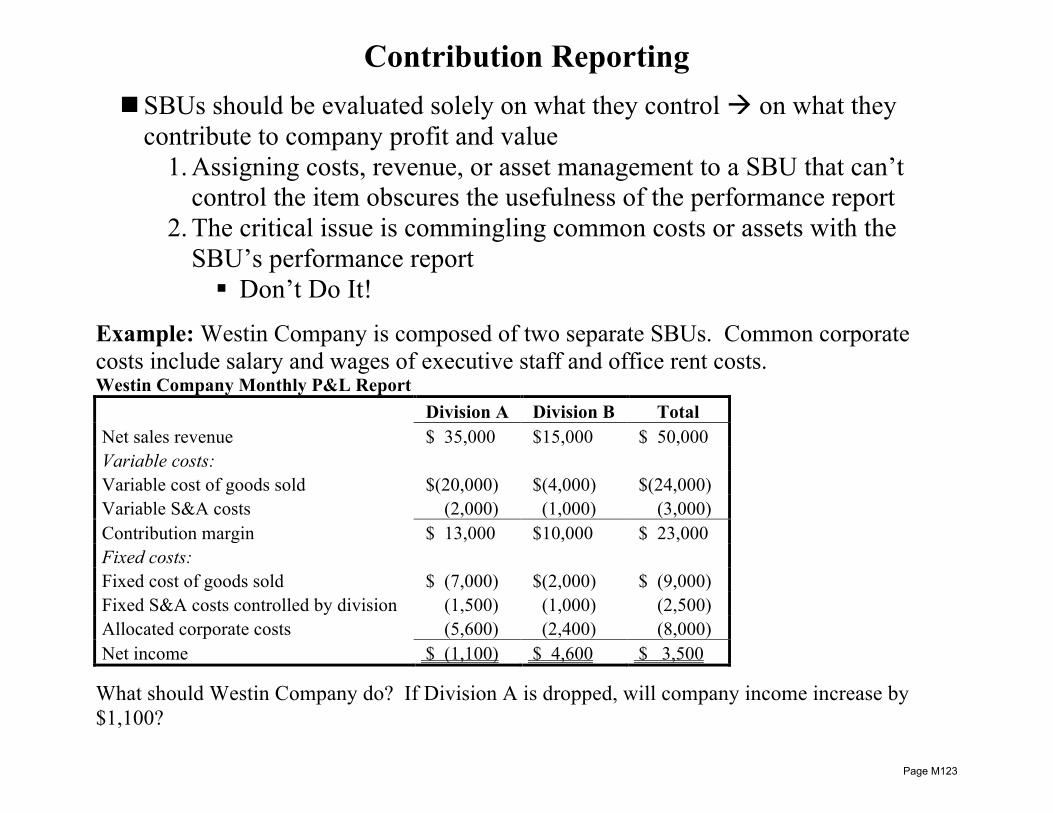
Contribution Reporting
n SBUs should be evaluated solely on what they control à on what they contribute to company profit and value
1. Assigning costs, revenue, or asset management to a SBU that can’t control the item obscures the usefulness of the performance report
2. The critical issue is commingling common costs or assets with the SBU’s performance report § Don’t Do It!
Example: Westin Company is composed of two separate SBUs. Common corporate costs include salary and wages of executive staff and office rent costs. Westin Company Monthly P&L Report Division A Division B Total Net sales revenue $ 35,000 $15,000 $ 50,000 Variable costs: Variable cost of goods sold $(20,000) $(4,000) $(24,000) Variable S&A costs (2,000) (1,000) (3,000) Contribution margin $ 13,000 $10,000 $ 23,000 Fixed costs: Fixed cost of goods sold $ (7,000) $(2,000) $ (9,000) Fixed S&A costs controlled by division (1,500) (1,000) (2,500) Allocated corporate costs (5,600) (2,400) (8,000) Net income $ (1,100) $ 4,600 $ 3,500
What should Westin Company do? If Division A is dropped, will company income increase by $1,100?
Page M123

Contribution Reporting (cont.) Results if Division A is dropped Westin Company P&L Report Division B Total Net sales revenue $15,000 $15,000 Variable costs: Variable cost of goods sold $ (4,000) $(4,000) Variable S&A costs (1,000) (1,000) Contribution margin $10,000 $10,000 Fixed costs: Fixed cost of goods sold $ (2,000) $(2,000) Fixed S&A costs controlled by division (1,000) (1,000) Allocated corporate costs (8,000) (8,000) Net income $ (1,000) $(1,000)
Page M124
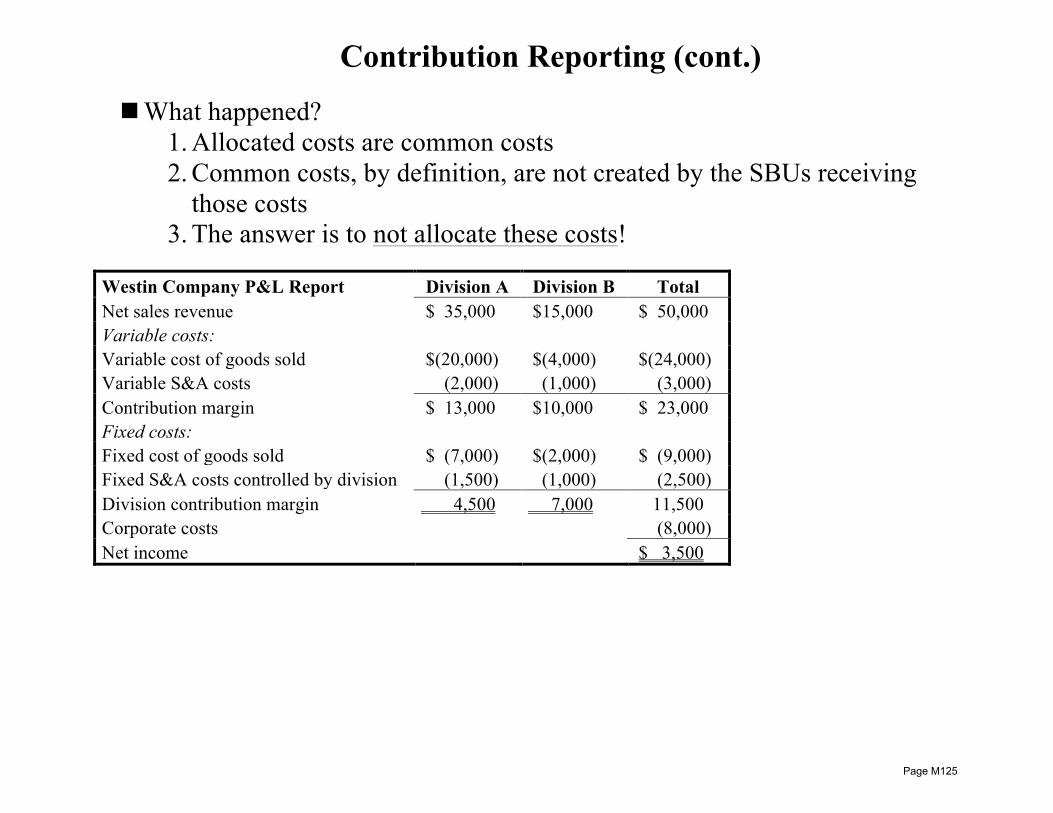
Contribution Reporting (cont.) n What happened?
1. Allocated costs are common costs 2. Common costs, by definition, are not created by the SBUs receiving
those costs 3. The answer is to not allocate these costs!
Westin Company P&L Report Division A Division B Total Net sales revenue $ 35,000 $15,000 $ 50,000 Variable costs: Variable cost of goods sold $(20,000) $(4,000) $(24,000) Variable S&A costs (2,000) (1,000) (3,000) Contribution margin $ 13,000 $10,000 $ 23,000 Fixed costs: Fixed cost of goods sold $ (7,000) $(2,000) $ (9,000) Fixed S&A costs controlled by division (1,500) (1,000) (2,500) Division contribution margin 4,500 7,000 11,500 Corporate costs (8,000) Net income $ 3,500
Page M125
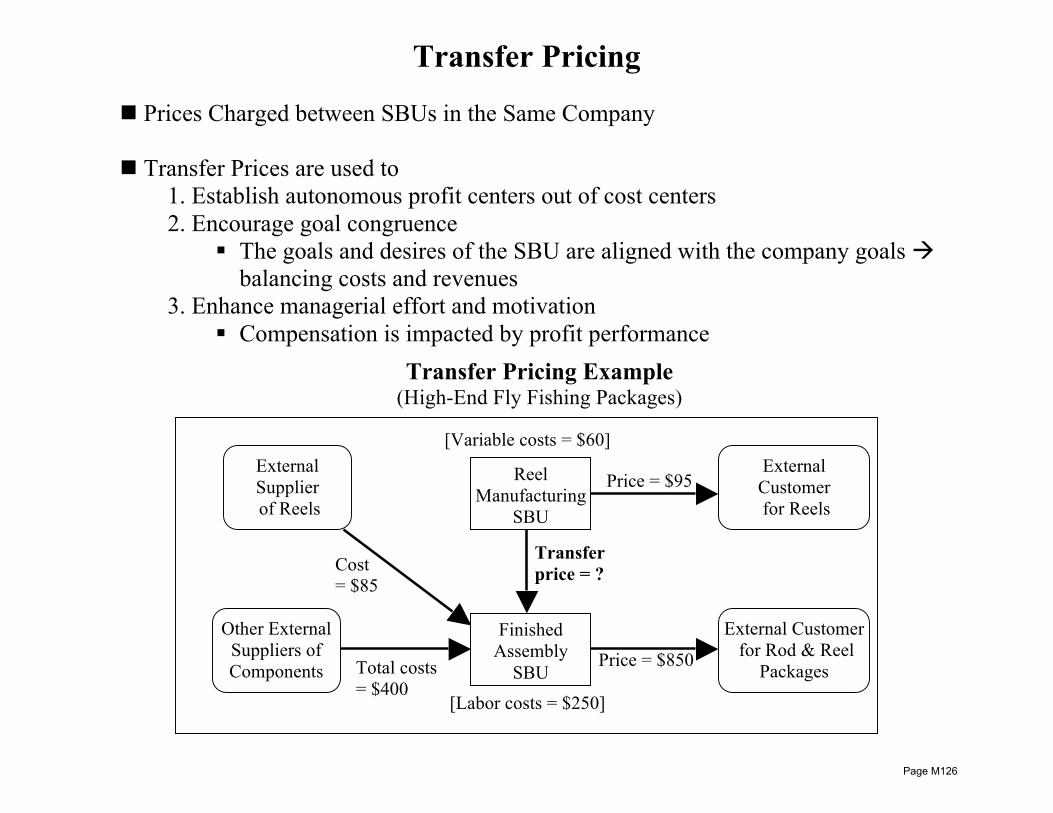
Transfer Pricing n Prices Charged between SBUs in the Same Company n Transfer Prices are used to
1. Establish autonomous profit centers out of cost centers 2. Encourage goal congruence
§ The goals and desires of the SBU are aligned with the company goals à balancing costs and revenues
3. Enhance managerial effort and motivation § Compensation is impacted by profit performance
Finished Assembly
SBU
Reel Manufacturing
SBU
External Supplier of Reels
External Customer for Reels
Total costs = $400
Cost = $85
Transfer price = ?
Price = $95
Price = $850
Transfer Pricing Example (High-End Fly Fishing Packages)
Other External Suppliers of Components
[Variable costs = $60]
[Labor costs = $250]
External Customer for Rod & Reel
Packages
Page M126
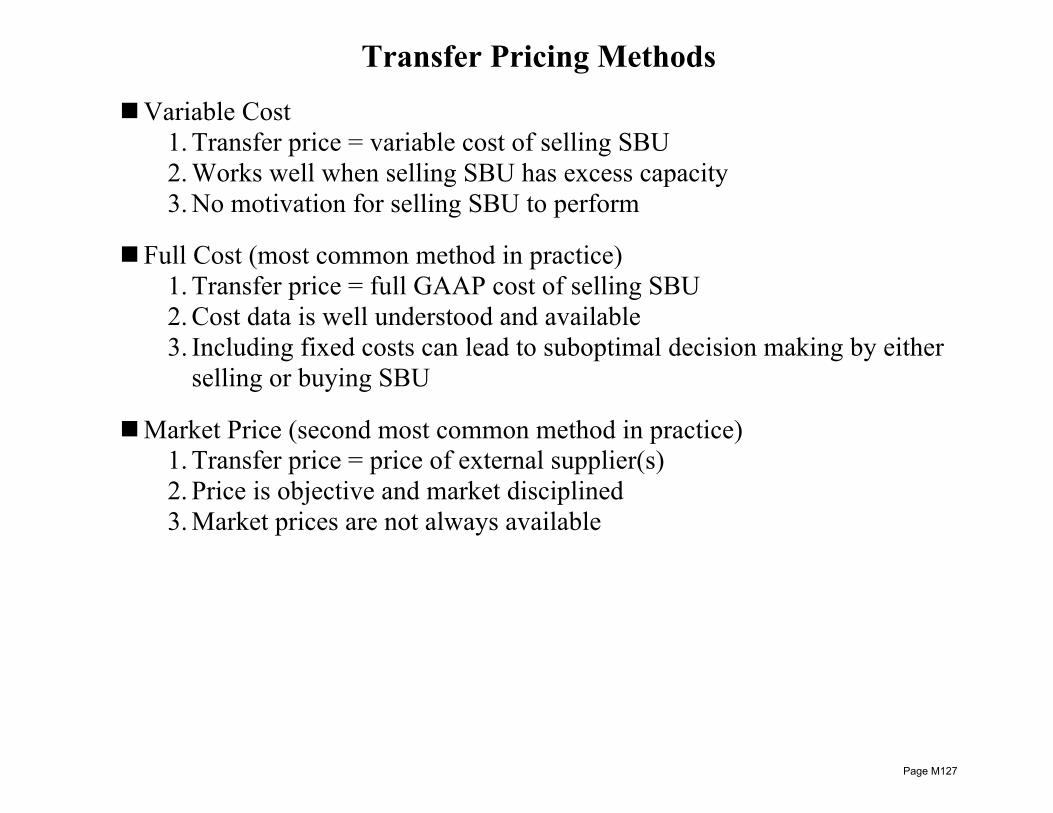
Transfer Pricing Methods
n Variable Cost 1. Transfer price = variable cost of selling SBU 2. Works well when selling SBU has excess capacity 3. No motivation for selling SBU to perform
n Full Cost (most common method in practice) 1. Transfer price = full GAAP cost of selling SBU 2. Cost data is well understood and available 3. Including fixed costs can lead to suboptimal decision making by either
selling or buying SBU
n Market Price (second most common method in practice) 1. Transfer price = price of external supplier(s) 2. Price is objective and market disciplined 3. Market prices are not always available
Page M127
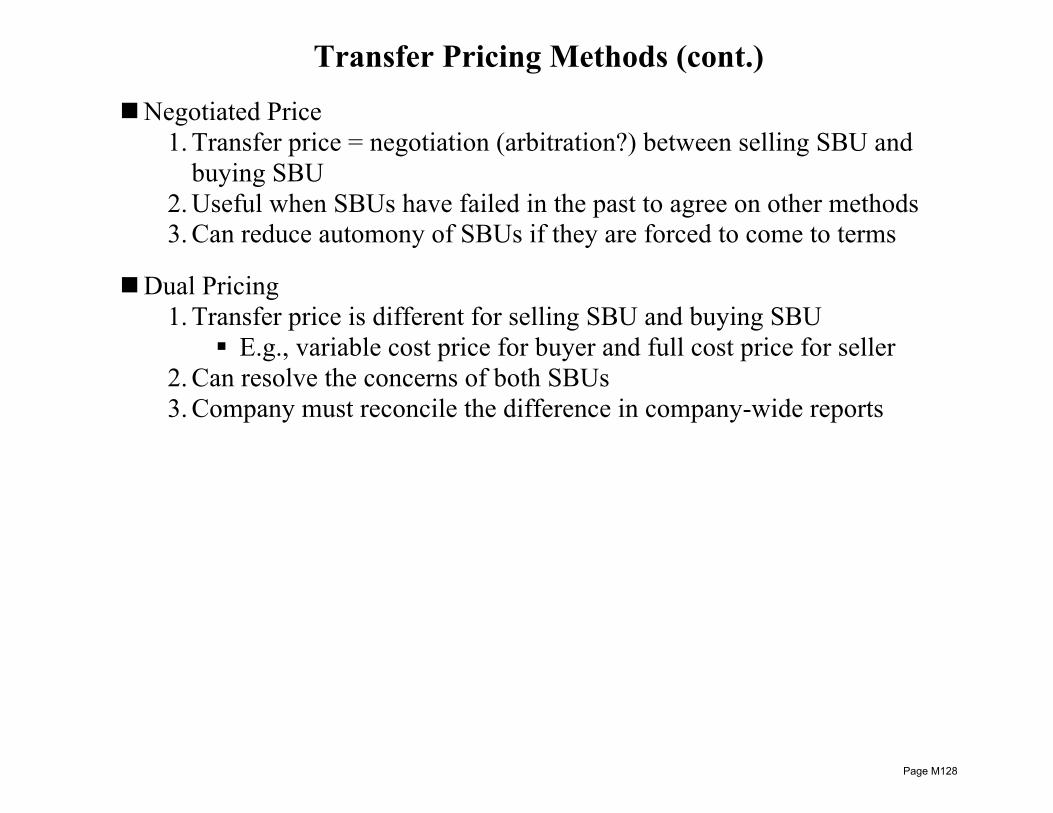
Transfer Pricing Methods (cont.)
n Negotiated Price 1. Transfer price = negotiation (arbitration?) between selling SBU and
buying SBU 2. Useful when SBUs have failed in the past to agree on other methods 3. Can reduce automony of SBUs if they are forced to come to terms
n Dual Pricing 1. Transfer price is different for selling SBU and buying SBU
§ E.g., variable cost price for buyer and full cost price for seller 2. Can resolve the concerns of both SBUs 3. Company must reconcile the difference in company-wide reports
Page M128

Choosing the Right Transfer Pricing Method Is there an outside
supplier? Use cost-based or negotiated price
Is the variable cost of the selling SBU less then the
market price?
Yes
No Selling SBU costs are
too high; Purchase from external supplier
No
Is the selling SBU operating at full capacity, i.e., will the transfer order
result in lost external sales?
Yes
No The transfer price
should be set between the variable cost and
the market price
Is the contribution margin of external sale for
selling SBU greater than cost savings of transfer
for buying SBU?
Yes
No The transfer price should be set at the
market price
Opportunity costs of lost sales are too high; Purchase from external
supplier
Yes
Page M129

Transfer Pricing Example
Other Data: • The Company is currently manufacturing and selling 50,000 rod and reel packages in the external market. • The reel manufacturing SBU is currently manufacturing and selling 75,000 reels to external customers and is
operating at full capacity. • Fixed costs are unaffected by the transfer pricing decision, and are omitted from the analysis.
No Transfer Reel Assembly SBU SBU Total Price $95 $850 Variable costs:
Reel cost (85) Other costs (60) (650)
Contribution Margin $35 $115 Volume × 75,000 × 50,000 Total CM $2,625,000 $5,750,000 $8,375,000
Finished Assembly
SBU
Reel Manufacturing
SBU
External Supplier of Reels
External Customer for Reels
Total costs = $400
Cost = $85
Transfer price = ?
Price = $95
Price = $850
(High-End Fly Fishing Packages)
Other External Suppliers of Components
[Variable costs = $60]
[Labor costs = $250]
External Customer for Rod & Reel
Packages
Page M130
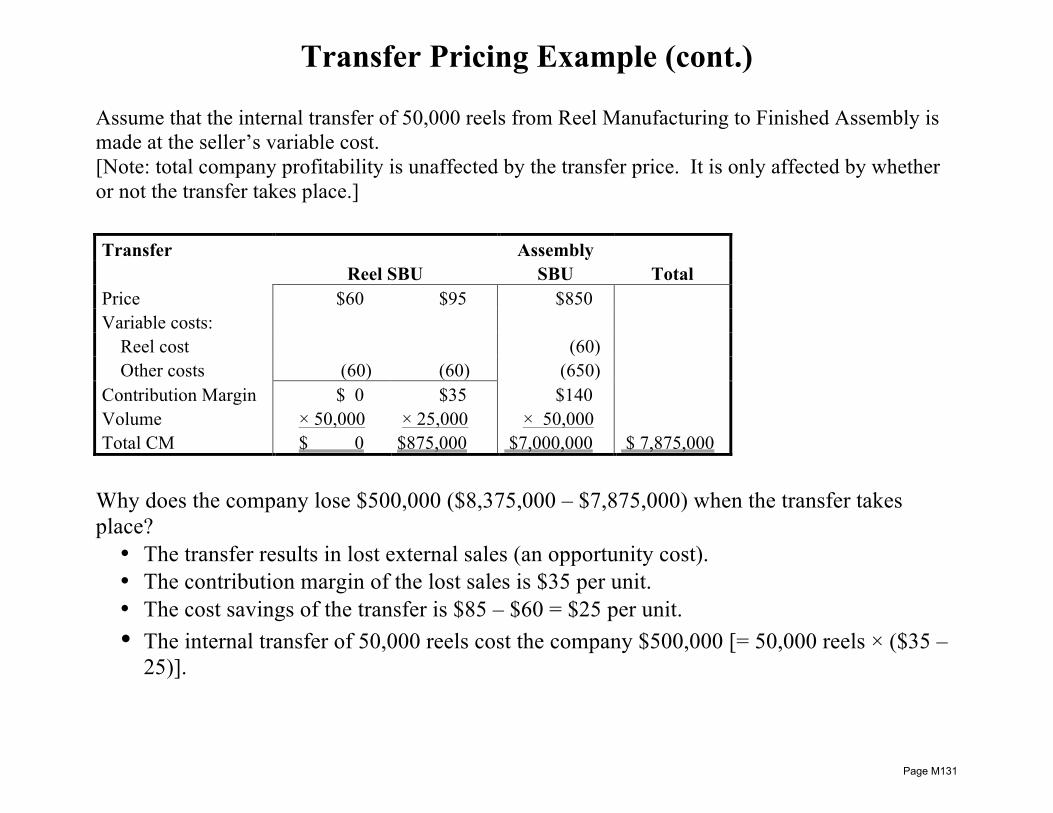
Transfer Pricing Example (cont.) Assume that the internal transfer of 50,000 reels from Reel Manufacturing to Finished Assembly is made at the seller’s variable cost. [Note: total company profitability is unaffected by the transfer price. It is only affected by whether or not the transfer takes place.] Transfer Assembly Reel SBU SBU Total Price $60 $95 $850 Variable costs:
Reel cost (60) Other costs (60) (60) (650)
Contribution Margin $ 0 $35 $140 Volume × 50,000 × 25,000 × 50,000 Total CM $ 0 $875,000 $7,000,000 $ 7,875,000
Why does the company lose $500,000 ($8,375,000 – $7,875,000) when the transfer takes place? • The transfer results in lost external sales (an opportunity cost). • The contribution margin of the lost sales is $35 per unit. • The cost savings of the transfer is $85 – $60 = $25 per unit. • The internal transfer of 50,000 reels cost the company $500,000 [= 50,000 reels × ($35 –
25)].
Page M131
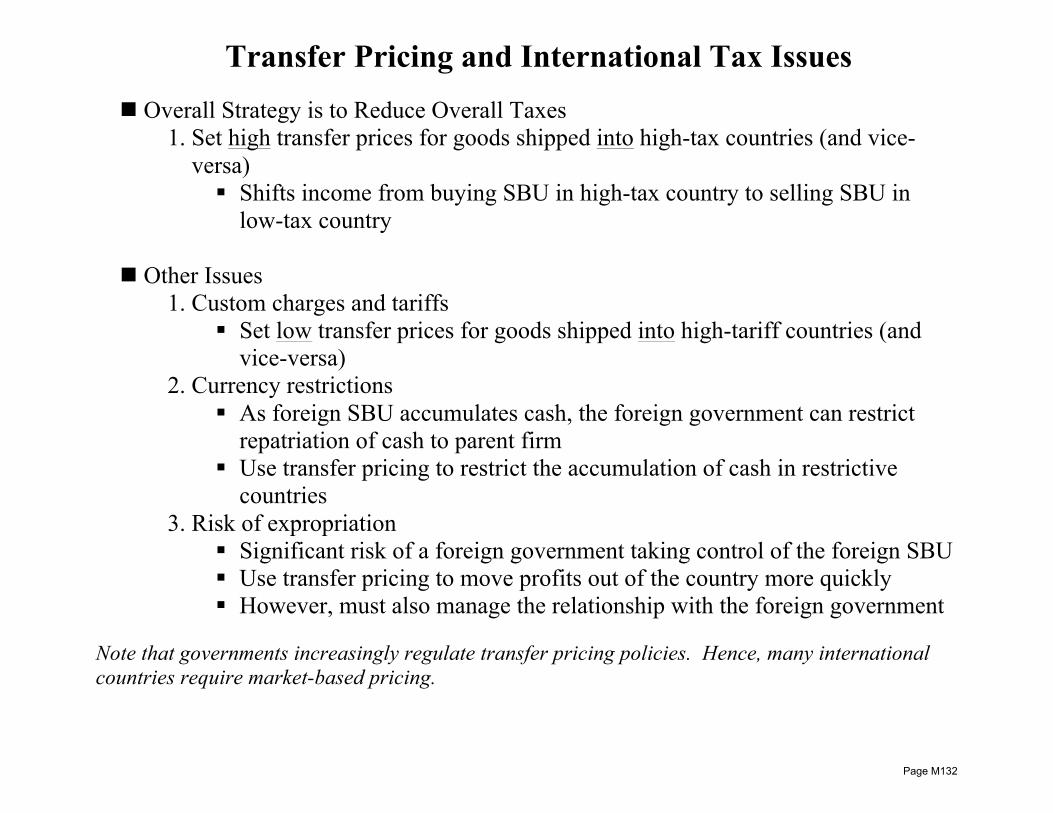
Transfer Pricing and International Tax Issues
n Overall Strategy is to Reduce Overall Taxes 1. Set high transfer prices for goods shipped into high-tax countries (and vice-
versa) § Shifts income from buying SBU in high-tax country to selling SBU in
low-tax country
n Other Issues 1. Custom charges and tariffs
§ Set low transfer prices for goods shipped into high-tariff countries (and vice-versa)
2. Currency restrictions § As foreign SBU accumulates cash, the foreign government can restrict
repatriation of cash to parent firm § Use transfer pricing to restrict the accumulation of cash in restrictive
countries 3. Risk of expropriation
§ Significant risk of a foreign government taking control of the foreign SBU § Use transfer pricing to move profits out of the country more quickly § However, must also manage the relationship with the foreign government
Note that governments increasingly regulate transfer pricing policies. Hence, many international countries require market-based pricing.
Page M132

Unit C Topic 4 Performance Measures
Learning Objectives: • define and calculate return on investment • calculate return on investment based on the Dupont Model and describe how this model enhances basic return on
investment calculations • analyze and interpret return on investment calculations and evaluate performance on the basis of the analysis • define and calculate residual income • analyze and interpret residual income calculations and evaluate performance on the basis of the analysis • compare and contrast the benefits and limitations of return on investment and residual income as measures of
performance • define and calculate economic value added • demonstrate an understanding of how economic value added differs from return on investment and residual income
measures • recognize that market value added is another measure of performance • demonstrate an understanding that several factors such as revenue and expense recognition policies may affect the
measurement of income and reduce comparability among business units and companies • demonstrate an understanding that several factors such as inventory measurement policies, joint asset sharing, and
overall asset measurement may affect the measurement of investment and reduce comparability among business units and companies
• recognize that some organizations evaluate performance on the basis of cash flow return on investment • compare and contrast cash flow return on investment with return on investment • define the concept of a balanced scorecard and identify its components • demonstrate an understanding of how to make the most effective use of a balanced scorecard • analyze and interpret a balanced scorecard and evaluate performance on the basis of the analysis
Page M133

Return on Investment (ROI)
n ROI ≈ ROA ≈ Income ÷ Total Assets o Income could be segment margin, operating income, or net income o Assets could be existing assets or average assets over some period of
time (usually the last year or quarter) o On the exam, use whatever information is provided
§ If beginning and ending assets are provided, use average assets; otherwise, use ending assets
§ Usually, information to obtain more than one type of income number is not provided
n DuPont Formula
o Enhances the ROA formula by separating into Profit Margin and Asset Turnover
o Profit Margin = Income ÷ Sales § The percentage of sales retained as profit
o Asset turnover = Sales ÷ Total Assets § The number of sales dollars generated by each dollar invested into
assets
Page M134
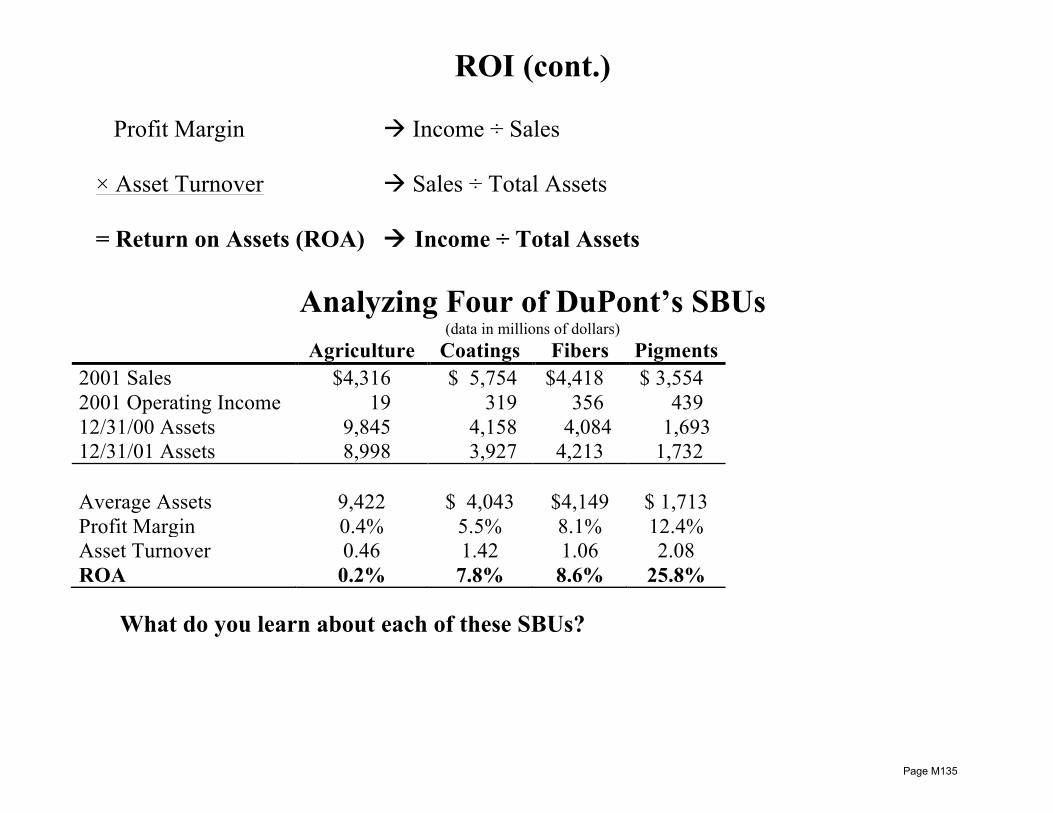
ROI (cont.) Profit Margin à Income ÷ Sales × Asset Turnover à Sales ÷ Total Assets = Return on Assets (ROA) à Income ÷ Total Assets
Analyzing Four of DuPont’s SBUs (data in millions of dollars)
Agriculture Coatings Fibers Pigments 2001 Sales $4,316 $ 5,754 $4,418 $ 3,554 2001 Operating Income 19 319 356 439 12/31/00 Assets 9,845 4,158 4,084 1,693 12/31/01 Assets 8,998 3,927 4,213 1,732
Average Assets 9,422 $ 4,043 $4,149 $ 1,713 Profit Margin 0.4% 5.5% 8.1% 12.4% Asset Turnover 0.46 1.42 1.06 2.08 ROA 0.2% 7.8% 8.6% 25.8%
What do you learn about each of these SBUs?
Page M135
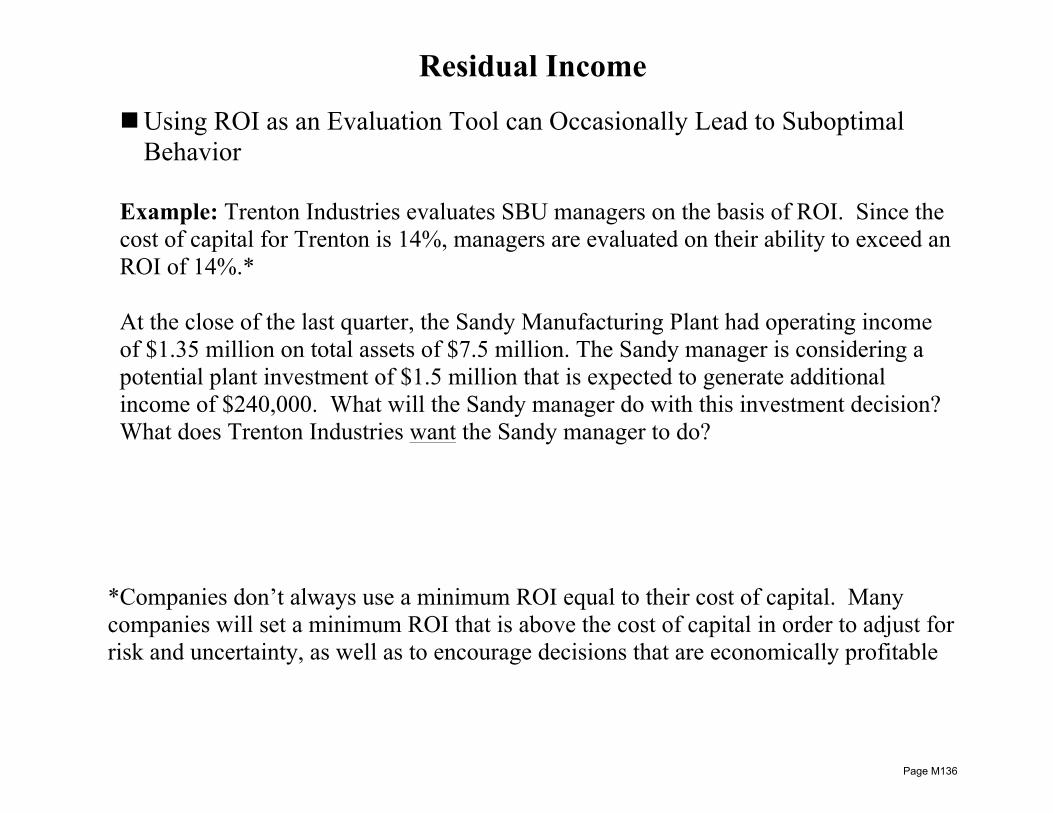
Residual Income
n Using ROI as an Evaluation Tool can Occasionally Lead to Suboptimal Behavior
Example: Trenton Industries evaluates SBU managers on the basis of ROI. Since the cost of capital for Trenton is 14%, managers are evaluated on their ability to exceed an ROI of 14%.* At the close of the last quarter, the Sandy Manufacturing Plant had operating income of $1.35 million on total assets of $7.5 million. The Sandy manager is considering a potential plant investment of $1.5 million that is expected to generate additional income of $240,000. What will the Sandy manager do with this investment decision? What does Trenton Industries want the Sandy manager to do?
*Companies don’t always use a minimum ROI equal to their cost of capital. Many companies will set a minimum ROI that is above the cost of capital in order to adjust for risk and uncertainty, as well as to encourage decisions that are economically profitable
Page M136

Residual Income (cont.) Solution to ROI Example: Current ROI = $1,350,000 ÷ $7,500,000 = 18% Plant investment ROI = $240,000 ÷ $1,500,000 = 16% • Because the cost of capital for Trenton is 14%, any return greater than 14% is
valuable (optimal) to the company. • Because this investment will dilute Sandy’s current ROI performance to 17.67%,
the manager will not be inclined to make this investment à a suboptimal decision!
Key Question: How can Trenton motivate its managers to pursue all investments returning greater than 14%?
Page M137
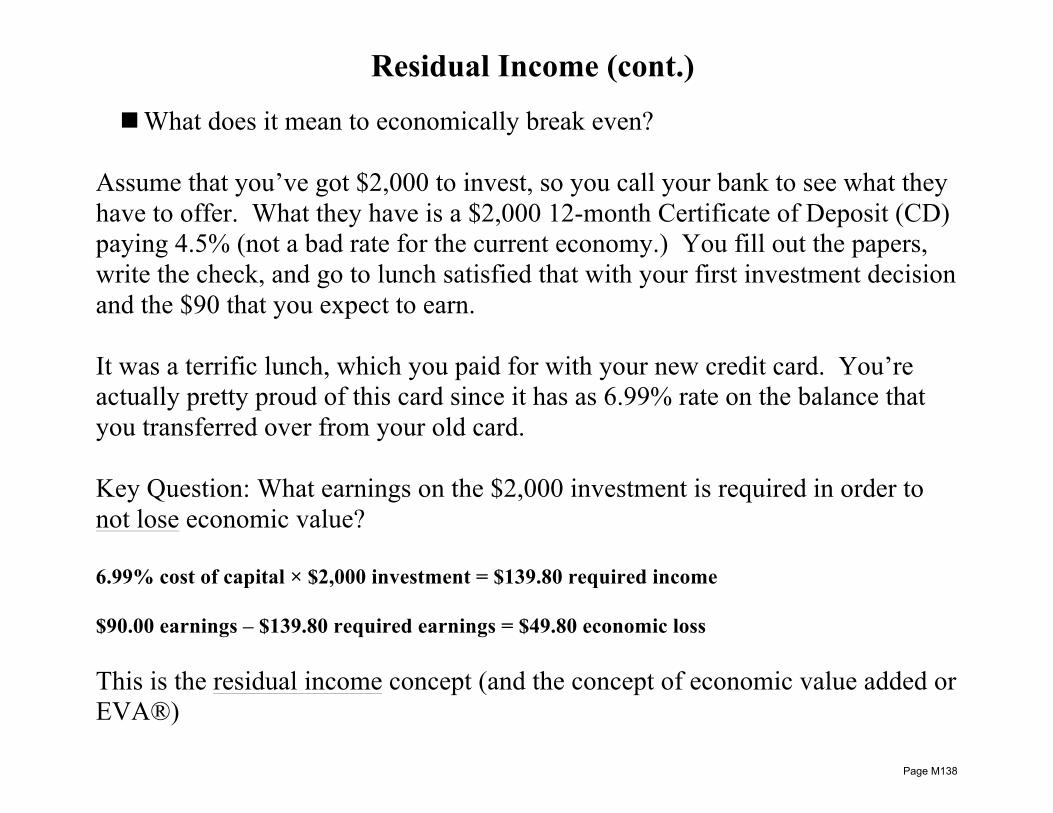
Residual Income (cont.)
n What does it mean to economically break even? Assume that you’ve got $2,000 to invest, so you call your bank to see what they have to offer. What they have is a $2,000 12-month Certificate of Deposit (CD) paying 4.5% (not a bad rate for the current economy.) You fill out the papers, write the check, and go to lunch satisfied that with your first investment decision and the $90 that you expect to earn. It was a terrific lunch, which you paid for with your new credit card. You’re actually pretty proud of this card since it has as 6.99% rate on the balance that you transferred over from your old card. Key Question: What earnings on the $2,000 investment is required in order to not lose economic value? 6.99% cost of capital × $2,000 investment = $139.80 required income $90.00 earnings – $139.80 required earnings = $49.80 economic loss This is the residual income concept (and the concept of economic value added or EVA®)
Page M138

Residual Income (cont.)
Return to Trenton Industries Example: Assume now that Trenton Industries evaluates SBU managers on the basis of residual income. Since the cost of capital for Trenton is 14%, managers are evaluated on their ability to generate income that exceeds the 14% required income level. At the close of the last quarter, the Sandy Manufacturing Plant had operating income of $1.35 million on total assets of $7.5 million. The Sandy manager is considering a potential plant investment of $1.5 million that is expected to generate additional income of $240,000. What will the Sandy manager do with this investment decision?
Page M139

Residual Income (cont.) Solution to Residual Income Example: Current residual income = $1,350,000 – ($7,500,000 × 14%) = $300,000 Plant investment residual income = $240,000 – ($1,500,000 × 14%) = $30,000 • Because this investment will increase Sandy’s current residual income to
$330,000, the manager will be inclined to make this investment à an optimal decision!
Note that performance evaluations using residual income creates a performance evaluation bias for large SBUs. A $30,000 residual income number is a lot easier for a multimillion dollar SBU to achieve versus a much smaller SBU.
Page M140
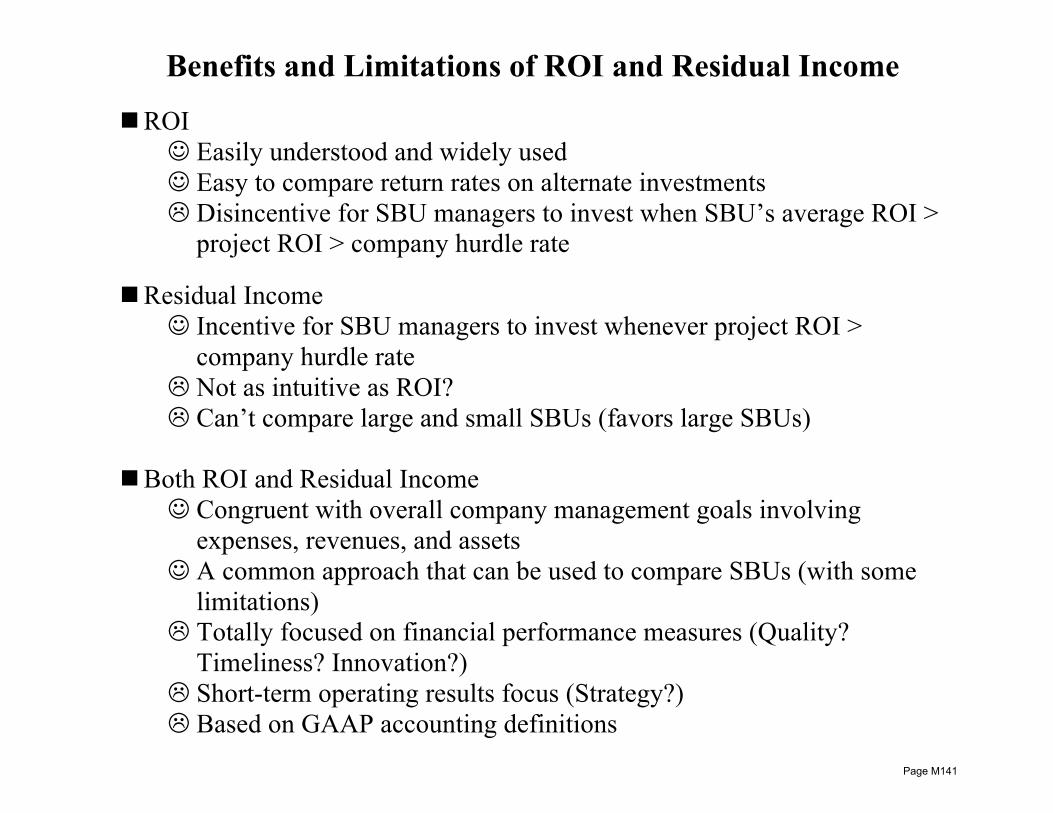
Benefits and Limitations of ROI and Residual Income
n ROI J Easily understood and widely used J Easy to compare return rates on alternate investments L Disincentive for SBU managers to invest when SBU’s average ROI >
project ROI > company hurdle rate
n Residual Income J Incentive for SBU managers to invest whenever project ROI >
company hurdle rate L Not as intuitive as ROI? L Can’t compare large and small SBUs (favors large SBUs)
n Both ROI and Residual Income
J Congruent with overall company management goals involving expenses, revenues, and assets
J A common approach that can be used to compare SBUs (with some limitations)
L Totally focused on financial performance measures (Quality? Timeliness? Innovation?)
L Short-term operating results focus (Strategy?) L Based on GAAP accounting definitions
Page M141

Economic Value Added
n EVA® is conceptually similar to Residual Income with a few key computational differences
n Cost of capital is always used, rather than a minimum rate of return
o The focus of EVA® is to create value for shareholders by earning profits greater than the firm’s cost of capital
o Cost of capital is calculated as a weighted average of the cost of the firm’s debt and equity à WACC
n When computing income, EVA® does not follow conventional accounting
practices o Most typical adjustments include capitalizing expenses that contribute
to long-term value, e.g., R&D, employee development, certain advertising
o No consistency across firms regarding these accounting adjustments
Page M142
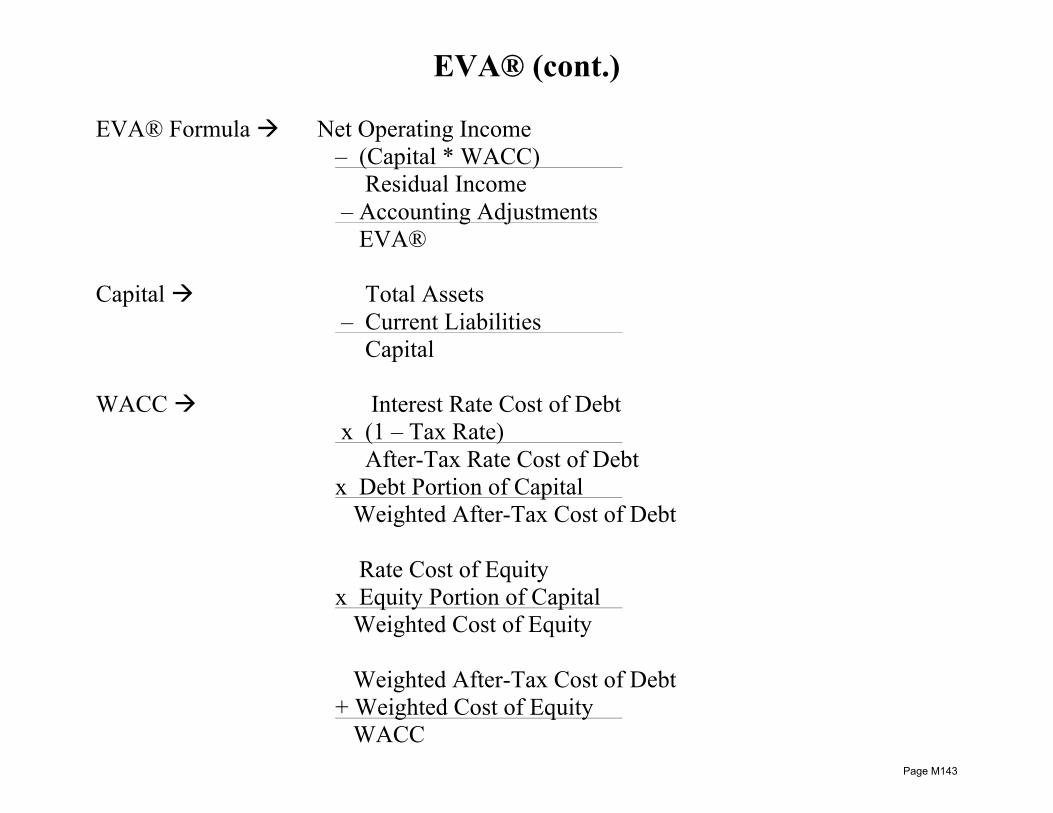
EVA® (cont.) EVA® Formula à Net Operating Income
– (Capital * WACC) Residual Income – Accounting Adjustments EVA®
Capital à Total Assets
– Current Liabilities Capital
WACC à Interest Rate Cost of Debt
x (1 – Tax Rate) After-Tax Rate Cost of Debt x Debt Portion of Capital Weighted After-Tax Cost of Debt Rate Cost of Equity x Equity Portion of Capital Weighted Cost of Equity Weighted After-Tax Cost of Debt + Weighted Cost of Equity WACC
Page M143
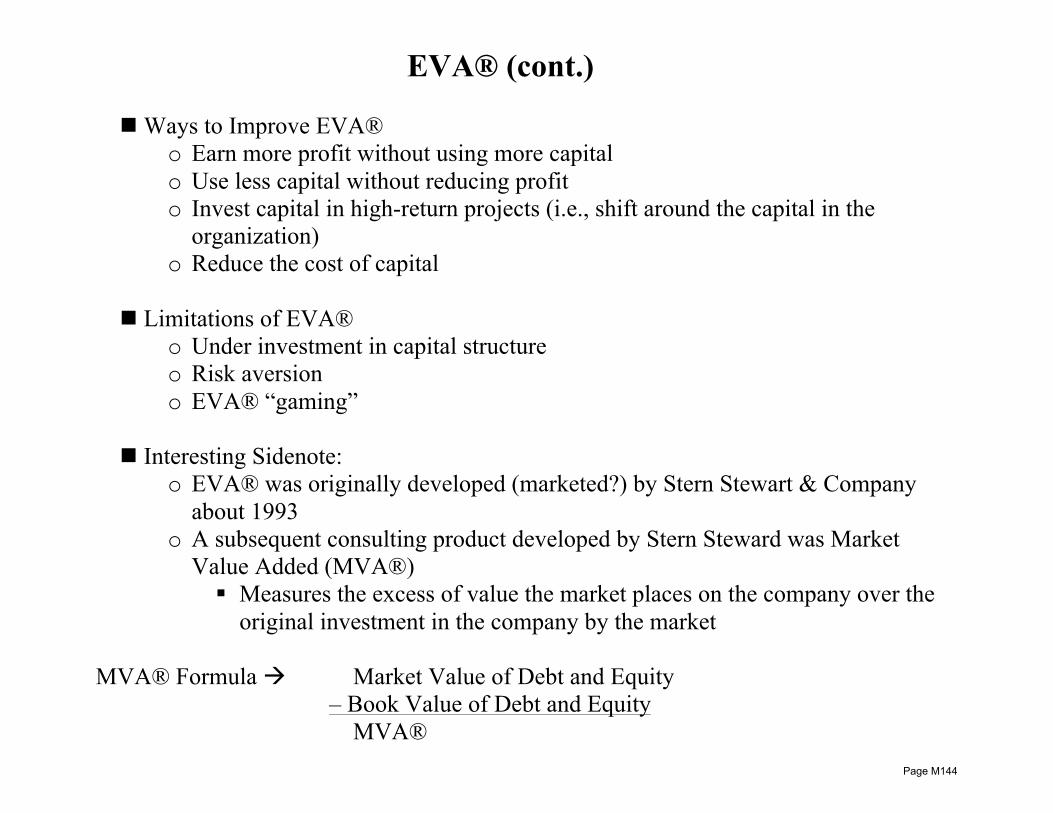
EVA® (cont.)
n Ways to Improve EVA® o Earn more profit without using more capital o Use less capital without reducing profit o Invest capital in high-return projects (i.e., shift around the capital in the
organization) o Reduce the cost of capital
n Limitations of EVA® o Under investment in capital structure o Risk aversion o EVA® “gaming”
n Interesting Sidenote: o EVA® was originally developed (marketed?) by Stern Stewart & Company
about 1993 o A subsequent consulting product developed by Stern Steward was Market
Value Added (MVA®) § Measures the excess of value the market places on the company over the
original investment in the company by the market MVA® Formula à Market Value of Debt and Equity
– Book Value of Debt and Equity MVA®
Page M144

Performance Measurement Challenges
n ROI, Residual Income, and EVA® all have One Basic Problem à GAAP! o All three are dependent on how the company interprets and measures
income, assets, and the cost of capital o GAAP definitions are complex, and companies can disagree for
internal use purposes § There are many disagreements!
n The problem is not consistency from company to company (not relevant), but consistency within the company (from SBU to SBU and among managers) o Revenue/expense recognition policies o Inventory and overall asset measurement policies o Some SBUs jointly share assets (how to separate for performance
analysis?) o Most SBUs jointly share the use and cost of debt and equity capital
(again, how to separate for performance analysis?)
n Many companies try hard to find objective and consistent measures, e.g., cash flow ROI
Page M145
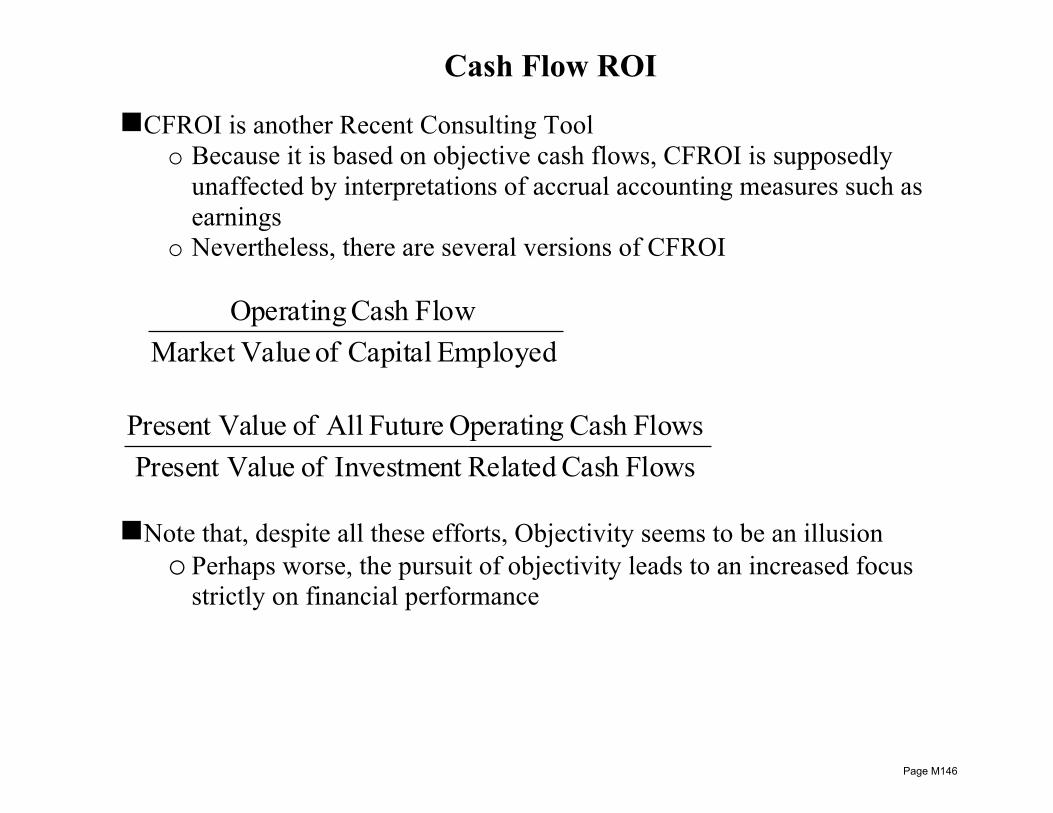
Cash Flow ROI
n CFROI is another Recent Consulting Tool o Because it is based on objective cash flows, CFROI is supposedly
unaffected by interpretations of accrual accounting measures such as earnings
o Nevertheless, there are several versions of CFROI
EmployedCapital of ValueMarket Flow Cash Operating
FlowsCash RelatedInvestment of ValuePresent FlowsCash Operating FutureAll of ValuePresent
n Note that, despite all these efforts, Objectivity seems to be an illusion o Perhaps worse, the pursuit of objectivity leads to an increased focus
strictly on financial performance
Page M146
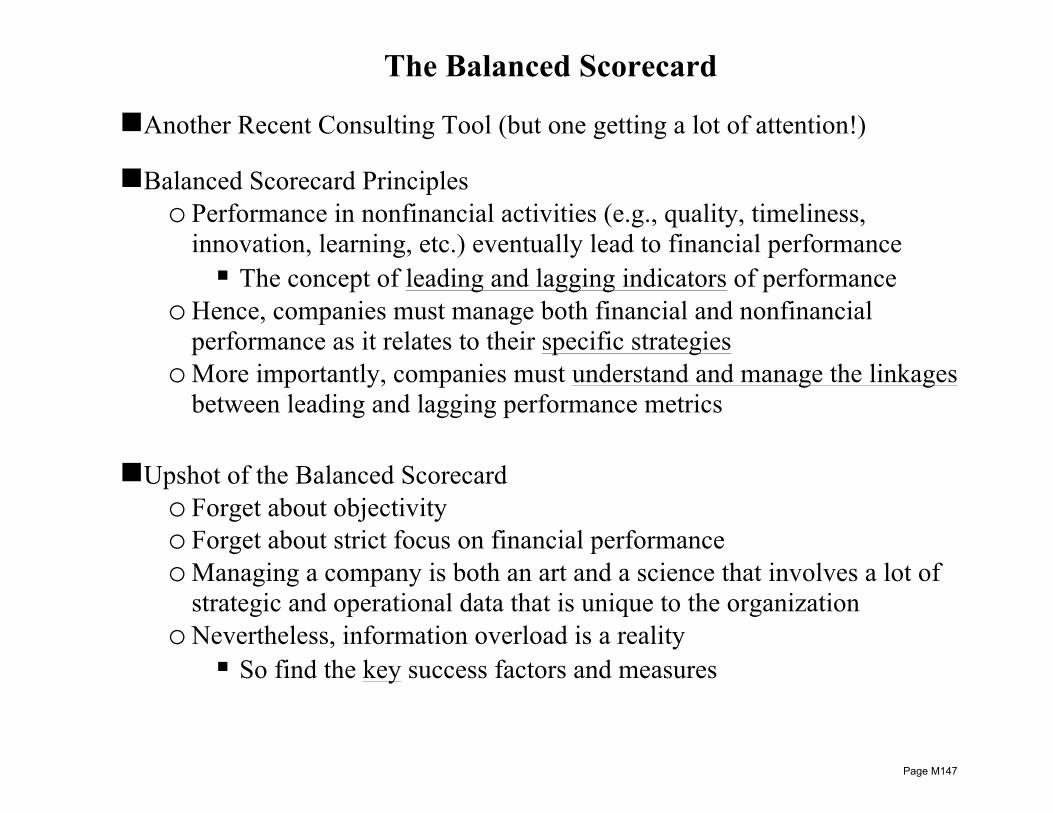
The Balanced Scorecard
n Another Recent Consulting Tool (but one getting a lot of attention!)
n Balanced Scorecard Principles o Performance in nonfinancial activities (e.g., quality, timeliness,
innovation, learning, etc.) eventually lead to financial performance § The concept of leading and lagging indicators of performance
o Hence, companies must manage both financial and nonfinancial performance as it relates to their specific strategies
o More importantly, companies must understand and manage the linkages between leading and lagging performance metrics
n Upshot of the Balanced Scorecard
o Forget about objectivity o Forget about strict focus on financial performance o Managing a company is both an art and a science that involves a lot of
strategic and operational data that is unique to the organization o Nevertheless, information overload is a reality
§ So find the key success factors and measures
Page M147
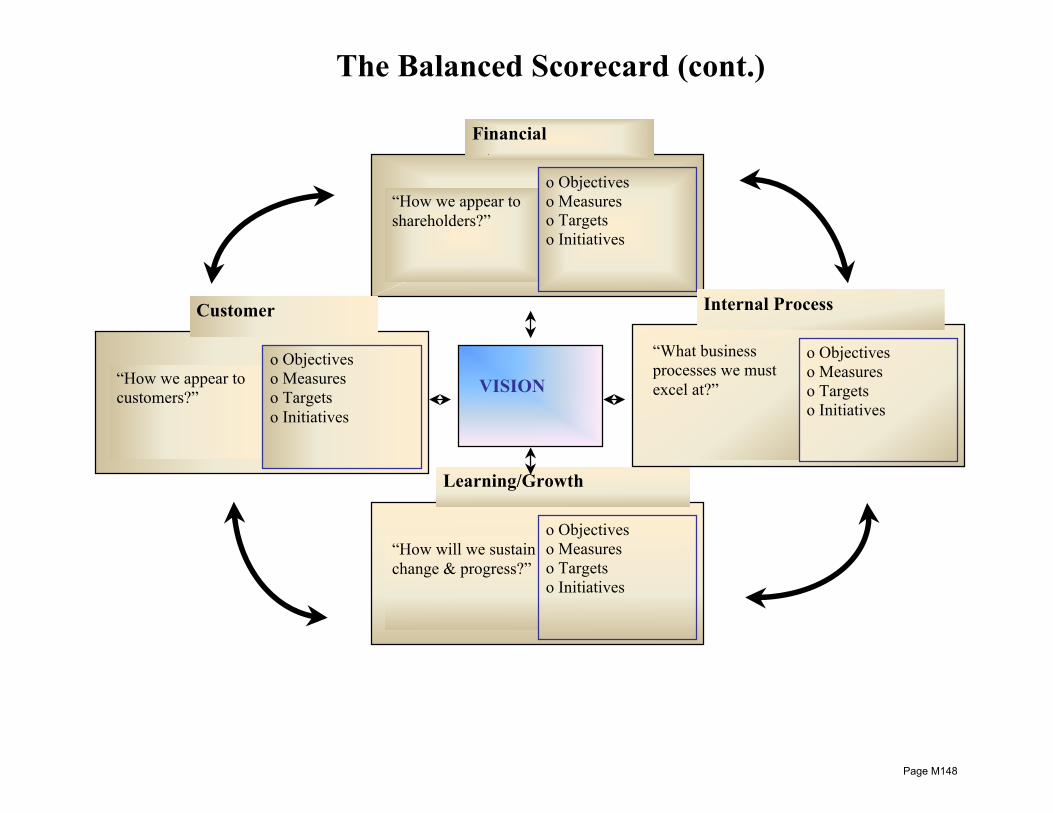
The Balanced Scorecard (cont.)
“How we appear to shareholders?”
o Objectives o Measures o Targets o Initiatives
Financial
“How we appear to customers?”
o Objectives o Measures o Targets o Initiatives
Customer
“How will we sustain change & progress?”
o Objectives o Measures o Targets o Initiatives
Learning/Growth
“What business processes we must excel at?”
o Objectives o Measures o Targets o Initiatives
Internal Process
VISION
Page M148

The Balanced Scorecard (cont.)
Performance Measures Customer Service Cost Quality Time
Reliable Delivery Fastest Delivery • Purchase cost to
customer • Delivery cost to
customer • Setup cost to
customer • Maintenance and
repair cost to customer
• Returns by customers
• Quality rankings by other agencies
• Customer survey response
• Percentage of on-time deliveries
• Number of production interruptions
• Average response-time for service call
• Time to complete contract
• Production cycle time
Performance Measures of Internal Processes
Innovation Processes
Operation Processes
Service-after-sale processes
Cost Measures
• R&D cost per new product
• Payback on R&D costs
• Unit-level costs • Batch-level costs • Product line costs
• Cost per service incidence
• Costs of replacement parts
Quality Measures
• Number of modifications required per design
• Percentage of sales from new products
• Defects-per-million opportunities (six sigma)
• Errors in customer service
• Customer requests handled on first call
• Satisfaction survey responses
Time Measures
• Lead time (idea to working model)
• Design cycle time
• Lead time (order to delivery)
• Production cycle time
• Lead time (request to fulfillment)
• Repair cycle time
Page M149
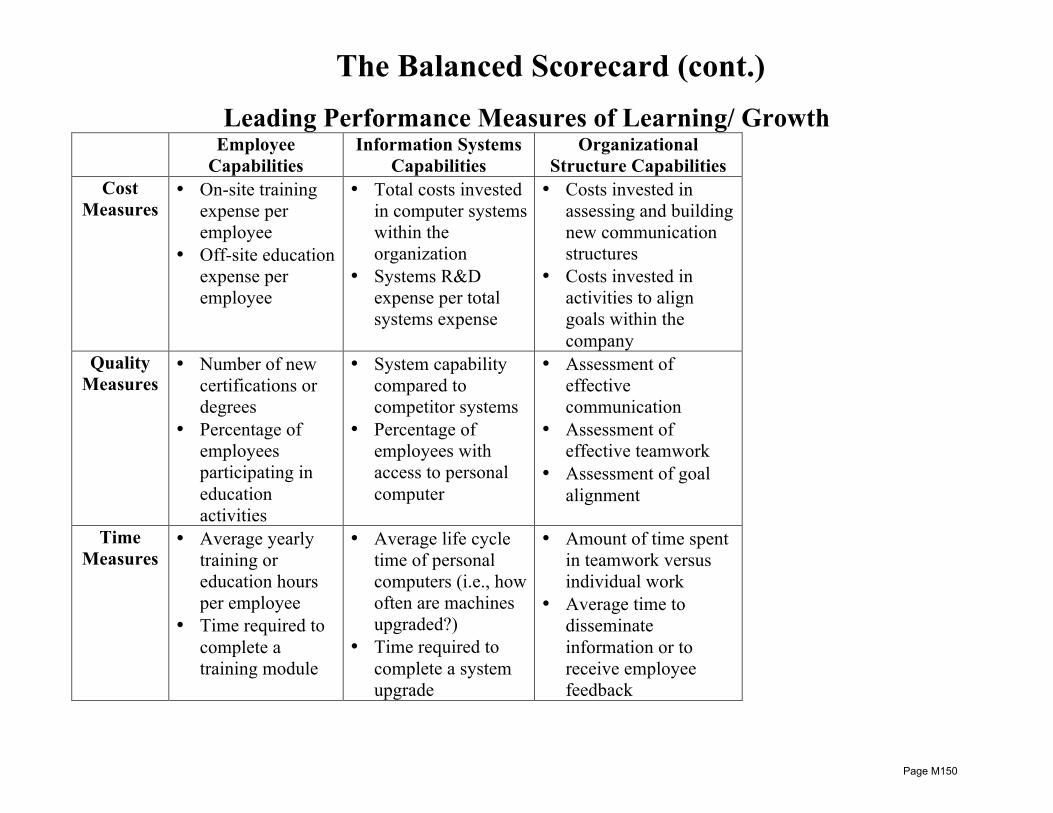
The Balanced Scorecard (cont.)
Leading Performance Measures of Learning/ Growth Employee
Capabilities Information Systems
Capabilities Organizational
Structure Capabilities Cost
Measures • On-site training
expense per employee
• Off-site education expense per employee
• Total costs invested in computer systems within the organization
• Systems R&D expense per total systems expense
• Costs invested in assessing and building new communication structures
• Costs invested in activities to align goals within the company
Quality Measures
• Number of new certifications or degrees
• Percentage of employees participating in education activities
• System capability compared to competitor systems
• Percentage of employees with access to personal computer
• Assessment of effective communication
• Assessment of effective teamwork
• Assessment of goal alignment
Time Measures
• Average yearly training or education hours per employee
• Time required to complete a training module
• Average life cycle time of personal computers (i.e., how often are machines upgraded?)
• Time required to complete a system upgrade
• Amount of time spent in teamwork versus individual work
• Average time to disseminate information or to receive employee feedback
Page M150
The Balanced Scorecard (cont.)
n Critical to Success of a Balanced Scorecard o Based on unique company strategy o Focused set of measures to link together
§ Normally, less than 15 total measures used in practice
Page M151

Practice Problems Performance data for three divisions at Cupco, Inc. are presented below. Use these data to answer Problems 1 through 3. Division A B C Sales $1,500,000 $750,000 ? Operating income 200,000 75,000 ? Investment (assets) 500,000 ? 2,500,000 Profit margin (return on sales) ? ? 0.5% Asset turnover ? ? 1.5 Return on investment ? 10% ?
1. What is the return on investment for Division A? a. 3% b. 13.33% c. 30% d. 40% e. 300%
2. What is the asset turnover for Division B?
a. 0.1 b. 1 c. 10 d. 100 e. 750
Page M152
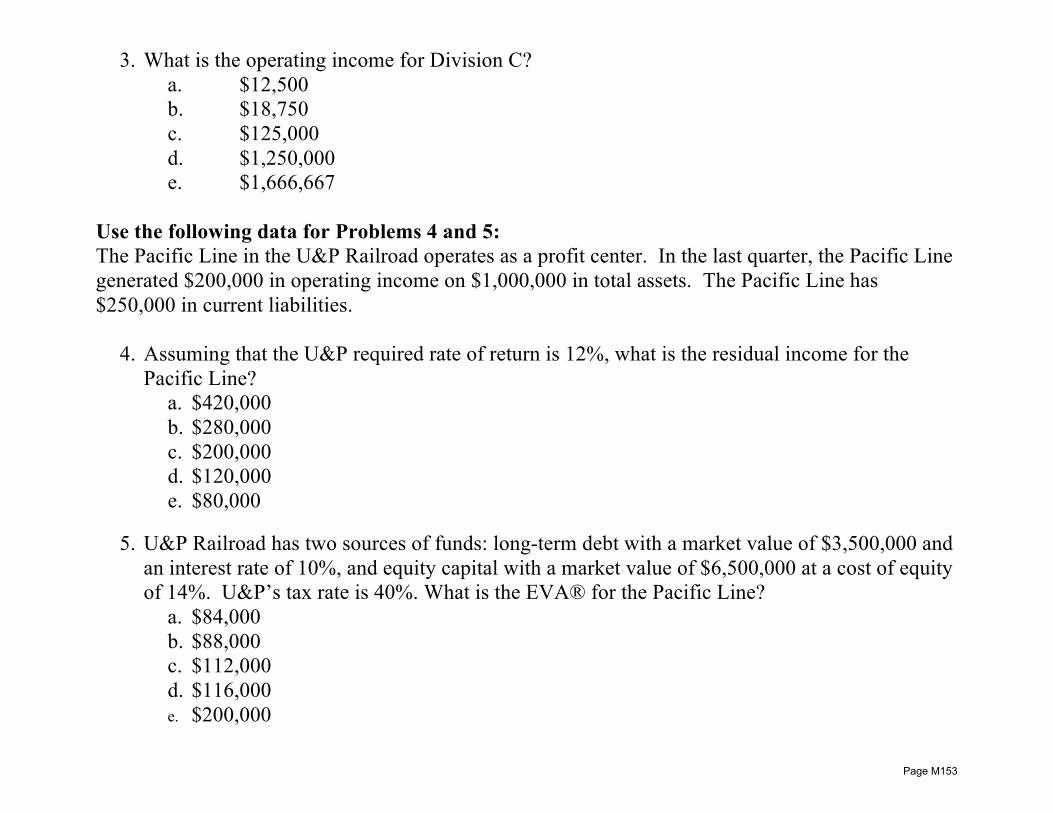
3. What is the operating income for Division C? a. $12,500 b. $18,750 c. $125,000 d. $1,250,000 e. $1,666,667
Use the following data for Problems 4 and 5: The Pacific Line in the U&P Railroad operates as a profit center. In the last quarter, the Pacific Line generated $200,000 in operating income on $1,000,000 in total assets. The Pacific Line has $250,000 in current liabilities.
4. Assuming that the U&P required rate of return is 12%, what is the residual income for the Pacific Line?
a. $420,000 b. $280,000 c. $200,000 d. $120,000 e. $80,000
5. U&P Railroad has two sources of funds: long-term debt with a market value of $3,500,000 and
an interest rate of 10%, and equity capital with a market value of $6,500,000 at a cost of equity of 14%. U&P’s tax rate is 40%. What is the EVA® for the Pacific Line?
a. $84,000 b. $88,000 c. $112,000 d. $116,000 e. $200,000
Page M153
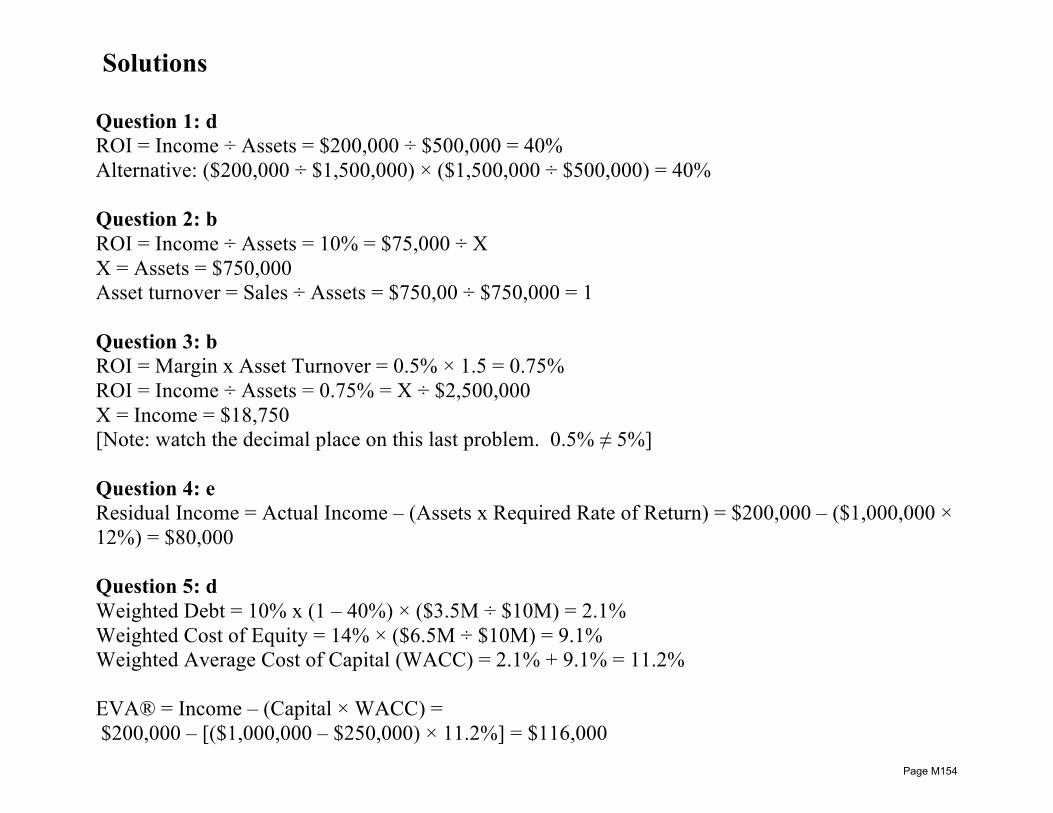
Solutions Question 1: d ROI = Income ÷ Assets = $200,000 ÷ $500,000 = 40% Alternative: ($200,000 ÷ $1,500,000) × ($1,500,000 ÷ $500,000) = 40% Question 2: b ROI = Income ÷ Assets = 10% = $75,000 ÷ X X = Assets = $750,000 Asset turnover = Sales ÷ Assets = $750,00 ÷ $750,000 = 1 Question 3: b ROI = Margin x Asset Turnover = 0.5% × 1.5 = 0.75% ROI = Income ÷ Assets = 0.75% = X ÷ $2,500,000 X = Income = $18,750 [Note: watch the decimal place on this last problem. 0.5% ≠ 5%] Question 4: e Residual Income = Actual Income – (Assets x Required Rate of Return) = $200,000 – ($1,000,000 × 12%) = $80,000 Question 5: d Weighted Debt = 10% x (1 – 40%) × ($3.5M ÷ $10M) = 2.1% Weighted Cost of Equity = 14% × ($6.5M ÷ $10M) = 9.1% Weighted Average Cost of Capital (WACC) = 2.1% + 9.1% = 11.2% EVA® = Income – (Capital × WACC) = $200,000 – [($1,000,000 – $250,000) × 11.2%] = $116,000
Page M154
Unit C Topic 5 Quality Considerations
Learning Objectives: • define quality as it relates to customer expectations • define conformance as it relates to quality and identify the characteristics of goalpost quality conformance and absolute
quality conformance • describe and identify the components of the costs of quality commonly referred to as prevention costs, appraisal costs,
internal failure costs, and external failure costs • identify the opportunity costs associated with poor quality management • discuss the relationship between quality management and productivity and explain why misconceptions about this
relationship can lead to poor decisions
Page M155
Quality and Customer Expectations
n The Definition of Quality is a Product or Service that o Conforms to design o Meets or exceeds customer expectations o At a competitive price that customers are willing to pay
n Core Principles of Total Quality Management (TQM) o Focus on satisfying the customer o Strive for continuous improvement (Kaizen) o Involve the entire work force
Example: Every single baseball pitched in the major leagues is made in a Costa Rican factory owned by Rawlings Sporting Goods Company. A Rawlings baseball begins life as a “pill,” a small sphere of cork and rubber enclosed in a rubber shell. The pill is tightly wound with three different layers of wool yarn, and then finished with a winding of cotton/polyester yarn. This “core” is coated with a latex adhesive. It is this gooey and hard lump over which an extremely tight-fitting jacket of leather must be sewn. Sewing on the cover is a major effort. No one has been able to successfully create a machine that can automatically stitch the cover on a professional baseball. Hence, Rawlings employs about 1,000 baseball sewing experts. In its factory, Rawlings’s top sewing pros can sew four to six baseballs an hour, achieving perfect string tension by feel. A wooden press rolls the seams flat, and finished balls are stored in a dehumidifying room that shrinks the covers tight and protects the balls from tropical humidity that might make them bloat illegally. Baseballs are carefully inspected at the Rawlings plant before being packed for shipping. A baseball that turns out too skinny, too hefty, or otherwise off-spec is stamped “blem” for blemish and sold as a practice ball.
Page M156
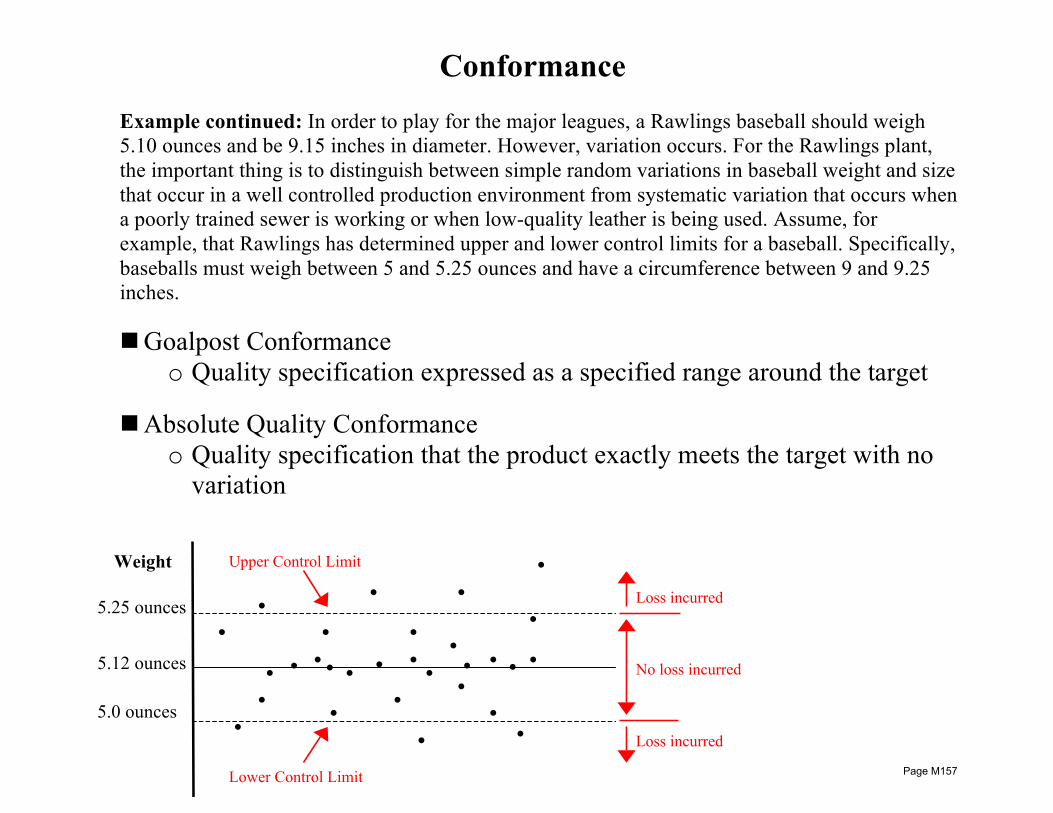
Conformance
Example continued: In order to play for the major leagues, a Rawlings baseball should weigh 5.10 ounces and be 9.15 inches in diameter. However, variation occurs. For the Rawlings plant, the important thing is to distinguish between simple random variations in baseball weight and size that occur in a well controlled production environment from systematic variation that occurs when a poorly trained sewer is working or when low-quality leather is being used. Assume, for example, that Rawlings has determined upper and lower control limits for a baseball. Specifically, baseballs must weigh between 5 and 5.25 ounces and have a circumference between 9 and 9.25 inches. n Goalpost Conformance
o Quality specification expressed as a specified range around the target
n Absolute Quality Conformance o Quality specification that the product exactly meets the target with no
variation
Batch #
Weight
5.25 ounces
5.0 ounces
5.12 ounces
•
• • •
• • • • •
•
• • • • •
• •
• •
•
•
•
•
• •
•
•
• •
Upper Control Limit
Lower Control Limit
No loss incurred
Loss incurred
Loss incurred
Page M157
Costs of Quality
n Costs of Quality include costs spent to achieve TQM, as well as costs spent when products and processes fail to have high quality
n Prevention Costs
o Costs incurred to avoid quality defects o Includes quality training, quality planning/design, equipment
maintenance, supplier assurance, information systems
Example continued: The quality of Rawlings baseballs are highly dependent on the quality of the raw materials and on the expertise of those who stitch on the leather covers. Obviously, Rawlings will likely spend a lot of money working with its suppliers and training its employees to build a quality product.
n Appraisal Costs
o Measurement and analysis costs incurred to determine if products conform to specification
o Includes test/inspection, equipment/instruments, audits, lab testing, field evaluation, information systems
Example continued: A great deal of inspection takes place at Rawlings to gather data similar to what is shown in the control charge shown previously. This inspection requires individuals to invest time using special equipment to evaluate each ball for size, weight, color, stitching, etc.
Page M158

Costs of Quality (cont.)
n Internal Failure Costs o Costs incurred when poor quality is discovered through appraisal prior
to delivery o Includes correction effort, rework/scrap, process downtime, expediting,
reinspection/retest Example continued: If a Rawlings employee spends ten minutes sewing a baseball, only to have the cover suddenly rip because of poor quality leather material, the company has lost money due to both the scrapped leather material and the wages paid for ten minutes of sewing a useless ball.
n External Failure Costs
o Costs incurred when poor quality products reach the customer o Includes customer complaints/returns, recall, liability, lost sales due to
reputation Example continued: Bad news travels fast. If a cover of a Rawlings baseball is pulled loose by a pitcher in the act of throwing a knuckleball during a game, the ball is immediately removed from the game. Obviously, a lot of people instantly know about the product failure. Worse, though, is when product failure leads to news announcements and discussion in the media. Think about some famous examples of publicized product or service failures (software bugs, unsafe tires, faulty medicine or medical procedures, audit failures).
Page M159
TQM Myths
n Investments in Quality Improvements lead to Decreased Productivity o Productivity is the relationship between output and input resources o The cost required to manage quality failure events lead to the creation
of a “hidden factory” § The rework, retest, redesign process coupled with additional “just
in case” inventory o Remove the hidden factory through TQM will increase output and
improve productivity n Perfect Quality is Too Expensive
o Customers really don’t care if products are manufactured within some set of specifications
o The proof of a product’s quality is in its performance under all conditions of “real life”
o Products that always perform as expected are robust, and they gain steadfast customer loyalty § Measuring revenue growth due to excellent TQM that inspires
customer loyalty is hard o On the other hand, opportunity cost of external failure is tremendous
§ Measuring revenues lost due to poor TQM is also hard in a traditional accounting system
Page M160
Practice Problems
1. Product quality related costs are part of a total quality related program. A product quality
related cost incurred in detecting individual products that do not conform to specifications is an example of a(an)
a. Prevention cost b. Appraisal cost c. Internal failure cost d. External failure cost e. Opportunity cost
2. An example of an internal failure cost is
a. Maintenance b. Inspection c. Rework d. Product recalls e. Customer losses
3. The four categories of costs associated with product quality costs are
a. External failure, internal failure, prevention, and carrying. b. External failure, internal failure, prevention, and appraisal. c. External failure, internal failure, training, and appraisal. d. Warranty, product liability, prevention, and appraisal.
Page M161

4. The cost of scrap, rework, and tooling changes in a product quality cost system are categorized
as a(an) a. External failure cost b. Internal failure cost c. Training cost d. Prevention cost e. Appraisal cost
5. The cost of statistical quality control in a product quality cost system is categorized as a(an) a. External failure cost b. Internal failure cost c. Training cost d. Prevention cost e. Appraisal cost
Page M162
Solutions Question 1: b Question 2: c Question 3: b Question 4: b Question 5: e
Page M163