management accounts and prudential indicators for … accounts and prudential indicators ... the...
TRANSCRIPT
Management Accounts and Prudential Indicators for the period ending
31st May 2013
21
Index
Key to Traffic Light System 2 Revenue Budget Summary - Table 1 3 Revenue Budget - Table 2 4
Capital Budget 6 Pensions Account 8 Treasury Management - Borrowing & Lending Activity 9 Movement in Revenue Reserves 10 Balance Sheet 11 Prudential Indicators 12 Budget Virements Processed 15 HFR Solutions 15
22

Key To Traffic Light System
The elements of the Traffic Light system being used in the report to highlight significant outturn variances / issues are as follows:-
1. Status Column - indicates, using a colour reference whether an issue is:- Red Potentially detrimental to the finances of the Authority Green In line with budget or potentially advantageous to the finances
of the Authority.
2. Direction Column - this indicates the relative movement in the projected outturn position compared to the previous month as follows:-
Red A detrimental change. Amber No change.
Green An advantageous change.
Red Green
DIRECTION
Possible Combinations
Status
Red
Amber
Green
The combinations shaded are those that give the most concern from a financial perspective i.e. Status = Red and Direction = Red, Amber or Green.
23

HUMBERSIDE FIRE & RESCUE SERVICE COMMENTARY ON THE MANAGEMENT ACCOUNTS
For the period 1 April 2013 to 31 May 2013 The following statements represent a summary of the financial activity of the Service for the period stated above. Each statement is accompanied with notes, referenced to specific lines on that statement where significant variances have been forecasted or where further explanation of information shown is necessary. Revenue Statements These statements show the actual and committed revenue expenditure, in summary subjective heading format (Table 1) and broken down by objective headings (Table 2), as at 31 May 2013 compared to the profiled 2013/14 budget for the same period. The report also shows the forecasted outturn for the full year based on current levels of income and expenditure and any known variations to the end of the financial year. Table 1
Original Revised NoteBudget Budget Profile Actual & Projection Status Direction
Committed£'000 £'000 £'000 £'000 £'000 £'000 %
Employees
Wholetime 26,695 26,695 4,450 4,357 26,695 - - Green AmberRetained 3,783 3,783 631 291 3,783 - - Green AmberSupport 6,163 6,059 1,014 923 6,059 - - Green Amber
Other Employee Expenses 1,372 1,410 279 268 1,410 - - Green Amber(Training, Occ Health, Insurance)
Total Pay & Pensions 38,013 37,947 6,374 5,839 37,947 - -
Premises 2,168 2,168 915 816 2,168 - - Green Amber
Transport 1,169 1,185 254 179 1,185 - - Green Amber
Supplies & Services 3,519 3,569 541 701 3,569 - - Green Amber
Support Services 130 130 2 - 130 - - Green Amber
Total Expenditure 44,999 44,999 8,086 7,535 44,999 - -
Income (521) (521) (22) (472) (521) - - Green Amber
Net Expenditure (Ex Capital Charges) 44,478 44,478 8,064 7,063 44,478 - - Interest Payable 996 996 - 13 996 - - Green Amber
Interest Receivable (50) (50) (8) (9) (50) - - Green Amber
Contingency 35 35 - - 35 - - Green Amber
Accounting Adjustments 978 978 (131) (1,601) 978 - - Green Amber
Contributions to /(from) Reserves 5 5 - - 5 - - Green Amber
Net Budget Requirement 46,442 46,442 7,925 5,466 46,442 - - Green Amber
Financed By Council Tax Funding (3,815) (3,815) (636) (696) (3,815) - - Business Rates (3,101) (3,101) (517) (539) (3,101) - - National Non Domestic Rates (20,550) (20,550) (3,425) (9,120) (20,550) - - Precepts (18,976) (18,976) (3,290) (3,296) (18,976) - -
- - 57 (8,185) - - -
Variance
HUMBERSIDE FIRE & RESCUE SERVICEREVENUE MONITORING SUMMARY STATEMENT 2013/14
1 April 2013 to 31 May 2013 (Period 02)
31 May 2013 Full Year Traffic Light
24

Table 2
Original Revised NoteBudget Budget Profile Actual & Projection Status Direction
Committed£'000 £'000 £'000 £'000 £'000 £'000 %
Community Fire SafetyExpenditure
EmployeesWholetime 1,226 1,226 205 166 1,226 - - Green AmberRetained 76 76 13 1 76 - - Green AmberSupport 1,938 1,834 306 254 1,834 - - Green AmberIndirect Employees 9 47 8 2 47 - - Green Amber
Premises 1 1 - 5 1 - - Green Amber
Transport 7 23 4 3 23 - - Green Amber
Supplies and Services 306 356 59 20 356 - - Green Amber
Total Expenditure 3,563 3,563 595 451 3,563 - -
Income (63) (63) (11) (88) (63) - - Green Amber
Net Expenditure 3,500 3,500 584 363 3,500 - -
Fire Fighting & Rescue OperationsExpenditure
EmployeesWholetime 21,502 21,502 3,584 3,520 21,502 - - Green AmberControl 1,242 1,242 207 197 1,242 - - Green AmberRetained 3,707 3,707 618 290 3,707 - - Green AmberSupport 158 158 26 20 158 - - Green AmberIndirect Employees 19 19 3 - 19 - - Green Amber
Premises 1,278 1,278 625 584 1,278 - - Green Amber
Transport 17 17 3 - 17 - - Green Amber
Supplies and Services 1,263 1,263 157 173 1,263 - - Green Amber
Total Expenditure 29,186 29,186 5,223 4,784 29,186 - -
Income (305) (305) (4) (379) (305) - - Green Amber
Net Expenditure 28,881 28,881 5,219 4,405 28,881 - -
Management & Support ServicesExpenditure
EmployeesWholetime 2,725 2,725 454 474 2,725 - - Green AmberSupport 4,067 4,067 682 649 4,067 - - Green AmberOther Pension Costs 589 589 79 112 589 - - Green AmberIndirect Employees 554 554 88 141 554 - - Green AmberEmployee Related Insurances 201 201 101 13 201 - - Green Amber
Premises 889 889 290 227 889 - - Green Amber
Transport 1,141 1,141 246 175 1,141 - - Green Amber
Supplies and Services 1,721 1,721 287 459 1,721 - - Green Amber
Support Services 125 125 2 - 125 - - Green Amber
Contingency 35 35 - - 35 - - Green Amber
Total Expenditure 12,047 12,047 2,229 2,250 12,047 - -
Income (153) (153) (7) (5) (153) - - Green Amber
Net Expenditure 11,894 11,894 2,222 2,245 11,894 - -
Democratic Representation & ManagementExpenditure
Transport 4 4 1 1 4 - - Green Amber
Supplies and Services 157 157 26 39 157 - - Green Amber
Support Services - - - - - - - Green Amber
Net Expenditure 161 161 27 40 161 - -
Cont….
Variance
HUMBERSIDE FIRE & RESCUE SERVICEREVENUE MONITORING STATEMENT 2013/14
1 April 2013 to 31 May 2013 (Period 02)
31 May 2013 Full Year Traffic Light
25
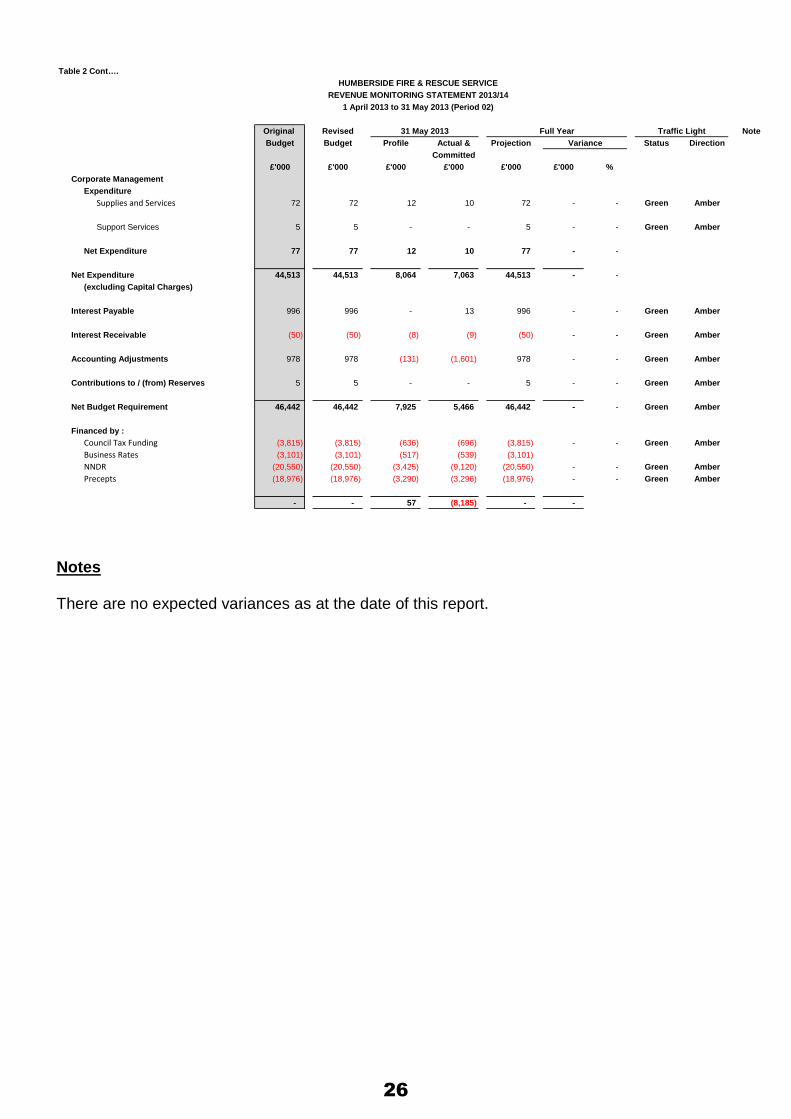
Table 2 Cont….
Original Revised NoteBudget Budget Profile Actual & Projection Status Direction
Committed£'000 £'000 £'000 £'000 £'000 £'000 %
Corporate ManagementExpenditure
Supplies and Services 72 72 12 10 72 - - Green Amber
Support Services 5 5 - - 5 - - Green Amber
Net Expenditure 77 77 12 10 77 - -
Net Expenditure 44,513 44,513 8,064 7,063 44,513 - - (excluding Capital Charges)
Interest Payable 996 996 - 13 996 - - Green Amber
Interest Receivable (50) (50) (8) (9) (50) - - Green Amber
Accounting Adjustments 978 978 (131) (1,601) 978 - - Green Amber
Contributions to / (from) Reserves 5 5 - - 5 - - Green Amber
Net Budget Requirement 46,442 46,442 7,925 5,466 46,442 - - Green Amber
Financed by :Council Tax Funding (3,815) (3,815) (636) (696) (3,815) - - Green AmberBusiness Rates (3,101) (3,101) (517) (539) (3,101)NNDR (20,550) (20,550) (3,425) (9,120) (20,550) - - Green AmberPrecepts (18,976) (18,976) (3,290) (3,296) (18,976) - - Green Amber
- - 57 (8,185) - -
Variance
HUMBERSIDE FIRE & RESCUE SERVICEREVENUE MONITORING STATEMENT 2013/14
1 April 2013 to 31 May 2013 (Period 02)
31 May 2013 Full Year Traffic Light
Notes There are no expected variances as at the date of this report.
26

Capital Statement This report shows the actual and committed capital expenditure as at 31 May 2013 compared with the adjusted profiled 2013/14 budget for the same period. This report also shows the forecasted outturn for the full year based on current levels of expenditure and any known variations to the end of the financial year.
Table 3
Original Revised NoteBudget Budget Profile Actual & Projection Status Direction
Committed£'000 £'000 £'000 £'000 £'000 £'000 %
SCHEME
Building WorksInvest to Save 200 200 - 200 - - Green Amber
200 200 - - 200 - -
VehiclesOperational Vehicles 1,431 1,431 505 1,431 - - Green Amber
Support Vehicles 319 319 25 319 - - Green Amber
Equipment 609 609 106 609 - - Green Amber
Information TechnologyCore Programme 320 320 64 320 - - Green Amber
2,879 2,879 - 700 2,879 - -
Variance
HUMBERSIDE FIRE & RESCUE SERVICECAPITAL MONITORING STATEMENT 2013/14
1 April 2013 to 31 May 2013 (Period 02)
31 May 2013 Full Year Traffic Light
Notes There are no expected variances as at the date of this report. 2012/13 capital slippage is subject to approval at 24th June 2013 Fire Authority and will be incorporated into the 30 June 2013 Budget Monitoring.
27

Pensions Account Statement The Authority has budgeted for a deficit of £9.307m on this account for 2013/14. As at 31st May this is still expected to be the deficit. The deficit on this account is financed through the Pensions Top-up Grant given by the CLG, of which 80% of the grant will be received in July of this year. The Authority has to stand any cash flow losses until the balance of the grant is paid in full in July 2014. Table 4
Original Revised NoteBudget Budget Profile Actual Projection£'000 £'000 £'000 £'000 £'000 £'000 %
Expenditure
Pension payments 11,701 11,701 1,950 3,070 11,701 - -
Commutations 2,701 2,701 450 322 2,701 - -
Transfer Values 100 100 17 - 100 - -
Total Pensions Expenditure 14,502 14,502 2,417 3,392 14,502 - -
Income
ContributionsIll Health (180) (180) - - (180) - - Employee's (1,741) (1,741) (290) (426) (1,741) - - Employer's (3,174) (3,174) (529) (670) (3,174) - -
(5,095) (5,095) (819) (1,096) (5,095) - -
Transfer Values (100) (100) - - (100) - -
Total Pensions Income (5,195) (5,195) (819) (1,096) (5,195) - -
Net Pensions Deficit/(Surplus) To be financed by CLG grant 9,307 9,307 1,598 2,297 9,307 - -
Variance
HUMBERSIDE FIRE & RESCUE SERVICEPENSIONS ACCOUNT STATEMENT 2013/14
1 April 2013 to 31 May 2013 (Period 02)
31 May 2013 Full Year
28
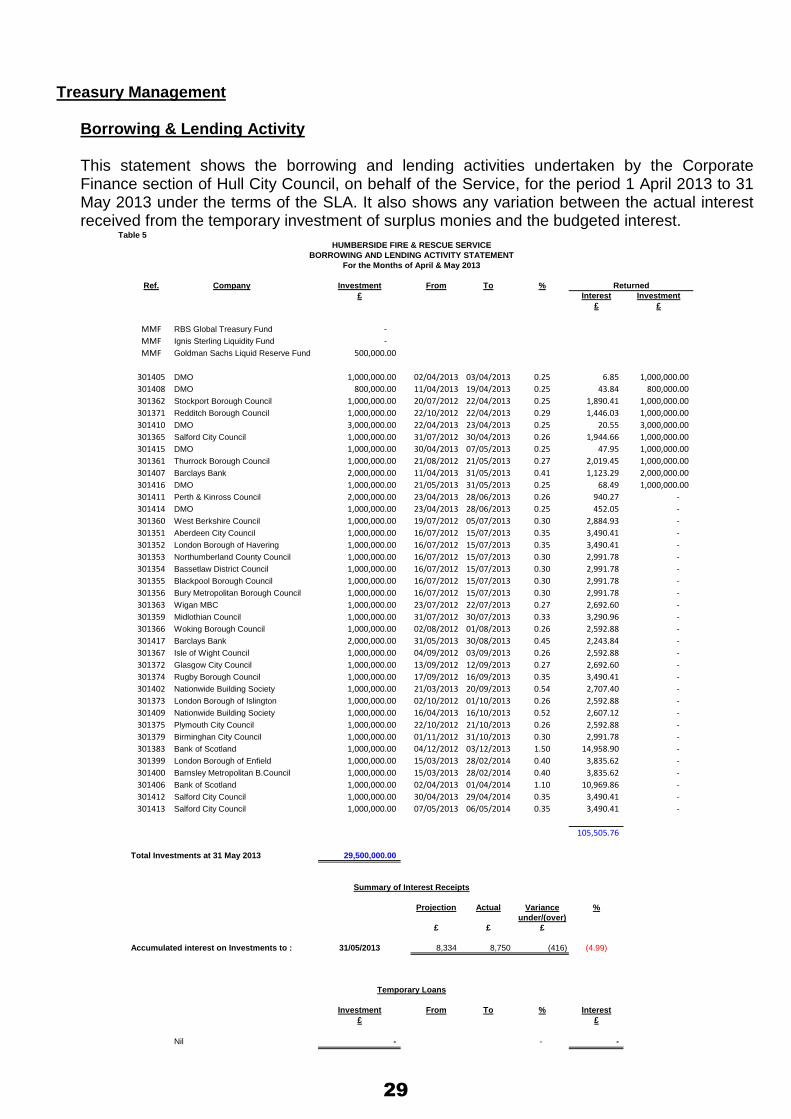
Treasury Management
Borrowing & Lending Activity This statement shows the borrowing and lending activities undertaken by the Corporate Finance section of Hull City Council, on behalf of the Service, for the period 1 April 2013 to 31 May 2013 under the terms of the SLA. It also shows any variation between the actual interest received from the temporary investment of surplus monies and the budgeted interest.
Table 5
Ref. Company Investment From To %£ Interest Investment
£ £
MMF RBS Global Treasury Fund - MMF Ignis Sterling Liquidity Fund - MMF Goldman Sachs Liquid Reserve Fund 500,000.00
301405 DMO 1,000,000.00 02/04/2013 03/04/2013 0.25 6.85 1,000,000.00 301408 DMO 800,000.00 11/04/2013 19/04/2013 0.25 43.84 800,000.00 301362 Stockport Borough Council 1,000,000.00 20/07/2012 22/04/2013 0.25 1,890.41 1,000,000.00 301371 Redditch Borough Council 1,000,000.00 22/10/2012 22/04/2013 0.29 1,446.03 1,000,000.00 301410 DMO 3,000,000.00 22/04/2013 23/04/2013 0.25 20.55 3,000,000.00 301365 Salford City Council 1,000,000.00 31/07/2012 30/04/2013 0.26 1,944.66 1,000,000.00 301415 DMO 1,000,000.00 30/04/2013 07/05/2013 0.25 47.95 1,000,000.00 301361 Thurrock Borough Council 1,000,000.00 21/08/2012 21/05/2013 0.27 2,019.45 1,000,000.00 301407 Barclays Bank 2,000,000.00 11/04/2013 31/05/2013 0.41 1,123.29 2,000,000.00 301416 DMO 1,000,000.00 21/05/2013 31/05/2013 0.25 68.49 1,000,000.00 301411 Perth & Kinross Council 2,000,000.00 23/04/2013 28/06/2013 0.26 940.27 - 301414 DMO 1,000,000.00 23/04/2013 28/06/2013 0.25 452.05 - 301360 West Berkshire Council 1,000,000.00 19/07/2012 05/07/2013 0.30 2,884.93 - 301351 Aberdeen City Council 1,000,000.00 16/07/2012 15/07/2013 0.35 3,490.41 - 301352 London Borough of Havering 1,000,000.00 16/07/2012 15/07/2013 0.35 3,490.41 - 301353 Northumberland County Council 1,000,000.00 16/07/2012 15/07/2013 0.30 2,991.78 - 301354 Bassetlaw District Council 1,000,000.00 16/07/2012 15/07/2013 0.30 2,991.78 - 301355 Blackpool Borough Council 1,000,000.00 16/07/2012 15/07/2013 0.30 2,991.78 - 301356 Bury Metropolitan Borough Council 1,000,000.00 16/07/2012 15/07/2013 0.30 2,991.78 - 301363 Wigan MBC 1,000,000.00 23/07/2012 22/07/2013 0.27 2,692.60 - 301359 Midlothian Council 1,000,000.00 31/07/2012 30/07/2013 0.33 3,290.96 - 301366 Woking Borough Council 1,000,000.00 02/08/2012 01/08/2013 0.26 2,592.88 - 301417 Barclays Bank 2,000,000.00 31/05/2013 30/08/2013 0.45 2,243.84 - 301367 Isle of Wight Council 1,000,000.00 04/09/2012 03/09/2013 0.26 2,592.88 - 301372 Glasgow City Council 1,000,000.00 13/09/2012 12/09/2013 0.27 2,692.60 - 301374 Rugby Borough Council 1,000,000.00 17/09/2012 16/09/2013 0.35 3,490.41 - 301402 Nationwide Building Society 1,000,000.00 21/03/2013 20/09/2013 0.54 2,707.40 - 301373 London Borough of Islington 1,000,000.00 02/10/2012 01/10/2013 0.26 2,592.88 - 301409 Nationwide Building Society 1,000,000.00 16/04/2013 16/10/2013 0.52 2,607.12 - 301375 Plymouth City Council 1,000,000.00 22/10/2012 21/10/2013 0.26 2,592.88 - 301379 Birminghan City Council 1,000,000.00 01/11/2012 31/10/2013 0.30 2,991.78 - 301383 Bank of Scotland 1,000,000.00 04/12/2012 03/12/2013 1.50 14,958.90 - 301399 London Borough of Enfield 1,000,000.00 15/03/2013 28/02/2014 0.40 3,835.62 - 301400 Barnsley Metropolitan B.Council 1,000,000.00 15/03/2013 28/02/2014 0.40 3,835.62 - 301406 Bank of Scotland 1,000,000.00 02/04/2013 01/04/2014 1.10 10,969.86 - 301412 Salford City Council 1,000,000.00 30/04/2013 29/04/2014 0.35 3,490.41 - 301413 Salford City Council 1,000,000.00 07/05/2013 06/05/2014 0.35 3,490.41 -
105,505.76
Total Investments at 31 May 2013 29,500,000.00
Projection Actual Variance %under/(over)
£ £ £
Accumulated interest on Investments to : 31/05/2013 8,334 8,750 (416) (4.99)
Investment From To % Interest£ £
Nil - - -
Temporary Loans
HUMBERSIDE FIRE & RESCUE SERVICEBORROWING AND LENDING ACTIVITY STATEMENT
For the Months of April & May 2013
Returned
Summary of Interest Receipts
29

The total amount temporarily invested at 31 May 2013 is £29,500,000 which includes £6.45m invested on behalf of the East Coast and Hertfordshire Control Project. The balance in the Authority’s Liquidity Manager Account (LMA) bank account as at 31 May 2013 is £290,385.69. This account currently accrues interest at 0.10%.
30
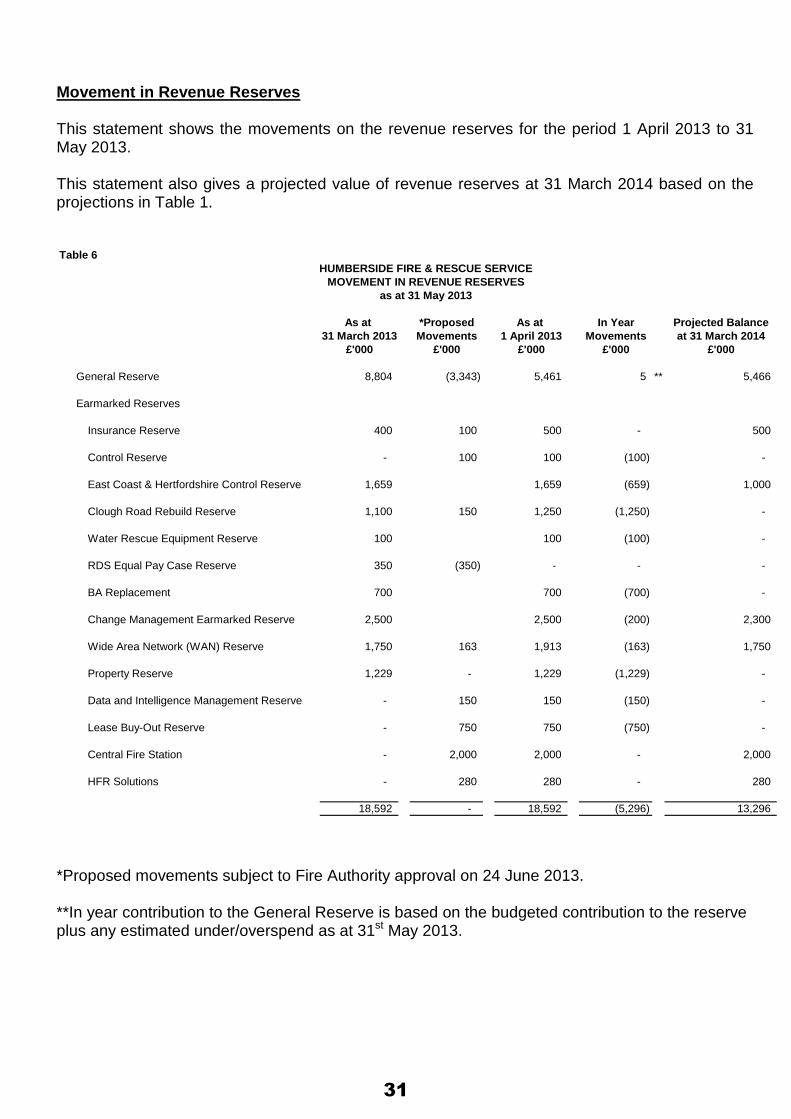
Movement in Revenue Reserves This statement shows the movements on the revenue reserves for the period 1 April 2013 to 31 May 2013. This statement also gives a projected value of revenue reserves at 31 March 2014 based on the projections in Table 1. Table 6
As at *Proposed As at In Year Projected Balance31 March 2013 Movements 1 April 2013 Movements at 31 March 2014
£'000 £'000 £'000 £'000 £'000
General Reserve 8,804 (3,343) 5,461 5 ** 5,466
Earmarked Reserves
Insurance Reserve 400 100 500 - 500
Control Reserve - 100 100 (100) -
East Coast & Hertfordshire Control Reserve 1,659 1,659 (659) 1,000
Clough Road Rebuild Reserve 1,100 150 1,250 (1,250) -
Water Rescue Equipment Reserve 100 100 (100) -
RDS Equal Pay Case Reserve 350 (350) - - -
BA Replacement 700 700 (700) -
Change Management Earmarked Reserve 2,500 2,500 (200) 2,300
Wide Area Network (WAN) Reserve 1,750 163 1,913 (163) 1,750
Property Reserve 1,229 - 1,229 (1,229) -
Data and Intelligence Management Reserve - 150 150 (150) -
Lease Buy-Out Reserve - 750 750 (750) -
Central Fire Station - 2,000 2,000 - 2,000
HFR Solutions - 280 280 - 280
18,592 - 18,592 (5,296) 13,296
HUMBERSIDE FIRE & RESCUE SERVICEMOVEMENT IN REVENUE RESERVES
as at 31 May 2013
*Proposed movements subject to Fire Authority approval on 24 June 2013. **In year contribution to the General Reserve is based on the budgeted contribution to the reserve plus any estimated under/overspend as at 31st May 2013.
31
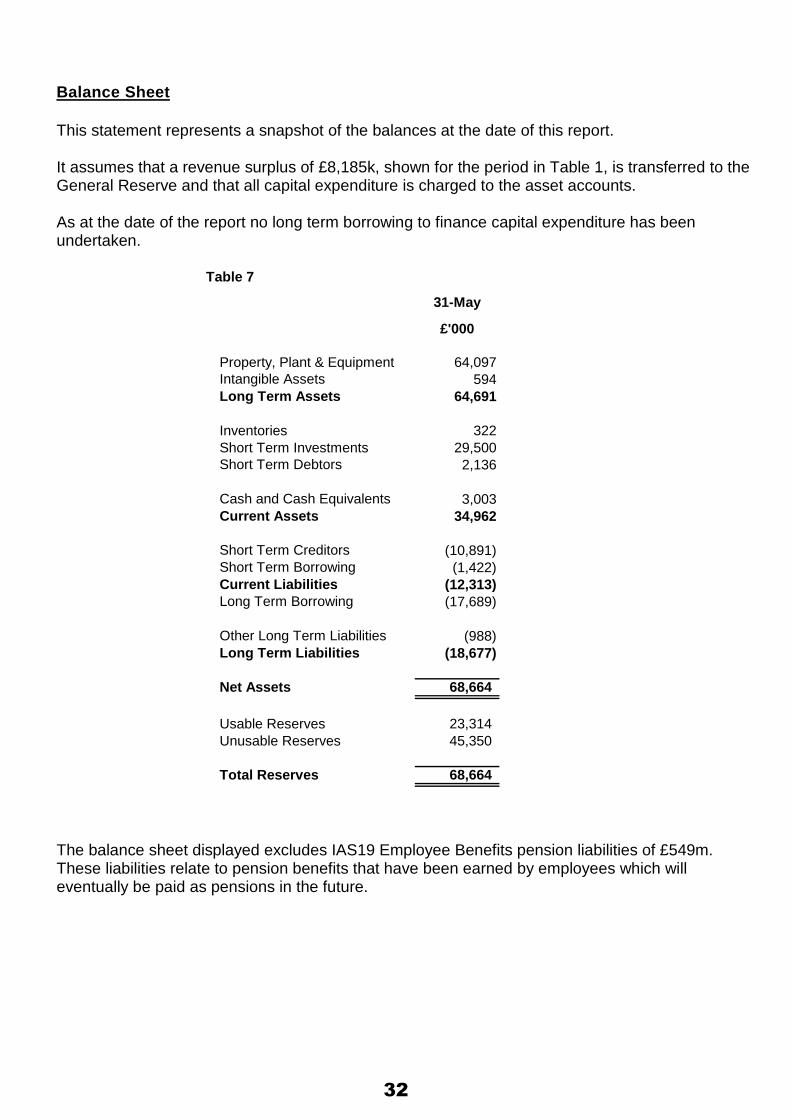
Balance Sheet
This statement represents a snapshot of the balances at the date of this report. It assumes that a revenue surplus of £8,185k, shown for the period in Table 1, is transferred to the General Reserve and that all capital expenditure is charged to the asset accounts. As at the date of the report no long term borrowing to finance capital expenditure has been undertaken.
Table 7
£'000
Property, Plant & Equipment 64,097Intangible Assets 594Long Term Assets 64,691
Inventories 322Short Term Investments 29,500Short Term Debtors 2,136
Cash and Cash Equivalents 3,003Current Assets 34,962
Short Term Creditors (10,891) Short Term Borrowing (1,422) Current Liabilities (12,313) Long Term Borrowing (17,689)
Other Long Term Liabilities (988) Long Term Liabilities (18,677)
Net Assets 68,664
Usable Reserves 23,314 Unusable Reserves 45,350
Total Reserves 68,664
31-May
The balance sheet displayed excludes IAS19 Employee Benefits pension liabilities of £549m. These liabilities relate to pension benefits that have been earned by employees which will eventually be paid as pensions in the future.
32

Prudential Indicators
The Prudential Indicators of the Authority for 2013/14 were approved at the 15 March 2013 Fire Authority Meeting. The statements below monitor the actual performance to 31 May 2013 against the approved indicators.
Indicator 1 - Estimated Capital Expenditure 2013/14 This table reflects the forecasted capital expenditure as recorded in Table 3 of this report.
2012/13 2013/14 Estimate 2014/15 2015/16 Actual Original Revised Estimate Estimate £m £m £m £m £m
Total Capital expenditure 3.457 2.879 2.879 2.265 3.115
Indicator 2 – Estimated ratio of Capital Financing Costs to Net Revenue Stream This indicator reflects the estimated proportion of the net budget which is required to meet capital financing costs.
2012/13 2013/14 Estimate 2014/15 2015/16 Actual Original Revised Estimate Estimate % % % % %
Ratio of Capital Financing Costs to Net Revenue Stream 7.88 5.95 5.95 7.06 6.64
Indicator 3 – Estimated Capital Financing Requirement This indicator measures the Authority’s need to borrow for capital financing purposes.
Actual 31/03/14 Estimate Estimate Estimate 31/03/13 Original Revised 31/03/15 31/03/16 £m £m £m £m £m
Capital Financing Requirement 17.720 24.698 24.698 23.902 24.687
33

Indicator 4 – Authorised Limit for External Debt The Authorised Limit for External Debt reflects the Authority’s projected long and short term borrowing requirements at any time together with any other long term liabilities it may have. It is based on a prudent (but not worst case) scenario, and contains sufficient head room over and above this level to allow for operational management, for example, usual cash flow movements. The indicator was set at £34.415 million for 2013/14. As at the 31 May 2013, there has been no short term borrowing nor has there been any long term borrowing undertaken in respect of capital expenditure. The Authorised Limit has not been approached at any point in the year to date and is not forecast to be approached during the remainder of the financial year. Indicator 5 – Operational Boundary for External Debt The Operational Boundary for External Debt is based on the same elements as the Authorised Limit (Indicator 4 above), but reflects directly the Director of Finance/S.151 Officer’s estimate of the likely, prudent but not the worst case scenario without the additional headroom included in the Authorised Limit. This indicator therefore equates to the maximum external debt projected by this estimate and was set at £26.415 million for 2013/14. As with the Authorised Limit, borrowing in the year to date has not exceeded the boundary and is not expected to exceed the boundary for the remainder of the financial year. Indicator 6 – Fixed and Variable Rate Interest Exposure This indicator seeks to ensure that the Authority limits its exposure to the risk of interest rate changes by restricting the proportion of variable rate borrowing within total borrowings. The approved limits for 2013/14 do not require amendment.
As at 31/05/13 2013/14 2014/15 2015/16 % % % % Fixed Rate – Upper Limit 100 100 100 100 Fixed Rate – Lower Limit 75 75 75 75 Variable Rate – Upper Limit 25 25 25 25 Variable Rate – Lower Limit - - - -
34

Indicator 7 – Upper and Lower Limits for the Maturity Structure of Borrowings This indicator also seeks to ensure the Authority controls its exposure to the risk of interest rate fluctuations by limiting the proportion of debt maturing in any single period. The maturity structure of external debt is within the current approved upper and lower limits.
Upper Limit
% % As at 31/05/13
Lower Limit %
Under 12 Months 10 4.97 - 12 months and within 24 months 10 5.74 -
24 months and within 5 years 25 16.21 -
5 years and within 10 years 60 23.82 - 10 years and above 80 49.26 -
Indicator 8 – Upper Limit for the Maturity Structure of Investments When the 2013/14 Prudential Indicators were established the Authority’s cash flow strategy was that any investment of surplus funds would not exceed a period of more than 364 days duration. To date, effective cash flow management has duly reflected this strategy, and it is anticipated that any future investments in this financial year will also reflect this strategy. Key Indicator of Prudence Under the Prudential Code a key indicator of prudence is that “net external borrowing does not, except in the short term, exceed the total of the Capital Financing Requirement in the preceding year plus the estimates of additional Capital Financing Requirements for the current and the next two financial years”. To date, this indicator has not been breached.
35
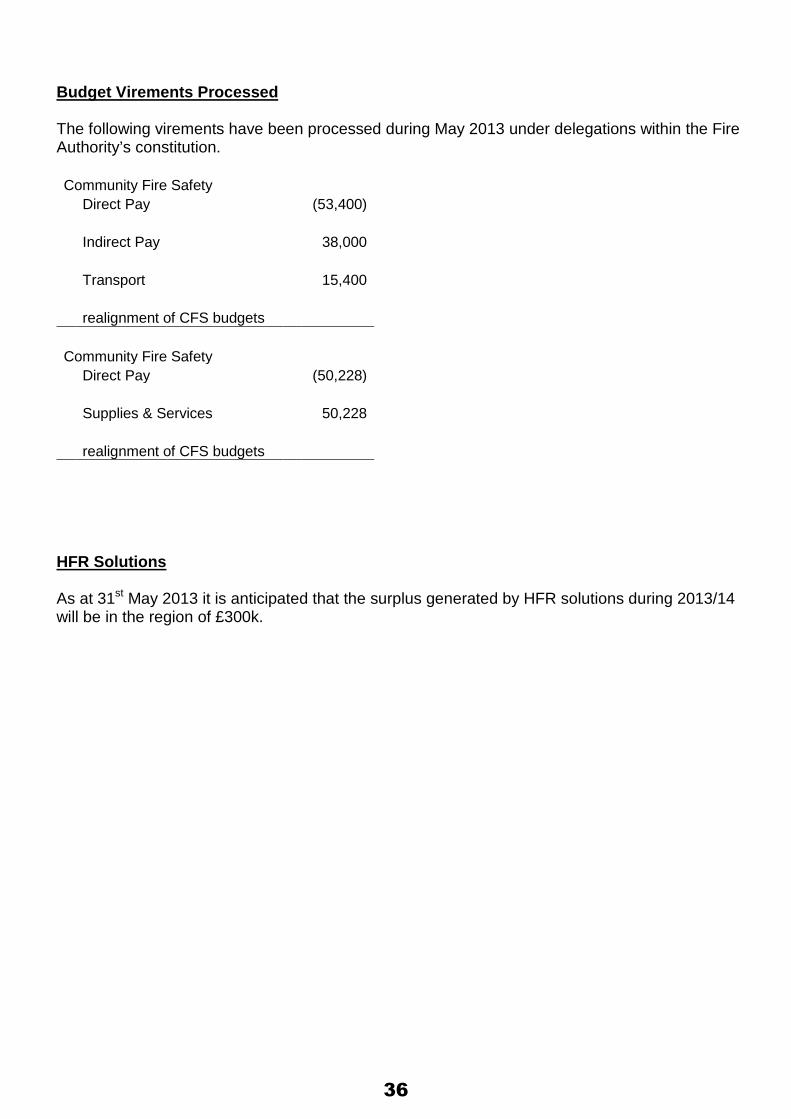
Budget Virements Processed The following virements have been processed during May 2013 under delegations within the Fire Authority’s constitution. Community Fire Safety
Direct Pay
(53,400)
Indirect Pay
38,000
Transport
15,400
realignment of CFS budgets
Community Fire Safety
Direct Pay
(50,228)
Supplies & Services
50,228
realignment of CFS budgets
HFR Solutions As at 31st May 2013 it is anticipated that the surplus generated by HFR solutions during 2013/14 will be in the region of £300k.
36