management case study value creation maps & · pdf file · 2014-05-22management...
TRANSCRIPT

Management Case Study
Value Creation Maps & Assessment of IT Investments: Going beyond the business case at Novo Nordisk
For more information please see: www.ap-institute.com

© 2008 Advanced Performance Institute, BWMC Ltd. All rights reserved. Page 2 of 15
Value Creation Maps & Assessment of IT Investments: Going beyond the business case at
Novo Nordisk
By Peter Schnack, Nikolaj Ringberg Brandt,
and Bernard Marr*
Abstract: In this case study we explore the use of value creation maps to assess
the impact and benefits of IT investments. At the core of this case is the illustration
of how Novo Nordisk, a leading pharmaceutical company and the market leader in
diabetes care, used this approach to assess the impact of one of their IT projects.
Overall, this case illustrates the importance of aligning any IT (or project)
assessment methodology with the corporate strategy.
Released: Jan 2008 * corresponding author
Peter Schnack is a Management Consultant with NNIT A/S Nikolaj Ringberg Brandt is a Partner at INNOVISOR Bernard Marr is the Chief Executive and Director of Research at the Advanced Performance Institute. E-mail: [email protected] The Advanced Performance Institute (API) is a world-leading independent research and advisory organisation specialising in organisational performance. It provides expert knowledge, research, consulting and training to performance orientated companies, governments and not-for-profit organisations across the globe. For more reading material or information on how the API might be able to help your organisation please visit: www.ap-institute.com How to reference this case study: Schnack, P., Brandt, N., Marr, B. (2008) Value Creation Maps and Assessment of IT Investments: Going beyond the business case at Novo Nordisk, Management Case Study, The Advanced Performance Institute

© 2008 Advanced Performance Institute, BWMC Ltd. All rights reserved. Page 3 of 15
Value Creation Map & Assessment of IT Investments: Going beyond the business case at Novo Nordisk
Introduction
Assessing the business value of IT (Information Technology) investments has troubled managers for decades. Business executives and the IT organisation have historically had a hard time understanding each other, even though advances in technology and possibilities for IT enabled business processes have pushed IT higher up onto the organisational agenda. On average, companies spend 50% of their capital investments on IT1, which in itself makes it impossible to ignore IT investments. A recent global survey2 of chief executives shows that they see “Advances in IT” as the most critical force to change the global marketplace over the next three years. The increasing importance and ever rising levels of investment in IT mean that executives need to know whether they are getting acceptable levels of value from their IT investments, and whether IT is used appropriately to support their business. Highly effective IT organisations are not necessarily those which spend the most money on IT, but those which spend it wisely. The challenge is that much of the business value derived from IT investments is intangible in nature. “IT investments are like advertising” a CEO noted, “I know half of it is well spent. I just don’t know which half”.3 Compared to the tip of an iceberg we argue that if IT decisions are made strategically, the immediate visible value from an IT project comprises only a fraction of the potential value of the investment. Unlocking the entire strategic value of the investment requires an understanding of both the visible and more hidden effects from IT investments. However, using traditional return on investment or NPV4 approaches will only provide a limited view of benefits. Ross & Beath argue in their article Beyond the Business Case: New Approaches to IT Investment that companies need to re-evaluate their IT investment patterns and the way they justify IT investments. “The heightened strategic importance of IT has forced companies to think differently. They now must weigh the returns on individual investments against demands for organisation-wide capabilities.”5 In this article we argue that IT investments can be assessed on their impact on internal organisational resources using the values creation map framework. An illustrative case study is provided on how Novo Nordisk, a world leader in diabetes care, is working on introducing this concept.
Introducing SPM and the Value Creation Map6
Strategic Performance Management (SPM) is about creating an environment in which organisational performance becomes everyone’s day job. This requires everyone in the organisation to have a clear understanding of the

© 2008 Advanced Performance Institute, BWMC Ltd. All rights reserved. Page 4 of 15
strategic direction as well as their responsibility in the execution and continuous refinement of the strategy. In such an environment, companies clarify strategies with state of the art tools such as Value Creation Maps and employees use performance information to facilitate day-to-day decision making. Value Creation Maps are visual representations of the key strategic objectives of a firm linked together to show causal-and-effect relationships between the different strategic elements. Relevant performance indicators can then be derived from this map and collected to inform strategic decision making and learning at all levels of a firm. Strategic Performance Management (SPM) can therefore be defined as the organisational approach to define,
assess, implement, and continuously refine organisational strategy. It encompasses methodologies, frameworks,
indicators, and processes that help organizations to formulate their strategy and enable employees to gain the
insight required to challenge strategic assumptions, refine strategic thinking, and inform strategic decision making
and learning.
Good Strategic Performance Management starts with clarifying the strategic objectives and mapping the strategy into cause-and-effect Value Creation Map before designing and using performance indicators (see Figure 1). First it is important to identify the key stakeholders in order to define the stakeholder value proposition.
Figure 1: Steps in SPM (source: B. Marr, 2006)
Once the value proposition has been defined, the next step is to identify what an organisation has to be good at in order to deliver this value proposition. Organisations identify their core competencies as well as the drivers or enablers (both tangible and intangible) that underpin their core competencies and delivery of value. The analogy that illustrates this comes from Mother Nature. Think of the organisation as a tree.7 Its foliage is how it presents itself to the external world and its fruits (say, apples) are the products or services it offers to its customers. The tree’s hidden roots represent the tangible and intangible resources it needs to have in place in order to nourish the apples that people will buy. The tree’s trunk then represents the core competencies that give it its strength and connect the resources with the delivery of the products and services. The trunk’s xylem and phloem provide the channel for leveraging the resources to create value – plump juicy apples, or market-leading products and services. Similar to
Clarifying Strategy
Mapping Strategy
Designing Indicators
Using
Indicators
1. 2. 4. 3.

© 2008 Advanced Performance Institute, BWMC Ltd. All rights reserved. Page 5 of 15
companies, all trees are made up of the same components and share the same biological processes of photosynthesis and nutrient extraction, but the shape of the trees and their fruits differ widely.8 (See Figure 2) A strategic Value Creation Map visualises the key strategic elements and therefore provides clarity about strategic aims and guidance about what to manage and measure. The map depicts what the organisation needs to deliver, what it has to be good at, as well as the levers or drivers of future performance. In the context of SPM, performance indicators are then used to help firms understand their levels of performance, to guide managers’ discussions as to what really matters, and to facilitate decision making and learning. Too often organisations measure for the sake of measuring or collect data that is easy to measure but meaningless. Linking indicators to the strategic element identified in the strategic value creation map will ensure that they help to provide information and data on what matters.
Figure 2: Tree Analogy (source: B. Marr, 2006)
A theme throughout this discussion is the importance of distributing performance information in a manner in which it will be actively used, day-to-day. Once firms have clarified and mapped the strategy and derived relevant performance indicators, they need to use them. Too many organisations believe that once they have collected
Value Proposition / Output Deliverables
Core Competence I Core Competence II
E.g. Employee Satisfaction
E.g. Talented People
Etc.
E.g. Brand Image
E.g. IT Systems Etc.
Etc. Value Drivers
Core Competencies
Stakeholder Value Proposition

© 2008 Advanced Performance Institute, BWMC Ltd. All rights reserved. Page 6 of 15
measures and put them into spreadsheets or reports that by magic this will lead to better decision making. Instead, the emphasis should be on dialogue and discussion about what the performance indicators might tell us and how this could help us to improve what we do. For this to work it is important to have the right governance structures in place and to ensure the right information is provided to the right people in a format that is accessible and easy to understand. Performance information is far too often circulated in spreadsheets full of data where the important messages are buried in too much and often unnecessary detail. Firms can create an environment in which performance information is used to guide discussions and decision making by improving internal performance reporting, by integrating performance management with other strategic and planning activities such as business planning resource allocations, risk management, and project management. However, what we found is that one key element is the way performance is discussed and reviewed in face-to-face performance meetings. If these meetings are held in a manner in which everyone is ’singing from the same hymn sheet’ (as opposed to arguing about data accuracy), and performance is openly and honestly discussed leading to collaborative decision making and actions, they can be a vital enabler in creating true performance driven organisations.
Expanding the Scope of the Value Creation Map into the IT
Domain
In -this section we outline how the Value Creation Map can be utilised as a tool to facilitate corporate IT decision making and assess IT benefits more comprehensively. As mentioned in the introduction, companies are realising that the traditional business case using tools such as NPV calculations can provide a skewed picture of the investment benefits. Benefits from IT investments are often hard to quantify and even harder to translate into economic value added. Instead, the business value of many IT investments comes from the way it supports the capabilities and competencies of any given firm. Any IT project can have an impact by improving processes and delivering improved capabilities and competencies, which in turn will have an indirect impact on traditional financial performance. However, it is challenging to assess the impact without a clear picture of the value drivers and competencies the organisation requires to deliver its value proposition. This is where the value creation map comes into play, as it takes the strategic capability view into consideration and visualises the different value drivers. We propose that the value creation map represents an opportunity for executives and other IT decision makers to extend and supplement the traditional business case approach to explain, justify and communicate the value of IT. In many companies there is an inherent knowledge gap in the way IT decisions are made and how IT creates value for the organisation. This knowledge gap is not unique for IT investments, but often it is unclear for executives how IT impacts an organisation’s short and long term ability to achieve its strategy, increase shareholder value and deliver other business goals. Extensive research has investigated how IT impacts the business, how you align IT

© 2008 Advanced Performance Institute, BWMC Ltd. All rights reserved. Page 7 of 15
with business strategies, and how best to understand and communicate the business value of IT. According to the Gartner Group, the “business value of IT comes from its ability to enable businesses to conduct their processes more reliably, faster and at a lower cost, and to control inventories, increase revenue, reduce time to market, improve customer service and provide information that enables better decisions”. This very broad description of how IT adds business value shows the many factors that decision makers have to take into account in when making IT decisions; both when prioritising the IT budget and when assessing project benefits. Essentially, we think that IT should be viewed as an organisational resource that plays an important role in building company capabilities. IT is a resource that together with other resources provides the foundation of the company capabilities, which is why it can be a mistake to talk about the business value of IT in isolation. “Viewed in isolation of people and process, IT has no value”9. This capability view of IT is where we see the strategic connection between IT and the overall company strategy and vision. It is also the basic assumption on which the hypothesis for this article is founded; that the value creation map can help reveal how IT creates value for the business by illustrating the cause-and-effect relationships in how IT supports core capabilities. Assessing IT investments using the value creation map should be done by evaluating how the strategic value drivers are affected by the investment. Investigating these cause-and-effect relationships makes the value creation map a strong analytical tool that can help IT decision makers in understanding and assessing how any given IT investment is aligned with the strategic goals of the organisation. As an example, implementing an extranet can be seen as strengthening the external relationships and also making the communicative processes leaner and more effective. We suggest that any assessment of IT investments has to demonstrate the link to business strategy. This can be achieved in two complementary ways, (1.) through resource visualisation and (2.) through a resource narrative. The resource narrative is a concise short story of how the investment affects the strategic value drivers, which is based on the resource visualisation. The resource visualisation is a visual representation of which resources are affected. We will further illustrate this in the following case study from Novo Nordisk.
Strategic Value Drivers and IT Investments in Novo Nordisk
Novo Nordisk is a healthcare company and a world leader in diabetes care. In addition to having the broadest diabetes product portfolio in the industry, Novo Nordisk has a leading position within biopharmaceutical areas such as haemostasis management and growth hormone therapy. Novo Nordisk employs approximately 23.600 people, of which half are based in the headquarters in Bagsværd, Denmark. The company has local branches and affiliates in 79 countries and markets its products in 179 countries. In 2006 Novo Nordisk had revenues of 38,743 billion DKK. Being an innovative healthcare company, Novo Nordisk has long recognised that its primary assets are knowledge based intangible assets. Over the past ten years the company has worked from the triple bottom line concept which

© 2008 Advanced Performance Institute, BWMC Ltd. All rights reserved. Page 8 of 15
has been a key driver in business excellence throughout the organisation. More than 70% of Novo Nordisk’s market value is made up of intangible assets, which in itself is a strong argument for managerial focus on organisational resources. A task group in Novo Nordisk has worked together with Bernard Marr of the Advanced Performance Institute to define and implement the value creation map framework for strategic performance management. The aim was to provide senior management with an overview of the key drivers of performance. The objectives were to offer (1) strategic guidance & performance monitoring, (2) qualitative assessment and data analysis/interpretation, (3) indicators that were then available for external reporting and benchmarking. The aim of the report is not only to describe the value creation and identify the performance drivers, but also to provide performance assessments and indicators for each of the performance drivers.
Working with the Value Creation Map in Novo Nordisk
The value creation map is still a work in progress in Novo Nordisk and the ambitious vision of the project is to cultivate knowledge leadership in all business and decision-making processes throughout the organisation. One area of investigation in Novo Nordisk where the value creation map is thought to be very beneficial is in the governance of IT; more specifically in the decision-making process for making new IT investments and for prioritising the IT project portfolio, embedded in the corporate IT governance framework10. In this case study we will outline how Novo Nordisk is approaching this and outline an example of how IT projects are being assessed strategically based on the value creation map. However, before going into the actual assessment we will take a closer look at the Novo Nordisk value creation map developed in collaboration with Bernard Marr. The value creation map identifies the strategic value drivers needed to develop and maintain the capabilities and core competencies in order to deliver the corporate vision of changing diabetes. The Novo Nordisk value creation map is depicted in the Figure 3. The vision is shown in the foliage of the tree, the core competencies and capabilities are the trunk of the tree, and the resources are the roots of the tree. The resources are labelled strategic value drivers as these are the aspects that drive the strategic value. For Novo Nordisk these are identified as Talented People, Leadership & Performance, Motivation, Reputation, External Relations, Culture, Values, Patents, Quality Mindset, Brand, Business Processes and ICT, as illustrated by the coloured ovals in the lower part of the figure. By nurturing the strategic value drivers the core competencies and capabilities are ensured in the long run.

© 2008 Advanced Performance Institute, BWMC Ltd. All rights reserved. Page 9 of 15
Figure 3: Novo Nordisk Value Creation Map
Resource-based Assessment of IT Projects
Novo Nordisk has a very mature IT governance framework with specified processes, roles and responsibilities for prioritising and approving projects in the corporate IT project portfolio. Here we will focus on how to assess and prioritise IT projects in the early phases of the life-cycle, by providing an example of how an IT project can be assessed based on how the project impacts the organisational resources defined as strategic value drivers in the value creation map. To illustrate this we use an IT project initiated in Novo Nordisk. This is an ongoing project which was previously prioritised based on the traditional business case supported with more qualitative statements and
arguments. The particular project was chosen because it is a good example of a project where the direct economic
effects are hard to calculate and indeed hard to measure. However, the strategic importance of the project and the qualitative benefits are enormous. Our intention here is to illustrate how the assessment based on the value creation map would have helped to clarify the links between the project and the resource-based business strategy of Novo Nordisk.

© 2008 Advanced Performance Institute, BWMC Ltd. All rights reserved. Page 10 of 15
The ‘3P phase II’ project aims at implementing an IT platform to support the People Performance Process (3P) in Novo Nordisk and thereby prepare for the establishment of one common global people platform. 3P is in itself a project that aims at a uniform global performance management process and a common global people platform in Novo Nordisk. In this way the 3P project aims at streamlining and improving the processes around managing people in terms of performance, mobility, internationalisation, and administrative effectiveness. Phase I of the project aimed at streamlining the performance management processes and thereby taking the first step of realising the benefits of a common global people platform. Phase II is therefore to be seen as the IT automation of the processes set in place in phase I. As explained above the format for a resource-based assessment of an IT project is suggested to consist of two parts: A resource visualisation and a resource narrative. This is the end goal of the analysis and is the way the assessment will be communicated to decision makers. The decision makers in Novo Nordisk are a corporate IT decision making board. The assessment of the 3P phase II project is done first by evaluating the project’s impact on each strategic value driver. The result is a preliminary overview of which of the strategic value drivers are impacted by the IT investment in question. The two or three most important resource impacts should be included in the resource narrative and the resource visualisation and are therefore accentuated for further analysis. The next step is to narrow down the impact on the accentuated resources to performance indicator level.
Linking Benefits to the Strategic Value Drivers
The first step is linking the 3P phase II project to the strategic value drivers. This is done in the following table. The rows are the five overall objectives of the 3P projects and the columns are the strategic value drivers identified in the value creation map for Novo Nordisk. The table should be viewed as a matrix of direct relationships which means that the natural cause-and-effect relationships inherent in the value creation map - should be disregarded. The impacts from the project are then labelled none existing (-), low impact (1) or high impact (2).
The table indicates that the two most affected value drivers are Talented People and Leadership & Performance. The number of value drivers that should be chosen for further analysis will naturally vary. Still, it is important to keep in mind that the number should be limited and only the most powerful impacts should be included in the descriptions. In this example the two most affected value drivers will be included. To further specify how the 3P phase II project affects these two strategic value drivers the impact is mapped onto the performance indictors for each value driver. Here a scale from little impact (1) to large impact (4) is used. This mapping is used to explain how the value drivers are affected in order to validate the impact that the IT investment has on the strategic value drivers and to create the resource visualisation. Furthermore, the mapping acts as

© 2008 Advanced Performance Institute, BWMC Ltd. All rights reserved. Page 11 of 15
valuable input to the more detailed and concrete benefit model that will be established in the final part of the project’s analysis phase.
Strategic Value Drivers 3P Phase II Business & strategic impacts Mo
tivati
on
Talen
ted P
eople
Lead
ersh
ip &
Perfo
rman
ce
Repu
tation
Exter
nal
Relat
ionsh
ip
Value
s
Quali
ty Mi
ndse
t
Cultu
re
Paten
ts
Bran
d
Busin
ess
Proc
esse
s
ICT
Improved people performance 1 2 2 - - 1 - 1 - - - -
Support mobility and internationalisation 1 2 2 - 1 - - 1 - - 1 - Enable further development of the common global people platform - 2 2 1 - - - - - - 1 1
Enable advanced analysis of people performance and improve data quality 2 2 2 - - - 1 1 - - - -
Improve administrative effectiveness for employees involved in the people performance process 1 1 1 - - - - - - - 2 -
Total 5 9 9 1 1 1 1 3 - - 4 1
Figure 4: Impact Assessment
Talented People Leadership & Performance
Talented People Leadership & Performance Performance Indicators 3P Phase II Business & strategic impacts Di
versi
ty in
workf
orce
Inter
natio
nalis
ation
Peop
le de
velop
ment
Stra
tegy c
ommu
nicati
on
Stra
tegy e
xecu
tion
Talen
t man
agem
ent
Improved people performance 1 1 4 3 4 3 Support mobility and internationalisation 2 4 2 1 3 1 Enable further development of the common global people platform 2 4 3 1 2 4
Enable advanced analysis of people performance and improve data quality 1 1 4 3 4 3
Improve administrative effectiveness for employees involved in the people performance process 1 1 3 1 3 2
Total 7 11 16 9 16 13
Figure 5: Indicator Impact Assessment
© 2008 Advanced Performance Institute, BWMC Ltd. All rights reserved. Page 12 of 15
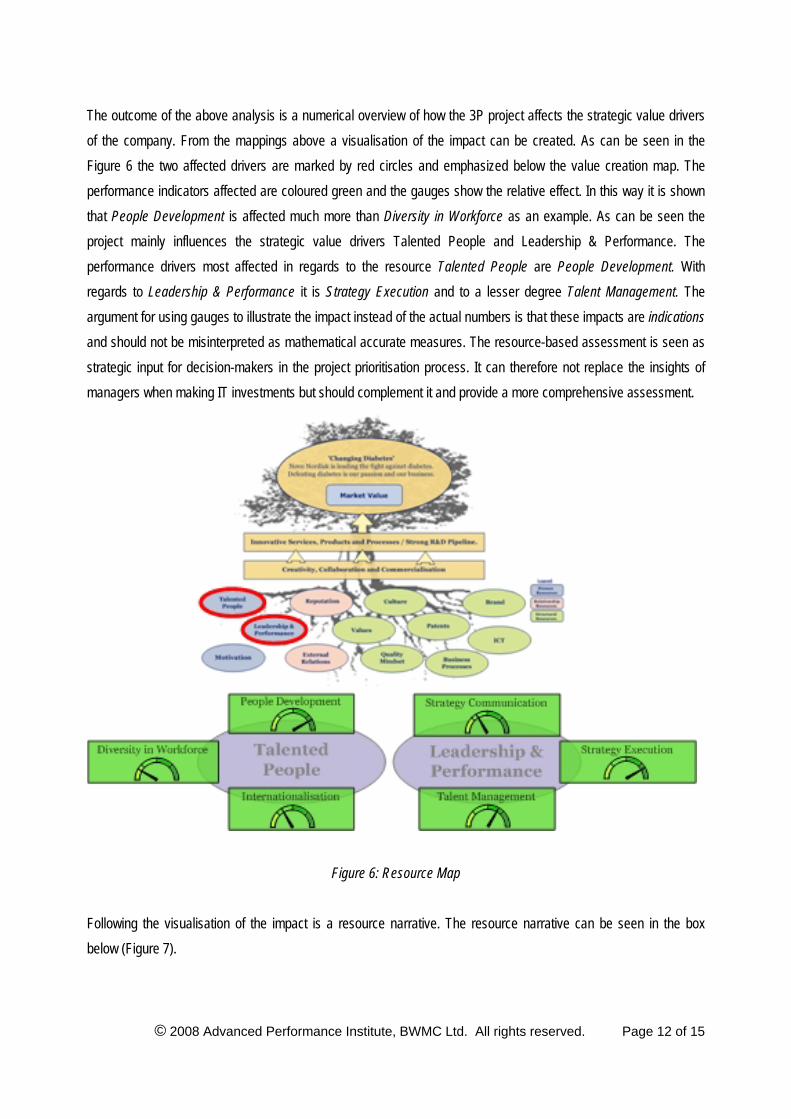
The outcome of the above analysis is a numerical overview of how the 3P project affects the strategic value drivers of the company. From the mappings above a visualisation of the impact can be created. As can be seen in the Figure 6 the two affected drivers are marked by red circles and emphasized below the value creation map. The performance indicators affected are coloured green and the gauges show the relative effect. In this way it is shown that People Development is affected much more than Diversity in Workforce as an example. As can be seen the project mainly influences the strategic value drivers Talented People and Leadership & Performance. The performance drivers most affected in regards to the resource Talented People are People Development. With regards to Leadership & Performance it is Strategy Execution and to a lesser degree Talent Management. The argument for using gauges to illustrate the impact instead of the actual numbers is that these impacts are indications and should not be misinterpreted as mathematical accurate measures. The resource-based assessment is seen as strategic input for decision-makers in the project prioritisation process. It can therefore not replace the insights of managers when making IT investments but should complement it and provide a more comprehensive assessment.
Figure 6: Resource Map
Following the visualisation of the impact is a resource narrative. The resource narrative can be seen in the box below (Figure 7).

© 2008 Advanced Performance Institute, BWMC Ltd. All rights reserved. Page 13 of 15
Resource Value Narrative An automated IT platform to support the standardised people performance processes of the 3P project–phase I can take the benefits to the next level. The act of assessing, evaluating, and following up on performance is made faster as the phase II will automate these processes. The IT automation will minimise the need for slow paper based processing with manual typing and calculations. Further the automation will give one point of reference and data storage giving better access for comparison on a company wide scale. Moreover this will give room for sharing practises and lessons learned with one another inside Novo Nordisk. The general benefits of the phase I of the 3P project are the primary benefits of the project at large, and in that respect the phase II will only enlarge these benefits. The phase II therefore influences the same strategic value drivers which would be influenced by the 3P project as a whole. The strategic value driver people development is consequently heavily influenced as the process will be better controlled. The two other value drivers that are heavily influenced are talent management and strategy execution. The talent management is influenced as the IT platform makes the management easier, which is also the case with strategy execution. Strategy execution is further influenced as it is easier monitored whether or not the whished goals, in terms of people performance, are reached. Along a different line the automation can help actual develop and improve the processes as information about the processes can be more easily collected and analysed.
Figure 7: Resource Narrative
The main benefit of constructing a resource narrative is to describe how benefits will arise form the project. Visualising and describing how projects are influencing the value creation map helps to? assess the way the projects enable the business strategies. The link to strategy can be communicated and discussed and acts as valuable input for the final prioritisation of the project portfolio. This resource based evaluation is naturally to be viewed as a supplement to the more traditional business cases and ROI considerations but it is very instrumental in building a more real and transparent cost/benefit evaluation closely linked to the business strategy, As mentioned above, Novo Nordisk has a very mature IT governance framework with implemented corporate-wide mechanisms for prioritising and approving IT projects in the portfolio and for measuring the realisation of benefits after the project is completed. The intent of the ongoing investigation in Novo Nordisk is to embed the value creation map for the organisation into these project governance processes by making the resource-based assessment a part of the standardised templates used throughout the corporation. This will
© 2008 Advanced Performance Institute, BWMC Ltd. All rights reserved. Page 14 of 15
enable a better understanding of project benefits, especially the more strategic and intangible benefits which are inherently hard to describe and assess for decision makers. The resource-based assessments supplement the insights of managers and act as a frame of reference for discussions in the IT committees. By assessing how the projects impact the strategic organisational resources, the value creation map is used as a strategic lever to ensure alignment of the IT project portfolio with business strategies. In addition, the performance indicators for the resources in the value creation map will assist in the monitoring of benefit realisation when a project has been completed. Specific KPIs are assigned to the benefits described in the business case and linked to the performance indicators in the value creation map. A link is thereby established between the business case for the project and the strategic performance management framework of the organisation. This provides a unique possibility for receiving indications on the realisation of these more strategic, organisational and qualitative benefits of IT investments. We refrain from using the word measure in this respect as it is inherently difficult to establish real quantitative measures for such qualitative benefits, because of both measurability and traceability issues. Nevertheless, the value creation map will provide decision makers with a valuable tool for assessing the wider impact and to follow-up on investments. Overall, it is essential that any IT project is assessed by taking into account the impact on existing strategic objectives, competencies, and value drivers. We therefore suggest that this approach is not only applicable to IT investments, but any type of project and investment decision.
Should you wish to discuss any aspect of this paper further then please e-mail: [email protected]

© 2008 Advanced Performance Institute, BWMC Ltd. All rights reserved. Page 15 of 15
Endnotes, References & Further Reading Marr, Bernard (2006), “Strategic Performance Management”, Butterworth-Heinemann, Oxford. Brandt & Schnack (2006), Strategic Value Drivers & Assessment of IT investments, Copenhagen Business School
1 IT Governance Conference, Dansk IT, 23.11.2005. Venue: Radisson SAS Hotel. 2 [Business Intelligence Unit 2005], survey of 500 executives in 75 countries covering 18 industries. 3 Ref.: [Weill & Ross 2004], page 16. 4 Net Present Value is the sum of discounted cash-flows from an investment. 5 Ref.: [Ross & Beath 2002], page 52. 6 For more information please see: Marr, B. (2006) Strategic Performance Management, Butterworth-
Heinemann, Oxford. 7 This analogy has been used on various occasions; one of the most convincing was by Prahalad, C.K.
and Hamel, G. (1990), 'The Core Competence of the Corporation', Harvard Business Review, Vol. 68,
No. 3, May/Jun, pp. 79. However, tree diagrams can be traced back to the third-century Syrian
philosopher’s diagram named after its developer, ‘Tree of Porphyry’ based upon the work of Aristotle. 8 Collis, D.J. and Montgomery, C.A. (1997), Corporate Strategy - Resources and the Scope of the Firm,
McGraw-Hill, Boston (page 130). 9 Ref.: [Gartner Group 2005] 10 Ref.:[Brandt & Schnack 2006]