management impacts on the c balance in agricultural ecosystems jean-françois soussana 1 martin...
Post on 19-Dec-2015
217 views
TRANSCRIPT
Management impacts on the C balance
in agricultural ecosystems
Jean-François Soussana1
Martin Wattenbach2, Pete Smith2
1. INRA, Clermont-Ferrand, France 2. Aberdeen University, Scotland, UK
CarboEurope, Poznan meeting, October 9, 2007.

Fossil fuel emissions = 1850 Mt C per yearGeographic Europe
Uncertainties in the carbon balance of European ecosystems before the start of CarboEurope (Janssens et al. Science, 2003).
SinkSource

Components of the agricultural C budget
GPP
NPP
NEP
NBP
Photosynthesis Autotrophicrespiration
Heterotrophicrespiration
Cuts Manure
GPP
NPP
NEP
NBP
Photosynthesis Autotrophicrespiration
Heterotrophicrespiration
Cuts Manure
NEE: Net Ecosystem Exchange, Atmospheric C balanceNBP: Net Biome Productivity, Soil C balance
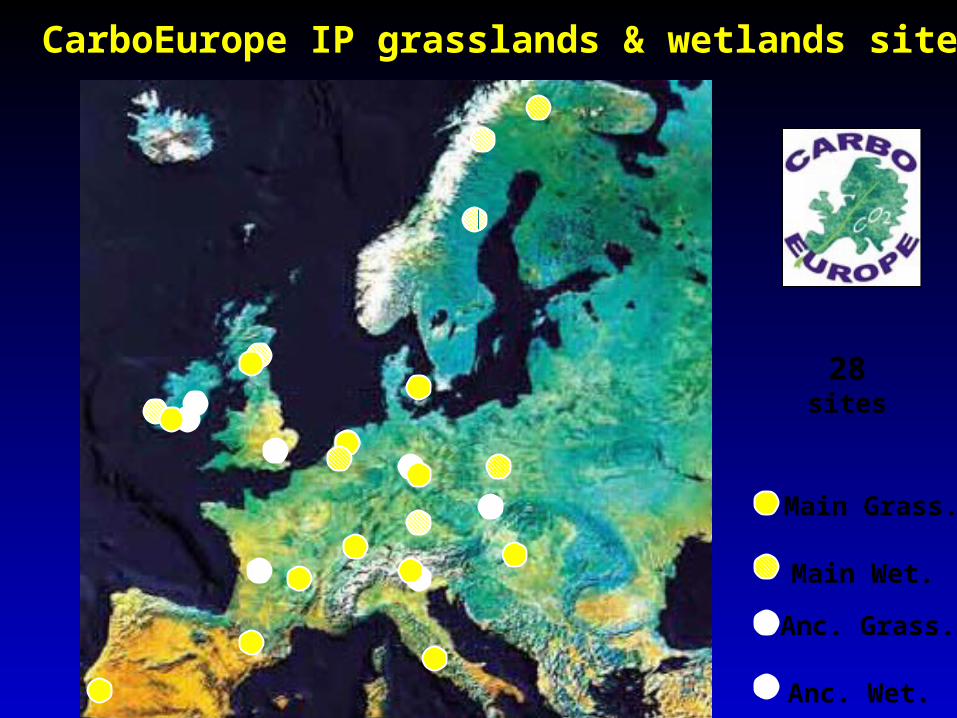
28sites
Main Grass.
Main Wet.
Anc. Grass.
Anc. Wet.
CarboEurope IP grasslands & wetlands sites

Climate drivers of grassland and wetland annual GPP at CarboEurope
IP sites
(n=50, r2=0.705, P<0.0001)
Log(GPP) = 2.27 + 0.377. Log (Temp) + 0.614. Log (Precip)

Mean C fluxes (gC m-2 yr-1) at CarboEurope grassland and wetland
sites
NBP = K2 (K1 GPP – Cut – Digest . Intake + Manure)– K3 e LN(Q10).Tsoil/10 –FCH4-C
(n=43, R2=0.52, P<0.001)
GPP1228
NBP128
Rauto.
615Rhetero.Litter 294
Rhetero.Herbivore 46
Rhetero.SOM 89
Cut75
Intake70
Manure16
K1=0.50 K2=0.43
K3 = 83Q10 =1.21Digest.=0.65
Enteric fermentation3.4

Fate of NPP and manure (at C sink sites)
CutCut & GrazedGrazedAbandoned & Wet

Current herbage utilisation is lower than maximum
Maximal grazingMaximal cuttingGrazing and cutting at managed grassland sites

Role of cutting and grazing management for NBP
-300
-200
-100
0
100
200
300
400
500
400600
8001000
12001400
16001800
20002200
0100
200300
400500
NB
P (
g C
m y
r-1)
GPP
(g C
m-2 y
r-1 )
Cuts (gC m -2 yr -1
)
Cutting only, no manure
-300 -200 -100 0 100 200 300 400 500
GPP vs Max_cutting vs NBP_max_cutting
-300
-200
-100
0
100
200
300
400
500
400600
8001000
12001400
16001800
20002200
0100
200300
400500
NB
P (
g C
m y
r-1)
GPP
(g C
m-2 y
r-1 )
Intake (gC m -2 yr -1
)
Grazing only, no manure
-300 -200 -100 0 100 200 300 400 500
-300
-200
-100
0
100
200
300
400
500
400
600800
10001200
14001600
18002000
2200
0100
200300
400500
NB
P (
g C
m y
r-1)
GPP
(g C
m-2 y
r-1 )
Intake (gC m -2 yr -1
)
Grazing only, no manure
-300 -200 -100 0 100 200 300 400 500
GPP vs Max_grazing vs NBP0
-300
-200
-100
0
100
200
300
400
500
400
600800
10001200
14001600
18002000
2200
0100
200300
400500
NB
P (
g C
m y
r-1)
GPP
(g C
m-2 y
r-1 )
Cuts (gC m -2 yr -1
)
Cutting only, no manure
-300 -200 -100 0 100 200 300 400 500
GPP vs Max_cutting vs NBP_max_cutting
Maximalgrazing
Maximalcutting
Trade-off between C sequestration and agricultural (livestock) production

Grassland GPP over Europe
Data upscaling withannual means of temperatureand precipitation
PASIM model
(Vuichard et al., 2007 GBC)

Spatial distribution of NBP of grasslands in Europe (data
upscaling)
Assuming a management similar to mean site managementNEXT STEP: map NBP using agricultural management based on statistics
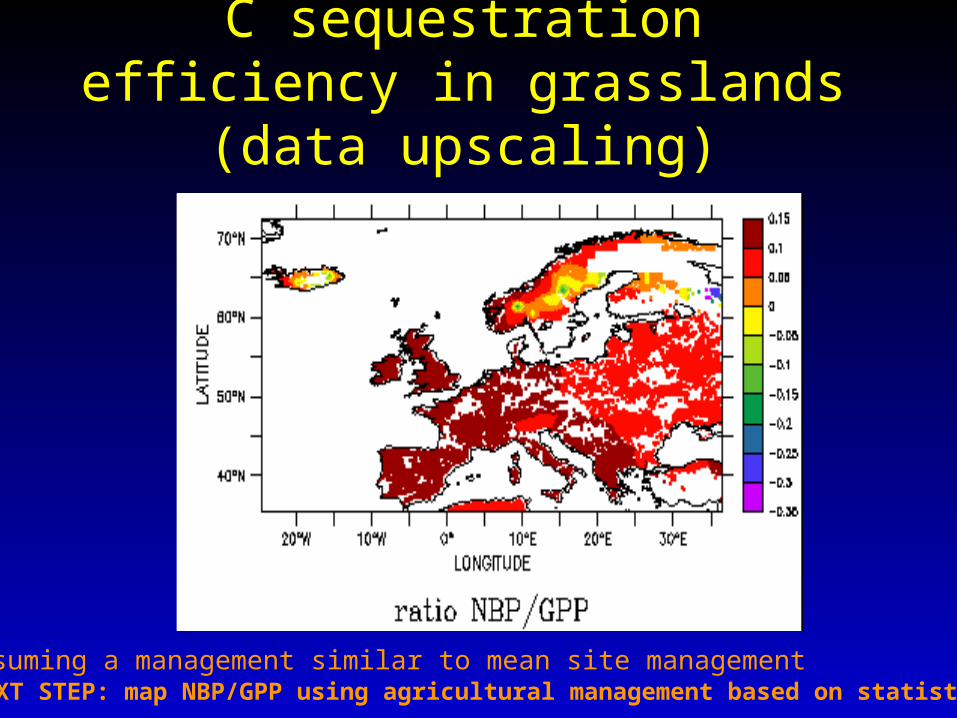
C sequestration efficiency in grasslands (data upscaling)
Assuming a management similar to mean site managementNEXT STEP: map NBP/GPP using agricultural management based on statistics

How large is the grassland C sink?
Estimates of European grassland C flux during the 1990s
-160
-140
-120
-100
-80
-60
-40
-20
0
Janssens et al.(2003)
Janssens et al.(2005)
Smith et al.(2005)
CarboEurope(data upscaling)
Study and year
Sin
k o
f C
fro
m g
ras
sla
nd
s
(Mt
C y
r-1)
First estimate, which needs to be refined:i) DOC/DIC losses up to 8 % of NBPii) On site N2O and CH4 emissions reach ca. 30 % of NBPiii) Indirect N2O and CH4 emissions, reach ca 15 % of NBP

http://www.abdn.ac.uk/modelling/cropwebpage/cropwebpage4IE.htm
CarboEurope-IP Cropland sites

(Gruenwald, pers. comm. to Christine Moureaux)
Variability between years and under different crops
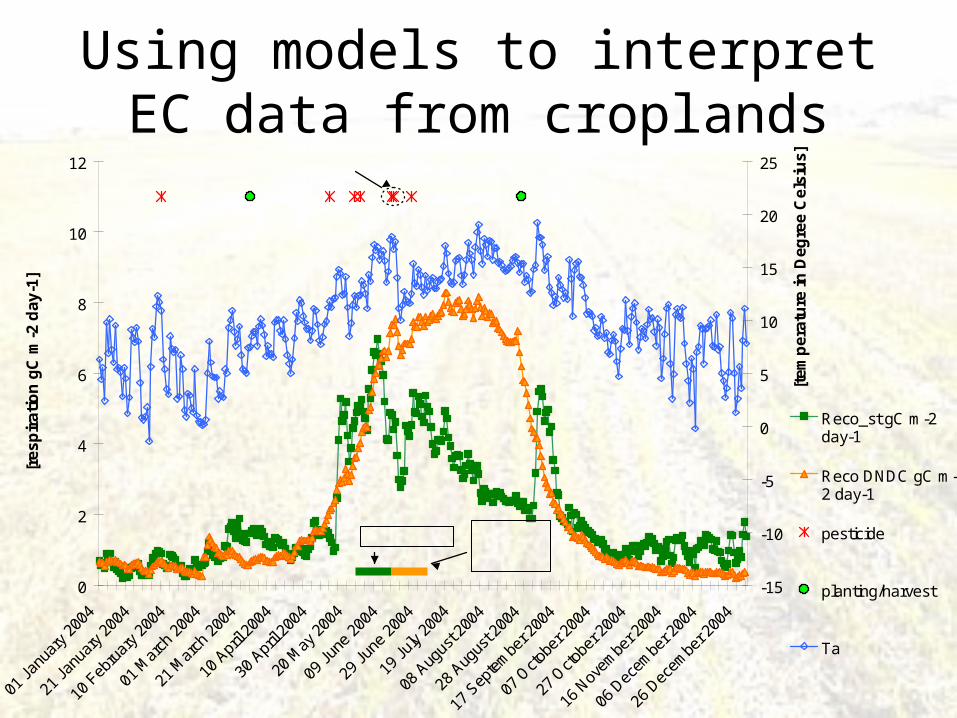
Using models to interpret EC data from croplands
0
2
4
6
8
10
12
01 Ja
nuar
y 200
4
21 Ja
nuar
y 200
4
10 F
ebru
ary 2
004
01 M
arch
200
4
21 M
arch
200
4
10 A
pril 2
004
30 A
pril 2
004
20 M
ay 2
004
09 Ju
ne 2
004
29 Ju
ne 2
004
19 Ju
ly 20
04
08 A
ugus
t 200
4
28 A
ugus
t 200
4
17 S
epte
mbe
r 200
4
07 O
ctobe
r 200
4
27 O
ctobe
r 200
4
16 N
ovem
ber 2
004
06 D
ecem
ber 2
004
26 D
ecem
ber 2
004
[re
sp
ira
tio
n g
C m
-2 d
ay
-1]
-15
-10
-5
0
5
10
15
20
25
[te
mp
era
ture
in
De
gre
e C
els
ius
]
Reco_st gC m-2day-1
Reco DNDC gC m-2 day-1
pesticide
planting/harvest
Ta
Fungizide: Alegro Plus / Bravo @ 1.0L + 1.0L
kernels at milk kernels soft dough to maturity
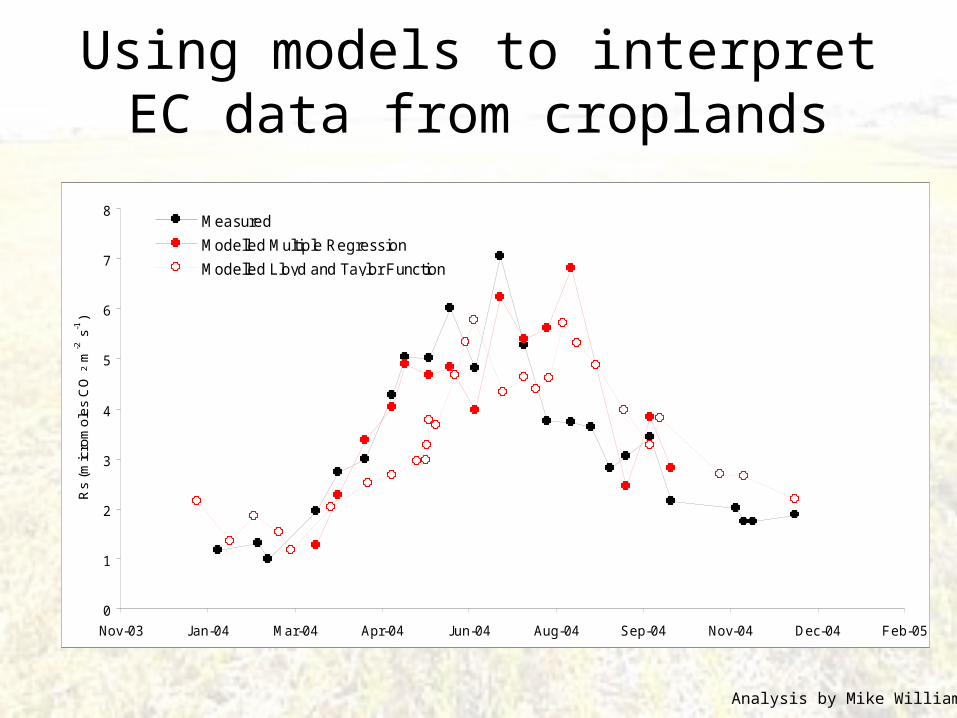
Using models to interpret EC data from croplands
Analysis by Mike Williams
0
1
2
3
4
5
6
7
8
Nov-03 Jan-04 Mar-04 Apr-04 Jun-04 Aug-04 Sep-04 Nov-04 Dec-04 Feb-05
Rs
(mic
rom
ole
s C
O2
m-2
s-1
)
Measured
Modelled Multiple Regression
Modelled Lloyd and Taylor Function
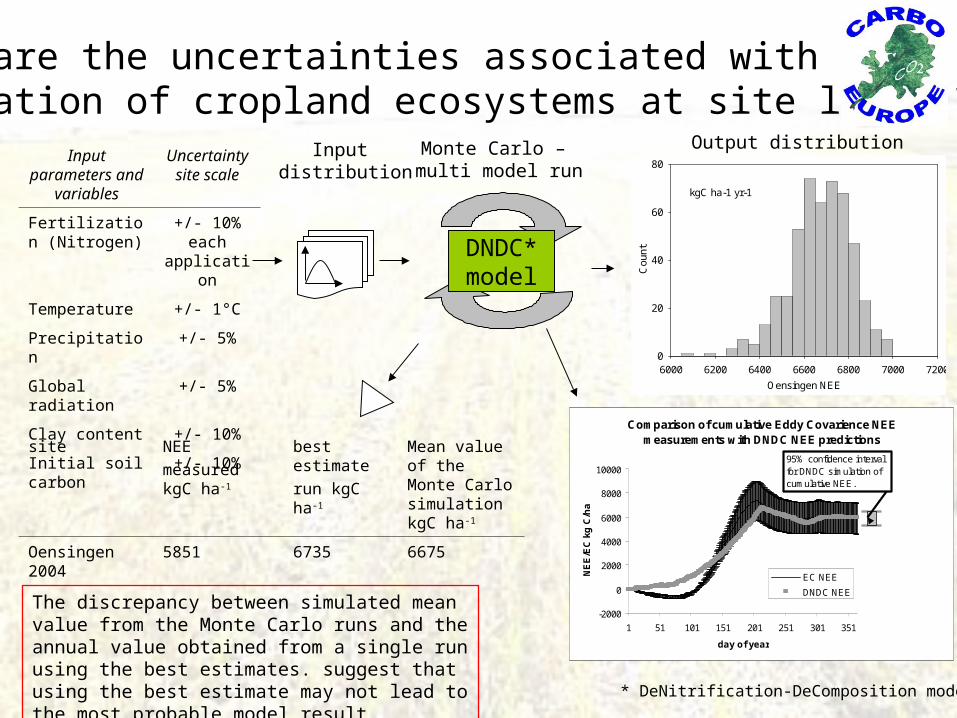
What are the uncertainties associated with the simulation of cropland ecosystems at site level ?Input parameters
and variablesUncertainty
site scale
Fertilization (Nitrogen)
+/- 10% each application
Temperature +/- 1°C
Precipitation +/- 5%
Global radiation +/- 5%
Clay content +/- 10%
Initial soil carbon +/- 10%
kgC ha-1 yr-1
Oensingen NEE
6000 6200 6400 6600 6800 7000 7200
Cou
nt
0
20
40
60
80
site NEE
measured kgC ha-1
best estimate
run kgC ha-1
Mean value of the Monte Carlo simulation kgC ha-1
Oensingen 2004
5851 6735 6675
Comparison of cumulative Eddy Covarience NEE measurements with DNDC NEE predictions
-2000
0
2000
4000
6000
8000
10000
1 51 101 151 201 251 301 351
day of year
NE
E/E
C k
g C
/ha
EC NEE
DNDC NEE
95% confidence interval for DNDC simulation of cumulative NEE.
The discrepancy between simulated mean value from the Monte Carlo runs and the annual value obtained from a single run using the best estimates. suggest that using the best estimate may not lead to the most probable model result.
Input distribution
Monte Carlo – multi model run
DNDC*model
* DeNitrification-DeComposition model
Output distribution

Are croplands as big a source of C as we thought?
Estimates of European cropland C flux during the 1990s
-500
50100150200250300350
Janssens et al.(2003)
Janssens et al.(2005)
Smith et al.(2005)
Gervois et al.(2007)
Study and year
So
urc
e o
f C
fro
m
cro
pla
nd
s (M
t C
yr-1
)
-20
0
20
40
60
80
100
120
140
160
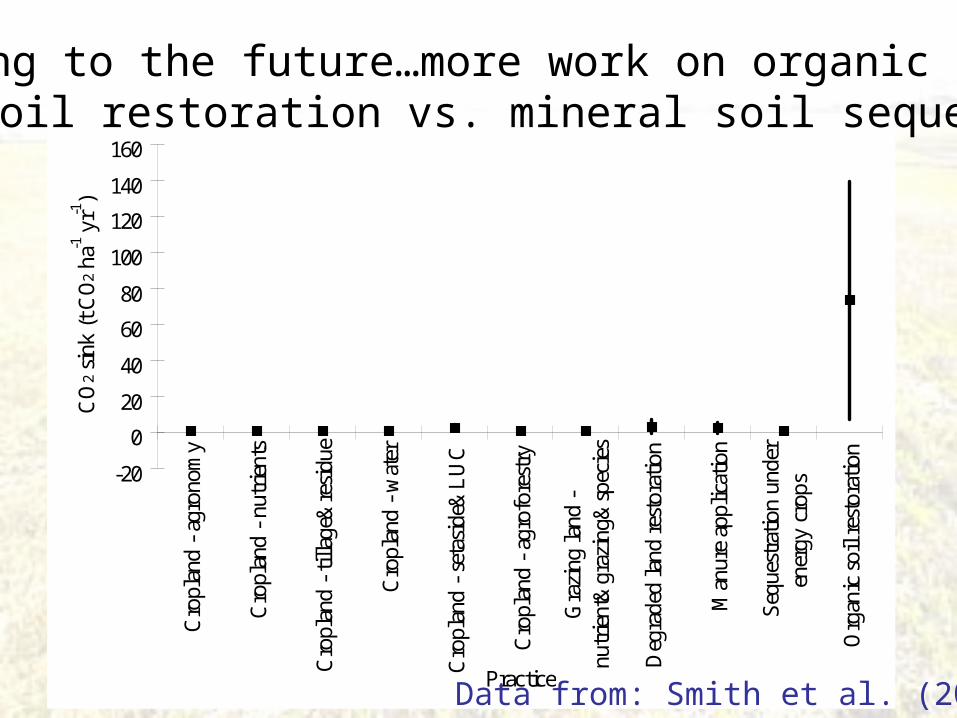
Cro
plan
d -
agro
nom
y
Cro
plan
d -
nutr
ient
s
Cro
plan
d -
tilla
ge&
resi
due
Cro
plan
d -
wat
er
Cro
plan
d -
seta
side
&L
UC
Cro
plan
d -
agro
fore
stry
Gra
zing
land
-nu
trie
nt&
graz
ing&
spec
ies
Deg
rade
d la
nd r
esto
ratio
n
Man
ure
appl
icat
ion
Seq
uest
ratio
n un
der
ener
gy c
rops
Org
anic
soi
l res
tora
tion
Practice
CO
2 si
nk (
t CO
2 ha
-1 y
r-1)
Data from: Smith et al. (2007a)
Looking to the future…more work on organic soilsOrganic soil restoration vs. mineral soil sequestration

Change in cropland SOC – climate&NPP&technology
Climate only
J.U. Smith et al. (2005)

Change in cropland SOC – climate&NPP&technology
Climate&NPP&technology
J.U. Smith et al. (2005)

Management impacts on cropland C balance – climate mitigation
Smith et al. (2007a)
Some potential for agricultural GHG mitigation in Europe
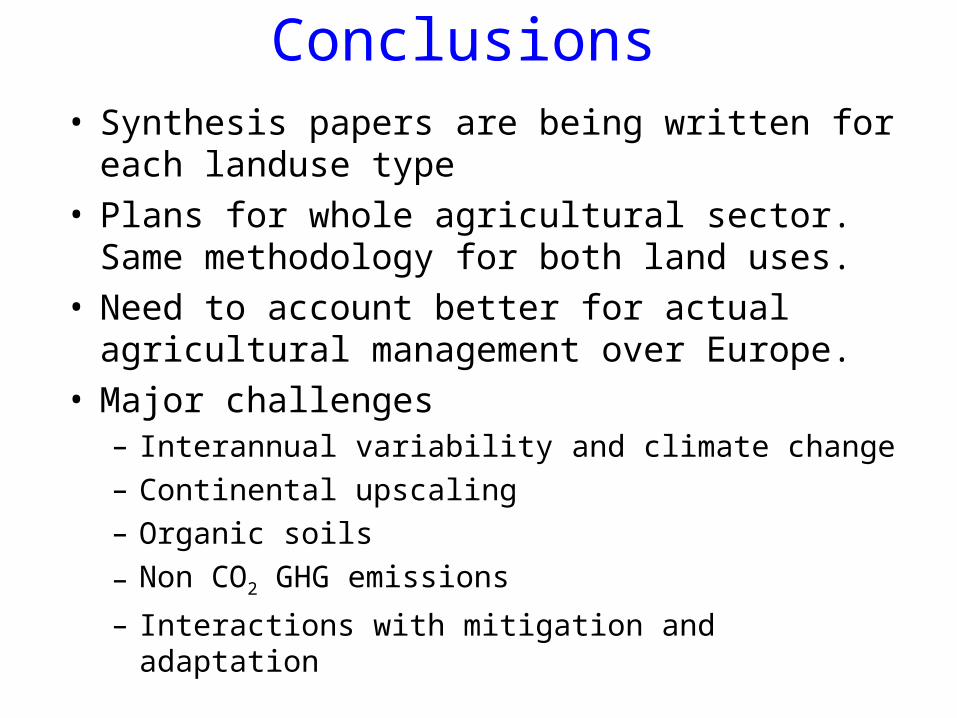
Conclusions• Synthesis papers are being written for each
landuse type• Plans for whole agricultural sector. Same
methodology for both land uses.• Need to account better for actual agricultural
management over Europe.• Major challenges
– Interannual variability and climate change– Continental upscaling– Organic soils
– Non CO2 GHG emissions
– Interactions with mitigation and adaptation