management management report report -...
TRANSCRIPT

ferrovial Annual Report 2010 63
Ferrovial se consolida como el mayor gestor privado de
infraestructuras de transporte del mundo.
managementreport
ferrovial management report
Ph
oto
: Bir
min
gh
am
, Rei
no
Un
ido
.
64 Businesses in 2010
96 Likely outlook for
businesses
98 Information on: the envi-
ronment, personnel, inno-
vation and development,
treasury stock, events after
year-end. Main risks and
uncertainties and fi nancial
risk management.
99 Report from the Audit and
Control Committee.
102 Report from the Board of
Directors in relation to the
additional information to
include in the Manage-
ment.
Report in accordance with
Article 116 bis of the Stock
Market Act.
106 Corporate Governance
Report
107 Information on the stock
market, treasury stock and
main shareholders
112 Analysis of risks of fi nan-
cial instruments
113 Post-year-end events
Management Report

ferrovial Annual Report 2010 65
Net profi t of 2,163 million euro (-74 million euro in 2009) triggered
by gains on the sale of assets, mainly from the sale of 10% of the Cana-
dian 407ETR toll road.
Growth on a like-for-like basis across all the lines of operating re-
sults, determined by the favourable evolution of international busi-
nesses (EBITDA - BAA +7.4%, Construcción Internacional +14.8%, Amey
+22.5%).
Airports: EBITDA was the highest since 2006. Strong growth in BAA’s
income statement on a like-for-like basis (sales +5.0%, EBITDA +7.4%,
EBIT +26.2%), despite extraordinary impacts aff ecting traffi c in 2010.
This growth is the result of the combination of infl ation-related tariff ad-
justment, traffi c evolution and commercial revenue. Excluding extraor-
dinary impacts, traffi c at Heathrow increased by approximately +3.4%,
following fi ve consecutive record months between July and November.
Services: this backlog stands at historic levels (12,003 million euro).
Major international business growth, Amey being of particular note
(sales +9%, EBITDA +23%) due mainly to contracts won in recent years.
Toll roads: Sales (+7.2%) and EBITDA (+7.6%) increased, on a pro forma
basis, due to the ETR-407’s positive performance. Strong traffi c growth
at the ETR-407 continues (+5.5% in 2010).
Construction: international business (52% of the Division’s EBITDA)
is still the growth engine, Sales +18%, EBITDA +15%, Budimex being of
particular note, Sales +29%, EBITDA +38% and EBIT +43%.
Overview
businesses performance in
2010
management report businesses in 2010
dec-10 dec-09 Ch.(%)
Construction backlog 10,186 8,800 15.7
Services backlog 12,003 9,967 20.4
Change in Toll Road
Traffi c (ADT) dec-10 dec-09 Ch.(%)
ETR 407 (Km travelled 000) 2,336.551 2, 214,773 5.5
Chicago Skyway 44,987 47,296 4.9
Indiana Toll Road 28,111 28,117 0.0
Autema 20,583 21,339 -3.5
Ausol I 15,623 16,984 -8.0
Ausol II 16,594 17,416 -4.7
BAA (passengers – in millions) 109.4 112.2 -2.5
dec-10 dec-09 Ch.(%)
Consolidated net debt -19,788.7 -22,271.4 11.1
Net debt ex-infrastructure
projects31.2 -1,172.2 102.7
dec-10 dec-09 Ch.(%)Pro-forma
(%)
Sales 12,169.2 12,231.9 -0.5 2.7
EBITDA 2,514.3 2,591.5 -3.0 6.5
EBIT * 1,514.4 1,586.6 -4.6 13.6
Net profi t 2,163.3 -73.5 n.s.
Net investment -895.5 196.8 n.s.
* In order to facilitate an analysis, all comments refer to EBIT before
impairment and non-current asset disposal.

ferrovial Annual Report 2010 67
Corporate debt, “excluding infrastructure projects”, has a net cash position of 31 million euro due to cash fl ow generation in Construction and
Services and period divestments (including collection on the sale of 10% of the share capital of ETR407 and Chilean toll roads) compared with 1,172
million euro in December 2009. This net cash position includes 420 million euro invested during the year and the payment of dividends, though it does
not yet refl ect the collection on the sale of Swissport or the M-45 for a total of 760 million euro.
The projects’ debt fell to 19,820 million euro. This signifi cant reduction was due mainly to the exclusion from consolidation of the debt of the ETR
toll road (3,150 million euro at September 2010), partly off set by the debt increase due to the depreciation of the Euro against the currencies in which
the debts of the main projects are denominated (+670 million euro) and an increase of the scope of consolidation, including new toll roads in the US
under construction (1,234 million euro).
BAA’s positive performance with the refi nancing of total subordinated debt (GBP 1,566 million) and the back stop facility below GBP 1,300 million
(repaid in October); a level from which the restriction to pay dividends to the restricted group is eliminated, thanks to the close to GBP 2,000 million
obtained by BAA since August.
The changes in the period were marked by the performance of the economies in which the assets are located. In the case of Canada, the ETR407 toll
road saw a 5.5% traffi c increase (VKT), compared to the negative performance of the Spanish toll roads.
The income statement is aff ected by the exclusion from consolidation in the fourth quarter of 2010 of the ETR407 and the Chilean toll roads, fol-
lowing the conclusion of sale processes (10% of ETR and 60% of Chilean toll roads). These toll roads were fully consolidated until September, when
the ETR407 began to be accounted for using the equity method. The Car Parks business is included in 2009 until June. The pro forma performance
counterweighs these eff ects.
Sales (+7.2%) and EBITDA (+7.6%) increased on a like-for-like basis due to the positive development of the ETR407, combining the increased number
of passengers, higher tariff s and cost control, resulting in higher profi tability.
The breakdown by toll road includes ETR for the entire period, even
though it has been accounted for using the equity method since Q4.
Changes in fi nancial debt:
Toll Roads
Sales EBITDA
dec-10 dec-09 Pro-forma
(%)
Sales 868.7 989.6 -12.2 7.2
EBITDA 629.6 664.3 -5.2 7.6
EBITDA margin 72.5% 67.1%
EBIT 517.1 557.9 -7.3 8.7
EBIT margin 59.5% 56.4%
dec-10 dec-09 Ch. (%)
407 ETR 456.1 354.2 28.8%
Chicago Skyway 46.0 46.6 -1.4%
Ausol 53.8 57.8 -7.0%
Autema 78.8 73.5 7.2%
Radial 4 19.9 21.5 -7.5%
Ocaña-La Roda 16.4 18.4 -10.9%
Chilean Toll roads 153.1 197.5 -22.4%
N4-N6 22.9 22.7 1.2%
M3 33.8 30.5 10.8%
Euroscut Algarve 35.5 36.7 -3.2%
Euroscut Norte Litoral 56.8 38.4 48.1%
Equity Accounted
Indiana Toll Road 131.8 114.1 15.6%
Ionian Roads 74.6 66.6 12.0%
M-45 25.4 26.5 -4.4%
dec-10 dec-09 Ch. (%)
407 ETR 364.6 276.4 31.9%
Chicago Skyway 38.3 38.7 -0.8%
Ausol 36.9 42.5 -13.1%
Autema 63.5 50.1 26.9%
Radial 4 10.9 9.9 9.8%
Ocaña-La Roda 8.3 9.7 -14.7%
Autopistas Chilenas 102.5 135.6 -24.5%
N4-N6 15.9 15.3 3.6%
M3 29.4 27.7 6.1%
Euroscut Algarve 30.9 32.4 -4.7%
Euroscut Norte Litoral 34.9 32.8 6.4%
PEE
Indiana Toll Road 105.1 88.4 18.9%
Ionian Roads 47.6 45.6 4.4%
M-45 23.7 24.9 -4.8%
management report businesses in 2010 management report businesses in 2010

ferrovial Annual Report 2010 69
dec-10 dec-09 Ch.(%)
407 ETR 79.9% 78.0% 191
Chicago Skyway 83.3% 82.9% 46
Ausol 68.6% 73.4% -483
Autema 80.6% 68.1% 1.250
Radial 4 54.9% 46.2% 866
Ocaña-La Roda 50.5% 52.7% -224
Autopistas Chilenas 66.9% 68.7% -117
N4-N6 69.2% 67.7% 158
M3 86.9% 90.7% -384
Euroscut Algarve 87.0% 88.3% -132
Euroscut Norte Litoral 61.4% 85.5% -2,403
Equity Method
Indiana Toll Road 79.7% 77.5% 226
Ionian Roads 63.8% 68.5% -468
M-45 93.3% 93.7% -39
dec-10 dec-09 Ch. (%)
407 ETR (´000 VKT) 2,336,551 2,214,773 5.5%
Chicago Skyway 44,987 47,296 -4.9%
Ausol I 15,623 16,984 -8.0%
Ausol II 16,594 17,416 -4.7%
Autema 20,583 21,339 -3.5%
Radial 4 8,314 8,988 -7.5%
Ocaña-La Roda 4,128 4,612 -10.5%
Santiago-Talca 75,251 77,462 -2.9%
Talca-Chillán 42,917 46,103 -6.9%
Chillán-Collipulli 28,606 26,840 6.6%
Collipulli-Temuco 32,710 31,367 4.3%
Temuco-Río Bueno 20,680 20,120 2.8%
N4-N6 25,926 25,137 3.1%
M3 23,601 n.s.
Euroscut Algarve 18,817 19,615 -4.1%
Euroscut Norte Litoral 30,019 31,234 -3.9%
Equity Method
Indiana Toll Road 28,111 28,117 0.0%
M-45 60,650 60,669 0.0%
EBITDA Margin % Traffi c Quarterly traffi c performance
management report businesses in 2010 management report businesses in 2010
CANADA
IRELAND
SPAIN
-4.6%-3.1%
-0.6%
-1.1%
-4.4%
-7.4%
-5.4%
-4.6%-11.3% -11.2% -6.8% -7.1% -3.5% -3.1% -4.2% -3.5%
-2.3% -1.8% -0.6%-0.8%
-2.0%
-6.1%
-5.5%
-1.5%

ferrovial Annual Report 2010 71
The sound performance of 407-ETR traf-
fi c (YTD +5.5%), consolidating the trend
witnessed in previous quarters. It should be
highlighted that a new daily traffi c record of
454,275 journeys was achieved on 30 June.
The previous all-time-high had been reached
on 5 October 2007 with a total of 445,882
journeys.
Both Indiana Ticket (+2.7%) and ETR407
(+5.5%) bear faithful witness to the positive
performance of the economic indicators in
this geographical area, with more than 100
km sections with very few quality alternatives.
Even though traffi c of light and heavy vehicles
increases on both toll roads, the latter shows
greater growth (Indiana Ticket +3.5%, ETR
+7.4%).
Negative changes in Chicago Skyway
(-4.9%) and the Barrier section of the In-
diana toll road (-6.5%). These changes were
due to the abnormally heavy traffi c recorded in
2009, as they benefi ted until November 2009
from road works and lane closure on alternative
roads. The closure in November 2009 of a feed-
ing road also had a negative impact (December
was already comparable and fall-backs in Chi-
cago were lower -3.4% vs. -5.3% and -6.9%
in November and October). Indiana’s traffi c
performance was not aff ected by July’s tariff
increase.
In Portugal, following the traffi c upturn in
the Algarve during the summer months given
the recovery of the tourist industry in the region
(with hotel occupancy rates even above those of
2009), a new drop was registered in the fourth
quarter due to the fall of tourism in autumn. In
Norte Litoral, in the fourth quarter traffi c was
restricted due to the implementation on 15 Oc-
tober of the availability-based payment system.
In Ireland, the recovery of the N4 was con-
fi rmed throughout the year, with constantly
positive growth rates and a permanent in-
crease of the motorway’s capture share. The
M3, which was opened to traffi c on 4 June,
shows the typical development of a toll road in
its initial growth phase.
Financing
Financing activities in the Toll Roads Division in
2010 amounted to approximately 3,000 mil-
lion euro, mainly on the ETR-407 and in Spain,
together with the fi nancing arranged for a new
toll road in Texas (LBJ).
AUSOLOn 12 April 2010, the Company signed with the
syndicate of banks (18 entities) the extension
of the maturity term for the previous syndicat-
ed loan until 19 March 2011 (491 million euro).
LBJ IH 635Financing closed on 22 June 2010, the proj-
ect amounts to USD 2,800 million.
The project receives a 25% equity contribu-
tion.
Shareholders USD 672 million (25%). According
to their shareholding, Cintra (51%) will con-
tribute USD 343 million.
The remaining 75% is fi nanced through:
PAB (Private Activity Bonds) (23%) USD
615 million
TxDOT (Texas Department of Transpor
tation) (19%) USD 490 million
TIFIA (US Federal Government credit)
(33%) USD 850 million
Rating: Fitch rated the PAB and the TIFFIA debt
BBB-. Moodys rated the PAB Baa3.
Divestments
Sale of 10% of the 407-ETROn 5 October, an agreement with Canada
Pension Plan Investment Board (CPPIB) was
entered into for the sale of 10% of the share
capital of the 407 ETR toll road (Toronto,
Canada) concession holder for CAD 894.3
million. The transfer took place on 18 No-
vember.
Up to that date, Cintra owned 53.23% of the
company.
The transaction gave rise to a net gain of 2,471
million euro for Ferrovial, corresponding to the
sale of 10% (467 million euro) and the “fair
value adjusment “ revaluation of the stake re-
tainer (43.23%, EUR 2,005 million ).
Sale of 60% of the shareholding in ChileOn 15 September, the sale of 60% of the
ownership interests in Cintra Chile to the Co-
lombian company ISA was completed. On 28
December 2009, the two companies reached
a heads of agreement that concluded with the
completion of the transaction.
This transaction amounted to approximately
229 million euro. The currency of reference
for the transaction were 6.8 million Unidades
de Fomento (UF) wich the infl ation - indexed
unit of account used in Chile. In addition, both
parties grant each other call and put options,
respectively, for 40% of Cintra Chile’s remain-
ing capital.
The transaction was recognised in full –given
future call and put options– and amounted to
381.5 million euro, representing a consoli-
dated net gain after tax of 274 million euro,
of which a net amount of 158 million euro
corresponds to 60% of the investment sold
and 116 million euroto the increase in mar-
ket value of the ownership interest, the latter
recognised as a fair value adjustment in the
Group’s consolidated income statement.
The aforementioned divestment was com-
pleted after months of work assessing and re-
pairing defects in infrastructure caused by the
earthquake that struck Chile on 27 February.
Sale of shareholding in Trados-45On 21 July an agreement was entered into for
the sale of the ownership interest in Autopista
Trados 45, S.A. (50%) to FINAVIAS, AXA Pri-
vate Equity infrastructure funds investment
vehicle. The transaction, closed on 10 Janu-
ary 2011, amounted to 68.3 million euro and
gave rise to a pre-tax gain of 38 million euro.
Project tendering
Despite uncertainty on the fi nancial markets
and the lack of liquidity, a slight recovery can
be seen in the development activity of public
authorities in certain international markets
targeted by Ferrovial.
Various projects are being assessed in North
America, both in the US and Canada.
Greenfi eld projects with real tolls are being
studied in the most developed Latin American
markets (Chile or Puerto Rico).
As regards new markets, the countries such as
India, Brazil and Mexico, continue to be moni-
tored.
Other signifi cant matters
2010 407-ETR tariff increaseThe new tariff s together with the reorganisa-
tion of the toll zones, in force since 1 February
2010, were published on 31 December 2009.
The tariff for light vehicles during peak hours
is 21.35 dollar cents in the Regular Zone and
20.10 dollar cents in the Light Zone. Off -peak
and weekend tariff throughout the toll road is
18.35 dollar cents for light vehicles.
The change in tariff s also includes the increase
of video-toll for light vehicles from USD 3.25
to USD 3.60 and the Trip Toll Charge (TTC) in-
crease for light vehicles from USD 0.25 to USD
0.40.
The monthly rental of the transponder (USD
2.50) and the tariff to maintain the video-toll
account (USD 2.50) remain the same as in
2009.
Opening of M3 in IrelandThe second toll road concession in Ireland, the
M3, which will be managed during a 45-year
term, was opened on 4 June. The toll road
off ers a strategic connection between Dublin
and the northwest of the country. It has re-
quired an investment in construction of 525
million euro.
This project was developed by Ferrovial Ag-
román and the Irish construction company
SIAC Construction. The M3 is part of the Na-
tional Development Plan designed by the Irish
government through the National Roads Au-
thority.
The concession of real and open system tolls
includes two lanes in each direction with two
mainline toll areas and six interchanges. The
50 km long project between Clonee and the
north of Keels also includes the corresponding
access roads.
ETR 407In 2010 the toll road issued bonds amount-
ing to CAD 1,500 million, refi nancing all of
2011 debt maturities in the last quarter.
June 2010: issue of two series of bonds for CAD
500 million and CAD 300 million with 5 and
10 year maturities, respectively. These funds
were used to cancel bonds maturing in Octo-
ber 2010 (CAD 625 million).
The option to extend its maturities by bond-
holders was exercised in junior bonds (CAD 165
million, maturing in July 2010). The new ma-
turity term is now July 2040.
November 2010: issue of two series of bonds
for CAD 400 million (4.30% coupon rate) and
CAD 300 million (3.87% coupon rate) matur-
ing at 10 and 6 years. These issues were used
for an early repayment of bonds maturing in
January 2011 (CAD 550 million).
Following these transactions, the 407ETR’s
total debt amounts to CAD 5,256 million,
with no maturity in 2011. The coming ma-
turities, all of which correspond to senior debt,
are 2012 (CAD 300 million), 2014 (CAD 200
million) and 2015 (CAD 500 million).
R4On 27 January 2011, the Company signed with
the same syndicate of banks (28 entities) the
extension of the maturity term of the previ-
ous syndicated loan. The total amount is 554
million euro maturing on 27 July 2011.
management report businesses in 2010 management report businesses in 2010

ferrovial Annual Report 2010 73
Indiana Toll Road tariff increaseThe new tariff s aff ecting light vehicles not
using a transponder as a means of payment
and all heavy vehicles came into force on 1
July 2010.
The average tariff increase in the Ticket sec-
tion was 8.4% and 11% for light and heavy
vehicles, respectively. The average tariff in-
crease for the Barrier section (closer to Chi-
cago) was 20% for light vehicles and 3.8%
for heavy ones.
Opening of new lanes and ramps on the ETROn 23 August 2010, more than 18 km of new
lanes (9.3 km in each direction) were opened
to the traffi c. In addition, the new access ramps
to interconnect the 407-ETR with the 403 and
QEW were opened to the traffi c on 9 Septem-
ber.
With the addition of the new lanes, the ex-
tension of individual lanes in the toll road has
increased to more than 1,100 km (including
access ramps). Investment in construction and
infrastructure by the concession operator since
1999 already exceeds CAD 1,200.
Transition to real toll in Norte LitoralThe new version of the concession contract
including the change from availability to
shadow toll payment and the contracting of
the toll collection service as Portuguese gov-
ernment income was signed in July 2010. The
toll collection started on 15 October. The
current Euroscut Norte shadow toll system
was replaced by availability payments of
the Portuguese government.
According to a real toll service provision con-
tract (Multi Lane Free Flow), Euroscut Norte
will provide a toll collection service to users
and deliver the takings to the Portuguese gov-
ernment.
Spanish Government aid plan for toll roadsAn aid plan for specifi c toll roads, including
the AP36 and R4, was published in the Offi -
cial state Gazette of 31 December 2010. This
aid consists of a contribution by the Ministry
of an amount resulting from the diff erence
between the revenue that would have been
obtained from 80% of the supply traffi c
and the amount actually obtained, provid-
ed the aid does not exceed actual annual
revenue.
2011 407-ETR tariff increaseThe new tariff s together with the reorganisa-
tion of the toll zones, in force since 1 February
2011, were published on 31 December 2010.
The tariff for light vehicles during peak hours
is 22.95 dollar cents in the Regular Zone and
22.75 dollar cents in the peak period.
The tariff for light vehicles during peak hours is
21.45 dollar cents in the Light Zone and 21.25
dollar cents in the peak period.
Off -peak and weekend/bank holiday tariff
throughout the toll road is 19.35 dollar cents
for light vehicles.
Tariff s for simple and multiple heavy vehicles
are two and three times the tariff s for light ve-
hicles, respectively.
The change in tariff s also includes the rise of
Video Toll Charge (VTC) for light vehicles from
USD 3.60 to USD 3.65, of Trip Toll Charge (TTC)
for light vehicles from USD 0.40 to USD 0.50
and of the fee to maintain the account of us-
ers without transponder (Video Account) from
USD 2.50 to USD 2.75.
The monthly rental of the transponder has in-
creased from USD 2.50 to USD 2.75.
The annual fee for the rental of the transpon-
der (USD 21.50) and the Video Toll Charge for
all types of heavy vehicles (USD 15.00) remain
the same as in 2010.
Increase in all income statement line items,
signifi cant increase in returns:
The contribution of new contracts at Amey
together with cost control and portfolio se-
lection in Spanish businesses have led to this
positive performance of the Services Division
in such a complex economic scenario.
The business in Spain manages to off set
the negative impact of the current economic
situation. The gross operating margin remains
stable, despite business restructuring costs
to adapt to a lower activity level, thanks to
cost control and the cancellation of low
profi t contracts.
Recovery is observed within the Waste Treat-
ment business regarding the number of
tonnes managed during the quarter; in ag-
gregate annual terms the drop is reduced by
up to -3% compared with the -15% accumu-
lated at June.
The decline in projects put out to tender had
a negative impact on the road maintenance
business.
BacklogThe backlog reached an all-time-high of 12,003 million euro (+20.4% vs. December 2009:
9,967 million euro) following the inclusion of the contract for the maintenance of roads and other
infrastructure in the city of Birmingham , as well as the Donarbon backlog (548 million euro),
the main contract of which is a 28-year waste management operation for Cambridgeshire. In
Spain the extension of several 10-year waste collection and treatment contracts in the province of
Toledo (244 million euro) and the 4-year emergency health transport contract in Madrid (75 mil-
lion euro) should be highlighted.
Services
dec-10 dec-09 Ch.(%) Pro-forma (%)
Sales 3,896.0 3,680.3 5.9 3.1
EBITDA 409.8 365.6 12.1 8.6
EBITDA margin 10.5% 9.9%
EBIT 280.6 241.1 16.4 11.7
EBIT margin 7.2% 6.6%
Backlog 12,003.0 9,966.9 20.4
dec-10 dec-09 Ch. (%)
Sales 1,495.3 1,527.2 -2.1
EBITDA 190.6 197.4 -3.5
EBITDA margin 12.7% 12.9%
EBIT 110.9 123.3 -10.0
EBIT margin 7.4% 8.1%
Backlog 5,410.6 4,885.1 10.8
Businesses in Spain
management report businesses in 2010 management report businesses in 2010
2011 Chicago tariff increaseThe new tariff s came into force on 1 January
2011. The average tariff increase was 16.7%
and 33.3% for light and heavy vehicles, re-
spectively.

ferrovial Annual Report 2010 75
Growth came about as a result of the high-
er contribution of cargo due to the signifi cant
increase of the volume of managed tonnes
and increased handling activity.
Performance during the year was marked
by a positive evolution of the internation-
al business in contrast to the downturn in
Spain. Signifi cant increase in backlog (+16%),
following the inclusion of new international
awards (LBJ and Heathrow’s T2). The inter-
national backlog amounts to 6,582 million
euro, signifi cantly above the backlog in Spain
(3,604 million euro).
The strong growth in the international busi-
ness (Sales +19%, EBITDA +15%) off sets the
lower level of activity in Spain (Sales -18%,
EBITDA -14%). For the fi rst time, interna-
tional operations contributed more than the
business in Spain in terms of both sales and
EBITDA.
The poor performance during the year was
triggered by the lower level of both residen-
tial and non-residential building construction
projects and the lower volume of civil engi-
neering work (fewer public tenders in 2009
and 2010). The backlog suff ered a year-on-
year fall of -14%.
Revenue increased on a comparable ba-
sis (+9%) due to the start-up of various con-
tracts awarded to Amey since 2009 (road
maintenance, railway civil engineering work
inspection, railway maintenance and several
facility management contracts at BAA). In
addition, the Birmingham city maintenance
contract began to contribute earnings in the
third quarter. The contribution from these new
contracts enabled the Company to off set
the negative impact of budget cutbacks in
the UK.
Amey’s earnings include certain extraordi-
nary profi ts, arising mainly from the eff ects
on pension funds and regularisation of work in
progress, as well as the settlement of lawsuits
and indemnities from restructuring. Exclud-
ing these eff ects, gross profi t from operations
would have increased by 10.8% and profi t
from operations by 12.4%.
Swissport sale agreementOn 2 November Ferrovial entered into an agreement with PAI Partners to sell Swissport Interna-
tional AG for 900 million Swiss francs. The transaction amounts to a company value of CHF 1,210
million. The transaction was completed on 17 February 2011.
Sale of Tube LinesThe sale of 66.66% of Amey’s ownership interests in Tube Lines, a company accounted for using
the equity method, was executed on 28 June. The sale totalled GBP 206 million. Amey recov-
ered the investment made in Tube Lines (share capital, subordinated debt and acquisition cost in
2005 of 33% of Jarvis), as well as the earnings generated since 2003.
Amey continue to manage the Jubilee, Northern and Picadilly lines maintenance services.
dec-10 dec-09 Ch. (%) Pro-forma (%)
Sales 1,301.6 1,123.7 15.8 5.3
EBITDA 107.4 81.0 32.6 20.5
EBITDA margin 8.3% 7.2%
EBIT 75.3 47.3 59.3 39.6
EBIT margin 5.8% 4.2%
dec-10 dec-09 Ch. (%) Pro-forma (%)
Sales 4,525.1 4,475.5 1.1 -1.3
EBITDA 231.1 228.0 1.3 -1.9
EBITDA margin 5.1% 5.1%
EBIT 191.2 183.1 4.4 1.0
EBIT margin 4.2% 4.1%
Backlog 10,185.7 8,800.4 15.7
dec-10 dec-09 Ch. (%) Pro-forma (%)
Sales 1,099.0 1,029.4 6.8 8.9
EBITDA 111.9 87.2 28.3 22.5
EBITDA margin 10.2% 8.5%
EBIT 94.4 70.6 33.8 26.6
EBIT margin 8.6% 6.9%
Backlog 6,592.4 5,081.8 29.7
dec-10 dec-09 Ch. (%)
Sales 2,138.6 2,596.2 -17.6
EBITDA 111.9 130.7 -14.4
EBITDA margin 5.2% 5.0%
EBIT 92.3 111.1 -16.9
EBIT margin 4.3% 4.3%
Backlog 3,603.6 4,183.6 -13.9
Swissport
Amey
Spain
management report businesses in 2010 management report businesses in 2010
Construction

ferrovial Annual Report 2010 77
Sales increased by 19%, gross profi t from
operations by +15% and profi t from opera-
tions by +28%, eliminating the exchange rate
eff ect.
The strong growth of the international busi-
ness already evident in previous quarters
continues, boosted by the commencement of
large projects in the US and the record fi gures
posted by Budimex and Webber.
The contribution of international sales in
the fourth quarter accounted for 61% of
EBITDA, thereby exceeding the contribu-
tion of the business in Spain. The fi gure for
the year as a whole stands at 53% compared
to 43% in 2009.
The international backlog is still growing
(+43%) and represents 65% of the Divi-
sion’s total. In addition to the new Budimex
contracts (+31%), other highlights include the
contracts for LHR T2 (495 million euro) and the
US LBJ toll road (1.7 billion euro).
Budimex
Webber
Signifi cant upturn in local currency-denominated sales (+29%), clearly rallying from the second
quarter onwards, as a result of more favourable weather conditions. Euro sales improved by 40%
due to its depreciation against the zloty (-9.2%). The recovery in the business activity from the
second quarter onwards is, in addition to the aforementioned weather conditions, the result of
the commencement of signifi cant projects (A2 and A4) awarded in 2009. The notable increase in
the operating margin (5.6% vs. 5.1%), raised growth in EBIT to 43%.
The backlog amounts to 1,743 million euro, growing in local currency by 31% as a result of the
performance of civil engineering work (A1-Strykow Exit and A4 Debica-Rzeszow for 410 euro
million) and non-residential public building construction work. The most important contract in
this connection is the refurbishment of Wroclaw train station (69 million euro).
.
Signifi cant increase in sales (+13%) result-
ing from the commencement of large projects
and more favourable weather conditions.
The improvement in the EBIT margin (+100
bp) is the result of the trend towards increased
outsourcing as opposed to the use of propri-
etary resources to execute works. This change
entailed transferring equipment depreciation
and amortisation costs to direct costs, directly
aff ecting the gross profi t from operations.
Therefore, the +67.9% in EBIT performed bet-
ter than the +12.3% in the EBITDA.
The signifi cant increase in the backlog was a
result of the inclusion of the Toll Roads Division
projects in Texas.
The backlog increased by 16% with respect
to December. Driven by international growth
(+43%) and the all-time-high earnings posted
by Budimex and Webber. The main projects
added to the backlog include Heathrow’s new
T2 terminal (495 million euro), LBJ toll road
(1,700 million euro) and the A 1-Strykow and
A4 Debica-Rzeszow projects in Budimex (410
million euro).
dec-10 dec-09 Ch. (%) Pro-forma (%)
Sales 2,395.4 1,912.8 25.2 18.5
EBITDA 119.2 97.3 22.5 14.8
EBITDA margin 5.0% 5.1%
EBIT 98.9 72.1 37.3 28.0
EBIT margin 4.1% 3.8%
Backlog 6,582.1 4,616.8 42.6
dec-10 dec-09 Ch. (%) Pro-forma (%)
Sales 1,014.5 724.2 40.1 28.7
EBITDA 62.3 41.5 50.0 37.8
EBITDA margin 6.1% 5.7%
EBIT 57.1 36.7 55.3 42.7
EBIT margin 5.6% 5.1%
Backlog 1,743.2 1,283.2 35.8 30.9
dec-10 dec-09 Ch. (%) Pro-forma (%)
Sales 490.2 412.6 18.8 12.5
EBITDA 25.4 21.4 18.6 12.3
EBITDA margin 5.2% 5.2%
EBIT 14.7 8.3 77.3 67.9
EBIT margin 3.0% 2.0%
Backlog 1,529.3 1,039.7 47.1 37.2
dec-10 dec-09 Ch. (%)
Civil engineering work 7,749.2 6,666.0 16.2
Residential building
construction417.2 430.5 -3.1
Non-residential building
construction1,381.5 1,099.2 25.7
Industrial 637.7 604.7 5.5
Total 10,185.7 8,800.4 15.7
International
Detail of the backlog
management report businesses in 2010 management report businesses in 2010

ferrovial Annual Report 2010 79
Airports
Euros dec-10 dec-09 Ch. (%) Pro-forma (%)
Sales 2,793.8 3,070.4 -9.0 5.0
EBITDA 1,271.8 1,337.1 -4.9 8.1
EBITDA margin 45.5% 43.5%
EBIT 556.1 611.3 -9.0 29.3
EBIT margin 19.9% 19.9%
BAA
BAA’s activity was conditioned in 2010 by the
distortions caused by the eruption of the
volcano in Iceland, causing the closure of the
airspace over England between 15 and 20 April
and early May, the BA cabin crew strike (34
days) and the closedown of runways caused by
extreme cold weather conditions and snow
in December.
As a result of the aforementioned events,
UK traffi c fell by -2.8% (traffi c would have
grown by 1% excluding these events), with
an estimated 3.6 million euro passengers lost
and an estimated economic loss of GBP 67 mil-
lion.
Pro forma BAA experienced growth in sales
(+5.0%) and EBITDA (+7.4%).
Retail income per passenger increased by
12.1% in regulated airports (14.4% LHR),
supported by the increase in origin-destination
traffi c, reaching 65% (63% in 2009).
Excluding the impact of exceptional factors, BA strike, volcanic
eruption and extreme cold weather, the growth in traffi c would stand at
approximately +3.4% at Heathrow.
dec-10 dec-09 Ch. (%) Pro-forma (%)
Euros 2,790.1 3,067.2 -9.0 5.0
Sales 1,282.2 1,354.5 -5.3 7.4
EBITDA 46.0% 44.2%
EBITDA margin 567.0 630.0 -10.0 26.2
EBIT 20.3% 20.5%
EBIT margin
Sales
Gross profi t
from
operations
Margin %
Heathrow 1,743.6 825.1 47.3%
Heathrow Express 182.6 55.6 30.5%
Stansted 229.6 86.0 37.5%
Scotland 229.5 89.1 38.8%
Southampton 27.3 9.9 36.3%
United Kingdom 2,412.6 1,065.8 44.2%
Naples 61.4 24.3 39.5%
Adjustments and other -85.4 -8.9
Pro forma 2,388.6 1,081.2 45.3%
The detail of sales and gross profi t from operations is as follows:
(Millions of pound sterling)
Q4 traffi c (-1.9%) was clearly hampered by the closure of runways during the cold spell and snowstorms in December. Even so, LHR continued to
perform well during the quarter (+0.7%), thanks to the strong growth recorded in October and November, consolidating the trend observed in Q3.
During the fi rst half of the year, traffi c was aff ected by British Airways strikes and the impact of the volcanic eruption in April.
In 2010, passenger numbers in the UK fell by -2.8%. The change of trend observed since the third quarter enabled Heathrow to achieve fi ve con-
secutive all-time-highs in the volume of passengers (July-November). In Stansted, the fall in traffi c (-7.0%) results from reduced holiday traffi c, which
is very important at this airport. Long-haul low cost fl ights are increasing, a trend that is expected to continue.
Passengers per Airport – in millions dec-10 Ch. (%)
Heathrow 65.7 -0.2
Stansted 18.6 -7.0
Glasgow 6.5 -9.6
Edinburgh 8.6 -5.0
Aberdeen 2.8 -7.4
Southampton 1.7 -3.2
United Kingdom - Total 103.9 -2.8
Naples 5.5 2.5
Total BAA 109.4 -2.5
Traffi c
LHR.- Performance by destination in DecemberThe impact of the closure of runways due to the cold weather and
snow was much lower in the most important and profi table market
for Heathrow (long-haul fl ights), aff ecting domestic traffi c more.
management report businesses in 2010 management report businesses in 2010
Domestic EuropeLong
Haul

ferrovial Annual Report 2010 81
LHR.- Monthly traffi c performanceDespite the impact of the closure of runways due to the extreme cold weather and snowstorms in
December, at LHR the quarter continued to perform well (+0.7%), thanks to the strong growth
recorded in previous months. .
BAA continued to make signifi cant progress in extending its debt ma-
turities. BAA arranged close to GBP 2,000 million, allowing for the
settlement of most of its short-term maturities. BAA does not have
any signifi cant maturities until 2012.
On 22 October, Ferrovial initiated the process for the possible sale
of a non-controlling ownership interest in BAA. Initially, 10% of the
share capital will foreseeably be sold.
The process was initiated in the framework of Ferrovial’s policy to maxi-
mise the value of its assets, taking advantage of the fi nancial soundness
attained in BAA’s capital structure and the improvement in its operating
parameters and fi nancial results.
On 1 October BAA announced the sale of its ownership interests in the
Naples international airport to the Italian company F2i SGR for 150
million euro. The transaction entailed an EV/EBITDA multiple of 13.3.
On 27 April BAA announced the agreement for the sale of its interest in
Airport Property Partnership (“APP”) to the British fi rm Segro for GBP
244 million (approximately 280 million euro). APP was owned on an
equal-footing basis by BAA and Aviva Fund Management. The gain for
Ferrovial amounted to 18 million euro. The transaction was completed
on 22 June.
The eff ort made to enhance Heathrow’s service quality in the recent
years is shown by the improved passenger satisfaction ratings contained
in the survey conducted by the Airport Council International, in which
LHR obtained a 3.80 rating in Q4 (3.78 in 2009), retaining the second
place among the main European hubs.
The main quality indicators have been aff ected by weather conditions
and the BA strike.
Punctuality: 71% of LHR fl ights took off with less than a 15-minute delay
(77% in 2009), 78% at STN (82% in 2009), aff ected by poor weather
conditions and strikes.
At Heathrow, the percentage of lost luggage decreased to 18‰ (19‰
in 2009), despite the diffi culties caused by extraordinary events such as
BA strikes or runway closures owing to the volcanic eruption or extreme
cold weather conditions.
Security checks: 97.5% of LHR passengers passed through security
checks within the periods established for this process. At Stansted, 98.2%
of the passengers observed these procedures. These fi gures are above
required quality parameters (95%).
2010 refi nancing includes:
• Subordinated debt refi nancing (GBP 1,570 million).
• A and B class bond issues for GBP 1,025 million and 500 million
euro, which, together with cash fl ow generation, made it possible to re-
duce the back stop facility to below GBP 1,300 million, which is the level
the restriction to pay dividends is eliminated.
On 13 November 2009, BAA shareholders
approved a fi nancial optimisation plan to en-
able recurring access to fi xed income markets.
New funds contributed by shareholders to
FGP Top Co. amounted to EUR 148 million,
EUR 81 million of which correspond to Fer-
rovial.
FGP Top Co. contributed GBP 500 million to
the regulated airport structure (BAA SP). The
aim of this transaction was to strengthen this
company’s fi nancial ratios. A total of GPB 331
million was used to repay or cancel derivatives
and slightly reduce the overall debt. The re-
maining GBP 169 million increased the com-
pany’s cash.
F inancing
Divestments Service quality
Concept Date Amount Spread Maturity
Class B loan 20/08/10 GBP 625 325 2014
Class B bonds 01/09/10 GBP 400 375 2018
Class A bonds 05/10/10 EUR 500 205 2016
High Yield loan 26/10/10 GBP 175 500 2015
High Yield bonds 03/11/10 GBP 325 7.125%
fi xed coupon2017
management report businesses in 2010 management report businesses in 2010
JAN FEB MAR APR MAY JUN JUL AUG SEP OCT NOV DEC
5.3%
-0.5%
-0.4%
-3.1%
0.1%
3.5%
2.5%
7.6%
-20.8%
7.2%
4.3%
- 9.5%

ferrovial Annual Report 2010 83
Competition CommissionIn March 2009 the Competition Commission issued its fi nal report or-
dering the sale of Gatwick and Stansted airports to another buyer, as
well as the sale of Glasgow or Edinburgh airports, granting a two-year
period to complete all the divestments.
In May 2009 BAA fi led an appeal against the decision of the Commission
at the CAT (Competition Appeal Tribunal).
On 21 December the CAT handed down a decision in favour of BAA,
thereby opening a period in which the parties, BAA and the CC, could
come to a solution on the matter.
On 10 February 2010 the CC announced its decision to fi le an appeal at
the CAT, which was rejected on 25 February, overruling the obligation to
sell. On 26 March the Court of Appeal (CoA) accepted the appeal lodged
by the CC, which took place in June.
On 13 October 2010 the CoA ruled in favour of the CC, sustaining the
conclusions reached by the CC in its initial report (obligations to sell).
In November 2010 BAA sought permission to fi le an appeal against the
CoA decision at the Supreme Court.
On 18 November 2010 the CC opened the period to refer evidence on the
possible changes of circumstances that could lead to the reconsideration
of the solutions proposed in its initial report.
On 17 February 2011 the Supreme Court denied BAA permission to fi le an
appeal against the CoA decision.
Capacity developmentThe new British government announced its intention not to authorise
the development of new runways in the south of England. Conse-
quently, BAA announced that Heathrow will stop the procedures to
obtain the development permit for the third runway and Stansted will
withdraw its authorisation request for a second runway.
Before fair
value adjust-
ments
Fair value
adjustments
Dec-10 Before fair
value ad-
justments
Fair value
adjustments
Dec-09
Revenue 12,169 12,169 12,232 12,232
Other operating income 17 17 30 30
Total operating income 12,186 12,186 12,262 12,262
Operating expenses 9,671 1 9,672 9,667 3 9,670
EBITDA 2,516 -1 2,514 2,595 -3 2,591
Margin % 20.7% 21.2%
Depreciation and amortisation charge 1,000 1,000 1,005 1,005
Profi t from operations before impairment and non-current
asset disposals1,516 -1 1,514 1,590 -3 1,587
Margin % 12.4% 13.0%
Impairment and disposals of non-current assets 740 1,139 1,879 -620 -90 -710
Profi t from operations 2,256 1,138 3,393 969 -93 876
Financial results -1,646 -79 -1,725 -1,505 -50 -1,555
Financial loss of infrastructure projects(fi nancing) -1,524 -1,524 -1,402 -1,402
Gains and losses on derivative fi nancial instruments and
other fair value adjustments-48 -48 -148 -148
Financial loss of other companies (fi nancing) -122 -122 -103 -103
Gains and losses on derivative fi nancial instruments and
other fair value adjustments-31 -31 98 98
Share of profi ts of companies accounted for using the
equity method53 8 62 69 16 85
Consolidated profi t or loss before tax 663 1,067 1,730 -467 -127 -594
Income tax -44 129 85 84 41 125
Consolidated profi t or loss for the year 619 1,196 1,815 -383 -86 -469
Loss for the year attributable to non-controlling
Interests38 310 348 334 61 395
Profi t or loss for the year attributable
To the parent 657 1,506 2,163 -48 -25 -74
income statement
(“DfT”), review of economic regulation of UK airports The government confi rmed its decision announced in December 2009
not to authorise a special administration scheme, and not to intro-
duce changes to the bases supporting Heathrow and Stansted cur-
rent maximum tariff s. The new British government has created a pack-
age of measures to be developed in the new legislation, including:
• Civil Aviation Authority (CAA) fundamental duty to promote the inter-
ests of passengers. In addition, the CAA will have the additional duty to
ensure license holders are able to fi nance their activities.
• A minimum credit worthiness requirement for licensed airports.
• Ring fencing provisions similar to those in place in other regulated sec-
tors with initial derogations from some of these provisions where the
costs of introducing these provisions would exceed their benefi ts.
• A requirement on the CAA to apply considering the removal of an air-
port’s derogations and an appeals process that is aligned with the wider
license modifi cation process.
• An obligation on the airport to prepare a Continuity of Service Plan and
to keep the plan in serviceable state.
CAA, extension of regulatory periodOn 7 February, the CAA initiated a consultancy period on the potential
extension of Q5 regulatory period for a further year, until March 2014.
The consultancy period will last over a month and a decision will be
taken in March 2011.
Regulatory Matters
management report businesses in 2010 management report businesses in 2010
The sale of the Chilean toll roads was executed in September and, therefore, they have been excluded from consolidation since August. The ETR 407 business
was fully-consolidated until September and accounted for using the equity method thereafter, following the formalisation of the sale of 10% in November.
The pro forma information includes these impacts in 2010 and in 2009.
IFRIC 12 Note: eff ective from 1 January 2010, the Company has adopted the IFRIC 12 “Service concession arrangements”, which is mandatory from that date.
Pursuant to this standard, contracts may be classifi ed into two types: intangible assets and fi nancial assets (a mixed contract could also exist). In Ferrovial’s
case, the majority relate to intangible assets. Ferrovial has estimated the impact of adopting this standard for the Group, which was recognised on 1 January
2010 and is therefore included in the 2010 fi nancial statements.
The impact of transition will not be signifi cant in the case of intangible assets. As regards fi nancial assets, the most signifi cant corresponds to the case of Ter-
rasa Manresa Toll Road, since the other main projects being carried out in the UK were already applying the model.

ferrovial Annual Report 2010 85
Main accounting impactEarnings were aff ected by various factors: (I) Exchange rate, due to the
depreciation of the Euro against the Canadian dollar (14%), the Polish
zloty (9%) and the pound sterling (3%); (II) Smaller scope of consolida-
tion in 2010 due to sales made in 2009 (Car Parks Division and Gatwick
Airport) and 2010 (10% ETR and Chilean Toll roads); (III) Fair value ad-
justment to the fi nancial loss (with no eff ect on cash), mainly caused by
the evolution of the Ferrovial share price and hedges against future in-
fl ation; (IV) Impairment and disposal of non-current assets, with eff ect
before fair value adjustment due to the gains on the sale of assets and
on fair value adjustment for adjustments of assets to market value; (V)
In 2010 the IFRIC12 (accounting model for concession arrangements) is
applied for the fi rst time.
Sales
EBITDA
EBIT
Dec-10 Dec-09 Ch.(%) Pro forma (%)
Construction 4,525.1 4,475.5 1.1 -1.3
Airports 2,793.8 3,070.4 -9.0 5.0
Toll roads 868.7 989.6 -12.2 7.2
Services 3,896.0 3,680.3 5.9 3.1
Other 85.5 16.0 n.s.
Total 12,169.2 12,231.9 -0.5 2.7
Dec-10 Dec-09 Ch. (%) Pro forma (%)
Construction 231.1 228.0 1.3 -1.9
Airports 1,271.8 1,337.1 -4.9 8.1
Toll roads 629.6 664.3 -5.2 7.6
Services 409.8 365.6 12.1 8.6
Other -27.9 -3.6 n.s.
Total 2,514.3 2,591.5 -3.0 6.5
Dec-10 Dec-09 Ch. (%) Pro forma (%)
Construction 191.2 183.1 4.4 1.0
Airports 556.1 611.3 -9.0 29.3
Toll roads 517.1 557.9 -7.3 8.7
Services 280.6 241.1 16.4 11.7
Other -30.6 -6.8 n.s.
Total 1,514.4 1,586.6 -4.6 13.6
Dec-10 % Dec-09 %Ch.(
%)
Spain 3,765.0 31% 4,349.9 36% -13.4
United Kingdom 4,202.6 35% 4,432.2 36% -5.2
Canada & USA 1,407.8 12% 1,187.8 10% 18.5
Poland 1,169.7 10% 779.1 6% 50.1
Chile 202.4 2% 238.3 2% -15.1
Rest of Europe 1,140.8 9% 1,007.3 8% 13.3
Rest of the world 280.8 2% 237.2 2% 18.4
International total 8,404.2 69% 7,882.0 64% 6.6
TOTAL 12,169.2 100% 12,231.9 100% -0.5
Dec-10 % Dec-09 % Ch. (%)
Spain 369.7 15% 415.4 16% -11.0
United Kingdom 1,400.2 56% 1,450.3 56% -3.5
Canada & USA 372.3 15% 348.7 13% 6.8
Poland 69.9 3% 55.3 2% 26.3
Chile 108.7 4% 139.8 5% -22.3
Rest of Europe 157.4 6% 156.8 6% 0.4
Rest of the world 36.2 1% 25.1 1% 44.4
International total 2,144.6 85% 2,176.1 84% -1.4
TOTAL 2,514.3 100% 2,591.5 100% -3.0
Dec-10 % Dec-09 % Ch. (%)
Spain 223.6 15% 287.0 18% -22.1
United Kingdom 669.2 44% 707.2 45% -5.4
Canada & USA 292.8 19% 265.5 17% 10.3
Poland 64.5 4% 50.3 3% 28.1
Chile 108.3 7% 138.5 9% -21.8
Rest of Europe 152.0 10% 134.5 8% 13.0
Rest of the world 3.9 0% 3.5 0% 11.3
International total 1,290.7 85% 1,299.6 82% -0.7
TOTAL 1,514.4 100% 1,586.6 100% -4.6
management report businesses in 2010 management report businesses in 2010

ferrovial Annual Report 2010 87
Financial results
Net profi t
Dec-10 Dec-09 Ch. (%)
Net fi nance cost of infrast. projects -1,523.8 -1,401.7 -8.7
Net fi nance cost of other companies -122.4 -103.4 -18.4
Financial result on fi nancing -1,646.2 -1,505.1 -9.4
Financial result on infrast. projects -48.1 -148.1 67.5
Financial result on other companies -30.6 98.1 -131.2
Financial result on hedges -78.6 -50.0 -57.2
Financial result -1,724.8 -1,555.1 -10.9
dec-10 dec-09 Ch. (%)
Net fi nance costs of infrastr. -1,523.8 -1,401.7 -8.7
Net fi nance costs of other -122.4 -103.4 -18.4
Financila result on -1,646.2 -1,505.1 -9.4
Financial result on other infrastr.
project-48.1 -148.1 67.5
Financial result on other com-
panies.-30.6 98.1 -131.2
Financial result on -78.6 -50.0 -57.2
Financial -1,724.8 -1,555.1 -10.9
Hedging instruments Dec-10 Dec-09
Stock option plans -38.7 159.2
Infl ation hedges -41.5 -141.6
Interest rate hedges -12.9 26.4
Other hedges 14.5 -94.0
Total -78.6 -50.0
Dec-10 Dec-09
Net reported result (profi t/loss) 2,163 -74
Depreciation and amortisation chargeIn line with the same period in 2009, (-2.1% on a like-for-like basis) to
stand at 1,000 million euro, the depreciation and amortisation taken for
the airports business was the most signifi cant (716 million euro).
EBIT (before impairment and non-current asset disposals)Excluding the impact of exchange rates and changes in the scope of
consolidation, there would be an increase of +13.6%.
Impairment and disposals of non-current assetsThis heading includes gains and losses on disposals, with impact on cash,
and the eff ect of recognising at fair value certain assets and liabilities
with no impact on cash. The latter group includes three aspects with
signifi cant impact on 2010: the impact of recognising at fair value ow-
nership interests in certain assets a portion of which were sold in 2010
and that changed from being fully-consolidated to being accounted for
using the equity method; the impairment due to valuation adjustment of
certain assets, and the impact caused by the measurement of derivatives
not considered to be eff ective, the changes in value of which are recog-
nised in the profi t or loss.
The following eff ects are included, namely:
Sale of 10% of the ETR: 2,489 million euro, corresponding to the sale
of 10% (474 million euro) and the increase in the market price of the
43.23% interest retained (2,015 million euro), which were recognised as
a fair value adjustment.
Sale of Chilean toll roads: 354 million euro, 206 million euro of which
correspond to 60% of the investment sold and 148 million euro to the
increase in the market price of the remaining 40%, which were recogni-
sed as a fair value adjustment.
Impairment losses at Airports: impairment losses of 734 million euro
were recognised, 173 million euro of which correspond to the decision
made by the new UK government regarding the development of the third
runway at Heathrow and the second runway at Stansted (SG2), all of
which are included as fair value adjustments.
Impairment losses at Toll Roads: impairment losses of 277 million euro
were recognised, mainly in relation to European toll roads, due to the
negative traffi c performance during 2010 and the updating of long-
term assumptions for these toll roads.
Losses on fi nancing increased mainly as a result of higher infl ation pro-
jections in the UK and 2009 refi nancing costs.
The fi nancial losses hedging instruments increased by 57%. This in-
creased accounting expense was mainly due to stock option plans, re-
sulting from the changes in the share price in 2010, closing at 7.44 euro
(compared with 8.23 euro in 2009) and infl ation hedges.
Financial resultsThe fi nancial loss increased by 10.9%, combining increased borrowing
costs on fi nancial liabilities (9.4%) with further fi nance costs arising from
fair value adjustments to derivatives (without cash outfl ow).
Results of companies accounted for using the equity methodThe companies accounted for using the equity method contributed 61.7
million euro (84.5 million euro in 2009), with Amey’s PPP projects being
the most signifi cant item with a 21.1 million euro contribution. The Air-
ports Division contributed 12.4 million euro and Toll Roads 20.0 million
euro, the latter contributing more in the last quarter following the chan-
ge of method used to consolidate ETR.
management report businesses in 2010 management report businesses in 2010
TaxesIncome tax gave rise to tax assets amounting to 85 million euro. The tax
asset arose from the tax losses recognised in the income statement of
the Airports Division.
Non-controlling interestsThis heading amounts to 348.2 million euro, due mainly to the losses at-
tributable to non-controlling shareholders and incurred mainly at BAA,
a company in which the non-controlling interests represent approxima-
tely 45%.
Net results Profi t amounted to 2,163 million euro; due mainly to the divestment at
ETR.

ferrovial Annual Report 2010 89
Dec-10 Dec-09
Non current assets 35,465 36,048
Goodwill 5,032 6,952
Intangible assets 97 45
Concession infrastructure 21,512 23,621
Property, plant and equipment 552 669
Investment property 64 77
Investments in associates 3,110 262
Non-current fi nancial assets 2,184 1,935
Pension surplus 22
Deferred tax assets 2,068 1,604
Derivative fi nancial instruments at fair value 847 861
Assets classifi ed as held for sale and discontinued operations 1,515 1,802
Current assets 6,306 6,150
Inventories 445 489
Trade and other receivables 3,161 3,181
Cash and cash equivalents 2,701 2,480
Total assets 43,287 43,999
Equity 6,628 4,719
Equity attributable to the equity holders 5,194 3,102
Equity attributable to non-controlling interests 1,434 1,617
Deferred income 196 232
Non-current liabilities 28,596 29,751
Provisions for pensions 153 503
Other long-term provisions 860 954
Bank borrowings 21,511 23,368
Other payables 154 136
Deferred tax liabilities 3,951 3,454
Derivative fi nancial instruments at fair value 1,968 1,336
Liabilities classifi ed as held for sale and discontinued operations 891 1,647
Current liabilities 6,975 7,650
Bank borrowings 1,530 1,937
Trade payables 4,889 5,194
Operating provisions 556 519
Total equity and liabilities 43,287 43,999
Balance sheet and other magnitudes
The net debt excluding infrastructure projects decreased by 1,203
million euro, with a net cash position of 31 million euro. This signifi -
cant change is derived from the cash fl ows generated by Construction
and Services together with the period divestments (mainly the proceeds
from the sale of 10% of Toll road ETR407 capital, the Chilean toll roads
and the sale of Tube Lines). This net cash position includes: 420 million
euro invested in 2010 (mainly in the new infrastructure projects in the
US and investments by the Services division in the UK), plus the dividends
paid of 320 million euro and, it does not yet refl ect the proceeds from the
Swissport and M-45 sale transactions, totalling over 760 million euro.
The project debt is therefore reduced to 19,820 million euro. This signifi -
cant reduction is due mainly to the exclusion from consolidation of the
ETR toll road debt (3,150 million euro), partly off set by the depreciation
of the euro against the currencies in which the main project debts are
denominated (670 million euro) and the widening of the scope of con-
solidation to include the new toll roads in the US.
The Group’s net debt amounted to 19,789 million euro, representing a
reduction of 2,482 million euro compared with December 2009.
The level of cash fl ow generation, together with the asset turnover po-
licy have led to a signifi cant decrease in debt, excluding infrastructure
projects.
Net consolidated debt
management report businesses in 2010 management report businesses in 2010
dec-10 dec-09
Net debt excluding infrastructure
projects31 -1,172
BAA -14,529 -13,856
Toll roads -5,026 -7,104
Other -265 -140
Net debt infrastructure projects -19,820 -21,099
Total net debt -19,789 -22,271
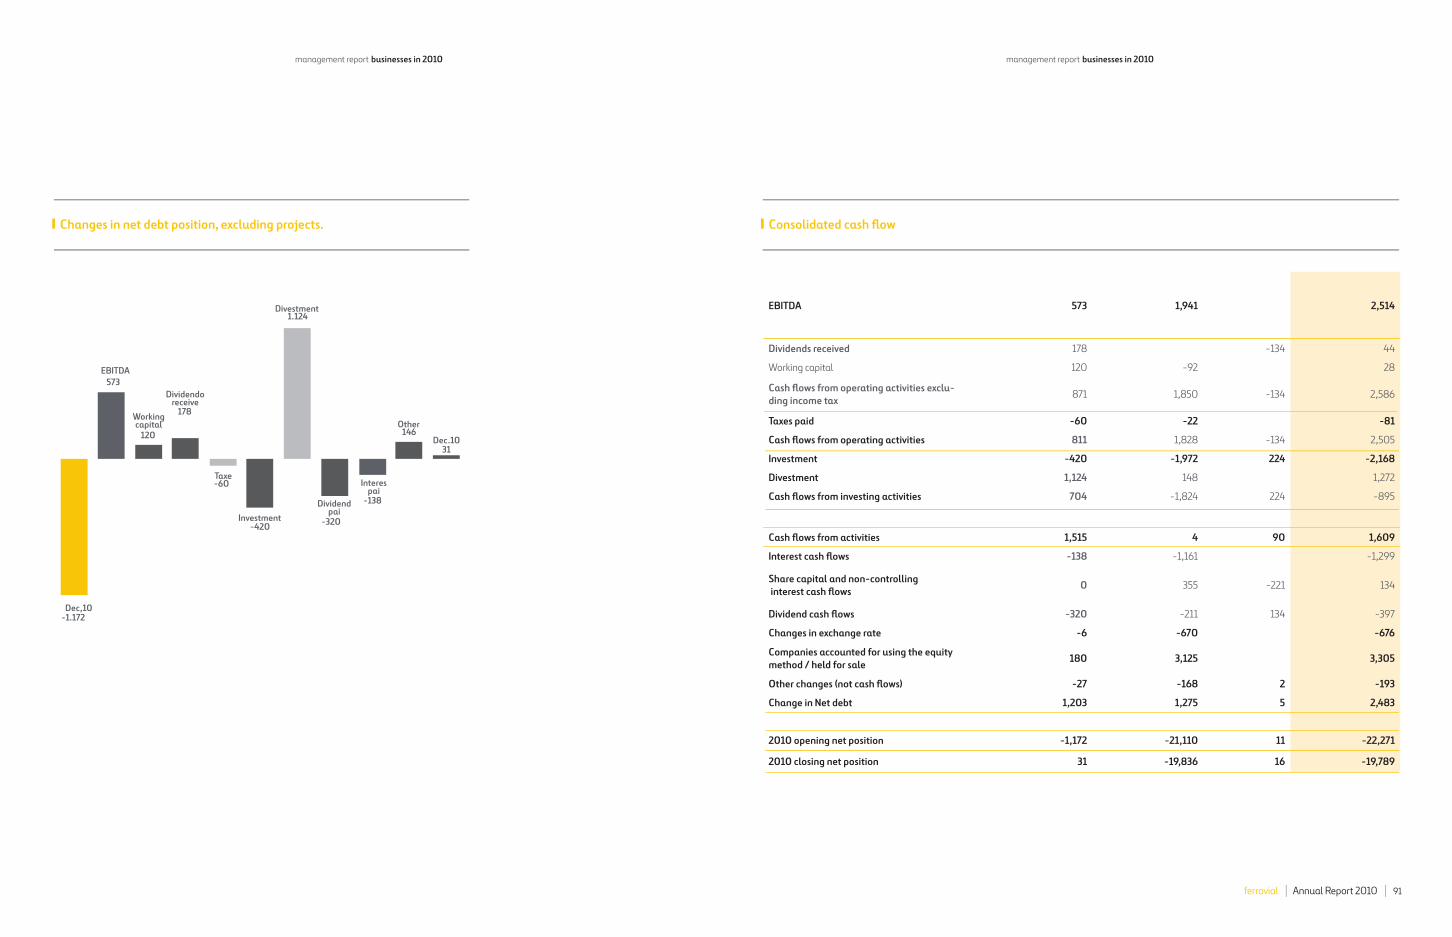
ferrovial Annual Report 2010 91
Consolidated cash fl ow
EBITDA 573 1,941 2,514
Dividends received 178 -134 44
Working capital 120 -92 28
Cash fl ows from operating activities exclu-
ding income tax871 1,850 -134 2,586
Taxes paid -60 -22 -81
Cash fl ows from operating activities 811 1,828 -134 2,505
Investment -420 -1,972 224 -2,168
Divestment 1,124 148 1,272
Cash fl ows from investing activities 704 -1,824 224 -895
Cash fl ows from activities 1,515 4 90 1,609
Interest cash fl ows -138 -1,161 -1,299
Share capital and non-controlling
interest cash fl ows0 355 -221 134
Dividend cash fl ows -320 -211 134 -397
Changes in exchange rate -6 -670 -676
Companies accounted for using the equity
method / held for sale180 3,125 3,305
Other changes (not cash fl ows) -27 -168 2 -193
Change in Net debt 1,203 1,275 5 2,483
2010 opening net position -1,172 -21,110 11 -22,271
2010 closing net position 31 -19,836 16 -19,789
-1.172
31
-60
-138
146
-420-320
573
120
1.124
178
Changes in net debt position, excluding projects.
management report businesses in 2010 management report businesses in 2010
Dec,10
Other
Dec.10
EBITDA
Workingcapital
Dividendoreceive
Taxe
Investment
Divestment
Dividendpai
Interespai

ferrovial Annual Report 2010 93
Investment DivestmentNet
investment
Construction -46 8 -38
Services -148 241 94
Toll roads -139 867 728
Airports -83 -83
Other -4 8 3
Total -420 1.124 704
A. Operating cash fl ow
The 2010 changes in the cash fl ows from operating activities excluding
infrastructure projects by business segment with respect to 2009 are as
follows:
B. Cash fl ows from investing activities
The breakdown, by business segment, of the cash fl ows from investing
activities excluding Infrastructure projects, making a distinction be-
tween the outlays for investments made and the collections on divest-
ments, is as follows.
“Cash Flows from Investing Activities” includes, on the one hand, capi-
tal increases at the Toll Roads division, and on the other, capital invest-
ments in the infrastructure projects (mainly in the American and Spanish
toll roads), as well as in BAA, at which the capital increase took place in
January and was directly related to the fi nancial structure optimisation
plan. “Services” includes the investment made for the acquisition of a
waste treatment company in the UK (Donarbon).
As regards divestments, notable under “Toll roads” was the sale of the
10% percent of the ETR Toll road (658 million euro) and the sale of the
Chilean Toll roads (209 million euro); while “Services” most notably in-
cludes the sale of Tubelines from Amey (217 million euro) and the sale of
the Cespa offi ces in Madrid (14 million euro).
In the Toll Roads division, the cash fl ows from operating activities in-
clude 170 million euro arising in relation to dividends and reimburse-
ments of equity from the companies that own the toll roads infrastruc-
ture projects, the detail of which is refl ected in the accompanying table.
The detail of the cash fl ows from Construction and Services, by business
segment, is as follows:
Cash fl ow excluding infrastructure projects
Cash fl ows from operating activities 2010 2009
Construction 373 406
Services 282 343
Toll roads 178 134
Airports -12 -18
Other 50 14
Cash fl ows from operating activities
excluding taxes871 879
Income taxes paid -60 -38
Total 811 841
Dividends and capital
reimbursements2010 2009
ETR 407 100 63
Autema 5
M-45 4
Ausol 12 9
Spanish toll roads 16 14
Algarve 6
Norte Litoral 3
Portuguese toll roads 8
Other toll roads 8 13
Total dividends 123 99
Autoestrade Poludnie 22
Euroscut Algarve 15
Norte Litoral 21
Portuguese toll roads 21 15
Spanish toll roads 1
Chicago 3 4
Total equity reimbursed 47 20
Total 170 119
Construction Services Total
EBITDA 225 402 627
Dividends received 6 6
Working capital 148 -126 22
Cash fl ows from opera-
ting activities
excluding income tax
373 282 655
management report businesses in 2010 management report businesses in 2010

ferrovial Annual Report 2010 95
Toll-road concession infraestructure 2010
Intangible assets/Property,plant and equipament 0
NTE -37
0,0 -29
Spanish toll roads -26
Greek toll roads -22
Azores -12
SH-130 -10
M-3 -3
Concession infraestructure -139
Total -139
Interest cash fl ow 2010
ETR 407 -151
US toll roads -117
Spanish toll roads -91
Portuguese toll roads -40
Chilean toll roads -39
Other toll roads -18
Total toll roads -456
BAA (fees and commissions and prepaid interest) -129
BAA (other interest) -562
Total BAA -691
Other -13
Total -1,160
C. Cash fl ows from fi nancing activities
This item includes payments on dividends both to Ferrovial S.A.’s share-
holders, which amounted to 315 million euro in 2010, and those corre-
sponding to non-controlling shareholders at consolidated level (mainly
Budimex and Swissport).
Lastly, it should be noted that the positive eff ect of the reclassifi cation of
Swissport’s assets and liabilities in 2010 to assets and liabilities classifi ed
as held for sale, which anticipates the cancellation of the debt due to the
sale planned for 2011.
A. Cash fl ows from operating activities
The cash fl ows from operating activities of the infrastructure conces-
sion operators includes mainly the infl ow of resources from those com-
panies which are under operation, although it also includes the refunds
and payments of VAT corresponding to those still under construction.
The breakdown of the cash fl ows from operating activities of infrastruc-
ture projects is as follows:
B. Cash fl ow from investing activities
The breakdown of the cash fl ows from investing activities of infra-
structure projects, making a distinction between outlays, mostly relat-
ed to capex investments, and the collection on divestments, is as follows:
Infrastructure project cash fl ows
Air-
ports
Toll
RoadsOther (*) Total
EBITDA 1,282 643 16 1,941
Taxes paid 2 -24 1 -22
Changes in working
capital-24 -69 1 -92
Cash fl ow from
operations1,260 550 18 1,828
Inves-
tmentDivestment
Net inves-
tment
North Tarrant Express -185 -185
SH-130 -275 -275
Azores -104 -104
ETR 407 -44 -44
LBJ -96 -96
Other toll roads -68 -68
Total toll roads -772 -772
BAA -1,057 148 -909
Other -144 -144
Total -1,973 148 -1,825
As regards cash fl ows from investing activities, the investment in con-
cession assets for BAA and Toll Roads 2010 should be noted, most sig-
nifi cantly, Portugal (Azores toll road) and US toll roads (North Tarrant
Express, SH-130 and LBJ).
“Divestments” includes primarily proceeds from the sale of APP in June
and the Naples Airport in December.
C. Cash fl ows from fi nancing activitiesCash fl ows from fi nancing ac-
tivities includes dividends paid and equity reimbursed by the concession
operators to their shareholders, as well as amounts received by these
companies for capital increases. For the fully-consolidated concession
operators these amounts correspond to all of the quantities paid and
received by the concession operators, irrespective of the percentage of
participation that the Group holds therein. There are no dividends or eq-
uity reimbursement included for the companies that are accounted for
using the equity method.
Interest fl ows are related to interest paid by the concession operators,
plus other fees and commissions and costs closely related to the obtain-
ment of fi nancing. Cash fl ows under these items correspond to the inter-
est expenses for the period, as well as any other item entailing a direct
change in net borrowings for the period. This amount does not coincide
with the fi nancial loss included in the income statement, mainly as a re-
sult of the diff erences between the amount of interest accrual and pay-
ment.
Worthy of note at BAA is the prepayment of interest ( -129 million euro)
corresponding to subsequent years associated with the infl ation indexed
derivatives (Index Linked Swaps) and interest rate swaps as a result of the
issue of bonds in 2010.
Cash fl ows from fi nancing activities also includes the impact of interest
rate fl uctuations on debt denominated in foreign currency, which in 2010
gave rise to a loss of 670 million euro, as a consequence of the appre-
ciation of the pound and Canadian dollar against the euro, which had a
signifi cant eff ect on the net debt of BAA and the Canadian 407-ETR, as
well as the positive eff ect caused by the change in the method of consoli-
dating the Canadian ETR toll road in 2010 after the sale of ten per cent
of the shares thereof (+3,149.7 million euro).
Lastly, “Other” includes items that represent a fl uctuation in reported
borrowings but do not aff ect the actual cash fl ow, such as unpaid ac-
crued interest, etc.
(*) Cash fl ow from companies owning “Other” projects is basically made up of cash
fl ow from Services and Construction infrastructure projects.
management report businesses in 2010 management report businesses in 2010

ferrovial Annual Report 2010 97
businesses outlook
management report businesses outlook management report businesses outlook
The main uncertainty concerning the world economic situation in 2011 is
centred on the confi rmation of the recovery that began in some countries
in 2010. A slow recovery is expected from the second half of the year on-
wards, endangered by the instability of the fi nancial markets caused by
the European systemic crisis regarding sovereign debt.
The concerns regarding the sovereign risk of the eurozone might contrib-
ute to tighter credit and higher borrowing costs.
Spain is expecting to overcome the recession, but facing growth rates
much lower than the average of developed economies, due to the high
unemployment rate, the collapse of construction, the high level of in-
debtedness and the tax and trade defi cit.
As regards the Airport business, according to the International Air Trans-
port Association (IATA) the recovery that began in 2010 is expected to
be interrupted in 2011, showing a slower growth, mainly due to the in-
crease in the price of oil and the tax measures adopted by certain Eu-
ropean governments, which will have a negative eff ect on the industry.
In the UK, Germany and Austria, such measures are expected to cause
an approximate 3%-5% increase in fl ight prices, although the emerging
countries will continue to experience a signifi cant growth in the volume
of passengers.
Passenger numbers are expected to grow 5.3% worldwide compared
with 2010. The breakdown of this growth per region is as follows: North
America 3.7%, Europe 3.5%, Asia-Pacifi c 6.9%, Middle East 10.5%,
Latin America 6.3% and Africa 5.5%. UK Airports are expected to experi-
ence a higher increase than the European average rate due to the impact
caused by the Iceland volcano in 2010.
In the UK, an index commonly used to measure infl ation in regulated
sectors is RPI (“Retail Price Index”), which ended in 2010 at around 4.0%.
The RPI to be applied by BAA in order to update prices for 2011 was 4.7%
(year-on-year rate for August).
Of note was the privatisation process of the 49% of AENA that took place
in Spain as a consequence of the new decree on economic measures ap-
proved by the Spanish Government.
For 2011, BAA s strategy will be focused on the improving, both the ser-
vices off ered and its competitive position, and on strengthening its fi nan-
cial position through new bond issues and cash fl ow generation through
growth in gross profi t from operations.
As regards Toll Roads, since the infl ation rates and GDP are expected
to be slightly positive, prices will grow slightly (update of prices normally
linked to infl ation or GDP per capita). It is also expected that the improve-
ment in traffi c performance during the second half of 2010 will be con-
solidated in 2011, as a result of the expected growth in the economies of
various countries. Heavy vehicle traffi c is expected to perform especially
well, taking into consideration the falls recorded in 2009-2010. Positive
increases in GDP might bring about a recovery in production levels and,
as a result, also in heavy traffi c.
In Spain, Greece and Portugal, the heavy and light vehicle traffi c de-
creased in the second half of 2010, being strongly related to the crisis
specially aff ecting long-distance journeys. A recovery in traffi c is expect-
ed for the second half of 2011.
In the US and Canada there was an upturn in the economic growth in-
dexes (GDP, employment, industrial production, etc.) which are expected
to bring about a slight increase in traffi c in 2011.
In 2011 Cintra will continue to adapt its strategy to the current situation
by participating in tender off ers for the greenfi eld projects with stakes
below 50% and applying the mature asset selective rotation policy.
As regards urban and waste treatment Services in Spain, the liquid-
ity problems of many Spanish City Councils (along with the restrictive
measures on public borrowing) caused delays in payment of contracts in
2010. A slight recovery and the reactivation of the Spanish economy are
expected for 2011; while the volume of tonnes is likely to recover slowly
after the signifi cant drop in industrial and construction activities.
In the UK, the reduction in public expenditure announced by the Gov-
ernment is expected to take eff ect in 2011, including budget cutbacks at
local authorities and lower investments in new infrastructures. Projects
expected to be tendered in 2010 or 2011 (mainly maintenance services
contracts for railway infrastructure, roads and street lightning) will fore-
seeably be put back a number of years. As a consequence of the lower
number of tenders due to tighter spending and the foreseeable increase
in competition, margins are likely to be squeezed.
In 2011 the Services division’s strategy will be based mainly on the bal-
anced diversifi cation of the business, taking advantage of its growth and
its capacity to generate cash.
As regards Construction, after ending 2010 with a downturn in the ac-
tivity, Euroconstruct expects a change of tendency in 2011 production
(1.2%) for its 19 member countries, including Spain, and solid growth in
2012 (2.4%).
Spain, as opposed to other European countries, will continue to experi-
ence a reduction in the activity for at least one more year, without rul-
ing out the possibility of a second similar year. Spanish civil engineering
projects, after facing a particularly bleak scenario in 2010 due to the
public expenditure reduction plans brought about by the high defi cits of
the local authorities and the central government, will be relieved in part
in 2011 if the announced package of public-private fi nancing projects
comes about.
Poland, the market in which Budimex operates, continues to be one of
the EU economies with the highest forecast growth for 2011 (3.7%). With
respect to the construction industry, the opportunities are related to
the UEFA EURO 2012 and the allocation of EU Structural and Cohesion
Funds for 2007-2013.
In Texas –the market in which Webber operates– the economy is expect-
ed to show greater growth in 2011 compared with the rest of the country.
In general, US companies expect that the Infrastructure Renewal Plan
announced by Obama will actually be carried out.
In the UK, worthy of mention is the growth opportunity arising from the
Crossrail project (approx. GBP 16,000 million), the biggest infrastructure
project of the decade. High speed train projects are expected to be car-
ried out in other countries as well (the US and Spain).
Expectations for the Construction business include the growth in the in-
ternational segment together with other activities or business groups,
mainly toll roads and BAA, thereby converting Construction into a com-
petitive tool in high complexity infrastructure projects. It is expected that
in the coming years, growth abroad will off set the negative performance
foreseen for the business in Spain.
In 2011 Ferrovial’s main strategies will be based upon:
· Continue the cost control policy and working capital management to
maximise cash generation at operating level.
· Continue the selective divestment policy in mature assets aiming at
investing in new projects with high potential to create added value and
synergies for the Group.
It is important to highlight two processes relating to BAA. Firstly, the pro-
cess initiated by Ferrovial concerning the process to sale of a 10% stake,
and secondly, the process initiated by the UK Competition Commission
that might represent divestment at certain BAA airports.
Macro economic variables Ferrovial´s performance by business area
Main challenges for Ferrovial in 2011

ferrovial Annual Report 2010 99
main risks and uncertainties and financial risk
management
audit and control committee report
management report main risks and uncertainties and fi nan-
cial risk management
management report audit and control commitee report
• Within Ferrovial s commitments in the area of corporate responsibility,
environmental policy holds a prominent place and focuses on the use of
environmental management systems and the setting of indicators and
follow-up on environmental performance objectives.
• The annual Corporate Responsibility Report published by the Company
includes a detailed breakdown of the evolution of all these indicators in
2010.
• Human Resources policies are a key element in Ferrovial s commitments
in the area of corporate responsibility. Human Resources activities are
oriented towards guaranteeing sustainable growth of the organisation
and developing the potential of its employees in order to increase the
competitive level of the Company in the market. The annual report pub-
lished by the Company monitors in detail the Human Resources activities
undertaken in 2010, along with the main indicators related thereto.
• The information on the treasury share portfolio and events after the
reporting period are included in Notes 15 and 37 respectively to the con-
solidated fi nancial statements for 2010, bearing in mind that they are
prepared in parallel with this management report.
• The information on risks and uncertainties is included in the Corporate
Governance Report which is part of this report.
• The Group’s activities are exposed to various types of fi nancial risks, of
particular note being primarily interest rate risks, foreign currency risks
and market risks. The principal hedging polices are described in Note 3 to
the consolidated fi nancial statements.
Pursuant to the Board of Directors Regulations of FERROVIAL S.A., all
the members of the Audit and Control Committee are non-executive di-
rectors, and shall be presided over by an independent director.
The members of the Committee, who were the same throughout 2010,
are as follows:
• Santiago Fernández Valbuena, Chairman
• Gabriele Burgio.
• PORTMAN BAELA S.L., represented by Eduardo Trueba Cortés until 25
March 2010, and Mr. Leopoldo del Pino thereafter.
• Juan Arena de la Mora
The Board of Directors Regulations have vested the Audit and Control
Committee with the powers summarised below:
In relation to the external auditors:
• Propose the appointment of the auditor, including the conditions of en-
gagement; and their dismissal or non-renewal.
• Enable communication between the Board of Directors and the audi-
tors. Ensure compliance with their recommendations by the Senior Man-
agement. Secure the auditor’s independence.
• Control advisory and consultancy services provided by the external au-
ditor.
In relation to the internal auditors:
• Propose the appointment, re-election or replacement of the Director as
well as the budget for such services.
• Oversee and check the internal audit plan.
In relation to the fi nancial information:
• Knowledge of the fi nancial reporting process and the internal control
systems.
• Supervise the annual and periodic public information prior to the ap-
proval thererof by the Board.
In relation to risk control:
• Regular analysis and evaluation.
In relation to other matters:
• Supervise compliance with the corporate governance rules.
• Set-up and supervise a “complaint box”.
• Prior report on transactions for the organisation and acquisition of
companies located in tax havens and special-purpose companies re-
ferred to in the Board Regulations.
Members Powers

ferrovial Annual Report 2010 101
These powers are detailed in the Company’s Annual Report on Corporate
Governance.
The Board of Directors shall recommend to the shareholders at the An-
nual General Meeting that the bylaws be amended to adapt the pow-
ers of the Audit and Control Committee to the amendments introduced
by Law 12/2010, of 30 June, to the Additional Provision Eighteen of the
Spanish Securities Market Law.
During 2010, the Committee held six (6) meetings.
The Committee annually approves a work plan addressing the subjects
to be discussed in each of the meetings.
Economic & fi nancial reportingAmong the functions of the Audit and Control Committee is to assist the
Board of Directors in its endeavours to ensure the accuracy and reliabil-
ity of the fi nancial information to be regularly reported by the Company.
During the year, the Committee analysed this information before making
it available to the Board of Directors and its being sent to the authorities
or the markets, taking advantage in this analysis of the cooperation of
the Economic & Financial General Management.
Relations with the external auditor
Appointment of the external auditor
In 2010, the Board of Directors resolved to replace the fi rm that, over the
last seven years, had provided fi nancial audit services, despite its good
performance.
The Audit and Control Committee undertook a selection process in which
some of the most important fi rms operating in Spain took part. This pro-
cess came to an end with the proposal made by the Board of Directors to
the shareholders at the Annual General Meeting held on 30 June 2010,
which approved the appointment of DELOITTE as the external auditor of
Parent and its Group for the years 2010, 2011 and 2012.
Review of the Financial Statements
As is customary practice at the Company, the external auditors appeared
before the Committee during the authorisation for issue of the fi nancial
statements for 2009 and they intend to do so again during the authori-
sation for issue of the fi nancial statements for 2010.
The account auditors of other companies of the Group also appeared
before the Committee in order to explain their working methods and the
most relevant aspects in reviewing fi nancial statements.
Independence of the auditor
The abovementioned Law 12/2010 vests the Audit and Control Com-
mittee with the power to secure the external auditor s independence.
For such purpose, the auditor shall confi rm its independence in writing
and shall provide information about the additional services rendered,
including its opinion in both respects.
In 2011, and prior to the issuance of the auditors’ report, the Committee
intends to fulfi l both obligations.
Other actions related to the external audit.
• As in 2009, the external auditor explained its limited review of the
quarterly fi nancial statements at 30 June 2010.
• The external auditor also appeared before the Committee in order to
report on its activities planned for the closing of the year 2010.
Internal Control ProceduresThe Committee examined a report on the main internal control recom-
mendations made as a consequence of the audit of FERROVIAL and on the
follow-up of those made during the review of the fi nancial statements for
2009.
The Committee was informed about the document prepared by the Work-
ing Team promoted by the Spanish National Securities Market Commission
(CNMV) with regard to the “Internal Control on Financial Reporting of listed
entities”, and future disclosure requirements in this fi eld. The internal con-
trol system being implemented at FERROVIAL was also examined, which
follows the structure proposed by the CNMV.
Internal AuditThe Committee oversaw the actions taken by the Company’s Audit De-
partment and, specifi cally, examined the following:
• The activity report for 2009, which gives evidence that the plans ap-
proved on that day by the Committee itself have been fulfi lled.
• The audit plan projected for 2010.
• The stage of completion of the work scheduled at the closing of the fi rst
six-month period, checking once again that the approved plans have
been fulfi lled.
Risk analysis and control systemsIn 2010 the Committee pursued its function of examining the principal
risks of the Company and its Group along with the systems established
for their control.
The Risk Management of Ferrovial appeared regularly before the Com-
mittee to report on these matters.
Actions in the area of Corporate Governance and compli-anceThe Committee took the following actions in this matter, in line with the
Board Regulations:
• Examination of the Annual Report on Corporate Governance for 2009,
prior to the presentation thereof to the Board of Directors.
In 2011, the Committee will review, for reporting purposes prior approval
by the Board of Directors, the Annual Report on Corporate Governance
for the year 2010.
• Report on transactions between the directors or senior executives and
the Company or entities of the Group, along with the broad lines of op-
eration, for later approval by the Board of Directors. As per the Board
Regulations, discussion and approval thereof took place without the in-
terested parties being present.
• Prior authorisation to hire advisory and consultancy services from ex-
ternal audit fi rms. In addition, the Committee receives a quarterly report
on the development of the authorisations already granted.
Other work performed by the Audit and Control Committee.The Company has developed a system managed by the Internal Audit
Department, the “Claims box”, through which all employees can con-
fi dentially and, if so wished, anonymously, report ineffi cient situations,
inappropriate behaviour or potential situations of breach. The Commission
has received two reports in 2010 about its performance: one related to the
prior year, and another related to the fi rst half of this year.
In 2010 the Claims Box was made available to external agents over the
Internet, on the Company’s website.
Also, the Committee examined reports on pension plans of various inter-
national subsidiaries of the Group.
Evaluation of the Audit and Control CommitteeIn accordance with its Regulations, the Board of Directors will assess
every two years the operation of the Committees based upon the report
furnished by the latter to it.
In 2010 the Audit and Control Committee examined its composition, pow-
ers and performance during 2009, submitting the relevant report to the
Board of Directors, which ratifi ed it.
Activities performed
management report audit and control commitee report management report audit and control commitee report

ferrovial Annual Report 2010 103
report by the board of directors related to the additional disclosures to be included in the directors’ report in
accordance with article 116 bis of the securities market law
management report report from the board of directors
in relation to the aditional information to include in the
management
management report report from the board of directors
in relation to the aditional information to include in the
management
Article 116 bis of the Securities Market Law requires that once a year listed
companies submit to the shareholders at the Annual General Meeting an
explanatory report on the additional disclosures that must be included
in the Directors’ Report.
For this reason and at the time of authorisation for issue of 2010 con-
solidated fi nancial statements, the Board of Directors issued this report.
a. The capital structure, including the securities that are not negoti-
ated on a regulated community market, indicating, where appropri-
ate, the various classes of shares and, for each class of share, the
rights and obligations conferred and the percentage of the capital
that they represent.
The share capital of FERROVIAL, S.A. (“Ferrovial” or the “Company”)
amounts to 146,702,051 euro divided into 733,510,255 shares, of twenty
eurocents (€0.20) par value each, belonging to a single class. All the
shares are fully subscribed and paid. Each share carries the right to one
vote.
b. Any restriction on the transferability of the shares.
There are no restrictions in the Company’s bylaws of any type on the ac-
quisition or transfer of shares representing the share capital, other than
those generally established in the corporate law.
c. Signifi cant direct or indirect ownership interests in
the share capital
At 31 December 2010, according to the information available to the
Company, the owners of signifi cant ownership interests in the share capi-
tal of Ferrovial S.A., were those shown in the table below:
According to the notifi cation sent to the Spanish National Securities Mar-
ket Commission and to the Company itself on 10 December 2009, the
family group formed by María del Pino y Calvo-Sotelo, Rafael del Pino
y Calvo-Sotelo, Joaquín del Pino y Calvo-Sotelo, Leopoldo del Pino y
Calvo-Sotelo and Fernando del Pino y Calvo-Sotelo, controls, through
Karlovy, S.L., the majority of the share capital of Portman Baela, S.L. In
turn, Portman Baela S.L. owned 44.607% of the share capital of Ferro-
vial S.A. Consequently, the family group formed by the aforementioned
persons, controlled through said company, 44.607% of the share capital
of Ferrovial, S.A. at 31 December 2010.
After the reporting period, through a notifi cation dated 21 January 2011
sent to the Spanish National Securities Market Commission and the Com-
pany, Portman Baela, S.L. updated the information relating to the per-
centage of voting power held by the above-mentioned “family group”
as a result of the sale of shares of Ferrovial, S.A. by Portman Baela, S.L.,
which took place between 17 and 20 January 2011. The “family group”
holds, through said company, 44.268% of the share capital of Ferrovial,
S.A.
Also,(i) at the end of 2010 Banco Santander, S.A. held, directly or indi-
rectly, 28,370,766 shares, which represent 3.868% of the share capital
of Ferrovial, S.A.
(ii) Norges Bank announced on 2 December 2010 that it held a direct
3.010% ownership interest in Ferrovial, S.A. After the reporting period,
on 24 January 2011, the former reported to the Spanish National Securi-
ties Market Commission and the Company that the aforementioned in-
terest in Ferrovial, S.A. had fallen to 2.965%.
d. Any restrictions on the right to vote.
There are no legal or bylaw-stipulated restrictions on the exercise of vot-
ing rights except those established in Article 83.1 of the Spanish Limited
Liabilities Companies Law and Article 12.2 of the Company’s bylaws,
which establish that a shareholder who has disbursements outstanding
not exercise his voting rights.
e. Shareholder agreements.
On 28 December 2009, Portman Baela, S.L., which held a 44.607%
ownership interest in Ferrovial, S.A. at 31 December 2010, notifi ed the
Company the agreements entered into by its shareholders. According
to these agreements, both the ownership of the share capital and the
voting rights of the shareholders of Portman Baela S.L. that are legal
persons must at all times be attributed to Rafael del Pino y Moreno and/
or his direct heirs. Moreover, the representatives of the aforementioned
legal persons undertake that, on behalf of the latter, the ownership of
the share capital and voting rights of each of them will be attributed to
Rafael del Pino y Moreno and/or his direct heirs.
On that same date, 28 December 2009, Karlovy, S.L. (a company exer-
cises control over Portman Baela, S.L. as defi ned in Article 4 of Securities
Market Law 24/1988, of 28 July) notifi ed Ferrovial, S.A. of the agree-
ments entered into by the shareholders of that company. These agree-
ments restrict transfers of shares of Karlovy, S.L. as follows: the share-
holders of Karlovy, S.L. undertake to off er their shares of Karlovy, S.L.
to Karlovy, S.L. itself and the other shareholders, should any legal or
natural person acquire a direct or indirect ownership interest in the share
capital or voting rights of any legal person holding shares in Karlovy, S.L.,
other than certain persons (as established in the agreement), heirs or be-
longing to the family of Rafael del Pino y Moreno.
f. Rules governing the appointment and replacement of the mem-
bers of the managing body and the amendment of the Company’s
bylaws.
f.1. Appointment and replacement of the members of the managing
body. The appointment and replacement of the members of the Board
of Directors is governed by the Company’s bylaws and by the Board of
Directors Regulations.
1. Quantitative composition
In accordance with the Company’s bylaws, the Board of Directors shall
consist of a minimum of fi ve (5) and a maximum of fi fteen (15) members
elected by the Shareholders at the Annual General Meeting, or by the
Board of Directors itself, in the terms legally established.
2. Qualitative composition
The bylaws and the Board of Directors Regulations require that the
aforementioned body ensures that: (i) the non-executive directors com-
prise a broad majority; and that (ii) the majority group of non-executive
directors be made up of proprietary or independent directors in a number
reasonably proportional to the latter. In any event, the independent di-
rectors shall represent at least one third of the total number of directors.
3. Selection of directors
The Board of Directors Regulations establishes a selection procedure
prior to the appointment or re-appointment of directors. When this pro-
cedure was applied to the selection of new directors, external fi rms were
involved.
One of the powers of the Nomination and Remuneration Committee is to
prepare and review the criteria that should be applied to constitute the
Board of Directors and the selection of candidates, as well as to ensure
that the selection process of candidates does not contain underlying bias
that could hinder the selection of directors because of personal circum-
stances. The appointments (or the re-appointments) of directors must
be preceded by:
• A proposal by the Nomination and Remuneration Committee, as re-
gards independent directors.
• A prior report by the aforementioned Committee, as regards the re-
maining directors.
Persons of recognised solvency, competence and experience should be
appointed, with more stringent requirements in relation to those persons
called upon to cover positions as independent directors, who must com-
ply with the Regulations in this respect.
As regards proprietary directors, the Board Regulations establish that
they may not have personal, direct or indirect, commercial, economic,
labour or regular professional relationships and of a signifi cant nature,
with Ferrovial, except those of a professional nature inherent to the posi-
tions of Chairman or CEO of the Company.
The Board members aff ected by appointment, re-election or dismissal
proposals shall obtain from participating in discussions or votes relating
thereto. Moreover, the voting will be secret.
4. Term of offi ce
The directors shall hold offi ce for three years and may be re-appointed
once or several times for the same term.
Purpose of the Report
Additional content of the directors’ report in line with
Article 116 bis of the Securities Market Law
No. Shares % share capital
Portman Baela, S.L. 327,193,828 44.607%

ferrovial Annual Report 2010 105
The independent directors should place their position at the disposal of
the Board, and formalise, if deemed convenient, their corresponding res-
ignation, when they reach twelve (12) years as members of the Board,
without prejudice to their possible continuation as directors of another
type.
5. Removal of Directors
In addition to removal due to expiry of the period of offi ce for which they
were appointed or to the decision of the shareholders at the Annual Gen-
eral Meeting, in addition to the aforementioned limitation for indepen-
dent directors, Article 30.3 of the Board of Directors Regulations requires
that the directors must place their position at the disposal of the Board
of Directors and formalise, if deemed convenient, their resignation in the
following cases:
• Executive directors, whenever the Board deems it appropriate.
• Proprietary directors, when the ownership interest in the Company in
consideration of which they were appointed is transferred in full. They
shall also be removed, in a proportional number, when the aforemen-
tioned ownership interest falls to a level that requires a reduction in the
number of proprietary directors.
• When they become subject to any incompatibility or prohibition pro-
vided for by law or internal regulations.
• When so requested by the Board of Directors for having failed to fulfi l
their obligations as directors.
• When their remaining on the Board could put the interests of Ferrovial
at risk.
• When they reach the age of 70. The Chairman, the Deputy-Chairman
when acting as an executive offi cer, the CEO and the Secretary of the
Board of Directors shall be removed at 65 years of age, but may continue
as directors and act as Chairman and Deputy-Chairman when the posi-
tions are not executive.
• When signifi cant changes occur in their professional circumstances or in
the conditions for which they were appointed as directors.
• When due to events attributable to the Board their presence on the
Board causes grave damage to the property or social reputation in the
opinion of the Board. Especially, if a legal process or an order is issued to
initiate a trial against them for any of the off ences specifi ed under Ar-
ticle 213 of the Spanish Limited Liability Companies Law, the Board shall
analyse at its earlier convenience the circumstances of the case and the
appropriateness or not of their continuation in the position, providing
reasoned disclosure thereon in the Annual Corporate Governance Re-
port.
As regards independent directors, the Board Regulations establish that
the Board may not propose their removal prior to completion of their
mandate, unless there is just cause as perceived by the Board, following
a report by the Nomination and Remuneration Committee. Just cause
will be deemed to exist, in particular, if the independent director infringes
his/her duties, is in a situation of incompatibility or is involved in the fore-
going circumstances.
The removal of independent directors may also be proposed when a
takeover bid, merger or other similar corporate operation gives rise to a
change in the capital structure of the Company which makes it advisable
to review the proportionality criteria established in the applicable good
governance guidelines.
f.2. Amendment of the Company’s bylaws
Any amendment of the company’s bylaws must comply with the provi-
sions of Articles 194 and 290 of the Spanish Limited Liability Companies
Law.
g. The powers of the members of the Board of Directors and, in particu-
lar, those relating to the possibility of issuing or repurchasing shares.
The Company’s powers of attorney correspond to the Board of Directors
acting as a collective body and on a majority-decision basis. The Board of
Directors has been vested with the Company’s powers of attorney, and has
powers, in the broadest respect, to conclude agreements in general, to carry
out all manner of acts and transactions, of contractual liability or disposi-
tion, ordinary or exceptional management and of absolute title, with respect
to all manner of movable and immovable properties, money, securities and
commercial bills, with no exceptions other than those matters that are the
authority of other bodies.
Notwithstanding the foregoing, Rafael del Pino y Calvo-Sotelo, Company
Chairman, and Íñigo Meirás Amusco, Managing Director, are permanently
vested, individually or jointly and severally, with all the powers of the Board
of Directors, except those that cannot be delegated pursuant to the law or
the bylaws.
The shareholders at the Annual General Meeting held on 22 October 2009
delegated to the Board of Directors the power to issue fi xed-income securi-
ties, both non-convertible and convertible and/or exchangeable, as well as
warrants on newly-issued shares or outstanding shares of the Company. The
duration of this delegation is for fi ve (5) years.
Also, the shareholders’ at the aforementioned Annual General Meeting
vested the Board of Directors with the power to increase capital, in one or
various steps and at any time, within fi ve years as of the date of resolu-
tion by the General Meeting, up to a maximum of seventy three million
(73,000,000 euro).
Lastly, at the same Annual General Meeting, the shareholders authorised
the Board of Directors to deliberately acquire treasury shares, directly or
through an investee of the Company, subject to the limits and requirements
provided for in the resolution of the Annual General Meeting. The duration of
the authorisation is fi ve (5) years from the date of the resolution.
h. Signifi cant agreements entered into by the Company which will
come into force, be modifi ed or terminate in the event of a change
in control over the Company resulting from a takeover bid, and their
eff ects, except when disclosure thereof may be seriously detrimental
to the Company. This exception shall not apply when the Company is
required by law to publish this information.
There is a corporate fi nancing agreement in force with certain banks,
which includes, among the reasons for early repayment, a change in con-
trol at Ferrovial, S.A. This agreement amounts to 2,714.5 million euro, of
which 1,830 million euro have been drawn down at 31 December 2010.
There are other less signifi cant agreements relating to the Company and
the Group, primarily of a fi nancial nature, which require certain authorisa-
tions or conditions prior to a change in control or a corporate transaction
such as a merger or spin-off .
In 2010 certain agreements were entered into with IT and telecommunica-
tion suppliers, which include, inter alia, a change in control at Ferrovial,
S.A. as one of the reasons for earlier termination.
i. The agreements between the Company and its directors and execu-
tives or employees that provide for benefi ts when the latter resign or
are terminated without just cause or if the employment relationship
comes to an end as a result of a takeover bid.
At 31 December 2010, the agreements between the Company and the
senior executives, including two executive directors, envisage express en-
titlement to receive the termination benefi ts provided for in Article 56 of
the Workers Statute in the event of unjustifi ed dismissal.
Ferrovial s Group companies occasionally hire individuals to hold positions
at various levels of management, mainly abroad, for which certain clauses
have been used that provide for termination or notice requirements on the
Company in case of unjustifi ed dismissal.
In addition, in order to encourage loyalty and long-service, a type of de-
ferred remuneration item was recognised for eleven senior executives,
including two executive directors. This item consists of an extraordinary
remuneration that will only become eff ective when certain of the following
circumstances occur:
• Removal of the senior executive by mutual agreement or upon reaching
a certain age.
• Unjustifi ed dismissal or abandonment of the Company on the latter’s
initiative without justifi cation for dismissal, prior to the senior executive
reaching the age initially agreed upon, if the aforementioned amount ex-
ceeded that resulting from applying the Workers Statute.
• The death or disability of the member of the senior executive.
To cover this incentive each year, the Company contributes to a group sav-
ings insurance policy, of which the Company itself is both policy-holder and
benefi ciary, quantifi ed according to a certain percentage of the total mon-
etary remuneration of each senior executive.
management report report from the board of directors
in relation to the aditional information to include in the
management
management report report from the board of directors
in relation to the aditional information to include in the
management

ferrovial Annual Report 2010 107
corporate governace
report
management report corporate governance report
De conformidad con lo establecido en la legislación mercantil, se ad-
junta como anexo al presente Informe de Gestión, el Informe Anual de
El informe de Gobierno Corporativo 2010 comunicado a la CNMV está
disponible en la web corporativa de Ferrovial.
information on the stock exchange, treasury shares and principal
share holders
management report information on the stock market, treasury stock and main
shareholders
Ferrovial ended the year 2010 at EUR 7.44 per share, with a fall of
-9.6%.
Ferrovial s share-price performance in 2010 showed two markedly dif-
ferent profi les. During the fi rst half of the year, the share price performed
negatively, as a result of the sovereign debt crisis in peripheral European
countries, which, in the case of Ferrovial, was worsened by the volcanic
ash cloud that forced European air space to be closed between 15 and
20 April.
Conversely, during the second half of the year performance was positive,
since various events occurred that were welcomed by the market. Along
with the partial refi nancing of BAA s debt, and the sale of the 10% own-
ership interest in the ETR407 toll road during this period, the fi nancing of
the new Lyndon B. Johnson toll road in Texas was completed.
In 2010, Ferrovial outperformed its benchmark index, the IBEX35,
which closed the year down with a fall of -17.4% and the Spanish build-
ing index, which closed the year with a fall of -14.9%.
The IBEX index closed 2010 at 9,859 points. The select Spanish index
lagged behind the main world indexes, which, broadly speaking, ended
the year on the up.
The biggest falls in the Spanish stock market occurred in the fi nancial
sector, which amounted to -31.7%. The best performing sector in 2010
was that of non-cyclical consumption, which rose +17.0%, led by Iberia.
At the macroeconomic level, the credit risk of peripheral European coun-
tries increased noticeably in 2010, which resulted in the Greek fi nancial
crisis and subsequently in the Irish fi nancial crisis in November.
Ferrovial historical performance, Ibex-35 and Sector Index -
1999 2000 social 2001 2002 2003 2004 2005 2006 2007 2008 2009 2010 1999-2010
FER -37% -6% 45% 23% 15% 42% 49% 26% -35% -59% 68% -10% 30%
IBEX 18% -22% -8% -28% 28% -17% 18% 32% 7% -39% 30% -17% -2%
Sector -26% -7% 26% 4% 25% 27% 54% 61% -10% -48% 18% -15% 67%
* 99-09 historical data corresponding to a historical pro forma series of the Ferrovial Group, adjusted to the merger share exchange rate of 4x1 in December 2009.

ferrovial Annual Report 2010 109
management report information on the stock market, treasury stock and main
shareholders
management report information on the stock market, treasury stock and main
shareholders
Share-price performance and effective volume traded in
4
5
6
7
8
9
1
0
5
10
15
20
25volume Share EUR EUR/shar
Share-price performance and effective volume traded in
Ferrovial’s performance, Ibex-35 and sector index in 2010
-
-
-
-
-
-
-
-
-
0
5
10
Dec- Jan- Feb- Mar- Apr- May- Jun- Jul- Aug- Sep- Oct- Nov- Dec-
Secto Ibex- Ferrovia
Volume traded - daily average – Millions Euros
26.29.
20. 19.
44.
36.34.36.
24.26.
41.
62.
33.
Januar Februar Marc Apri Ma Jun Jul Augus Septembe Octobe Novembe Decembe
Market capital ratio Million euros
1,902,76
3,89
5,51
8,20
10,37
6,75
2,74
6,03 5,45
3,382,04
199 200 200 200 200 200 200 200 200 200 200 201
Dividend per
0.20.4
0.60.8 0.9 1.0
1.1
2.0
0.40.42 0.2
0.6
199 200 200 200 200 200 200 200 200 200 200 201

ferrovial Annual Report 2010 111
Stock market data (in euros) Ferrovial History
2010 2009 2008 2007 2006 2005 2004 IFRS 2004 2003 2002 2001 2000 1999
Closing price 7.44 8.23 19.58 48.12 73.95 58.50 39.32 39.32 27.78 24.15 19.69 13.6 14.4
High 8.95 8.78 57.45 82.95 78.35 71.45 39.8 39.8 28.29 28.95 22 18.35 23.55
Low 4.88 3.82 17.65 47.90 51.20 39.07 27.6 27.6 21.91 19.7 13.53 11.75 14.2
Weighted average
7.02 37.41 68.35 64.00 52.15 34.02 34.02 24.62 24.7 18.58 14.23 20.17
Effective volume traded cash in the year (millions of euros)
8,582.7 5,331.8 11,245.8 16,695.9 12,177.1 7,038.6 4,307.48 4,307.48 3,007.60 2,539.49 1,587.50 1,144.80 1,143.90
No. Shares traded (year)
1,251,990,216 841,837,841 290,632,495 248,787,946 190,274,573 134,968,415 126,599,317 126,599,317 122,158,971 102,641,026 85,425,146 80,475,919 56,710,300
Daily average volume (millions of euros)
33.5 21.0 44.3 66.0 47.9 27.5 17.2 17.2 12 10.2 6.3 4.6 6.8
Capital turnover 171% 147% 207% 177% 136% 96% 90% 90% 87% 73% 61% 57% 40%
Capitalisation (millions of euros)
5,454 6,033 2,746 6,750 10,373 8,205 5,515 5,515 3,897 3,387 2,762 1,908 2,047
No. Shares. comprising share capital
733,510,255 733,510,255 140,264,743 140,264,743 140,264,743 140,264,743 140,264,743 140,264,743 140,264,743 140,264,743 140,264,743 140,264,743 142,132,147
Par value 0.20 euros 0.20 euros 1 euro 1 euro 1 euro 1 euro 1 euro 1 euro 1 euro 1 euro 1 euro 1 euro 1 euro
Gross dividend per share*
0.42 0.40 2.00 1.15 1.00 0.90 0.82 0.82 0.60 0.67 0.41 0.28 0.20
Stock market ratios
Earnings per share (EPS)*
5.23 -0.16 -6.04 5.23 10.16 2.96 3.78 3.97 2.43 3.25 1.56 1.14 0.78
Book value per share
9.04 6.21 26.32 48.82 47.50 21.57 17.95 16.06 12.5 10.66 8.54 7.48 6.53
Price/ book value per share
0.82 1.32 0.74 0.99 1.56 2.71 2.19 2.45 2.22 2.27 2.31 1.82 2.21
PER (share price/EPS)
1.42 9.20 7.28 19.73 10.40 9.90 11.44 7.43 12.62 11.93 18.41
Total shareholder return (%)
-8.20% 76.30% -55.15% -33.37% 28.12% 51.07% 44.50% 44.50% 17.50% 26.10% 47.80% -3.60% -36.40%
Up to 2008 dividends cannot be compared with those paid in 2009 and 2010, upon the merger with Cintra.

ferrovial Annual Report 2010 113
The detail of treasury sales at 31 December is as follows:
Indexes on which Ferrovial is listed (Source: Bloomberg):
IBEX 35 INDEX
SPAIN MA MADRID INDEX
SPAIN MA BSC MAT IND IX
BLOOMBERG EUROPEAN 500
BE500 CONST & ENGIN INDX
ESTX € Pr
ESTX Cn&Mt € Pr
STXE 600 € Pr
STXE 600 Cn&Mt € Pr
BBG EUROPE 500 SECTORS
BBG EUROPE INDUSTRIALS
S&P EURO PLUS INDEX
S&P EURO INDEX
S&P EURO INDUSTRIALS IDX
FTSEUROFIRST 300 SCTR
STXE Mid 200 € Pr
ESTX Mid € Pr
BBG WORLD INDEX
BBG WORLD ENGIN & CON IX
BBG EMEA WORLD INDEX
BBG EMEA ENGIN & CONSTRU
S&P EUR 350 CAP GOODS IX
S&P EUROPE 350 INDEX
S&P EU 350 INDUST INDEX
BBG WORLD LEVEL1 INDEX
BBG WRLD INDUSTRIAL IX
BBG EMEA WORLD LVL 1 IX
BBG EMEA INDUSTRIAL IX
S&P GLOBAL 1200 INDEX
GLOBAL 1200 INDUSTRL INX
FTSEUROFIRST 300 SECTOR
WT INTL MIDCAP DVD IOPV
WT Global Equity IOPV
WT DEFA FUND IOPV
S&P Developed Ex-US BMI
S&P Dev ex US SC
BBG NAKED SHRT-WORLD
BBG NAKED SHRT-Spain
DJ SPAIN TITANS 30 €
STXE 600 Opt Cns&Mt € Pr
Bloomberg ESG Coverage
Bloomberg ESG Processed
Corporate Responsibility indexes
DJSI – Dow Jones Sustainability World Index
DJSI – Dow Jones Sustainability Stoxx Index
FTSE4Good Europe Index
FTSE4Good Global Index
FTSE 4 Good IBEX - Spain - Sustainability
Ethibel
The historical treasury share data for the Ferrovial Group.
Shareholder structure (*)
(*) Source: CNMV
Treasury shares
2010 2009 2008
No. of shares 0 0 1,527,374
% share capital 0.00% 0.00% 1.09%
Carrying amount 72,735*
Cost per share 47.62
Country% share
capital
Directors
Portman baela, s.L. Spain 44.268
Del pino calvo-sotelo, rafael Spain 1.251
Bergareche busquet, santiago Spain 0.334
Sanchez-junco mans, jose fernando Spain 0.022
Ayuso garcia, joaquin Spain 0.012
Arena de la mora, juan Spain 0.011
Carvajal urquijo, jaime Spain 0.009
Burgio , gabriele Spain 0.005
Del pino calvo-sotelo, maria Spain 0.002
Fernandez valbuena, santiago Spain 0.001
Karlovy, s.L. Spain 0.001
Meiras amusco, iñigo Spain 0.001
Shareholders
Banco Santander Spain 3.868
* (thousands of euros)
management report information on the stock market, treasury stock and main
shareholders
management report information on the stock market, treasury stock and main
shareholders

ferrovial Annual Report 2010 115
analysis of financial
instrument risks
events after the reporting period
management report analysis of fi nancial intstrument risks management report post-year-end events
Note 3 to the consolidated fi nancial statements includes a detailed analy-
sis of the fi nancial instruments arranged by the Company and their perfor-
mance in 2010.
On 21 January 2011, Cintra Infraestructuras, a subsidiary of Ferrovial,
completed the sale of its 50% in Autopista Trados 45, S.A. to Finavías, an
investment vehicle of the infrastructure funds of AXA Private Equity. The
transaction amounted to 68 million euro and gave rise to a net gain of
27 million euro net profi t.
In addition, on 17 February 2011 Ferrovial Servicios, a subsidiary of Fer-
rovial, executed the sale of all the shares representing the share capital
of Swissport International AG, Parent of the Swissport Group, to PAI Part-
ners. The transaction amounted to CHF 900 million (705 million euro)
and the net gain is expected to be 192 million euro.
Also on 17 February 2011, the judgment of the United Kingdom Supreme
Court was made public, whereby BAA was denied the right to appeal
against the judgment handed down by the Court of Appeal, which had
partially upheld the appeal fi led by the Competition Commission with
regard to the obligation to sell certain airports as discussed in Note 23 on
“Contingent Assets and Liabilities”.
The Radial 4 toll road has arranged a syndicated loan of 557 million euro
outstanding at 31 December 2010: consisting of Tranche A, totalling 97
million euro and maturing in 2011; Tranche B, totalling 100 million euro
and maturing in 2011; and EIB Tranche, totalling 360 million euro and
maturing in 2033, although the guarantees expire in 2011. The syndi-
cated loan of this toll road was originally scheduled to mature in January
2011, but was extended for six additional months until July 2011, and is
currently under a long-term refi nancing process

ferrovial Annual Report 2010 117
Ferrovial se consolida como el mayor gestor privado de
infraestructuras de transporte del mundo.
consolidatedfinancial
statements
ferrovial consolidated fi nancial statements
Ph
oto
: Bir
min
gh
am
, Rei
no
Un
ido
.
116 Consolidated balance sheet
119 Consolidated income
statement
121 Consolidated statement of
comprehensive income
122 Consolidated statement of
changes in net equity
124 Consolidated cash fl ow
statement
126 Notes to the consolidated
fi nancial statements
264 Audit report
Consolidated Financial
Statements

ferrovial Annual Report 2010 119
consolidated statements of financial position for 2010, 2009 and 2008
consolidated fi nancial statements consolidated balance sheet
Millions of euros
Assets Note 2010 2009 2008
Non-current assets 35,465 36,048 32,900
Goodwill 5 5,032 6,952 5,400
Intangible assets (1) 6 97 45 63
Concession infrastructure 7 21,512 23,621 21,839
Investment property (1) 64 77 92
Property, plant and equipment (1) 8 552 669 620
Investments in companies accounted for using the equity method 9 3,110 262 286
Non-current fi nancial assets 10 2,184 1,935 1,524
Infrastructure project receivables 1,344 874 827
Available-for-sale fi nancial assets 34 33 4
Restricted cash and other non-current fi nancial assets 551 554 290
Other receivables 255 474 402
Pension surplus 17 0 22 76
Deferred tax assets 22 2,068 1,604 1,859
Derivative fi nancial instruments at fair value 11 847 861 1,139
Assets classifi ed as held for sale 12 1,515 1,802 4,278
Current assets 6,306 6,150 6,626
Inventories 13 445 489 498
Trade and other receivables 14 3,161 3,181 3,626
Trade receivables for sales and services 2,558 2,844 3,226
Other receivables 755 604 617
Current tax assets 58 22 25
Provisions -210 -290 -242
Cash and cash equivalents 19 2,701 2,480 2,502
Infrastructure project companies 694 1,050 892
Restricted cash 44 351 204
Other cash and cash equivalents 649 699 689
Other companies 2,007 1,430 1,610
Total Assets 43,287 43,999 43,804
Equity and Liabilities Note

ferrovial Annual Report 2010 121
Millions of euros
Equity and Liabilities Note
Equity 15 6,628 4,719 4,098
Equity attributable to the equity holders 5,194 3,102 1,801
Equity attributable to non-controlling interests 1,434 1,617 2,296
Deferred income 16 196 232 250
Non-current liabilities 28,596 29,751 29,146
Provisions for pensions 17 153 503 131
Other long-term provisions 18 860 954 708
Bank borrowings 19 21,511 23,368 22,413
Debt securities and borrowings of infrastructure projects 19,566 21,115 19,741
Bank borrowings of other companies 1,944 2,253 2,672
Other payables 20 154 136 118
Deferred tax liabilities 22 3,951 3,454 3,458
Derivative fi nancial instruments at fair value 11 1,968 1,336 2,319
Liabilities classifi ed as held for sale 12 891 1,647 3,163
Current liabilities 6,975 7,650 7,147
Bank borrowings 19 1,530 1,937 1,552
Debt securities and borrowings of infrastructure projects 1,415 1,540 845
Bank borrowings of other companies 116 397 708
Trade and other payables 21 4,889 5,194 5,142
Trade payables 3,906 4,121 4,183
Current tax liabilities 264 216 167
Other non-trade payables 720 858 792
Operating provisions 18 556 519 452
Total Equity and Liabilities 43,287 43,999 43,804
consolidated income statements for 2010
and 2009
consolidated fi nancial statements consolidated income statement
2010 2009
Note
Before fair
value ad-
justments
Fair
value ad-
justments
(*)
Total
2010
Before fair
value ad-
justments
Fair
value ad-
justments
(*)
Total
2009
Revenue 12,169 0 12,169 12,232 0 12,232
Other operating income 17 0 17 30 0 30
Total operating income 26 12,186 0 12,186 12,262 0 12,262
Materials consumed 1,486 0 1,486 1,487 0 1,487
Other external expenses 1,596 0 1,596 1,645 0 1,645
Staff costs 27 3,422 0 3,422 3,423 0 3,423
Change in operating provisions 174 1 175 172 1 174
Other operating expenses 2,992 0 2,992 2,939 2 2,941
Total operating expenses 9,671 1 9,672 9,667 3 9,670
GROSS PROFIT FROM OPERATIONS 2,516 -1 2,514 2,595 -3 2,591
Depreciation and amortisation charge 1,000 0 1,000 1,005 0 1,005
Profi t from operations before impairment and non-
current asset disposals1,516 -1 1,514 1,590 -3 1,587
Impairment and disposals of non-current assets 25 740 1,139 1,879 -620 -90 -710
Profi t from operations 2,256 1,138 3,393 969 -93 876
Finance income of infrastructure projects 19 0 19 45 0 45
Finance costs of infrastructure projects -1,543 0 -1,543 -1,446 0 -1,446
Gains and losses on derivative fi nancial instruments and
other fair value adjustments0 -48 -48 0 -148 -148
Financial loss of infrastructure projects -1,524 -48 -1,572 -1,402 -148 -1,550
Finance income of other companies 153 0 153 122 0 122
Finance costs of other companies -275 0 -275 -226 0 -226
Gains and losses on derivative fi nancial instruments and
other fair value adjustments0 -31 -31 0 98 98
Financial loss of other companies -122 -31 -153 -103 98 -5
Financial loss 28 -1,646 -79 -1,725 -1,505 -50 -1,555
(*)The intangible assets, property, plant and equipment and investment property used in infrastructure projects are included under
“Concession Infrastructure”.
The accompanying Notes 1 to 39 are an integral part of the consolidated fi nancial statements at 31 December 2010.
consolidated fi nancial statements consolidated balance sheet

ferrovial Annual Report 2010 123
consolidated statements of comprehensive income
for 2010 and 2009
consolidated fi nancial statements consolidated statement of comprehensive income
Share of profi ts of companies accounted for using the
equity method53 8 62 69 16 85
Consolidated profi t or loss before tax 663 1,067 1,730 -467 -127 -594
Income tax 22 -44 129 85 84 41 125
Consolidated profi t or loss from continuing operations 619 1,196 1,815 -383 -86 -469
Net profi t or loss from discontinued operations 29 0 0 0 0 0 0
Consolidated profi t or loss for the year 619 1,196 1,815 -383 -86 -469
Loss for the year attributable to non-controlling
interests38 310 348 334 61 395
Profi t or loss for the year attributable to the Parent 657 1,506 2,163 -48 -25 -74
Net earnings per share attributable to the Parent 30
Basic 3.67 -0.12
Diluted 3.67 -0.12
2010 2009
Note
Before fair
value ad-
justments
Fair
value ad-
justments
(*)
Total
2010
Before fair
value ad-
justments
Fair
value ad-
justments
(*)
Total
2009
Millons of euros
Notew 2010 2009
Attributable to the Parent 15 2,163 -74
Attributable to non-controlling interests 15 -348 -395
Consolidated comprehensive income for the year 1,815 -469
Income and expense recognised directly in equity before tax: 234 350
Hedges -218 690
Other companies -199 698
Held for sale 4 -67
Companies accounted for using the equity method -23 59
Defi ned benefi t plans 63 -544
Translation diff erences 389 204
Taxes 17 -348
Attributable to the Parent 240 135
Attributable to non-controlling interests 11 -132
Income and expense recognised directly in equity 250 2
Attributable to the Parent 2,403 61
Attributable to non-controlling interests -338 -528
Total income and expense recognised in the year 2,066 -466
(*) Relating to gains and losses arising from changes in the fair value of derivatives, other fi nancial assets and liabilities, and asset and
liability impairment (see Note 24).
The accompanying Notes 1 to 39 are an integral part of the consolidated fi nancial statements at 31 December 2010.
consolidated fi nancial statements consolidated income statement

ferrovial Annual Report 2010 125
consolidated statements of changes in equity for
2010 and 2009
consolidated fi nancial statements consolidated statement of changes in net equity consolidated fi nancial statements consolidated statement of changes in net equity
2009
(millions of euros)Share
capital
Share
premium
Treasury
shares
Other
reserves
Accumula-
ted profi t/
loss
Attribu-
table to
equity
holders
Attributable
to non-
controlling
interests
Total
equity
Balance at 01/01/09 140 193 -72 -1,190 2,684 1,756 2,206 3,962
Changes in accounting policies 47 47 90 137
Restated balance at 01/01/09 140 193 -72 -1,190 2,731 1,803 2,296 4,099
Consolidated profi t or loss for the year -74 -74 -395 -469
Income and expense recognised in
equity135 135 -132 2
Income and expense recognised in
the year135 -74 61 -528 -466
Dividends paid -281 -281 -103 -384
Capital increases/reductions 166 166
Impact of merger 7 2,829 72 -1,464 1,443 -160 1,283
Transactions with owners 7 2,829 72 -1,746 1,162 -96 1,065
Changes in the scope of consolida-
tion and other changes0 23 53 76 -55 21
Balance at 31.12.09 147 3,022 -1,032 965 3,102 1,618 4,719
2010
(millions of euros)Share
capital
Share
premium
Treasury
shares
Other
reserves
Accumula-
ted profi t/
loss
Attribu-
table to
equity
holders
Attributable
to non-
controlling
interests
Total
equity
Balance at 01/01/10 147 3,022 -1,028 845 2,986 1,570 4,556
Changes in accounting policies -4 119 116 48 164
Restated balance at 01/01/10 147 3,022 -1,032 965 3,102 1,617 4,719
Consolidated profi t or loss for the year 2,163 2,163 -348 1,815
Income and expense recognised in
equity240 240 11 250
Income and expense recognised in
the year240 2,163 2,403 -338 2,066
Dividends paid -308 -308 -76 -385
Capital increases/reductions 130 130
Transactions with owners -308 -308 53 -255
Changes in the scope of consolida-
tion and other changes113 -115 -2 101 99
Balance at 31/12/10 147 3,022 -679 2,705 5,195 1,434 6,629
* The accompanying Notes 1 to 39 are an integral part of the consolidated fi nancial statements at 31 December 2010.

ferrovial Annual Report 2010 127
consolidated cash flow statements for
2010 and 2009
consolidated fi nancial statements consolidated cash fl ow statement consolidated fi nancial statements consolidated cash fl ow statement
Note 2010 2009
Profi t or loss for the year attributable to the Parent 2,163 -74
Adjustments for: 495 2,790
Non-controlling interests -348 -395
Depreciation and amortisation charge and provisions 1,175 1,179
Results of companies accounted for using the equity method -62 -85
Results on fi nancing 1,711 1,536
Tax -85 -125
Work on non-current assets -17 -30
Fair value adjustment less costs to sell -1,879 710
Other losses and gains
Income taxes paid -81 -49
Change in receivables, payables and other -116 -145
Dividends from infrastructure project companies received 44 10
Cash fl ows from operating activities 31 2,505 2,534
Investments in property, plant and equipment and intangible assets -127 -205
Investments in infrastructure projects -1,972 -1,626
Investments in non-current fi nancial assets -69 -6
Divestment of infrastructure projects 148 1,561
Divestment of non-current fi nancial assets 1,124 473
Cash fl ows from investing activities 31 -895 197
Note 2010 2009
Cash fl ows before fi nancing activities 1,609 2,730
Proceeds from capital and non-controlling interests 134 178
Payment of dividends to shareholders of the Parent -315 -284
Payment of dividends to non-controlling interests of investees -82 -105
Other changes in shareholders’ equity 0
Cash fl ows from shareholders and non-controlling interests -263 -211
Interest paid -1,344 -1,398
Interest received 45 55
Increase in bank borrowings 4,435 5,426
Decrease in bank borrowings -4,100 -6,720
Change in borrowings held for sale 189 -16
Cash fl ows from fi nancing activities 31 -1,038 -2,864
Change in cash and cash equivalents 19 571 -133
Cash and cash equivalents at beginning of year 2,480 2,502
Cash and cash equivalents at end of year 2,699 2,480
Eff ect of foreign exchange rate changes on cash and cash equivalents -170 -112
Change in cash and cash equivalents held for sale 522 1
(*)The changes in restricted cash at long term, which in prior years was included as a cash fl ow from
investments in non-current assets, was netted of from “Increase in bank borrowings”, as it is cash that is
restricted to secure a debt, and not an investing activity in the true sense.
(*)The accompanying Notes 1 to 39 are an integral part of the consolidated fi nancial statements at 31
December 2010.

ferrovial Annual Report 2010 129
notes to the consolidated financial statements for 2010
consolidated fi nancial statements notes to the consolidated fi nancial statements consolidated fi nancial statements notes to the consolidated fi nancial statements
1. Company activities and scope of consolidation
1.1 Company activities
The consolidated Ferrovial Group (“Ferrovial”) comprises the Parent Fer-
rovial, S.A. and its subsidiaries, which are detailed in Appendix I. Its regis-
tered offi ce is at calle Príncipe de Vergara 135, Madrid.
Through these companies, Ferrovial engages in the following lines of
business, which are its primary reporting segments pursuant to IAS 14.
A. Construction and execution of all types of public and private works in
Spain and abroad, operating basically through Ferrovial Agromán, S.A.,
the company that heads this business division. Notable are the interna-
tional business carried on in Poland through Budimex, S.A. and its in-
vestees, the leading construction group in that market, which is listed on
the Warsaw stock market and in which the Group holds a 59.06% own-
ership interest and the business carried on in the United States (Texas)
through the Webber Group, which is wholly owned by Ferrovial.
B. Toll roads. This activity consists of the development, fi nancing, con-
struction and operation of toll road projects through Cintra Infraestruc-
turas, S.A., in which Ferrovial, S.A. holds a 100% ownership interest.
C. Airports. This activity consists of the development, fi nancing and
operation of airports, basically through BAA plc, a UK company that
operates −through its investees− six airports in the United Kingdom and
other airport assets; Ferrovial, S.A. has an ownership interest of 55.87%
in BAA plc.
D. Services. This division is headed by Ferrovial Servicios, S.A. and is
divided into the following activities: a) Upkeep and maintenance of in-
frastructure, buildings and facilities (through Amey, Plc in the UK and
Ferroser Infraestructuras, S.A. and Ferrovial Servicios, S.A. in Spain); b)
Urban services and waste treatment (basically through Cespa, S.A.).
In addition to the description of Ferrovial’s activities and for the purposes
of understanding these fi nancial statements, it should be noted that a
signifi cant part of the business carried on by the Toll roads, Airports and
Services Divisions consists of the development of infrastructure projects.
These projects are conducted mainly in the Toll roads and Services ar-
eas under long-term contracts where the concession holder, in which the
Group generally has interest together with other partners, fi nances the
construction or upgrade of public infrastructure and which fall within
the scope of application of IFRIC 12 “Service Concession Arrangements”.
Unlike the above, in most cases involving airports, licenses are of an in-
defi nite nature which is why, although IFRIC 12 is not applicable, the ar-
rangements are very similar to concession arrangements.
Accordingly, and in order to aid understanding of the Group’s fi nancial
performance, these fi nancial statements present separately the impact
of projects of this nature on both non-fi nancial non-current assets (
“Concession Infrastructure” includes the property, plant and equipment,
intangible assets and investment property assigned to these projects)
and non-current fi nancial assets, borrowings and cash fl ows.
1.2 Other changes in the scope of consolidation
The main changes in the scope of consolidation in 2010 were as follows:
Toll road business: on 5 October Cintra Infraestructuras reached an
agreement to sell 10% of its interest in the share capital of the toll road
concession holder 407 ETR in Toronto, Canada, for CAD 894 million (ap-
proximately EUR 640 million). The retained ownership interest, 43.23%
of that company’s share capital, is initially measured at fair value as
stipulated in IAS 27 in relation to the loss of control of a subsidiary and
was subsequently accounted for using the equity method.
Additionally, on 15 September 2010 Cintra Infraestructuras completed
the sale of 60% of its equity interest in Cintra Chile, a company that op-
erates fi ve stretches of Chilean toll roads, for EUR 229 million. The own-
ership interest retained, 40% of the shares of Cintra Chile, is accounted
for using the equity method and is initially measured at fair value as set
forth in IAS 27 in relation to the loss of control of a subsidiary. Further-
more, the buyer and seller established cross call and put option on that
percentage of ownership retained.
Services business: on 28 June Amey plc, a Ferrovial subsidiary, complet-
ed the sale of its 66.6% holding in Tube Lines Limited, the concession
holder in the concession for the maintenance and renovation of certain
London underground lines. The transaction price was GBP 207 million.
Amey continues to provide support services for the management of the
maintenance of the above-mentioned lines to Tube Lines Limited, under
terms that are very similar those existing previously.
In order to operate in the United Kingdom, Ferrovial Servicios, through
the joint venture formed by its subsidiaries Cespa and Amey −namely
AmeyCespa− completed the purchase of Dickerson Group and its invest-
ee Donarbon, specialising in waste treatment and management. The
transaction totalled GBP 49 million (EUR 59 million).
Airports business: during the year, BAA sold certain non-strategic as-
sets, specifi cally, its interest in Naples airport, the retail business in the
United States and the 50% ownership interest in APP, which manages
various investment properties in the United Kingdom. Ferrovial has also
initiated the process to sell 10% of its ownership interest in its subsidiary,
BAA. This process is at the initial stage, and at the date of preparation
of these fi nancial statements there was no signifi cant information in this
connection.
2. Summary of the main accounting policies
2.1 Basis of presentation
The accompanying fi nancial statements were obtained from the Com-
pany’s accounting records and are presented in compliance with the
regulatory fi nancial reporting framework applicable to the Company
and, accordingly, present fairly the Company’s equity, fi nancial position
and results of operations. The regulatory framework is that provided
for in International Financial Reporting Standards (IFRSs) approved by
Regulation (EC) no. 1606/2002 of the European Parliament and of the
Council of 19 July 2002.
2.1.A Restatement and changes in accounting policies
Ferrovial has started to apply IFRIC 12 “Service Concession Arrange-
ments”, which came into force in 2009 and which is mandatory for years
beginning on or after 1 January 2010.
Under IFRIC 12, concessions may be accounted for using either the in-
tangible asset model or the fi nancial asset model (or a combination of
the two). In Ferrovial’s case, the majority of the concessions relate to in-
tangible assets. The impact of the transition to IFRIC 12 for these assets
is not signifi cant.
The most signifi cant fi nancial assets concession is the Autopista Terrasa
Manresa toll road, as the rest of the main projects to which that model
applied (in the UK) had already been applying it previously.
Given the application of IFRIC 12 and in compliance with IAS 1, fi nancial
information restated at the beginning of the comparative period is pre-
sented, in addition to the statement of fi nancial position at the end of the
current year and at the end comparative period (i.e. three statements of
fi nancial position are presented).
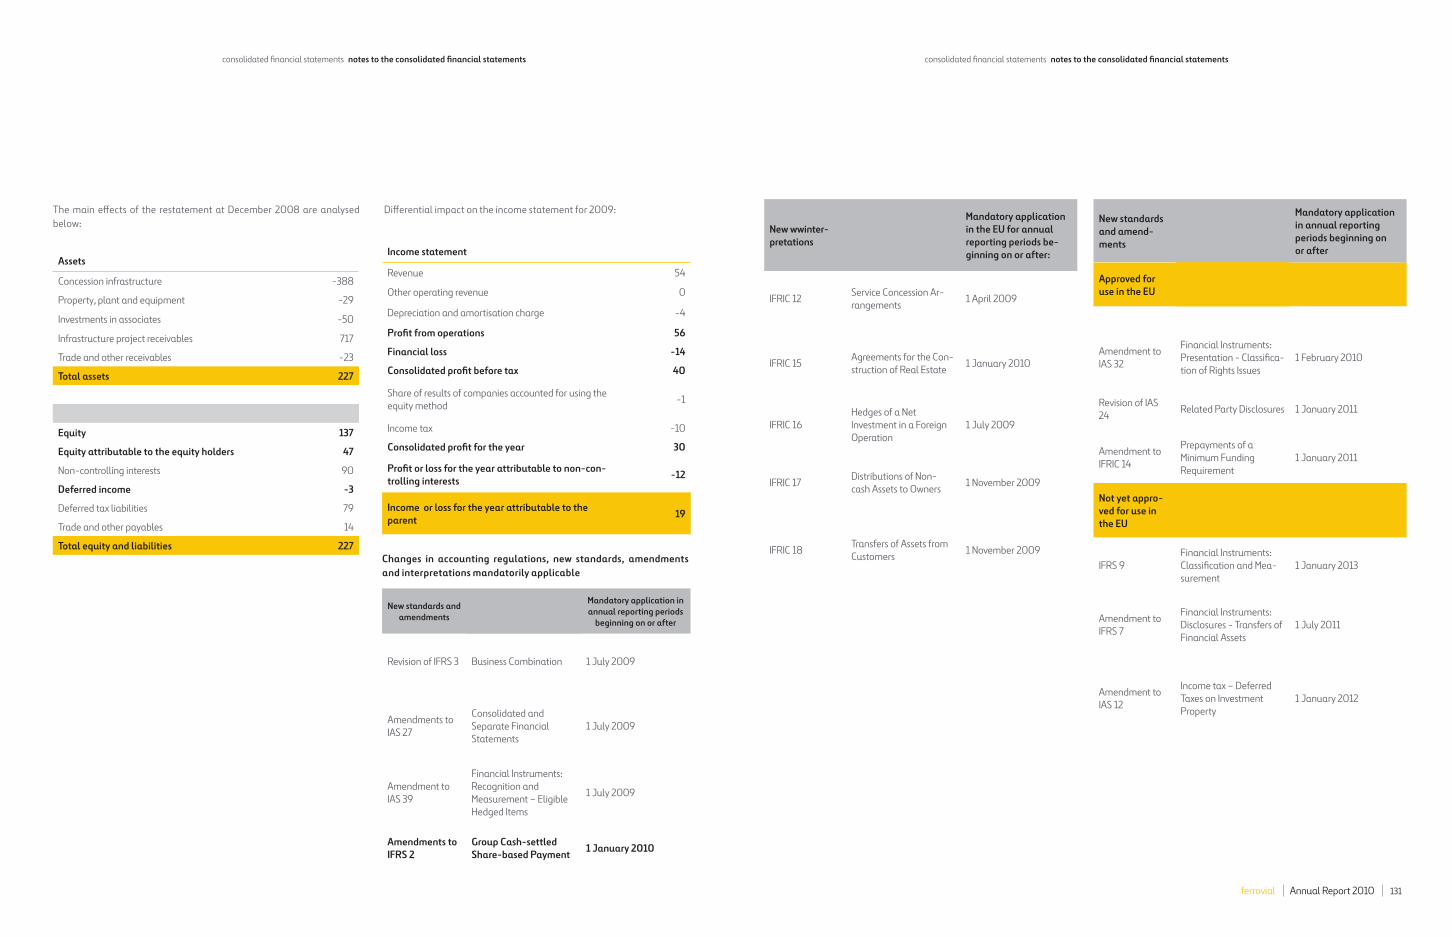
ferrovial Annual Report 2010 131
New wwinter-
pretations
Mandatory application
in the EU for annual
reporting periods be-
ginning on or after:
IFRIC 12Service Concession Ar-
rangements1 April 2009
IFRIC 15Agreements for the Con-
struction of Real Estate1 January 2010
IFRIC 16
Hedges of a Net
Investment in a Foreign
Operation
1 July 2009
IFRIC 17Distributions of Non-
cash Assets to Owners1 November 2009
IFRIC 18Transfers of Assets from
Customers1 November 2009
New standards
and amend-
ments
Mandatory application
in annual reporting
periods beginning on
or after
Approved for
use in the EU
Amendment to
IAS 32
Financial Instruments:
Presentation - Classifi ca-
tion of Rights Issues
1 February 2010
Revision of IAS
24Related Party Disclosures 1 January 2011
Amendment to
IFRIC 14
Prepayments of a
Minimum Funding
Requirement
1 January 2011
Not yet appro-
ved for use in
the EU
IFRS 9
Financial Instruments:
Classifi cation and Mea-
surement
1 January 2013
Amendment to
IFRS 7
Financial Instruments:
Disclosures - Transfers of
Financial Assets
1 July 2011
Amendment to
IAS 12
Income tax – Deferred
Taxes on Investment
Property
1 January 2012
The main eff ects of the restatement at December 2008 are analysed
below:
Diff erential impact on the income statement for 2009:
Changes in accounting regulations, new standards, amendments
and interpretations mandatorily applicable
Assets
Concession infrastructure -388
Property, plant and equipment -29
Investments in associates -50
Infrastructure project receivables 717
Trade and other receivables -23
Total assets 227
Equity 137
Equity attributable to the equity holders 47
Non-controlling interests 90
Deferred income -3
Deferred tax liabilities 79
Trade and other payables 14
Total equity and liabilities 227
Income statement
Revenue 54
Other operating revenue 0
Depreciation and amortisation charge -4
Profi t from operations 56
Financial loss -14
Consolidated profi t before tax 40
Share of results of companies accounted for using the
equity method-1
Income tax -10
Consolidated profi t for the year 30
Profi t or loss for the year attributable to non-con-
trolling interests-12
Income or loss for the year attributable to the
parent 19
New standards and
amendments
Mandatory application in
annual reporting periods
beginning on or after
Revision of IFRS 3 Business Combination 1 July 2009
Amendments to
IAS 27
Consolidated and
Separate Financial
Statements
1 July 2009
Amendment to
IAS 39
Financial Instruments:
Recognition and
Measurement – Eligible
Hedged Items
1 July 2009
Amendments to
IFRS 2
Group Cash-settled
Share-based Payment1 January 2010
consolidated fi nancial statements notes to the consolidated fi nancial statements consolidated fi nancial statements notes to the consolidated fi nancial statements

ferrovial Annual Report 2010 133
the conclusion may be reached that at Group level the work is performed
for third parties.
E. Translation of fi nancial statements in currencies other than the euro:
the fi nancial statements of consolidated subsidiaries and joint ventures
whose accounting records are denominated in a currency other than the
euro are translated to euros by applying the year-end exchange rates to
all assets and liabilities, except for equity and investments in Group com-
panies, which are translated at the exchange rates prevailing when they
joined the Group. Income and expenses are translated at the average
exchange rates for the year. Diff erences arising during the aforemen-
tioned translation process are recognised in equity under “Translation
Diff erences”.
Appendix I contains a list of subsidiaries, associates and joint ventures.
2.3 Accounting policies applied to each item in the consolidated
statement of fi nancial position and consolidated income statement
2.3.1 Intangible assets
“Intangible assets” in the accompanying consolidated statement of fi -
nancial position are initially carried at acquisition price or production
cost, including capitalisable borrowing costs, and are subsequently mea-
sured at cost less accumulated amortisation and any impairment losses.
Intangible assets with a fi nite useful life are amortised on a straight-line
basis, or based on estimated traffi c in the case of administrative conces-
sions, during the concession term, and over their useful lives (between 5
and 50 years) in all other cases.
Intangible assets with an indefi nite useful life are not amortised and are
tested annually for impairment.
2.3.2 Concession infrastructure
This caption includes the investments made by infrastructure conces-
sion operators in the scope of IFRIC 12 (mainly toll roads), as well as those
which, while not subject to the aforementioned standard as the licences
are indefi nite, have characteristics that are very similar to a concession
arrangement (mainly airports), as indicated in Note 1.1 above.
It also includes intangible assets and investment property used in proj-
ects of this nature.
The assets acquired by the concession operator to provide the conces-
sion services but which do not form part of the infrastructure (vehicles,
furniture, computer hardware, etc.) are not included under this caption.
Assets of this nature are classifi ed on the basis of their nature and are
depreciated over their useful life, using a method that refl ects their eco-
nomic use.
Amortisation and depreciation methods:
IFRIC 12 – Intangible asset model
All initial investments relating to the infrastructure that is subsequently
returned to the government, including compulsory purchase costs and
borrowing costs capitalised during construction are amortised on the
basis of the pattern of consumption applicable in each case (e.g., fore-
cast traffi c in the case of toll roads) throughout the term of the conces-
sion.
The investments contractually agreed on the star of the concession on
a fi nal and irrevocable basis for being made at a later date during the
term of the concession, and provided they are not investments made to
upgrade infrastructure, are considered to be the initial investment. For
this type of investment, an asset and an initial provision are recognised
for the present value of the future investment, applying a discount rate
to calculate the foregoing present value that is equal to the cost of the
debt related to the project. The asset is amortised based on the pattern
of consumption during the whole term of the concession and the provi-
sion is increased by the related interest cost during the period until the
investment is made.
Where a payment is made to the government to obtain the right to oper-
ate the concession, this amount is also amortised based on the pattern of
consumption over the concession term.
A provision is recognised for replacement investments, which must have
been set up in full by the time the investment becomes operational. The
provision is recognised on the basis of the pattern of consumption over
the period in which the obligation accrues, on a time proportion basis.
Infrastructure upgrade investments which are recovered over the con-
cession term are amortised as from the date on which they come into
service based on the diff erence in the pattern of consumption arising
from the increase in capacity. However, if these investments will not be
off set by the possibility of obtaining increased revenue from the date on
which they are made, a provision will be recognised for the best estimate
of the present value of the cash outfl ow required to settle the obligations
related to the investment that will not be off set. The balancing item is a
higher acquisition cost of the intangible asset.
Set out below is a brief reference to the contents of the standards and
interpretations that have had an impact on the preparation of these fi -
nancial statements:
• IFRS 3 (Revision) “Business Combinations”: it substantially changes
the accounting for business combinations; it changes the scope, the
calculation of goodwill and the treatment of contingent consideration
and introduces the option of measuring non-controlling interests at fair
value.
• NIC 27 (Amendments) “Consolidated and Separate Financial State-
ments”: it substantially modifi es the recognition of changes in interests
in group companies and also in non-controlling interests with a defi cit
balance.
• IFRS 2 (Amendments) “Share-based Payment”: it provides clarifi ca-
tion on how to treat group cash-settled share-based payments.
• IFRIC 12 “Service Concession Arrangements”: IFRIC 12 identifi es two
types of service concession arrangements: a) those in which the operator
has an unconditional contractual right to receive cash or another fi nan-
cial asset from the grantor. In this case, where the operator does not bear
the demand risk, a fi nancial asset will be recognised for the total amount
receivable from the grantor; and b) those in which the operator obtains
a right to charge users of the public service it provides. In this case, the
operator bears the demand risk and recognises an intangible asset for
the amount of the investment in the infrastructure it uses to provide the
service.
New standards, amendments and interpretations mandatory applicable
for years subsequent to 2010:
Set out below is a brief reference to the contents of the standard that may
have an impact on the preparation of the Group’s fi nancial statements:
• IAS 24 (Revision) “Related Party Disclosures”: It amends the defi nition
of “related party” and provides a partial exemption from the disclosure
requirements for entities that are related parties only because they are
under the control, joint control or signifi cant infl uence of the same gov-
ernment.
2.2 Basis of consolidation
In 2010 and 2009 all the separate fi nancial statements of all the com-
panies included in the scope of consolidation either referred to the same
reporting date or were temporarily brought into line with those of the
Parent. Moreover, in order to present uniformly the items included in
these consolidated fi nancial statements, uniformity adjustments were
made on the basis of the Parent’s accounting policies. The consolidated
fi nancial statements were prepared using the following methods:
A. Full consolidation method: all the subsidiaries are fully consolidated.
Subsidiaries are companies over whose management Ferrovial, S.A. ex-
ercises eff ective control because it holds more than 50% of the voting
power, directly or indirectly through agreements with other sharehold-
ers. When assessing whether Ferrovial controls a company, the existence
and eff ects of potential voting rights which may be currently exercised or
converted are taken into account. A subsidiary is included in the scope of
consolidation when the Group formally obtains eff ective control.
B. Equity method: the equity method is used to account for all the com-
panies over which Ferrovial S.A. has a signifi cant infl uence. Also ac-
counted for using this method, pursuant to the alternative provided for
in IAS 31, are the other companies over which Ferrovial, S.A. exercises
joint control. In the latter case, the Company considers that the equity
method is the method that best ensures fair presentation, since in these
cases of joint control, the Company does not control the assets or have
any present obligation with respect to the liabilities of the investee, but
rather only eff ectively controls the ownership interest in the entity. The
new standard that will shortly be published by the IASB will be along
these same lines.
C. Proportionate consolidation method: The projects that are under-
taken through unincorporated temporary joint ventures (UTEs) or similar
entities are proportionately consolidated. Unlike the previous case, it is
considered that in these cases of joint control, the venturers have a di-
rect involvement in the assets, liabilities, income, expenses and joint and
several liability in these entities. This type of business contributed to the
consolidated Group assets, profi ts and sales of EUR 917 million; EUR 60
million and EUR 1,280 million in 2010 (2009: EUR 903 million; EUR 90
million and EUR 1,273 million).
D. Balances and transactions with Group companies: balances and
transactions between Group companies are eliminated on consolida-
tion. Nonetheless, the transactions registered in the income statement
relating to construction projects performed by the Construction division
for infrastructure project concession holders are not eliminated on con-
solidation, since contracts of this kind are treated as construction con-
tracts under which the Group performs work for the concession grantor
or regulator in exchange for the right to operate the infrastructure under
the terms pre-established by the grantor or regulator. The grantor or
regulator thus has control over the asset from inception and grants the
above-mentioned right in exchange for the work performed, such that
consolidated fi nancial statements notes to the consolidated fi nancial statements consolidated fi nancial statements notes to the consolidated fi nancial statements

ferrovial Annual Report 2010 135
2.3.3 Property, plant and equipment
The assets included in “Plant, Property and Equipment” in the accompa-
nying consolidated statement of fi nancial position are carried at acquisi-
tion or production cost, less the related accumulated depreciation and
any accumulated impairment losses.
In-house work on property, plant and equipment is valued, for each in-
vestment, by adding the direct or indirect costs allocable to the invest-
ment to the cost of the materials used.
Borrowing costs incurred during the construction or production period,
before the assets are ready to come into operation, are capitalised,
whether they derive from borrowings arranged specifi cally to acquire the
assets or from general-purpose fi nancing sources subject to the provi-
sions for qualifying assets contained in IAS 23.
The Group companies calculate the impairment losses on property,
plant and equipment using the method that best approximates the ef-
fective technical decline in value and the estimated years of useful life
of each asset. The straight-line method is generally employed, with the
exception of certain construction business machinery that is depreciated
using the declining balance method. The useful lives and residual values
of these assets are reviewed annually. The consolidated companies de-
preciate their property, plant and equipment basically over the following
years of useful life:
AirportRegulated/ Non-regu-
latedLicence duration
Heathrow Regulated Indefi nite
Stansted Regulated Indefi nite
Edinburgh Non-regulated Indefi nite
Glasgow Non-regulated Indefi nite
Aberdeen Non-regulated Indefi nite
Southampton Non-regulated Indefi nite
Antofagasta Non-regulated 2000-2011
Aiports
2.3.4 Investment property
“Investment Property” includes the net values of land, buildings and
other structures that fulfi l the requirements of IAS 40. Investment prop-
erty is carried at acquisition cost less accumulated depreciation and any
impairment losses. The Group does not apply the fair value model per-
mitted by IAS 40. The Group companies depreciate investment property
on a straight-line basis over the estimated useful life of the property (be-
tween 5 and 50 years).
The subgroup that owns the most investment properties is BAA. As all
this subgroup’s non-current assets are recognised in “Concession Infra-
structure”, the relevant Note contains a breakdown of the assets classi-
fi ed as investment property.
2.3.5 Impairment losse
The Group tests goodwill and intangible assets with indefi nite useful lives
and intangible assets not yet available for use for impairment annually.
At each reporting date the Group tests assets for permanent impairment
that might make it necessary to write-down the assets. Should evidence
of impairment be detected, the asset’s recoverable amount is calculated
in order to identify the scope of the impairment loss if the recoverable
amount is lower than the asset’s carrying amount, and the diff erence is
recognised in profi t or loss. Impairment losses must be assessed for each
individual asset. If this is not possible, the impairment loss is determined
for the smallest identifi able group of assets that generates cash infl ows
that are largely independent of the cash infl ows from other assets (cash-
generating units).
Years of estimated
useful life
Buildings and other structures 10-50
Machinery, fi xtures and tools 2-25
Furniture 2-15
Transport equipment 3-20
Other items of property, plant and equip-
ment2-20
Other concession infrastructure
Assets used in infrastructure projects under indefi nite licences (relating
basically to airports) are depreciated on a straight-line basis over the
useful lives of the related assets, as follows:
As indicated previously, this caption also includes intangible assets used
in infrastructure projects as a result of the business combination arising
from the acquisition of the BAA Group, described in Note 5, specifi cally:
• The BAA Group’s right to operate in non-regulated airports (this
right is not amortised due to the aforementioned unlimited duration of
these licenses).
• Rights to operate commercial spaces (average useful life of seven
years).
Internally generated intangible assets, relating mainly to BAA, consist-
ing of computer software developed in-house and websites, are amor-
tised on a straight-line basis over useful lives of between three and seven
years.
Set out below are details of the main toll road concessions in force, show-
ing their duration, together with a list of regulated and non-regulated
airports:
Toll road concessions:
Years of estimated
useful life
Terminal assets
Terminal buildings 20-60
Terminal plant 5-20
Tunnels, bridges and underground railway 50-100
Runways
Structures 100
Surfacing 10-15
Other related assets 50
Conveyor belts and moving staircases
Transit systems 20-50
Other related assets 8-100
Equipment and machinery 3-10
Other leased land and buildings Lease termConcession Operator Country
Conces-
sion term
First year of
concession
Skyway Concession Co. USA 99 2005
SH 130 Concession Co. USA 50 (1) 2008
North Tarrant Express USA 52 (2) 2010
LBJ Express USA 52 (2) 2010
Spanish toll roads Spain 30-65(3) 1986-2005
Portuguese toll roads Portugal 30 2000-2006
407 ETR Internacional Inc. Canada 99 1999
Indiana Toll Roads USA 75 2006-2081
Other toll roadsIreland/
Greece30-45 2003-2008
(1) Concession term of 50 years as from completion of the construction work, estimated at fi ve years.
(2) Concession term of the shorter of 50 years of operation and 52 years as from the contract execution
date.
(3) The main Spanish toll road concessions are Autopista del Sol, Autopista Terrasa-Manresa, Autopista
Madrid Sur and Autopista Madrid-Levante.
consolidated fi nancial statements notes to the consolidated fi nancial statements consolidated fi nancial statements notes to the consolidated fi nancial statements

ferrovial Annual Report 2010 137
Other receivables
Held-to-maturity investments, loans granted and receivables are ini-
tially recognised at fair value and are subsequently measured at am-
ortised cost, and any accrued interest is recognised on the basis of the
eff ective interest rate. The eff ective interest rate is the discount rate that
exactly matches the carrying amount of a fi nancial instrument to all its
estimated cash fl ows of all kinds through its residual life. If at year-end
there is objective evidence that not all amounts receivable will be col-
lected, the necessary impairment losses are recognised. The amount of
the impairment loss is the diff erence between the carrying amount of the
asset and the present value of the estimated future cash fl ows, discount-
ed at the eff ective interest rate.
Financial assets are derecognised when the risks and rewards of own-
ership of the fi nancial asset are substantially transferred. In the specifi c
case of receivables, this is deemed to occur when the default and delin-
quency risks have been transferred.
2.3.8 Derivative fi nancial instruments
Derivative fi nancial instruments are initially recognised at fair value on
the date they are arranged. Subsequent changes in fair value are also
recognised at each reporting date. The method used to recognise gains
or losses on derivatives depends on whether the instrument has been
designated as a hedging instrument and, as the case may be, on the type
of hedge involved. The Group uses the following types of hedge:
i. Cash fl ow hedge: a cash fl ow hedge hedges exposure to highly prob-
able future transactions and changes in cash fl ows. The gain or loss on
the ineff ective portion of the hedging instrument is taken to the consoli-
dated income statement and the gain or loss on the eff ective portion is
recognised directly in equity in the consolidated statement of fi nancial
position. The amount deferred in equity is not recognised in the income
statement until the gains or losses on the hedged transactions are rec-
ognised in profi t or loss or until the transactions mature. That amount is
recognised in the same line item as the gain or loss on the hedged item.
Lastly, should the hedge become ineff ective, the amount recognised in
equity until then is taken to profi t or loss proportionately over the term of
the derivative arranged.
ii. Fair value hedge: a fair value hedge hedges exposure to changes in the
value of a recognised asset or liability or a fi rm commitment relating to
a future transaction. The gain or loss on the hedging instrument and the
gain or loss on the hedged asset or liability are recognised in the consoli-
dated income statement.
iii. Hedge of net investments in foreign operations: Hedges of this nature
hedge exposure to changes in the value of net investments in foreign op-
erations attributable to foreign exchange fl uctuations. Gains or losses
are recognised in equity and taken to the income statement when the
investment is sold or matures.
Gains or losses on derivatives not qualifying for hedge accounting are
recognised in the consolidated income statement.
2.3.9 Business combinations and goodwill
Business combinations are accounted for using the acquisition cost method,
whereby the identifi able assets and liabilities of the business acquired are
recognised at fair value. Goodwill is the positive diff erence between the cost
of the investment and the fair value of the above-mentioned assets and
liabilities. In acquisitions of associates, goodwill generated is treated as an
addition to the value of the investment. Goodwill on consolidation is not
amortised and is tested for impairment (see Note 2.3.5).
2.3.10 Inventories
Inventories are initially recognised at acquisition or production cost. Bor-
rowing costs relating to inventories are capitalised during the construction
or production period. Inventories are subsequently measured at the lower of
weighted average cost and net realisable value.
The Group determines the net realisable value of inventories and recognises
all the necessary write-downs where cost exceeds net realisable value.
2.3.11 Cash and cash equivalents
Cash and cash equivalents include cash on hand, demand deposits at
banks and other short-term, highly liquid investments with an initial ma-
turity of three months or less.
“Cash and Cash Equivalents” includes investments of the same nature
and with the same maturity assigned to the fi nancing of certain infra-
structure projects, where the availability of the cash is restricted by the
fi nancing contracts as security for certain payment obligations relating
to interest or principal repayments as well as infrastructure mainte-
nance and operation.
Recoverable amount is the higher of fair value less costs to sell and value
in use. Value in use is calculated on the basis of estimated future cash
fl ows discounted at a rate that refl ects current market assessments of
the time value of money and the risks specifi c to the asset.
Where an impairment loss subsequently reverses, the carrying amount
of the asset is increased up to the limit of the original amount at which
the asset had been carried before the impairment loss was recognised.
An impairment loss recognised for goodwill must not be reversed in a
subsequent period.
2.3.6 Leases
Leases are classifi ed as fi nance leases whenever the terms of the lease
transfer substantially all the risks and rewards of ownership to the Group,
which generally has the option of acquiring the asset at the end of the
lease term under the terms agreed on when the lease was arranged. All
other leases are classifi ed as operating leases.
The Group recognises fi nance leases as assets and liabilities in the state-
ment of fi nancial position at the commencement of the lease term, at
the lower of the market value of the leased asset and the present value
of the minimum lease payments. The interest rate implicit in the lease
agreement is used to calculate the present value of the lease payments.
The cost of the assets held under fi nance leases is presented in the con-
solidated statement of fi nancial position on the basis of the nature of the
leased asset.
When the Group acts as the lessee in an operating lease, lease costs are
taken to the income statement on a straight-line basis over the lease
term, irrespective of the payment periods stipulated in the lease. If that
the lessor has established incentives in the lease consisting of payments
corresponding to the lessee but made by the lessor, the income deriving
from these incentives is taken to the income statement as a reduction
of the costs of the lease on the same straight-line basis as that used to
recognise the costs in profi t or loss.
2.3.7 Financial assets
A. Financial assets at fair value through profi t or loss:
These are assets acquired mainly to generate a profi t as a result of fl uc-
tuations in their value. They are stated at their fair value on acquisition
and at subsequent measurement dates, and any changes are recognised
directly in the consolidated income statement. The assets in this category
are classifi ed as current assets if they are expected to be realised within
12 months from the reporting date. There are no assets at fair value
through profi t or loss other than the derivative fi nancial instruments de-
scribed in Note 2.3.8.
B. Available-for-sale fi nancial assets:
This caption includes securities acquired that are not held for immediate
trading and have no fi xed maturity and relate mainly to investments in
companies not included in the Group’s scope of consolidation. They are
carried at their underlying carrying amount, unless there is better evi-
dence to the contrary, in which case they are carried at their fair value.
C. Held-to-maturity investments and accounts receivable:
Financial asset model provided for in IFRIC 12
This line item includes the service concession arrangements related to in-
frastructure in which the consideration consists of an unconditional con-
tractual right to receive cash or another fi nancial asset, either because
the grantor guarantees to pay the operators specifi ed or determinable
amounts or because it guarantees to pay the operator the shortfall be-
tween amounts received from users of the public service and specifi ed or
determinable amounts. Therefore, these are concession arrangements
in which demand risk is borne in full by the grantor. In these cases, the
amount payable by the grantor is recognised in assets in the statements
of fi nancial position as a loan or a receivable.
To calculate the amount payable by the grantor, the value of the con-
struction, operation and/or maintenance services provided and the
interest implicit in arrangements of this nature are taken into consider-
ation.
Revenue from the services provided in each period increase the amount
of the related accounts receivable with a balancing item in sales. The in-
terests on the services provided increase the amount of accounts receiv-
able with a balancing item in other operating income. Amounts received
from the grantor reduce the total receivable with a balancing item in
cash.
consolidated fi nancial statements notes to the consolidated fi nancial statements consolidated fi nancial statements notes to the consolidated fi nancial statements

ferrovial Annual Report 2010 139
2.3.16 Pension obligations
A. Defi ned contribution plans: contributions are recognised each year
as an expense.
B. Defi ned benefi t plans: the liability recognised in the statement of
fi nancial position for defi ned benefi t plans is the present value of the de-
fi ned benefi t obligation at the end of the reporting period, minus the fair
value of plan assets and any past service cost not yet recognised. The
defi ned benefi t obligation is measured annually by independent actuar-
ies using the projected unit credit method. The defi ned benefi t obligation
is measured by discounting estimated future cash outfl ows on the basis
of market yields on high quality corporate bonds of a currency and term
consistent with the currency and term of the defi ned benefi t obligations.
Actuarial gains and losses comprise experience adjustments (measuring
the eff ects of diff erences between the previous actuarial assumptions
and what has actually occurred) and the eff ect of changes in actuarial
assumptions. As a result of the amendments to IAS 19, in 2006 the Group
availed itself of the alternative contained in the new wording of IAS 19
whereby the entire actuarial gain or loss may be recognised directly in
equity in the period in which it arises.
In the event of changes in the characteristics of the plan, if as a result of
changes in the obligations the rights arising therefrom vest automati-
cally, the past service cost is recognised immediately in the consolidated
income statement. Where, however the rights may be cancelled or do
not vest, the cost is recognised on a straight-line basis over the average
period until the benefi ts become vested.
In the event of a reduction in or the settlement of the plan, any gains or
losses arising from changes in the value of the defi ned benefi t obligation,
changes in the value of the plan assets and past service costs not yet
recognised are recognised immediately.
2.3.17 Share-based payment
A. Stock option plans: stock option plans are measured at fair value
when the options are initially granted using a fi nancial method, based
on an improved binomial model, taking into account the exercise price,
expected volatility, option life, expected dividends, the risk-free interest
rate and the assumptions made to incorporate the eff ects of expected
early exercise. The initial fair value is not subsequently revised. This fair
value is recognised under “Staff Costs” in proportion to the stipulated
period of time during which the employee must remain at the company,
with a balancing entry in equity.
B. Equity-settled share-based payment: these transactions are
measured at the grant date at the market price of the shares at that
time, deducting therefrom the present value of expected dividends dur-
ing the established vesting period. This fair value is recognised under
“Staff Costs” in proportion to the stipulated period of time during which
the employee must remain at the company, with a balancing entry in
equity.
C. Swaps arranged on share-based payments: Ferrovial arranges
swaps exclusively to hedge the impact on equity of settlement of the
stock option plans. Changes in the fair value of the swaps are taken to
the income statement as they do not qualify for hedge accounting, as
mentioned in Note 24 on fair value adjustments.
2.3.18 Financial liabilities
These liabilities are initially recognised at fair value net of transaction
costs and are subsequently measured at amortised cost using the ef-
fective interest method. The eff ective interest rate is the rate that ex-
actly discounts estimated future cash payments through the expected
life of the fi nancial instrument to the net carrying amount of the fi -
nancial liability. If the eff ective interest rate is initially considered to
diff er from the market interest rate, the liability is measured based on
the present value of future cash fl ows at the market rate in the case of
interest-bearing loans. Where no eff ective interest rate is specifi ed, the
cash fl ows are also measured using the market interest rate.
If existing debts are renegotiated, the fi nancial liability is not deemed to
change signifi cantly when the lender of the new loan is the same as the
initial lender and the present value of the cash fl ows, including origina-
tion and arrangement costs, applying the eff ective interest method is
not more than 10% higher or lower than the present value of the future
cash fl ows payable on the original liability calculated using this same
method.
2.3.12 Non-current assets classifi ed as held for sale and discontin-
ued operations
A. Non-current assets classifi ed as held for sale: non-current as-
sets are classifi ed as held for sale when it is considered that their car-
rying amount will be recovered through a sale transaction rather than
through continuing use. This condition is regarded as met only when the
sale is highly probable, the asset is available for immediate sale in its
present condition and the sale is expected to be completed within one
year from the date of classifi cation. The total fi gure for these assets is
presented in a single line item and is measured at the lower of the carry-
ing amount of the assets and their fair value less costs to sell. The assets
are no longer depreciated once they have been classifi ed as held for sale.
Gains and losses on these assets are recognised in the income statement
based on the basis of the nature of the related items.
B. Discontinued operations: Discontinued operations are those that
have been sold, disposed of by another means or classifi ed as held for
sale, and represent a complete segment for the consolidated Group, or
form part of a one-off plan or constitute a subsidiary acquired solely for
resale. Gains and losses on discontinued operations are presented in a
single specifi c line item in the income statement, net of taxes.
2.3.13 Equity
Ordinary shares are classifi ed as equity. Incremental costs directly attrib-
utable to the issue of new shares are deducted, net of taxes, from equity.
Acquisitions of the Parent’s treasury shares are deducted from equity for
the amount of the consideration paid, including the attributable costs
associated with the acquisitions. When treasury shares are sold or reis-
sued, any amount received is taken, net of costs, to equity.
2.3.14 Grants
Grants are recognised at their fair value when there is reasonable as-
surance that the grant will be received and the Group fulfi ls all the
conditions attaching to them. Grants related to assets are recognised
as non-current liabilities under “Deferred Income”, and are credited to
the consolidated income statement on a straight-line basis over the esti-
mated useful lives of the related assets.
2.3.15 Provisions and contingent liabilities
The Group recognises a provision for a commitment or obligation vis-
à-vis a third party that meets the following requirements: It is a present
obligation arising from past events, the settlement of which is expected
to result in an outfl ow of funds and the amount or timing of which are not
known for certain but can be estimated suffi ciently reliably. The provi-
sions include most notably the following:
• Provisions for budgeted losses in the Construction business covering a
probable loss identifi ed before completion of the project.
• Provisions for the closure and post-closure of landfi lls in the Services
business, since the Company is required to close the landfi ll when it
reaches maximum capacity due to environmental risks. These provi-
sions cover estimated closure costs and waste treatment costs during the
post-closure period, in accordance with technical estimates based on the
landfi ll’s capacity, average density and other parameters.
A contingent liability is a possible obligation arising from past events
whose existence will be confi rmed only by the occurrence or non-occur-
rence of one or more future events not wholly within the control of the
consolidated companies. Contingent liabilities are not recognised, but
the most signifi cant are disclosed in these notes (see Note 23).
consolidated fi nancial statements notes to the consolidated fi nancial statements consolidated fi nancial statements notes to the consolidated fi nancial statements
2.3.19 Income tax and deferred taxes
The term “consolidated income tax” covers all domestic and foreign tax-
es applicable to taxable income. Income tax also includes other taxes,
such as taxes on repatriated profi ts, and any other tax calculated on the
basis of the accounting profi t.
The income tax expense recognised in the consolidated fi nancial state-
ments is calculated by aggregating the expense recognised by each of
the consolidated companies, increased or decreased, as appropriate, by
the tax eff ect of accounting consolidation adjustments and by tempo-
rary diff erences between the tax bases of the assets and liabilities and
their carrying amounts in the consolidated fi nancial statements (bal-
ance sheet liability method).
Deferred taxes are not recognised when the transaction has no eff ect on
the accounting profi t or loss or tax base of the related assets and liabili-
ties. In the case of business combinations, deferred tax is recognised as a
result of the allocation of the price and the amortisation for tax purposes
of any goodwill generated.
Deferred tax assets and liabilities are calculated using the tax rates in
force at the reporting date and that are expected to apply in the period
in which the asset is realised or the liability is settled. They are charged or
credited to the income statement, except when they relate to items that
are recognised directly in equity, in which case they are charged or cred-
ited to equity. A deferred tax liability is not recognised for undistributed
profi ts of subsidiaries when the Group is able to control the timing of the
reversal of the temporary diff erence and it is probable that the tempo-
rary diff erences will not reverse in the foreseeable future. Deferred tax
assets and tax loss carryforwards are recognised when it is probable that
the Company will recover them in the future, regardless of when they will
be recovered, provided this is within the maximum period provided by
law. Deferred tax assets and liabilities are not discounted and are classi-
fi ed as a non-current asset or liability respectively. Deferred taxes recog-
nised are reviewed at the end of each reporting period.
The diff erence between the income tax expense recognised at the previ-
ous year end and the income tax expense reported in the fi nal tax returns
fi led constitutes a change in accounting estimates and is recognised as
current-year income or expense.
2.3.20 Translation of foreign currency transactions
Foreign currency transactions performed by Group companies are trans-
lated into the functional currency using the year-end exchange rates for
assets and liabilities and the average exchange rates for income state-
ment items.

ferrovial Annual Report 2010 141
Late-payment interest arising from delays in the collection of billings is
recognised when it is probable that the interest will be collected and the
amount may be measured reliably.
2.3.21.2 Toll road business
The contracts included in this line of business are accounted for in accor-
dance with IFRIC 12, used as a basis for classifying the assets used in such
contracts on the basis of the intangible asset model and the fi nancial as-
set model (mixed models can also exist).
2.3.21.3 Airport business
Revenue may be divided into:
1) airport revenue, which accrues in diff erent ways and includes most
notably revenue that accrues on the basis of the number of passengers,
landing charges based on the tonnage of the aircraft that land at the
airport, and aircraft parking charges, which are calculated on the basis
of a combination of the number of parking hours and aircraft tonnage,
and 2) retail-related revenue from the assignment of commercial space
to third parties, which is recognised as a percentage of the sales gener-
ated by the third party.
2.3.21.4 Service businesses
In general, revenue from services of this nature is recognised in the in-
come statement on a straight-line basis over the term of the contract.
In the case of contracts for a number of diff erent services and prices,
revenue and costs are recognised with reference to the stage of comple-
tion, applying the same methods and conditions as those described for
the Construction business. Where this is not possible, the percentage of
completion method is used, based on the costs incurred as a percentage
of total estimated costs.
Lastly, it should be noted that certain contracts performed by Amey in
the United Kingdom are accounted for using the fi nancial asset model
provided for in IFRIC 12.
2.3.21.5 Operating results
The operating results in the income statement include the results of the
Group companies’ ordinary activities, excluding fi nancial results (see
Note 28) and the share in the results of companies accounted for using
the equity method, presented under “Profi t from Operations” a specifi c
line item which includes sales revenue and gains and losses on disposals
of non-current assets.
2.4 Accounting estimates and judgements
In the consolidated fi nancial statements for 2010 estimates were made
to measure certain assets, liabilities, income, expenses and obligations.
These estimates relate basically to the following:
• The assessment of possible impairment losses on certain assets.
• The assumptions used in the actuarial calculation of pension liabili-
ties and other obligations to employees.
• The useful life of the property, plant and equipment and intangible
assets.
• The measurement of stock options.
• The budget-related estimates taken into consideration when rec-
ognising the results of contracts with a reference to the stage of
completion in the Construction and Services segments.
• Estimates relating to the fair value of assets acquired in business
combinations and goodwill.
• The assessment of possible legal and tax contingencies.
• Estimates relating to the valuation of derivatives and the related ex-
pected fl ows in cash fl ow hedges.
Although, these estimates were made using the best information avail-
able at 31 December 2010 and 2009 on the events analysed, events
that take place in the future might make it necessary to change this esti-
mates. Changes in accounting estimates would be applied in accordance
with IAS 8.
2.3.21 Revenue recognition
Revenue is measured at the fair value of the consideration receivable
and represents the amounts receivable for the goods and services pro-
vided in the normal course of business, net of discounts, refunds, VAT
and other sales-related taxes. Revenue is recognised when the risks and
rewards are deemed to have been transferred. Set out below are details
of the methods applied to recognise revenue in each segment in which
Ferrovial operates.
2.3.21.1 Construction business
Construction business revenue is recognised in accordance with IAS 11,
whereby revenue and associated costs are recognised in the income
statement by reference to the stage of completion of the contract ac-
tivity at the end of the reporting period, provided that the outcome of
the construction contract can be estimated reliably. An expected loss on
the construction contract is recognised as an expense immediately. The
Company habitually examines the work performed, which is made pos-
sible in practice by the existence in all the contracts of a defi nition of all
the units of output and the price at which each unit is to be billed. There
are budgeting tools for monitoring variances. At the end of each month,
the units executed in each contract are measured and the output for the
month is recognised as revenue. Contract costs are recognised on an ac-
crual basis, and the costs actually incurred in completing of the units of
output are recognised as an expenses and those that might be incurred in
the future have to be allocated to the project units completed.
In exceptional cases, where it is not possible to estimate the margin for
the entire contract, the total costs incurred are recognised and sales that
are reasonably assured with respect to the completed work are recog-
nised as contract revenue, subject to the limit of the total contract costs.
Changes to the initial contract require the customer’s technical and
fi nancial approval prior to the issue of billings and collection of the
amounts relating to additional work. The Group does not recognise rev-
enue from such additional work until approval is reasonably assured and
the revenue can be measured reliably. The costs associated with these
additional assets are recognised when incurred.
Initial contract costs incurred in the formalisation of the principal con-
tract, costs of moving plant to the contract site, costs incurred in design,
assistance and studies, building insurance costs, perimeter fi nancing
costs and other initial contract costs are recognised as prepaid expenses.
These costs are initially recognised as assets provided that it is probable
that they will be recovered in the future and they are recognised in profi t
or loss based on actual production with respect to estimated production
under each contract. Otherwise, the costs are taken directly to the in-
come statement.
consolidated fi nancial statements notes to the consolidated fi nancial statements consolidated fi nancial statements notes to the consolidated fi nancial statements
3. Management of fi nancial risks and capital The Group’s activities are exposed to a variety of fi nancial risks, particu-
larly interest rate risk, foreign currency risk, credit risk, liquidity risk and
equity risk.
3.1 Interest rate risk
The Ferrovial Group’s business requires fi nancing that can be borrowings
indexed to fi xed or fl oating interest rates. Interest rate risk management
optimises the cost of fi nancing to guarantee fulfi lment of the business
plans.
Accordingly, in managing interest rates, the Ferrovial Group tends to
keep a percentage of the debt tied to fi xed rates, either arranged at in-
ception or hedged by means of derivative fi nancial instruments.
Ferrovial applies a proactive management approach to the portion of
the debt that is tied to fl oating, paying particular attention to the evolu-
tion of market rates in order to obtain the lowest rates wherever possible.
As regards infrastructure project fi nancing, each project is analysed and
criteria are identifi ed to minimise exposure to interest rate fl uctuations,
resulting in the establishment of ceilings on the volume of debt tied to
fl oating rates, which is usually between 15% and 35% of the total project
fi nancing.
This avoids potential changes in expected project returns due to changes
in market interest rate curves.
This objective of establishing pre-set rates for projects is often achieved
by arranging hedging derivatives, an analysis of which is provided in Note
11 on derivative fi nancial instruments at fair value.
Occasionally, in certain infrastructure projects the revenue from which
is tied to infl ation through a contractual formula, an attempt is made to
structure their fi nancing through borrowings, the cost of which is indexed
to the changes in infl ation observed in the period, obtaining a natural
hedge between income and expenses. This structuring and hedge can be
set up directly with the debt or through derivative fi nancial instruments.
In the case of long-term borrowings not linked to specifi c projects, there
are no predetermined formulae with respect to the distribution of fi xed
rates and fl oating rates, although the decisions in this connection are
taken from perspective of the management of the Group as a whole;
however, it is usually attempted to hold between 50% and 80% of the
borrowings at a pre-set rate for the Group as a whole.
The accompanying table shows a breakdown of the Group’s debt, indi-
cating the percentage of the debt that is considered to be hedged (either
by a fi xed rate or by derivatives). Not all the assets are hedged (the case
of cash and cash equivalents, and long-term restricted cash associated
with the debt.

ferrovial Annual Report 2010 143
2009
BorrowingsTotal gross
debt
% of
debt
hedged
Net debt
exposed
to interest
rate risk
Impact on
results of +
100 basis
points
Construction 50 46% 27 0
Services 355 15% 301 3
Airports 0 0% 0 0
Toll roads 0 0% 0 0
Corporate and other 2,245 53% 1,058 11
Other companies 2,650 48% 1,386 14
BAA 14,472 74% 3,707 37
Other airports 0 0% 0 0
Toll roads 8,079 83% 1,352 14
Construction 86 0% 86 1
Services 20 98% 0 0
Infrastructure
projects22,656 77% 5,146 51
TOTAL FINANCIAL
DEBT25,306 74% 6,532 65
Analysis of the foregoing table shows that 70% of the Group’s debt is in-
sured against the risk of changes in interest rates, a percentage that is
similar to that of 2009 if, for comparison purposes, the fi xed-rate debt
relating to 407 ETR’s bonds is excluded from the 2009 data. As regards
project borrowings, 73% of which is hedged, approximately 16% is in-
dexed to infl ation.
Thus, a linear variation of 100 basis points in the interest rate curves ex-
isting on the market at 31 December 2010 would increase the fi nance
costs in the income statement by an estimated EUR 69 million, of which
EUR 56 million relate to infrastructure projects and EUR 13 million to the
other companies.
Note 19 provides a more detailed analysis by type of debt, based on the
extent to which the interest rate risks are hedged.
In addition to the impact of interest rate fl uctuations on the assets and li-
abilities making up the net cash position, changes may arise in the values
of the derivative fi nancial instruments arranged by the Company, which
are indicated in Note 11. Revaluation gains and losses are mainly recog-
nised in reserves in the case of derivatives that are eff ective hedges, as
required by International Accounting Standards.
2010
BorrowingsTotal gross
debt
% of debt
hedged
Net debt
exposed
to interest
rate risk
Impact on
results of
+ 100 basis
points
Construction 50 36% 32 0
Services 170 20% 136 1
Airports 0 0% 0 0
Toll roads 0 0% 0 0
Corporate and other 1,844 44% 1,024 10
Other companies 2,064 42% 1,192 12
BAA 15,017 73% 4,028 40
Other airports 0 0% 0 0
Toll roads 5,769 74% 1,527 15
Construction 142 96% 6 0
Services 54 87% 7 0
Infrastructure
projects20,981 73% 5,568 56
TOTAL FINANCIAL
DEBT23,045 71% 6,760 68
consolidated fi nancial statements notes to the consolidated fi nancial statements consolidated fi nancial statements notes to the consolidated fi nancial statements

ferrovial Annual Report 2010 145
An analysis of the table above shows that the Group’s equity is particu-
larly exposed to the Canadian dollar and to the pound sterling.
Exposure to the Canadian dollar has increased considerably compared
to 2009 due to the adjustment to fair value of the interest in 407 ETR in
Canada after selling 10% of the ownership interest.
For investments of this type (in which no specifi c debt is associates with
the fi nancing of the investment), the Group specifi c hedges for the
amounts to be recovered, in the form or dividends or capital reimburse-
ments, with a time horizon of up to three years.
In general, they are treated as long-term investments denominated in
strong currencies that historically have not fl uctuated signifi cantly.
On the basis of all the data provided above, a 10% appreciation of the
euro at year-end, against the main currencies in which the Group has
investments would have an impact on the Parent’s equity of EUR -510
million, of which 57% would relate to the impact of the Canadian dollar.
This fl uctuation in the value of the euro would have an impact on total
assets of EUR -3,202 million, of which 72% would relate to the invest-
ments in pounds sterling.
The detail of the net profi t attributable to the Parent by type of currency
for 2010 and 2009 is as follows:2010
Currency Assets Liabilities Equity of Socios
Externos
the ParentNon-
controlling
interests
12.091 -1.130 193
Euro 11,154 12,091 -1,130 193
Pound sterling 23,458 19,701 2,318 1,438
US dollar 2,608 2,192 390 26
Canadian dollar 3,263 2,571 808 -116
Polish zloty 982 784 120 78
Chilean peso 1,663 1,610 66 -13
Swiss franc 710 220 479 10
Other 161 111 50 0
Total Group 43,999 39,280 3,102 1,617
In this regard, the impact of a 10% appreciation of the euro on the in-
come statement would have amounted to EUR -169 million.
2010
Currency Profi t or loss
Euro -265
Pound sterling -403
US dollar -15
Canadian dollar 2,499
Polish zloty 28
Chilean peso 278
Swiss franc 39
Other 2
Total Group 2,163
2009
Currency Profi t or loss
Euro 289
Pound sterling -436
US dollar -14
Canadian dollar 16
Polish zloty 27
Chilean peso 14
Swiss franc 27
Other 3
Total Group -74
3.2 Foreign currency risk
Foreign currency risk management is generally centralised through the
Group’s General Economic and Financial Division, on the basis of its glob-
al policies that seek to minimise the impact caused by fl uctuations in the
exchange rates of the currencies in which Ferrovial operates, by means of
hedging mechanisms.
Ferrovial has signifi cant investments in developed countries with a cur-
rency other than the euro, including most notably, pound sterling, US
dollars, Canadian dollars and Polish zlotys. Ferrovial sets up hedging
strategies for these long-term investments by issuing debt in the same
currency as that in which the investment is denominated.
With regard to management of foreseeable cash fl ow risks, the following
transactions are analysed:
• Investments or divestments in projects.
• Income obtained from foreign subsidiaries in the form of dividends or
capital reimbursements expected to be received from those subsid-
iaries.
• Intra-Group loans to foreign subsidiaries. Cash surpluses at foreign
subsidiaries.
• Foreign currency collections from customers and payments to sup-
pliers.
The hedging strategy is analysed on a case-by-case basis, avoiding
signifi cant eff ects that might hinder the fulfi lment of the business plan
and impair Ferrovial’s capital. The factors considered are: (1) size of the
investment/transaction versus the level of capitalisation required; (2)
fi nancing sources to be used (debt, cash fl ows received, etc.); (3) Risk of
currency appreciation/depreciation; and (4) fi nancial cost of the possible
hedge.
In general, the Group attempts to fi nance all the infrastructure projects
that it invests in using the currencies in which each project’s income is
denominated. Where this is not feasible, the Group arranges derivatives
to hedge potential changes in the value of the debt caused by exchange
rate fl uctuations.
In construction or services contracts in which the price is received in a cur-
rency other than that in which the related costs are paid, hedges are ar-
ranged to avoid changes in the profi t margin caused by exchange rate
fl uctuations.
The following table shows the values of assets, liabilities, non-control-
ling interests and equity attributable to the Parent by type of currency at
December 2010 and 2009:
2010
Currency AssetsLiabili-
tiesEquity of
Socios
Externos
Euro 11,101 10,831 37 233
Pound sterling 22,942 20,372 1,442 1,128
US dollar 3,894 3,467 438 -11
Canadian dollar 2,938 8 2,929 0
Polish zloty 1,186 961 159 66
Chilean peso 39 -117 157 0
Swiss franc 1,026 1,031 -23 18
Other 162 107 55 0
Total Group 43,287 36,659 5,194 1,434
consolidated fi nancial statements notes to the consolidated fi nancial statements consolidated fi nancial statements notes to the consolidated fi nancial statements

ferrovial Annual Report 2010 147
3.3 Credit and counterparty risk
The Group’s main fi nancial assets exposed to credit risk or counterparty
risk are as follows:
a) Investments in fi nancial assets included in cash and cash
equivalents (short term) (Note 19)
b) Non-current fi nancial assets (Note 10)
c) Derivative fi nancial instruments (Note 11)
d) Trade and other receivables (Note 14)
The Group’s overall exposure to credit risk is equal to the balance of the
above-mentioned items, as the Group has not granted any credit lines
to third parties.
As regards the risk incurred by investing in fi nancial products or arranging
derivative fi nancial instruments (included in letters a, b and c), Ferrovial
has established internal criteria to minimise credit risk, stipulating that
counterparties must always have high credit ratings received from pres-
tigious international rating agencies. Ferrovial also imposes maximum
limits on amounts invested or arranged, which are periodically reviewed.
In the case of transactions in countries whose economic and socio-polit-
ical circumstances preclude high credit quality, the Group mainly selects
branches and subsidiaries of foreign entities that met or nearly meet the
stipulated credit requirements, or the largest local entities.
In the specifi c case of restricted cash linked to infrastructure project fi -
nancing, the fi nancing contracts that provide for the amounts that must
be set aside as restricted cash usually also stipulate the conditions that
must be fulfi lled by the fi nancial products in which these obligations
must be instrumented.
With respect to risks related to trade receivables (included in letter d) and
non-current receivables (letter b), there are a wide variety of custom-
ers, a large proportion of which are public-sector entities. 72% of all
the Group’s non-current and current receivables relate to public-sector
agencies.
3.4 Liquidity risk
In the current market environment, in which a major fi nancial crisis
caused a widespread credit crunch in 2010 (as in 2009), Ferrovial adopt-
ed a proactive approach to liquidity risk management, focusing basically
on the preservation of the Company’s liquidity and on settling fi nancial
transactions before they mature.
Changes in the main exchange rates vis-à-vis the euro are shown in the
following table; in general the main currencies appreciated against
the euro, particularly the Chilean peso +14% and the Canadian dollar
+11.3%:
This policy is based on four main pillars:
1. Effi cient working capital management to ensure timely fulfi lment of
payment obligations by customers.
2. Monetisation of fi nancial assets, where this can be done under reason-
able market conditions, through the factoring and discounting of future
collection rights.
3. Integral cash management, in order to optimise daily liquidity posi-
tions at the various companies by setting up a global cash management
system.
4. Setting up short-term credit lines that guarantee the availability of
cash and the payment of obligations in the event of periods of diffi culty
in relation to collections and available balances.
The Group has also sought to always utilise available cash to settle pay-
ment obligations and liabilities in advance.
Infrastructure projects:
Liquidity risk must be analysed separately for each individual infrastruc-
ture project since there is specifi c fi nancing for each project and the proj-
ects are independent units for liquidity purposes.
In general, debt maturities are monitored carefully for each project.
Note 19 contains a breakdown showing that 56% of the project fi nancing
falls due after more than fi ve years.
The fact that these are long-term projects with foreseeable fl ows gen-
erally allows for the arrangement of fi nancing structures linked to esti-
mated project fl ows.
Also, during the performance of the projects, the Group seeks to apply an
active refi nancing policy to maximise cash generation.
The refi nancing processes include most notably the subordinated debt
and part of BAA’s refi nancing facility, which are addressed in more detail
in Note 19.
As indicated above, certain infrastructure project fi nancing contracts
stipulate the need to hold accounts (restricted cash) the availability of
which is restricted under the fi nancing contracts as security for certain
short-term obligations, related to interest or principal repayments, as
well as infrastructure maintenance and operation.
These accounts are an additional guarantee with respect to liquidity risk
(see breakdown in Note 19).
The borrowings falling due in 2011 relating to infrastructure projects
total EUR 1,147 million, relating mainly to the Ausol and Inversora Au-
topista del Sur toll road projects. A breakdown of these maturities is pro-
vided in Note 19.
The Group seeks to cover all obligations to make new investments by
means of specifi c-purpose fi nancing before the investment is made. Note
19 contains a breakdown of the balances available to fulfi l these require-
ments.
To conclude on all the preceding sections, the liquidity position of the in-
frastructure projects in 2010 is explained below:
· At 31 December 2010, cash and cash equivalents (including short-term
restricted cash) amounted to EUR 700 million.
· Also, at that date, undrawn credit lines amounted to EUR 4,453 million,
which were arranged mainly to cover committed investment needs.
· The projects have the capacity to generate signifi cant and recurring
cash fl ows from operating activities (cash fl ows obtained from these
projects in 2010 totalled EUR 1,828 million; see Note 31 on cash fl ows).
· The capacity to increase the volume of debt in certain projects, based on
growth in operating variables.
Exchange rate at year-end
2010 2009CHANGE
10/09
Pound sterling 0.8574 0.8876 -3.40%
US dollar 1.3366 1.4331 -6.73%
Canadian dollar 1.3291 1.4989 -11.33%
Polish zloty 3.9557 4.1048 -3.63%
Chilean peso 625.6500 727.6300 -14.02%
Average exchange rate
2010 2009CHANGE
10/09
Pound sterling 0.8561 0.8888 -3.68%
US dollar 1.3211 1.3952 -5.31%
Canadian dollar 1.3674 1.5810 -13.51%
Polish zloty 3.9915 4.3448 -8.13%
Chilean peso 673.8300 771.7983 -12.69%
consolidated fi nancial statements notes to the consolidated fi nancial statements consolidated fi nancial statements notes to the consolidated fi nancial statements

ferrovial Annual Report 2010 149
Other Group activities
Unlike in the case of infrastructure projects, liquidity risk is managed on
an overall basis for the rest of the Group’s activities, particularly for ac-
tivities carried on in Spain.
Liquidity risk management also focuses on closely monitoring debt ma-
turities (also explained in Note 19) and on proactive management and
maintenance of credit lines to cover forecast cash needs.
The borrowings for other activities falling due in 2011 total EUR 59 mil-
lion. A breakdown of these maturities is provided in Note 19.
The liquidity position of the Group’s other activities in 2010 is based on
the following factors:
· At 31 December 2010, cash and cash equivalents (including short-
term restricted cash) amounted to EUR 2,005 million.
· Also, at that date, undrawn credit lines totalled EUR 919 million.
· The Group’s business areas have the capacity to generate signifi cant
and recurring cash fl ows from operating activities (cash fl ows from
operating activities obtained in 2010 totalled EUR 811 million; see
Note 31 on cash fl ows).
· The capacity to increase debt volumes based on the current moder-
ate level of debt and on the Group’s capacity to generate recurring
cash fl ows.
Lastly, as regards liquidity risk management, at both Group level and in
each business area and project, systematic forecasts are prepared on
cash generation and needs in order to determine and monitor the Group’s
liquidity position on an ongoing basis.
3.5 Equity risk
Ferrovial is also exposed to risk relating to the evolution of the share pric-
es of listed companies. This exposure arises specifi cally in equity swaps
linked to share-based payment:
As indicated in Note 11 on derivative fi nancial instruments and Note 33
on share-based payment, Ferrovial has arranged equity swaps to hedge
possible disbursements that may be required in relation to executive re-
muneration systems linked to the price of Ferrovial shares.
The equity swaps eliminate uncertainty with respect to the exercise
price of the remuneration systems; however, as they are not deemed to
be hedging derivatives under International Accounting Standards, their
market value has an impact on the income statement, which is positive if
the share price rises and negative if the share price falls.
Specifi cally, in 2010 Ferrovial’s closing share price was EUR 7.44, and
Ferrovial recognised an expense of EUR 39 million (see Note 11) which
had an impact of EUR 24 million on the net profi t.
3.6 Infl ation risk
The Company has contracted derivative fi nancial instruments linked to
the evolution of the CPI, as explained in Note on fair value adjustments,
in relation to the measurement of index-linked swaps.
These instruments have mainly been arranged by BAA and are measured
based on the infl ation rate forecast for the periods covered by the deriva-
tives (see Note 11 on derivative fi nancial instruments for more details).
A 1% rise in the infl ation rate during the term of the derivative, without
any change in the interest rate, would have an impact of EUR -478 mil-
lion on the fair value of these derivatives and of EUR -277 million on the
net profi t.
3.7 Management of capital
The Group’s objective in equity management is to safeguard its capac-
ity to continue managing its recurring activities and the capacity to con-
tinue to grow through new projects, by optimising the debt-equity ratio
to create shareholder value.
Since the Group was listed on the stock exchange in 1999, capitalisation
has remained steady, except for the eff ect generated in the merger with
Cintra in 2009, and there have been no new equity issues. Growth has
been fi nanced in three ways:
· Internal cash fl ows generated from the Group’s recurring businesses.
· Capacity to grow through investments in new infrastructure projects
fi nanced largely by borrowings secured by project fl ows, thereby
feeding back funds to boost the Group’s capacity for growth in its
recurring activities.
· Asset turnover policy focused on the sale of mature projects in or-
der to continue fi nancing investments in new projects. The Group’s
optimum leverage ratio is not determined on the basis of its over-
all debt-equity ratio but it is based rather on the diff erent levels on
which the debt is structured, as follows:
· In the case of infrastructure projects, each project is assigned a le-
verage ratio linked to its operating variables or forecast future cash
fl ows. A high leverage ratio is justifi ed by the existence of long-term
projects with recurring and predictable fl ows. In the case of regulat-
ed airports, the leverage ratio is based on the debt-to-RAB ratio (as
indicated earlier, the RAB is used to calculate prices and is therefore
a key element when determining future fl ows).
· For the Group’s other companies (excluding infrastructure proj-
ects, which mainly involve corporate debt), the aim is to maintain
a moderate leverage ratio based on the general reference levels
determined by rating agencies for “investment grade” companies;
in Ferrovial’s case, this is usually determined based on a ratio com-
bining the gross profi t from operations (indicator linked to recurring
cash fl ows) and net borrowings in those areas.
4. Segment reportingThe “Other” column in the balance sheet and income statement by seg-
ment includes the assets and/or liabilities and income and/or expenses
of the companies not assigned to any of the business segments, inclu-
ding most notably the Parent Ferrovial, S.A. and its smaller subsidiaries,
the Polish real estate business, and inter-segment adjustments. Set out
below are the segment balance sheets for 2010, 2009, 2008 and the
segment income statements for 2010 and 2009:
consolidated fi nancial statements notes to the consolidated fi nancial statements consolidated fi nancial statements notes to the consolidated fi nancial statements

ferrovial Annual Report 2010 151
Assets Construction Toll roads Airports Services Other Total
Non-current assets 722 11,411 20,871 1,913 549 35,465
Goodwill 178 390 3,575 889 0 5,032
Intangible assets 7 0 0 90 1 97
Concession infrastructure 0 5,021 16,561 145 -215 21,512
Investment property 0 0 0 0 64 64
Property, plant and equipment 109 2 0 384 57 552
Investments in associates 15 3,054 0 41 0 3,110
Non-current fi nancial assets 208 1,680 81 219 -4 2,184
Receivable from Group companies 0 0 31 0 -31 0
Other 208 1,680 50 219 27 2,184
Pension surplus 0 0 0 0 0 0
Deferred tax assets 203 1,075 0 146 643 2,068
Derivative fi nancial instruments at fair value 1 190 653 0 3 847
Assets classifi ed as held for sale and disconti-
nued operations1 28 0 1,486 0 1,515
Current assets 4,536 1,212 906 1,292 -1,639 6,306
Inventories 204 14 8 16 204 445
Trade and other receivables 1,631 406 406 1,110 -392 3,161
Cash and cash equivalents 2,702 792 492 167 -1,451 2,701
Receivable from Group companies 1,637 398 0 33 -2,067 0
Other 1,065 394 492 134 616 2,701
TOTAL ASSETS 5,259 12,650 21,777 4,691 -1,091 43,287
Equity and Liabilities Construction Toll roads Airports Services Other Total
Equity 362 4,227 2,557 1,142 -1,659 6,628
Equity attributable to the equity holders 292 4,024 1,430 1,120 -1,672 5,194
Non-controlling interests 69 203 1,127 22 12 1,434
Deferred income 9 170 4 14 0 196
Non-current liabilities 699 6,891 18,148 1,467 1,391 28,596
Provisions for pensions 1 0 77 74 0 153
Other long-term provisions 74 595 9 122 60 860
Bank borrowings 539 4,633 14,737 1,009 591 21,511
Payable to Group companies 369 0 0 855 -1,224 0
Other 170 4,633 14,737 154 1,815 21,511
Other payables 11 114 0 17 13 154
Deferred tax liabilities 71 801 2,418 213 448 3,951
Derivative fi nancial instruments at fair value 2 747 908 32 278 1,968
Liabilities classifi ed as held for sale and disconti-
nued operations0 0 0 891 0 891
Current liabilities 4,190 1,362 1,068 1,177 -822 6,975
Bank borrowings 15 1,169 292 466 -412 1,530
Payable to Group companies 0 33 12 395 -441 0
Other 15 1,136 280 71 29 1,530
Trade and other payables 3,679 193 731 696 -411 4,889
Operating provisions 495 0 46 14 1 556
TOTAL EQUITY AND LIABILITIES 5,259 12,650 21,777 4,691 -1,091 43,287
Segment balance sheet: 2010 (millions of euros)
consolidated fi nancial statements notes to the consolidated fi nancial statements consolidated fi nancial statements notes to the consolidated fi nancial statements

ferrovial Annual Report 2010 153
Construcción Autopistas Aeropuertos Servicios Resto Total
Assets Construction Toll roads Airports Services Other Total
Non-current assets 638 10,975 21,429 2,758 249 36,048
Goodwill 169 1,559 3,813 1,411 0 6,952
Intangible assets 7 0 0 38 0 45
Concession infrastructure 0 7,269 16,253 166 -68 23,621
Investment property 0 0 0 0 77 77
Property, plant and equipment 119 1 0 510 39 669
Investments in associates 16 62 0 183 0 262
Non-current fi nancial assets 147 1,319 182 214 72 1,935
Receivable from Group companies 0 0 0 0 0 0
Other 147 1,319 182 214 72 1,935
Pension surplus 0 0 0 22 0 22
Deferred tax assets 178 708 398 213 108 1,604
Derivative fi nancial instruments at fair value 2 56 781 0 22 861
Assets classifi ed as held for sale and disconti-
nued operations1 1,641 116 44 0 1,802
Current assets 4,048 823 957 1,519 -1,197 6,150
Inventories 185 11 7 21 265 489
Trade and other receivables 1,505 355 312 1,244 -236 3,181
Cash and cash equivalents 2,357 458 638 254 -1,227 2,480
Receivable from Group companies 1,368 6 2 0 -1,375 0
Other 990 452 636 253 149 2,480
TOTAL ASSETS 4,686 13,439 22,502 4,321 -949 43,999
Equity and Liabilities Construction Toll roads Airports Services Other Total
Equity 215 1,647 3,207 1,050 -1,399 4,719
Equity attributable to the equity holders 152 1,552 1,769 1,036 -1,409 3,102
Non-controlling interests 63 95 1,437 14 9 1,617
Deferred income 10 194 5 24 -1 232
Non-current liabilities 596 8,512 17,909 1,119 1,615 29,751
Provisions for pensions 1 -1 313 190 0 503
Other long-term provisions 50 697 29 148 30 954
Bank borrowings 459 6,981 14,028 626 1,274 23,368
Payable to Group companies 356 0 0 339 -695 0
Other 103 6,981 14,028 287 1,969 23,368
Other payables 9 113 0 10 3 136
Deferred tax liabilities 71 226 2,882 132 142 3,454
Derivative fi nancial instruments at fair value 5 496 656 13 166 1,336
Liabilities classifi ed as held for sale and disconti-
nued operations0 1,608 5 34 0 1,647
Current liabilities 3,865 1,478 1,377 2,094 -1,164 7,650
Bank borrowings 38 1,101 538 1,225 -966 1,937
Payable to Group companies 5 4 94 1,137 -1,240 0
Other 33 1,097 444 88 274 1,937
Trade and other payables 3,401 376 775 840 -198 5,194
Operating provisions 426 0 63 29 1 519
TOTAL EQUITY AND LIABILITIES 4,686 13,439 22,502 4,321 -949 43,999
Segment balance sheet: 2009 (millions of euros)
consolidated fi nancial statements notes to the consolidated fi nancial statements consolidated fi nancial statements notes to the consolidated fi nancial statements

ferrovial Annual Report 2010 155
Assets Construction Toll roads Airports Services Other Total
Non-current assets 662 8,988 20,430 2,667 153 32,900
Goodwill 171 321 3,527 1,382 0 5,400
Intangible assets 7 0 0 56 0 63
Concession infrastructure 1 6,817 14,966 133 -77 21,839
Investment property 0 0 0 0 92 92
Property, plant and equipment 138 0 0 465 17 620
Investments in associates 16 40 65 166 0 286
Non-current fi nancial assets 156 974 142 258 -6 1,524
Receivable from Group companies 39 0 0 0 -39 0
Other 117 974 142 258 32 1,524
Pension surplus 0 0 76 0 0 76
Deferred tax assets 175 738 640 206 100 1,859
Derivative fi nancial instruments at fair value 0 98 1,013 0 28 1,139
Assets classifi ed as held for sale and disconti-
nued operations5 1,708 2,563 2 0 4,278
Current assets 4,390 1,034 1,025 1,469 -1,292 6,626
Inventories 203 4 6 17 268 498
Trade and other receivables 1,929 283 366 1,252 -203 3,626
Cash and cash equivalents 2,259 748 653 200 -1,357 2,502
Receivable from Group companies 1,329 0 69 2 -1,400 0
Other 930 747 584 198 43 2,502
TOTAL ASSETS 5,058 11,730 24,017 4,138 -1,139 43,804
Equity and Liabilities Construction Toll roads Airports Services Other Total
Equity 373 954 1,182 914 675 4,098
Equity attributable to the equity holders 307 679 -747 897 664 1,801
Non-controlling interests 66 274 1,929 16 11 2,296
Deferred income 13 201 8 28 0 250
Non-current liabilities 542 8,575 19,683 1,083 -737 29,146
Provisions for pensions 1 0 0 131 0 132
Other long-term provisions 45 371 115 151 27 708
Bank borrowings 331 6,765 15,708 598 -990 22,413
Payable to Group companies 220 0 1,300 339 -1,858 0
Other 112 6,765 14,408 259 868 22,413
Other payables 9 96 0 13 1 119
Deferred tax liabilities 57 328 2,850 126 97 3,458
Derivative fi nancial instruments at fair value 98 1,016 1,011 64 129 2,319
Liabilities classifi ed as held for sale and disconti-
nued operations1 1,484 1,679 0 0 3,163
Current liabilities 4,130 517 1,465 2,112 -1,077 7,147
Bank borrowings 66 422 626 1,237 -799 1,552
Payable to Group companies 0 6 198 1,035 -1,239 0
Other 66 416 428 201 441 1,552
Trade and other payables 3,745 94 772 810 -279 5,142
Operating provisions 319 0 67 66 0 452
TOTAL EQUITY AND LIABILITIES 5,058 11,730 24,017 4,138 -1,139 43,804
Segment balance sheet: 2008 (millions of euros)
consolidated fi nancial statements notes to the consolidated fi nancial statements consolidated fi nancial statements notes to the consolidated fi nancial statements

ferrovial Annual Report 2010 157
Millions of euros
Additions to infrastructure
projects
Additions to property, plant
and equipment
Additions to intangible assets
and goodwillAdditions of associates
2010 2009 2010 2009 2010 2009 2010 2009
Construction 0 0 31 30 1 0 1 0
Airports 1,085 983 0 0 0 10 0 0
Toll roads 788 333 0 0 6 0 3,082 7
Services 69 32 74 144 21 7 5 0
Other 0 0 4 6 0 0 0 0
Total 1,942 1,348 108 180 28 17 3,088 7
The detail, by segment, of the acquisitions made, as required by IFRS 8,
is as follows:
The additions to infrastructure projects are broken down by business
segment in Note 7.
(Millions of euros) Construction Toll roads
Before fair
value adj.
Fair va-
lue adj.Total
Before fair
value adj.
Fair value
adj.Total
Revenue 4,525 0 4,525 869 0 869
Other operating income 6 0 6 0 0 0
Total operating income 4,531 0 4,531 869 0 869
Materials consumed 940 0 940 3 0 3
Other external expenses 1,477 0 1,477 9 0 9
Staff costs 642 0 642 73 0 73
Change in operating provisions 111 0 111 14 0 14
Other operating expenses 1,129 0 1,129 140 0 140
Total operating expenses 4,300 0 4,300 239 0 239
GROSS PROFIT OR LOSS FROM OPERATIONS 231 0 231 630 0 630
Depreciation and amortisation charge 40 0 40 113 0 113
Profi t or loss from operations before impairment and non-
current asset disposals191 0 191 517 0 517
Impairment and disposals of non-current assets 0 0 0 680 1,886 2,567
Profi t or loss from operations 191 0 191 1,197 1,886 3,084
Finance income of infrastructure projects 0 0 0 18 0 18
Finance costs of infrastructure projects -4 0 -4 -544 0 -544
Gains and losses on derivative fi nancial instruments and
other fair value adjustments0 0 0 0 5 5
Financial profi t or loss of infrastructure projects -4 0 -4 -526 5 -521
Finance income of other companies 96 0 96 17 0 17
Finance costs of other companies -56 0 -56 -20 0 -20
Gains and losses on derivative fi nancial instruments and
other fair value adjustments0 0 0 0 0 0
Financial profi t or loss of other companies 40 0 40 -4 0 -4
Financial profi t or loss 36 0 36 -530 5 -525
Share of profi ts of companies accounted for using the equity method -1 0 -1 17 3 20
Consolidated profi t or loss before tax 226 0 226 685 1,894 2,579
Income tax -71 0 -71 -136 27 -108
Consolidated profi t or loss from continuing operations 156 0 156 549 1,921 2,470
Net profi t or loss from discontinued operations 0 0 0 0 0 0
Consolidated profi t or loss for the year 156 0 156 549 1,921 2,470
Profi t or loss for the year attributable to non-controlling interest -21 0 -21 6 4 10
Profi t or loss for the year attributable to the Parent 135 0 135 555 1,925 2,480
Segment income statement: 2010
(*) Relating to gains and losses arising from changes in the fair value of derivatives, other fi nancial assets and liabilities and assets and liability impairment (see Note 24).
consolidated fi nancial statements notes to the consolidated fi nancial statements consolidated fi nancial statements notes to the consolidated fi nancial statements
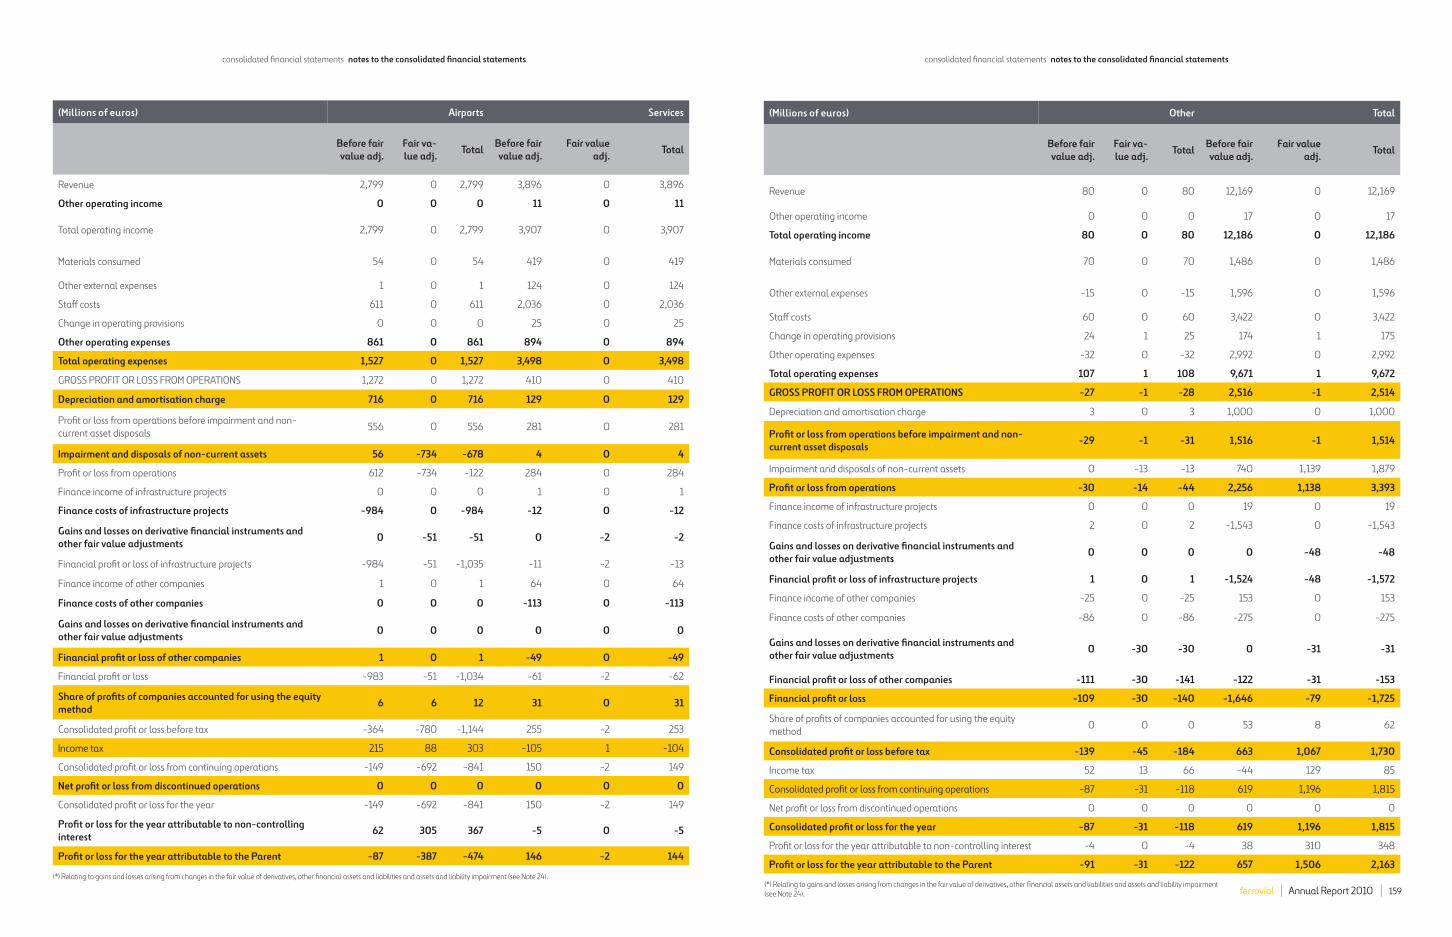
ferrovial Annual Report 2010 159
(Millions of euros) Airports Services
Before fair
value adj.
Fair va-
lue adj.Total
Before fair
value adj.
Fair value
adj.Total
Revenue 2,799 0 2,799 3,896 0 3,896
Other operating income 0 0 0 11 0 11
Total operating income 2,799 0 2,799 3,907 0 3,907
Materials consumed 54 0 54 419 0 419
Other external expenses 1 0 1 124 0 124
Staff costs 611 0 611 2,036 0 2,036
Change in operating provisions 0 0 0 25 0 25
Other operating expenses 861 0 861 894 0 894
Total operating expenses 1,527 0 1,527 3,498 0 3,498
GROSS PROFIT OR LOSS FROM OPERATIONS 1,272 0 1,272 410 0 410
Depreciation and amortisation charge 716 0 716 129 0 129
Profi t or loss from operations before impairment and non-
current asset disposals556 0 556 281 0 281
Impairment and disposals of non-current assets 56 -734 -678 4 0 4
Profi t or loss from operations 612 -734 -122 284 0 284
Finance income of infrastructure projects 0 0 0 1 0 1
Finance costs of infrastructure projects -984 0 -984 -12 0 -12
Gains and losses on derivative fi nancial instruments and
other fair value adjustments0 -51 -51 0 -2 -2
Financial profi t or loss of infrastructure projects -984 -51 -1,035 -11 -2 -13
Finance income of other companies 1 0 1 64 0 64
Finance costs of other companies 0 0 0 -113 0 -113
Gains and losses on derivative fi nancial instruments and
other fair value adjustments0 0 0 0 0 0
Financial profi t or loss of other companies 1 0 1 -49 0 -49
Financial profi t or loss -983 -51 -1,034 -61 -2 -62
Share of profi ts of companies accounted for using the equity
method6 6 12 31 0 31
Consolidated profi t or loss before tax -364 -780 -1,144 255 -2 253
Income tax 215 88 303 -105 1 -104
Consolidated profi t or loss from continuing operations -149 -692 -841 150 -2 149
Net profi t or loss from discontinued operations 0 0 0 0 0 0
Consolidated profi t or loss for the year -149 -692 -841 150 -2 149
Profi t or loss for the year attributable to non-controlling
interest62 305 367 -5 0 -5
Profi t or loss for the year attributable to the Parent -87 -387 -474 146 -2 144
(Millions of euros) Other Total
Before fair
value adj.
Fair va-
lue adj.Total
Before fair
value adj.
Fair value
adj.Total
Revenue 80 0 80 12,169 0 12,169
Other operating income 0 0 0 17 0 17
Total operating income 80 0 80 12,186 0 12,186
Materials consumed 70 0 70 1,486 0 1,486
Other external expenses -15 0 -15 1,596 0 1,596
Staff costs 60 0 60 3,422 0 3,422
Change in operating provisions 24 1 25 174 1 175
Other operating expenses -32 0 -32 2,992 0 2,992
Total operating expenses 107 1 108 9,671 1 9,672
GROSS PROFIT OR LOSS FROM OPERATIONS -27 -1 -28 2,516 -1 2,514
Depreciation and amortisation charge 3 0 3 1,000 0 1,000
Profi t or loss from operations before impairment and non-
current asset disposals-29 -1 -31 1,516 -1 1,514
Impairment and disposals of non-current assets 0 -13 -13 740 1,139 1,879
Profi t or loss from operations -30 -14 -44 2,256 1,138 3,393
Finance income of infrastructure projects 0 0 0 19 0 19
Finance costs of infrastructure projects 2 0 2 -1,543 0 -1,543
Gains and losses on derivative fi nancial instruments and
other fair value adjustments0 0 0 0 -48 -48
Financial profi t or loss of infrastructure projects 1 0 1 -1,524 -48 -1,572
Finance income of other companies -25 0 -25 153 0 153
Finance costs of other companies -86 0 -86 -275 0 -275
Gains and losses on derivative fi nancial instruments and
other fair value adjustments0 -30 -30 0 -31 -31
Financial profi t or loss of other companies -111 -30 -141 -122 -31 -153
Financial profi t or loss -109 -30 -140 -1,646 -79 -1,725
Share of profi ts of companies accounted for using the equity
method0 0 0 53 8 62
Consolidated profi t or loss before tax -139 -45 -184 663 1,067 1,730
Income tax 52 13 66 -44 129 85
Consolidated profi t or loss from continuing operations -87 -31 -118 619 1,196 1,815
Net profi t or loss from discontinued operations 0 0 0 0 0 0
Consolidated profi t or loss for the year -87 -31 -118 619 1,196 1,815
Profi t or loss for the year attributable to non-controlling interest -4 0 -4 38 310 348
Profi t or loss for the year attributable to the Parent -91 -31 -122 657 1,506 2,163
(*) Relating to gains and losses arising from changes in the fair value of derivatives, other fi nancial assets and liabilities and assets and liability impairment
(see Note 24).
(*) Relating to gains and losses arising from changes in the fair value of derivatives, other fi nancial assets and liabilities and assets and liability impairment (see Note 24).
consolidated fi nancial statements notes to the consolidated fi nancial statements consolidated fi nancial statements notes to the consolidated fi nancial statements

ferrovial Annual Report 2010 161
(Millions of euros) Construction Toll roads
Before fair
value adj.
Fair va-
lue adj.Total
Before fair
value adj.
Fair value
adj.Total
Revenue 4,475 0 4,475 990 0 990
Other operating income 19 0 19 0 0 0
Total operating income 4,494 0 4,494 990 0 990
Materials consumed 936 0 936 6 0 6
Other external expenses 1,606 0 1,606 -8 0 -8
Staff costs 655 0 655 106 0 106
Change in operating provisions 127 0 127 24 0 24
Other operating expenses 942 0 942 197 0 197
Total operating expenses 4,266 0 4,266 326 0 326
GROSS PROFIT OR LOSS FROM OPERATIONS 228 0 228 664 0 664
Depreciation and amortisation charge 45 0 45 106 0 106
Profi t or loss from operations before impairment and non-
current asset disposals183 0 183 558 0 558
Impairment and disposals of non-current assets 0 0 0 95 0 95
Profi t or loss from operations 183 0 183 653 0 653
Finance income of infrastructure projects 0 0 0 36 0 36
Finance costs of infrastructure projects -4 0 -4 -539 0 -539
Gains and losses on derivative fi nancial instruments and
other fair value adjustments0 0 0 0 -47 -47
Financial profi t or loss of infrastructure projects -4 0 -4 -503 -47 -550
Finance income of other companies 78 0 78 7 0 7
Finance costs of other companies -34 0 -34 -25 0 -25
Gains and losses on derivative fi nancial instruments and
other fair value adjustments0 0 0 0 9 9
Financial profi t or loss of other companies 44 0 44 -18 9 -9
Financial profi t or loss 41 0 41 -521 -38 -559
Share of profi ts of companies accounted for using the equity
method0 0 0 16 0 16
Consolidated profi t or loss before tax 224 0 224 148 -38 111
Income tax -66 0 -66 25 13 38
Consolidated profi t or loss from continuing operations 158 0 158 174 -25 149
Net profi t or loss from discontinued operations 0 0 0 0 0 0
Consolidated profi t or loss for the year 158 0 158 174 -25 149
Profi t or loss for the year attributable to non-controlling interest -13 0 -13 -46 18 -28
Profi t or loss for the year attributable to the Parent 144 0 144 128 -7 121
(Millions of euros) Airports Services
Before fair
value adj.
Fair va-
lue adj.Total
Before fair
value adj.
Fair value
adj.Total
Revenue 3,070 0 3,070 3,763 0 3,763
Other operating income 0 0 0 11 0 11
Total operating income 3,070 0 3,070 3,774 0 3,774
Materials consumed 73 0 73 464 0 464
Other external expenses 6 0 6 149 0 149
Staff costs 652 0 652 1,947 0 1,947
Change in operating provisions 0 0 0 19 0 19
Other operating expenses 1,000 2 1,002 828 0 828
Total operating expenses 1,732 2 1,733 3,408 0 3,408
GROSS PROFIT OR LOSS FROM OPERATIONS 1,339 -2 1,337 366 0 366
Depreciation and amortisation charge 726 0 726 124 0 124
Profi t or loss from operations before impairment and non-
current asset disposals613 -2 611 241 0 241
Impairment and disposals of non-current assets -747 -53 -800 1 0 1
Profi t or loss from operations -134 -55 -189 242 0 242
Finance income of infrastructure projects 0 0 0 9 0 9
Finance costs of infrastructure projects -894 0 -894 -10 0 -10
Gains and losses on derivative fi nancial instruments and
other fair value adjustments0 -100 -100 0 -1 -1
Financial profi t or loss of infrastructure projects -894 -100 -994 -2 -1 -3
Finance income of other companies -2 0 -2 51 0 51
Finance costs of other companies 0 0 0 -103 0 -103
Gains and losses on derivative fi nancial instruments and
other fair value adjustments0 0 0 0 0 0
Financial profi t or loss of other companies -2 0 -2 -52 0 -52
Financial profi t or loss -896 -100 -996 -54 -1 -55
Share of profi ts of companies accounted for using the equity
method14 14 27 39 2 41
Consolidated profi t or loss before tax -1,016 -141 -1,157 227 1 227
Income tax 92 43 135 0 0 0
Consolidated profi t or loss from continuing operations -924 -98 -1,022 226 1 227
Net profi t or loss from discontinued operations 0 0 0 0 0 0
Consolidated profi t or loss for the year -924 -98 -1,022 226 1 227
Profi t or loss for the year attributable to non-controlling interest 402 43 445 -6 0 -6
Profi t or loss for the year attributable to the Parent -522 -55 -577 220 1 221
Segment income statement: 2009
(*) R Relating to gains and losses arising from changes in the fair value of derivatives, other fi nancial assets and liabilities and assets and liability impairment (see Note 24). (*) R Relating to gains and losses arising from changes in the fair value of derivatives, other fi nancial assets and liabilities and assets and liability impairment (see Note 24).
consolidated fi nancial statements notes to the consolidated fi nancial statements consolidated fi nancial statements notes to the consolidated fi nancial statements

ferrovial Annual Report 2010 163
(Millions of euros) Other Total
Before fair
value adj.
Fair va-
lue adj.Total
Before fair
value adj.
Fair value
adj.Total
Revenue -66 0 -66 12,232 0 12,232
Other operating income 0 0 0 30 0 30
Total operating income -66 0 -66 12,262 0 12,262
Materials consumed 8 0 8 1,487 0 1,487
Other external expenses -107 0 -107 1,645 0 1,645
Staff costs 62 0 62 3,423 0 3,423
Change in operating provisions 1 1 3 172 1 174
Other operating expenses -28 0 -28 2,939 2 2,941
Total operating expenses -64 1 -63 9,667 3 9,670
GROSS PROFIT OR LOSS FROM OPERATIONS -2 -1 -4 2,595 -3 2,591
Depreciation and amortisation charge 3 0 3 1,005 0 1,005
Profi t or loss from operations before impairment and non-
current asset disposals-5 -1 -7 1,590 -3 1,587
Impairment and disposals of non-current assets 31 -37 -6 -620 -90 -710
Profi t or loss from operations 26 -39 -13 969 -93 876
Finance income of infrastructure projects 0 0 0 45 0 45
Finance costs of infrastructure projects 1 0 1 -1,446 0 -1,446
Gains and losses on derivative fi nancial instruments and
other fair value adjustments0 0 0 0 -148 -148
Financial profi t or loss of infrastructure projects 1 0 1 -1,402 -148 -1,550
Finance income of other companies -12 0 -12 122 0 122
Finance costs of other companies -64 0 -64 -226 0 -226
Gains and losses on derivative fi nancial instruments and
other fair value adjustments0 89 89 0 98 98
Financial profi t or loss of other companies -76 89 13 -103 98 -5
Financial profi t or loss -75 89 14 -1,505 -50 -1,555
Share of profi ts of companies accounted for using the equity
method0 0 0 69 16 85
Consolidated profi t or loss before tax -50 51 1 -467 -127 -594
Income tax 33 -15 18 84 41 125
Consolidated profi t or loss from continuing operations -16 35 19 -383 -86 -469
Net profi t or loss from discontinued operations 0 0 0 0 0 0
Consolidated profi t or loss for the year -16 35 19 -383 -86 -469
Profi t or loss for the year attributable to non-controlling interest -2 0 -2 334 61 395
Profi t or loss for the year attributable to the Parent -19 36 17 -48 -25 -74
The detail, by segment, of revenue in 2010 and 2009 is as follows:
Geographical areas
The breakdown of assets, additions and revenue by geographical area is as follows:
Millions of euros
2010 2009
External salesInter-seg-
ment salesTotal External sales
Inter-seg-
ment salesTotal
Construction 4,310 215 4,525 4,357 119 4,476
Airports 2,794 5 2,799 3,070 0 3,070
BAA 2,790 0 2,790 3,067 0 3,067
Other airports 4 5 9 3 0 3
Toll roads 815 54 869 989 1 990
Services 3,823 73 3,896 3,754 9 3,763
Other and adjustments -11 91 80 -153 86 -67
Total 11,731 438 12,169 12,017 215 12,232
Millions of euros
Total assets
Additions to infrastructure
projects, property, plant and
equipment, intangible assets,
goodwill and companies
accounted for using the equity
method
Revenue
2010 2009 2008 2010 2009 2010 2009
Spain 9,116 9,035 9,187 206 185 3,765 4,350
United Kingdom 22,942 23,458 24,269 1,126 1,018 4,203 4,432
USA 3,894 2,608 2,300 633 164 1,024 797
Canada 2,938 3,263 2,817 2,923 49 384 391
Poland 1,186 982 953 10 5 1,170 779
Chile 39 1,663 1,282 159 0 202 238
Portugal 1,042 1,006 931 89 102 253 222
Rest of Europe 1,969 1,823 1,876 9 19 888 785
Other 162 161 188 13 11 281 237
Total 43,287 43,999 43,804 5,167 1,552 12,169 12,232
(*) R Relating to gains and losses arising from changes in the fair value of derivatives, other fi nancial assets and liabilities and assets and liability impairment (see Note 24).
consolidated fi nancial statements notes to the consolidated fi nancial statements consolidated fi nancial statements notes to the consolidated fi nancial statements

ferrovial Annual Report 2010 165
In addition to the information by geographical area included in this Note,
further information is provided in the following notes:
• Note 7 contains an detail of infrastructure projects by business seg-
ment and, for the main groups of separate projects, by geographi-
cal segment.
• Note 19 contains a detail of the net cash position, distinguishing
between infrastructure projects and other companies, including a
breakdown by segment for the two areas.
• Note 31 contains a detail of cash fl ows, distinguishing between in-
frastructure projects and other companies, including a breakdown
by segment for the two areas.
5. Goodwill and acquisitionsThe changes in “Goodwill”, by segment, in 2010 were as follows: sido el
siguiente:
The most signifi cant change is in the Airports Division (BAA) due to the
impairment of “other airports” amounting to EUR 293 million (impact
on Ferrovial’s net profi t of EUR -162 million) and to the sale of Naples
airport, as a result of which goodwill amounting EUR 75 million was
derecognised.
In the Services Division the main change related to the transfer of Swis-
sport to “held for sale”, as a result of which goodwill totalling EUR 646
million was derecognised.
In the Toll Roads Division, the main changes were due to the reclassifi ca-
tion of the goodwill of Trados 45 (EUR 6 million) to “assets held for sale”
and to the derecognition of the goodwill associated with the 407-ETR
toll road, (EUR 1,081 million), a company that started to be accounted
for using the equity method, as described in Notes 2, Changes in the
scope of consolidation, and 9, Investments in associates.
The following section describes the methodology and assumptions used
in the impairment tests.
A. Goodwill of BAA:
The goodwill is the excess amount paid to acquire BAA over the value of
the assets at the acquisition date (June 2006), representing the long-
term growth potential of the business, based on expectations of signifi -
cant additional investments that will allow considerable traffi c growth in
the coming years.
The recoverable amount of the airports was calculated as the higher of
fair value less estimated costs to sell and value in use. Value in use was
calculated by discounting projected cash fl ows, based on the business
plan for each airport until 2056, using the Adjusted Present Value (APV)
method. The Company considers that this is the minimum period neces-
sary for a discounted cash fl ow model to refl ect the huge growth poten-
tial of this infrastructure, involving major investments, and that this is
the methodology that best refl ects the value in use of this business. The
cash fl ows were discounted to the middle of the period and the residual
value applied in the fi nal year modelled was calculated using the Gordon
Shapiro formula and a perpetuity growth rate of 1.5%.
The business plan calculations for Heathrow airport were obtained by
applying the Building Blocks methodology used by the UK airport regu-
lator CAA (Civil Aviation Authority) and the UK’s Competition Commis-
sion. Under this methodology, the profi tability of these regulated assets
is determined by the Regulated Asset Base (RAB), the future Capital In-
vestment Programme and the return on assets. The regulator stipulated
in its decision of March 2008 (Heathrow) the aeronautical charges for
the following fi ve-year period, based on a return on assets (before taxes
and infl ation) of 6.2% for Heathrow. Return on assets increases from the
sixth fi ve-year period onwards, in line with the latest decisions in regu-
lated sectors in the United Kingdom.
As a result of the position of the new government in the United Kingdom
with regard to development of the third runway at Heathrow, the busi-
ness plans were updated, assuming a fi ve year delay in the construc-
tion of Heathrow’s third runway, with respect to the assumptions used
in the December 2009 impairment tests. The Company considers this
to be reasonable for Heathrow because, in its opinion, long-term de-
mand projections for the south east of England support the need for new
runways or making signifi cant alternative investments, and there are
currently no feasible alternatives at Heathrow for satisfying the above-
mentioned increased demand. At any rate, if a scenario were chosen in
which the third runway were not built, the goodwill relating to Heath-
row would not become impaired. In the Company’s opinion, there are no
reasonable changes in the main assumptions that would eliminate the
excess recoverable amount of Heathrow or the need to recognise an ad-
ditional impairment loss for the other airports.
The deleveraged discount rates (Ku) used to value Heathrow airport are
consistent with the return on RAB used to project the cash fl ows, and
was adjusted on the basis of recent short-term infl ation estimates. From
2015 onwards, the deleveraged discount rate is 8.14%, with an infl ation
of 2.75%. The tax shield of the debt was discounted using the cost of the
debt.
The projections for the other airports refl ect the best estimates in terms
of the evolution of passenger traffi c and charges, taking into account the
negative evolution of passengers witnessed in 2010, and in terms of in-
vestments, where the investment volume was considerably reduced with
respect to 2009, including most notably the discontinuation of invest-
ments in Stansted’s second runway, based on the position announced by
the British government.
The deleveraged discount rates (Ku) used to value the other airports
range from 8.6% to 9.6%.
After calculating various diff erent sensitivities and scenarios, an impair-
ment loss of EUR 293 million was recognised for the other airports (EUR
162 million reduction in the net profi t).
Millions of euros
Movements during 2010 Balances at 01/01/10 Exchange rate
Investment
Disposal / Other Impairment Balance at 31/12/10
Airports 3,813 131 -75 -294 3,575
Heathrow 3,102 109 0 0 3,211
Other airports 711 21 -75 -293 364
Services 1,411 116 -638 0 889
Amey 426 15 0 0 441
Cespa 421 0 0 0 421
Swissport 545 101 -646 0 0
Other services 19 0 8 0 27
Construction 169 10 0 0 179
Webber 97 7 0 0 104
Budimex 72 3 0 0 75
Toll roads 1,559 6 -1,176 0 389
Total 6,952 263 -1,889 -294 5,032
consolidated fi nancial statements notes to the consolidated fi nancial statements consolidated fi nancial statements notes to the consolidated fi nancial statements

ferrovial Annual Report 2010 167
B. Services Division goodwill (Amey and Cespa):
Goodwill is tested for impairment in these two business areas by using cash
fl ow projections for a fi ve-year period. The residual value is based on the
cash fl ow for the last year projected, provided this represents a cash fl ow
with no exceptional factors, and the growth rate applied in no case exceeds
the estimated long-term growth rate for the market in which the Company
operates.
Cash fl ows are discounted using a rate based on the weighted average cost
of capital (WACC) for this type of assets. Ferrovial used a market premium of
5.5%, based on recent studies of long-term premiums. Additionally, in or-
der to refl ect each company’s exposure, backlogs of comparable companies
were selected to carry out regression analyses and obtain deleveraged be-
tas. The betas obtained were compared with other sources habitually used
by analysts and investment banks (Barra Beta, Bloomberg, etc.).
The projected fl ows are based on the latest estimates approved by the
Company, which take into account recent historical data.
The discount rates (WACC) used to test for impairment range from 6.7% to
7.6% (compared with the rates of the prior year that ranged from 6.8% to
7.2%) and perpetuity growth rates (g) ranged from 2.0% to 3.0%
Sensitivity analyses are performed on this goodwill, particularly in relation
to the gross profi t from operations, the discount rate and the perpetuity
growth rate, so as to ensure that possible changes in the estimate do not
have an impact on the possible recovery of the goodwill recognised.
The Company’s consider that there are no reasonable changes in the main
assumptions that would eliminate the excess recoverable amount.
C. Construction Division goodwill (Budimex and Webber):
As Budimex is listed on the Warsaw Stock Exchange, its possible impairment
was analysed by verifying that the closing share price was higher than the
carrying amount plus the goodwill allocated to it. At 2010 year-end there
was a considerable excess. The market value of Ferrovial’s interest in Budi-
mex (59.1%) was EUR 379 million at 31 December 2010.
In the case of Webber, the method used was similar to the method applied
for the services companies, consisting of a discount rate (WACC) of 8.5%
(compared with 8.6% for December 2009) and a perpetuity growth rate
of 2.0%.
The projected cash fl ows are based on the latest estimates approved by the
Company, which take into account recent historical data. Growth in sales
and the other operating variables were projected on the basis of the back-
log.
Sensitivity analyses are performed on Webber’s goodwill, particularly in
relation to the gross profi t from operations, the discount rate and the per-
petuity growth rate, so as to ensure that possible changes in the estimate
do not have an impact on the possible recovery of the goodwill recognised.
The Company considers that there are no reasonable changes to the main
assumptions that would eliminate the excess recoverable value.
D. Toll Roads Division goodwill:
The recoverable amount of the toll roads was calculated as the higher of
fair value less estimated costs to sell and value in use. The value in use of
concession operators with an independent fi nancial structure and limited
duration was calculated by discounting projected cash fl ows for the share-
holder to the end of the concession term. The Company considers that value
in use must be obtained using models that cover the entire concession term,
as the assets are in diff erent phases of investment and growth and there
is suffi cient visibility to use a specifi c economic and fi nancial plan for each
phase during the concession term. No residual value is considered to exist in
these valuations. The projections were updated based on the historical evo-
lution and specifi c features of each asset, using sophisticated, long-term
modelling tools to estimate traffi c, extraordinary maintenance, etc. These
models or tools for traffi c estimation use variables obtained largely from
public sources (evolution of GDP, infl ation, population, car ownership, status
of alternative roads, etc.), and there are also specifi c models for estimating
extraordinary maintenance based on various diff erent variables (road sur-
face condition, expected traffi c, etc.).
The forecast cash fl ows for the shareholder are discounted at an estimated
cost of capital (ranging from 8.90% to 11.87%) based on a risk-free rate
referenced to a 30-year bond, taking into account the location of each con-
cession operator, a beta coeffi cient refl ecting the company’s leverage and
asset risk, and an estimated market premium of 5.5%.
For toll roads where there is goodwill, mainly Autema, Chicago, the possible
impairment was calculated by comparing the company’s carrying amount
(equity plus net goodwill) with its value in use obtained by discounting cash
fl ows, as described above.
No evidence of the impairment of this goodwill was identifi ed. The Com-
pany considers that are no reasonable changes in the main assumptions
that would eliminate the excess recoverable amount.
6. Intangible assetsIt should be noted that “Intangible Assets” does not include the intan-
gible assets assigned to infrastructure projects, which are included un-
der “Concession Infrastructure” (see Note 7). The rights on concessions
included under this caption are not assigned to any specifi c debt relating
to these projects.
The changes in “Intangible Assets” in the consolidated balance sheet in
2010 were as follows:
Millions of euros
CHANGES IN 2010
Rights on
Conces-
sion
Other
intangible
assets
TOTAL
Investment:
Balance at 01/01/10 98 39 137
Additions 12 2 14
Disposals -8 0 -8
Changes in the scope of con-
solidation and transfers117 0 117
Reclassifi cation to “held for
sale”-90 -10 -100
Exchange rate eff ect 15 2 17
Balance at 31/12/10 144 33 177
Accumulated amortisation:
Balance at 01/01/10 -67 -25 -92
Charge for the year -12 -2 -14
Disposals 0 0 0
Changes in the scope of con-
solidation and transfers-31 0 -31
Reclassifi cation to “held for
sale”61 9 70
Exchange rate eff ect -11 -2 -13
Balance at 31/12/10 -60 -20 -80
Carrying amount at 31/12/10 84 13 97
consolidated fi nancial statements notes to the consolidated fi nancial statements consolidated fi nancial statements notes to the consolidated fi nancial statements

ferrovial Annual Report 2010 169
The main change in this caption relates to the “Changes in the Scope of
Consolidation”. The additions include the intangible assets of Amey-Ces-
pa amounting to EUR 27 million arising from the acquisition of Donarbon
(see Note 1.2) and the disposals include the assets of Tube Lines, which
had a net carrying amount of EUR 30 million due to the sale of this Com-
pany. In the framework of the sale of Tube Lines, Amey will continue to
provide Tube Lines with support services for maintenance management
under the Opex Secondment Agreement, under very similar terms to
the current terms. Noteworthy, in this regard, is the reclassifi cation to
this heading of intangible assets associated with these services for a net
amount of EUR 83 million, which had previously been recognised under
“Concession Infrastructure”.
Also the intangible assets of Swissport amounting to EUR 31 million were
transferred to “Assets Classifi ed as Held for Sale” (see Note 12).
The changes in “Intangible Assets” in the consolidated balance sheet in
2009 were as follows:
Millions of euros
Changes in 2009
Rights on
Conces-
sion
Other
intangible
assets
TOTAL
Balance at 01/01/09 101 39 140
Additions 4 4 8
Disposals 0 -5 -5
Changes in the scope of con-
solidation and transfers
Reclassifi cation to “held for
sale”-7 0 -7
Exchange rate eff ect 0 1 1
Balance at 31/12/09 98 39 137
Accumulated amortisation:
Balance at 01/01/09 -53 -24 -77
Charge for the year -15 -3 -18
Disposals 0 3 3
Changes in the scope of con-
solidation and transfers0 0
Reclassifi cation to “held for
sale”1 0 1
Exchange rate eff ect 0 -1 -1
Balance at 31/12/09 -67 -25 -92
Carrying amount at 31/12/09 31 14 45
• The only signifi cant intangible asset with an indefi nite useful life is
the BAA Group’s right to operate certain non-regulated airports,
which arose in the business combination relating to the acquisition of
that Group. As indicated in Note 7, this asset is not recognised under
“Intangible Assets” but rather under “Concession Infrastructure”.
• At 31 December 2010, there were no signifi cant intangible assets
subject to ownership restrictions or pledged to secure liabilities.
• No. impairment losses on intangible assets were recognised or re-
versed in 2010.
The internally generated intangible assets of BAA are disclosed separ-
tely in Note 7.
Millions of euros
Changes in 2010Balance at
01/01/10
Changes in
the scope of
consolidation
AdditionsDisposals and
transfers
Exchange rate
eff ect
Balance at
31/12/10
Intangible asset model IFRIC 12
TOLL ROADS
407 ETR International 2,936 -3,311 375 0
Spanish toll roads 2,408 74 -1 0 2,481
US toll roads 1,606 626 -177 108 2,163
Other toll roads 1,181 87 -383 0 885
Investment in toll roads 8,131 -3,311 787 -561 483 5,529
Amortisation/Impairment -914 71 -245 478 -59 -669
Net investment in toll roads 7,217 -3,240 542 -83 424 4,860
SERVICES
Amey 117 -122 4 -1
Autovía de Aragón 40 46 -14 0 72
Other services 35 23 1 0 59
Investment in services 192 69 -135 4 130
Amortisation/Impairment -37 0 39 -1 1
7. Concession in infrastructure 7.1 Overall information on concession infrastructure
The detail, by project, of “Concession Infrastructure” and of the changes
therein in 2010 and 2009 is as follows:
consolidated fi nancial statements notes to the consolidated fi nancial statements consolidated fi nancial statements notes to the consolidated fi nancial statements

ferrovial Annual Report 2010 171
Millions of euros
Changes in 2010Balance at
01/01/10
Changes in
the scope of
consolidation
AdditionsDisposals and
transfers
Exchange rate
eff ect
Balance at
31/12/10
Net investment in services 155 69 - 96 3 131
Total investment 8,323 -3,311 856 -696 487 5,659
Total amortisation/impairment -951 71 -245 517 -60 -668
Total net investment 7,372 -3,240 611 -179 427 4,991
Other infrastructure projects
Airpots
BAA 21,079 1,085 -232 738 22,670
Other airports 8 0 0 1 9
Total investment 21,087 1,085 -232 739 22,679
Amortisation/Impairment – BAA -4,830 -1,262 109 -166 -6,149
Amortisation/Impairment – Other airports -8 -1 -9
Total amortisation/impairment -4,838 -1,262 109 -167 -6,158
Total net investment 16,249 -177 -123 572 16,521
Total investment 29,410 -3,311 1,941 -928 1,226 28,338
Total amortisation/ impairment -5,789 71 -1,507 626 -227 -6,826
Total investment 23,621 -3,240 434 -302 999 21,512
The evolution of the euro exchange rate against the currencies of the
countries in which there are signifi cant investments in concession infra-
structure (mainly the pound sterling) in 2010 gave rise to a net increase
of EUR 999 million in these balances (EUR 1,366 million at 31 December
2009).
The most signifi cant changes in 2010 were as follows:
• Toll Roads Division: the main change relates to the derecognition from
this heading of the assets in the Canadian 407 ETR toll road, as a re-
sult of the sale of 10% of that company, as described in Note 1.2, which
started to be accounted for using the equity method.
As regards the toll roads in the United States, there were signifi cant in-
creases in the assets of the SH 130 (EUR 298 million), North Tarrant Ex-
press (EUR 173 million) and LBJ (EUR 126 million) toll roads, currently
under construction.
The main changes in relation to the other toll roads arose in Portugal,
with additional investments totalling EUR 80 million in Euroscut Azores,
a toll road under construction. Auto-Estradas Norte was reclassifi ed to
“Other Non-current Financial Assets” for a net amount of EUR 325 mil-
lion, after the renegotiation of its concession contract with the Portu-
guese government in July 2010. Under the new agreement, the conces-
sion is now a payment for an availability model and the fi nancial asset
model provided for in IFRIC 12 is applied.
Additionally, applying the method described in Note 5.D, an impairment
loss was recognised on for investments in toll roads amounting to EUR
186 million (with an impact of EUR -137 million on the net profi t,) relating
essentially to the portfolio of Spanish toll roads and other European toll
roads, due to the negative evolution of traffi c in 2010 and the updating
of the long-term assumptions for these toll roads.
• Airports Division: the most signifi cant additions relate to the BAA
Group, amounting to EUR 1,085 million, of which EUR 958 million re-
late to additions of non-current assets in the course of construction, as
analysed later.
The changes in these assets in 2009 were as follows:
Millions of Euros
Movements during 2009Balance at
01/01/09
Changes in
the scope of
consolidation
AdditionsDisposals and
transfers
Exchange rate
eff ect
Balance at
31/12/09
Intangible asset model IFRIC 12
TOLL ROADS
407 ETR International 2,545 48 343 2,936
Spanish toll roads 2,377 34 -3 2,408
US toll roads 1,495 155 -44 1,606
Other toll roads 1,096 93 -8 1,181
Investment in toll roads 7,513 0 330 -11 299 8,131
Amortisation/Impairment -761 -106 43 -90 -914
Net investment in toll roads 6,752 0 224 32 209 7.217
SERVICES 0
Amey 109 8 117
Autovía de Aragón 0 28 12 40
Other services 39 -4 35
Investment in services 148 32 12 192
Amortisation/Impairment -28 -9 -37
Net investment in services 120 23 12 155
consolidated fi nancial statements notes to the consolidated fi nancial statements consolidated fi nancial statements notes to the consolidated fi nancial statements

ferrovial Annual Report 2010 173
Millions of Euros
Movements during 2009Balance at
01/01/09
Changes in
the scope of
consolidation
AdditionsDisposals and
transfers
Exchange rate
eff ect
Balance at
31/12/09
Total investment 7,661 0 362 1 299 8,323
Total amortisation/impairment -789 0 -115 43 -90 -951
Total net investment 6,872 0 247 44 209 7,372
Other infrastructure projects
Airports
BAA 18,842 7 984 -209 1,455 21,079
Other airports 6 1 1 8
Total investment 18,848 8 984 -209 1,456 21,087
Amortisation/Impairment – BAA -3,875 -724 67 -298 -4,830
Amortisation/Impairment – Other airports -6 -1 -1 -8
Total amortisation/impairment -3,881 -1 -724 67 -299 -4,838
Total net investment 14,967 7 260 -141 1,157 16,249
Total investment 26,509 8 1,346 -208 1,755 29,410
Total amortisation/ impairment -4,670 -1 -839 110 -389 -5,789
Total investment 21,839 7 507 -98 1,366 23,621
Changes in 2010
Millions of EurosTerminals
Runways
and related
land
Plant and
equipment
Other land
and struc-
tures
Railway
assets
Property,
plant and
equipment in
the course of
construction
Total
Cost
Balance at 01/01/10 11,571 1,923 361 139 1,572 1,516 17,082
Additions 13 0 15 0 0 958 986
Transfers to investment property -1 0 0 6 0 -125 -120
Transfers to completed assets 239 149 44 2 7 -442 -1
Capitalised refi nancing costs 0 0 0 0 0 27 27
Disposals -22 -1 -21 -1 0 0 -45
Other transfers -119 -9 -30 -8 0 -53 -219
Exchange diff erences 402 68 10 4 55 52 591
Balance at 31/12/10 12,083 2,130 379 142 1,634 1,933 18,301
Depreciation/impairment 0
Balance at 01/01/10 -3,482 -563 -115 -62 -305 34 -4,493
Additions -447 -69 -64 -9 -47 0 -636
Impairment -174 -174
Disposals and transfers 41 5 30 2 0 0 78
Exchange diff erences -120 -20 -3 -2 -11 1 -155
Balance at 31/12/10 -4,008 -647 -152 -71 -363 -139 -5,380
Carrying amount at 31/12/10 8,075 1,483 227 71 1,271 1,794 12,921
With the exception of BAA, which is owned, the other assets are held
under concessions. The changes relating to BAA are explained in more
detail below.
• In the case of the infrastructure projects, all the assets secure the
company’s debt, as explained in Note 19.
• The interest capitalised during the year is detailed in Note 28.
7.2 Detail of investments in BAA infrastructure projects
The detail of the BAA Group’s project assets by nature is as follows:
A.Property, plant and equipment
The changes in these assets in 2010 were as follows:
During 2010 signifi cant investments amounting to EUR 986 million were
recognised, mainly under “Property, Plant and Equipment in the Course
of Construction”. These additions include most notably the investment
made in Heathrow airport amounting to EUR 954 million (GBP 818 mil-
lion) and in Stansted airport for EUR 26 million (GBP 22 million). The in-
vestment made in Heathrow involves mainly work performed on Termi-
nal 2 and its satellite building, as well as Terminal 5C. Other investments
made relate to the baggage transport tunnel between Terminals 3 and
5, the renovation of the Terminal 3 furnishings and access improvements
for the Airbus 380.
Also, property, plant and equipment in the course of construction were
transferred to their respective completed asset captions (EUR 442 mil-
lion) relating mainly to balances pertaining to Heathrow airport totalling
EUR 327 million (GBP 280 million), Stansted airport totalling EUR 28 mil-
lion (GBP 24 million) and Edinburgh airport totalling EUR 27 million (GBP
23 million). In 2010, EUR 125 million (GBP 107 million) relating to invest-
ments made to develop runways were also transferred to “Investment
Properties”, as it was considered that this investment will be recovered by
leasing out or selling the related assets.
consolidated fi nancial statements notes to the consolidated fi nancial statements consolidated fi nancial statements notes to the consolidated fi nancial statements

ferrovial Annual Report 2010 175
Additionally, as a result of the stance of the new British Government in
relation to the development of the third runway at Heathrow and the
second runway at Stansted (SG2), the company recognised an impair-
ment loss of GBP 149 million (EUR 174 million with an impact of EUR -97
million on the net profi t of Ferrovial) under “Concession Infrastructure”
in relation to development expenditure on projects that had hitherto
been capitalised. Most of this expenditure continues to form part of the
RAB (Regulatory Asset Base), which is the basis used to calculate charges
and, therefore, its recoverability is not aff ected by this value adjustment.
This impairment loss was recognised because the applicable accounting
regulations restrict the possible registration of regulatory assets of this
nature.
The exchange rate eff ect gave rise to a signifi cant increase in this cap-
tion, for a net amount of EUR 436 million (882 million at 31 December
2009), due to the change in the EUR/GBP exchange rate during the year,
as indicated in Note 3.2.
The changes in these assets in 2009 were as follows:
Changes in 2010 AirportsAssets in
progressTotal
COST
Balance at 1 January 2010 2,981 10 2,991
Additions 86 0 86
Transfers of completed assets 3 -3 0
Other transfers 121 121
Exchange diff erences 112 112
Balance at 31 December 2010 3,303 7 3,310
DEPRECIATION/ IMPAIRMENT 0
Balance at 1 January 2010 -190 0 -190
Additions -120 -120
Exchange diff erences -7 -7
Impairment 22 22
Balance at 31 December 2010 -295 -295
Carrying amount at 31 December 2010 3,008 7 3,015
Changes in 2009 Terminals
Runways
and related
land
Plant and
equipment
Other land
and struc-
tures
Railway
assets
Property,
plant and
equipment in
the course of
construction
Total
Cost
Balance at 01/01/09 9,903 1,751 248 115 1,453 1,653 15,123
Changes in the scope of consolidation 0 0 0 0 0 1 1
Additions 8 0 11 0 0 902 921
Transfers to investment property 3 0 0 21 0 -24 0
Transfers to completed assets 988 38 113 7 6 -1,151 1
Capitalised refi nancing costs 0 0 0 0 0 25 25
Disposals -101 -3 -5 -12 0 -1 -122
Exchange diff erences 770 137 14 8 113 121 1,163
Transfers to “assets held for sale” 0 0 -20 0 0 -10 -30
Balance at 31/12/09 11,571 1,923 361 139 1,572 1,516 17,082
Depreciation/impairment
Balance at 01/01/09 -2,900 -467 -65 -56 -240 28 -3,700
Additions -455 -63 -59 -7 -46 0 -630
Disposals and transfers 98 3 4 5 0 3 113
Exchange diff erences -225 -36 -3 -4 -19 3 -284
Transfers to “assets held for sale” 0 0 8 0 0 0 8
Balance at 31/12/09 -3,482 -563 -115 -62 -305 34 -4,493
Carrying amount at 31/12/09 8,089 1,360 246 77 1,267 1,550 12,589
p p
B. Investment property
The changes in these assets in 2010 were as follows:
The main changes in 2010 arose from exchange diff erences, amounting
to a net total of EUR 105 million. Additionally, as described in Note 5, the
impairment loss of EUR 22 million recognised for investment property
was reversed under “Impairment and disposals of Non-Current Assets”
(see Notes 24 and 25) (with an eff ect of EUR 8 million on the net profi t).
These assets, though classifi ed as investment property, form part of the
Regulated Asset Base (RAB) of the regulated airports and, therefore,
their fair value is in line with their carrying amount, which is in turn in the
basis used to calculate the RAB.
consolidated fi nancial statements notes to the consolidated fi nancial statements consolidated fi nancial statements notes to the consolidated fi nancial statements

ferrovial Annual Report 2010 177
C. Intangible assets
The two main intangible assets recognised at December 2010 are the
BAA Group’s right to operate certain non-regulated airports (indefi nite
right) and rights to operate commercial space, which are amortised on
a straight-line basis over the term of the concession up to a maximum
of 15 years.
The Company recognised an impairment loss of GBP 248 million in rela-
tion to the intangible asset consisting of the right to operate the other
airports (EUR 289 million, with a negative impact on Ferrovial’s net profi t
of EUR 118 million). This impairment loss was determined using the mea-
surement basis described in Note 5.
Changes in 2009 AirportsAssets in
progressTotal
Cost
Balance at 1 january 2009 2,781 16 2,797
Additions 0 20 20
Transfers of completed assets 27 -27 0
Disposals -43 0 -43
Other transfers -1 1 0
Exchange diff erences 217 0 217
Balance at 31 december 2009 2,981 10 2,991
Depreciation/impairment 0
Balance at 1 january 2009 -82 0 -82
Additions -50 0 -50
Exchange diff erences -6 0 -6
Impairment -53 0 -53
Balance at 31 december 2009 -191 0 -191
Carrying amount at 31 december 2009 2,790 10 2,800
Changes in 2010Operating
rights
Computer
software
ConcessionsContracts
to operate
commercial
space
Other Total
Balance at 1 January 2010
Additions 703 149 0 149 6 1,007
Disposals 22 22
Exchange diff erences -6 -6
Balance at 31 December 2010 25 5 0 5 0 35
AMORTISATION/IMPAIRMENT 728 170 0 154 6 1,058
Balance at 1 January 2010 0
Additions 0 -87 0 -57 0 -144
Disposals 0 -27 -16 -43
Exchange diff erences 6 0 0 0 6
Impairment -2 0 -2 0 -4
Balance at 31 December 2010 -289 -289
Carrying amount at 31 December 2010 -289 -110 0 -75 0 -474
Valor Neto al 31 de Diciembre de 2010 439 60 0 79 6 584
The changes in these assets in 2009 were as follows:
consolidated fi nancial statements notes to the consolidated fi nancial statements consolidated fi nancial statements notes to the consolidated fi nancial statements

ferrovial Annual Report 2010 179
The changes in these assets in 2009 were as follows: 8. Property, plant and equipment “Property, Plant and Equipment” does not include tangible fi xed assets assigned to infrastructure projects, which are classifi ed under “Concession Infrastructure”.
Movements in Property, plant and equipment in the consolidated balance sheet are as follows:
Changes in the scope of consolidation and transfers
In 2010 the main change arose from the transfer of Swissport to assets
held for sale (EUR 123 million) and the inclusion in the scope of consoli-
dation of AmeyCespa (EUR 26 million).
Changes in 2009Operating
rights
Computer
software
ConcessionsContracts
to operate
commercial
space
Other Total
Balance at 1 January 2009
Additions 653 123 0 138 8 922
Disposals 0 20 0 0 0 20
Changes in the scope 0 -5 0 0 -2 -7
Exchange diff erences 0 0 0 0 6 6
Transfers to “assets held for sale” 50 11 0 11 0 72
Balance at 31 December 2009 0 0 0 0 -6 -6
AMORTISATION/IMPAIRMENT 703 149 0 149 6 1,007
Balance at 1 January 2009 0
Additions 0 -55 0 -38 0 -93
Disposals 0 -30 0 -16 0 -46
Exchange diff erences 0 3 0 0 0 3
Transfers to “assets held for sale” 0 -4 0 -3 0 -7
Balance at 31 December 2009 0 0 0 0 0 0
Carrying amount at 31 December 2009 0 -86 0 -57 0 -143
Valor Neto al 31 de Diciembre de 2009 703 63 0 92 6 864
Millions of Euros
Changes in 2010 Land and buildingsPlant and
machinery
Other fi xtures,
tools and furnitureTOTAL
Investment:
Balance at 01/01/10 137 805 801 1,743
Additions 4 36 99 139
Disposals -19 -67 -79 -165
Changes in the scope of consolidation and transfers 12 2 -298 -284
Exchange rate eff ect 5 7 50 62
Balance at 31/12/10 139 783 573 1.495
Accumulated depreciation:
Balance at 01/01/10 -27 -496 -551 -1,074
Charge for the year -2 -55 -71 -128
Disposals 2 58 54 114
Changes in the scope of consolidation and transfers 10 -59 230 181
Exchange rate eff ect -1 -5 -30 -36
Balance at 31/12/10 -18 -557 -368 -943
Carrying amount at 31/12/10 121 226 205 552
Additions
• The additions in the Construction Division related mainly, as in
the prior year, to the acquisition of specifi c site machinery by
Ferrovial Agromán.
consolidated fi nancial statements notes to the consolidated fi nancial statements consolidated fi nancial statements notes to the consolidated fi nancial statements

ferrovial Annual Report 2010 181
Disposals
The disposals related basically to the Services segment, amounting to
EUR 14 million, due to the write-off of fully depreciated assets. Addition-
ally, Cespa disposed of a building valued at EUR 15 million.
• The property, plant and equipment not used in operations are not
material with respect to the ending consolidated balances.
• No impairment losses were recognised or reversed during the year.
• The Group has taken out insurance policies to cover the possible
risks to which its property, plant and equipment are subject and
possible claims that could be brought against it in the ordinary
course of its business. The Group considers that the insurance poli
cies provide adequate coverage for such risks.
• The property, plant and equipment in the course of construction
amounts to EUR 55.2 million (EUR 58.8 million in 2009). This is
due mainly to the increase of property, plant and equipment in the
course of construction of Budimex.
• At 31 December 2010, no signifi cant property, plant and
equip ment were subject to ownership restrictions or pledged to se
cure liabilities.
9. Investments in companies accounted for using the equity methodThe breakdown of the main investments in companies accounted for us-
ing the equity method at 31 December 2010 and 2009 is as follows:
Following is a description of the main changes in the scope of consolida-
tion in the year:
• In the Toll Road Division, the main inclusion relates to the sharehold-
ing in the 407 ETR toll road, which after a 10% divestment carried
out during the year and described in Note 1.2, stands at 43.23% of
this company’s share capital and is accounted for using the equity
method. Its carrying amount totals EUR 2,919 million at 31 Decem-
ber 2010, an amount which includes the fair value of the remaining
interest held by the parent, Cintra Infraestructuras, in the toll road.
As a result of this revaluation and solely for the purpose of calculat-
ing the results of future years, the diff erence between the prior car-
rying amount of its assets and its fair value was added to the carry-
ing amount of the administrative concession and is being amortised
over the concession term based on toll road traffi c. The main fi gures
of this company at 31 December 2010, based on the percentage of
ownership, are as follows:
2010 2009
Saldo inicial 262 285
Variaciones de perímetro 2,776 -3
Participación en el resultado 62 85
Dividendos cobrados
y devoluciones de fondos propios-23 -32
Traspasos a mantenidos para la venta -32 -81
Deterioros -80 0
Otros 3 -10
Diferencias de cambio 142 18
Saldo fi nal 3,110 262
2010
Millions of euros / % of ownership 43.23%
Total assets 2,050
Equity 810
Borrowings 1,733
Revenue 197
EBITDA 158
Net profi t 24
Also included under this heading is the remaining 40% shareholding in
Cintra Chile, after the sale of 60% of that company, as described in Note
1.2, which continues to be held by the Group and which is accounted for
using the equity method. The value of this shareholding at 2010 year-
end was EUR 159 million.
Millions of Euros
Changes in 2009 Land and buildingsPlant and machi-
nery
Other fi xtures, tools
and furnitureTOTAL
Investment:
Balance at 01/01/09 131 747 707 1,585
Additions 4 82 122 208
Disposals -9 -46 -18 -73
Changes in the scope of consolidation and transfers 9 1 -15 -5
Exchange rate eff ect 3 21 5 29
Balance at 31/12/09 138 805 801 1.744
Accumulated depreciation:
Balance at 01/01/09 -24 -439 -501 -964
Charge for the year -2 -47 -77 -126
Disposals 5 30 7 42
Changes in the scope of consolidation and transfers -2 -10 19 7
Exchange rate eff ect -4 -31 1 -34
Balance at 31/12/09 -27 -497 -551 -1,075
Carrying amount at 31/12/09 111 308 250 669
consolidated fi nancial statements notes to the consolidated fi nancial statements consolidated fi nancial statements notes to the consolidated fi nancial statements

ferrovial Annual Report 2010 183
· Additionally, in the Services Division Tube Lines was excluded from
the scope of consolidation, giving rise to a reduction of EUR 131 mi
llion.
The transfers to assets held for sale refl ects the reclassifi cation to that
heading of Trados 45 and Swissport for EUR 21 million and EUR 11 mil-
lion, respectively, as described in Note 12.
Lastly, using the methodology described in Note 5d, an impairment loss
was recognised, with a negative impact of EUR 56 million on the profi t for
the year, relating mainly to the portfolio of Spanish toll roads and other
European toll roads, due to the negative evolution of traffi c during 2010
and to the update of long-term assumptions for these toll roads.
Following is a description of the other most signifi cant shareholdings in-
cluded under this heading:
· The 10% indirect shareholding acquired in Madrid Calle 30, S.A.,
which holds a 35-year concession to refurbish and maintain the M30
urban ring road in Madrid, entailing an investment of EUR 54 million
at 31 December 2010 (EUR 72 million at 31 December 2009).
· Also noteworthy is the 50% shareholding in Indiana Toll Road. In
diana Toll Road’s main fi gures at 31 December 2010 and the per
centage of ownership are as follows:
· Lastly, the Group exercises signifi cant infl uence over certain compa-
nies in which it has an ownership interests of less than 20% and does
not exercise signifi cant infl uence over certain companies in which its
ownership interest exceeds 20%.
There are no signifi cant restrictions on the capacity of associates to
transfer funds to the Parent in the form of dividends, debt repayments
or advances other than such restrictions as might arise from this fi nanc-
ing agreements of those associates or from their own fi nancial situation,
and there are no contingent liabilities relating to associates that might
ultimately be assumed by the Group.
Appendix I shows a list of the main investments of companies accounted
for using the equity method, indicating their name, the country in which
they were incorporated, the business segment to which they belong, the
Group’s percentage of ownership and their most signifi cant fi nancial in-
formation, such as aggregate assets and liabilities, revenue and profi t or
loss for the year.
10. Non-current fi nancial assetsThe detail of the changes in and maturities of the non-current fi nancial
assets at 31 December 2010 and 2009 is as follows:
Note: balances presented net of allowances.
“Infrastructure Project Receivables”
includes fi nancial assets arising from the application of IFRIC 12 and re-
lates mainly to amounts receivable from the government in return for
services rendered or investments made under a concession agreement.
The existing fi nancial assets relate to the concession operators Autopista
Terrasa Manresa, Auto-Estradas Norte and Eurolink M3, amounting
to EUR 479 million, EUR 325 million and EUR 307 million, respectively,
(EUR 451 million, EUR 0 and EUR 307 million in 2009). Also included are
the accounts receivable relating to Concesionaria de Prisiones Lledon-
ers, EUR 76 million (EUR 85 million in 2009), Concesionaria de Prisiones
Figueras, EUR 111 million (EUR 40 million in 2009), and Cespa, EUR 46
million (32 million in 2009).
The increase in 2010 was due mainly to Auto-Estradas Norte (EUR 325
million), which started to renegotiate its concession arrangement with
the Portuguese government on 1 July, which became a payment for
availability arrangement, giving rise to the application of the fi nancial
asset model provided for in IFRIC 12. The remaining increase related to
2010
Millions of euros / % of ownership 50%
Total assets 1,559
Equity -244
Bank borrowings 1,347
Revenue 66
EBITDA 53
Net loss -72
Millions of Euros
Changes in 2010Available-for-sale
fi nancial assets
Infrastructure pro-
ject receivables
Restricted cash
and other non-
current fi nancial
assets
Other receivables TOTAL
Investment:
Balance at 1 January 2010 33 874 554 474 1,935
Additions 534 331 96 961
Disposals 0 -147 -227 -374
Scope changes and transfers -1 -62 -205 -88 -356
Provision 0
Eff ect of exchange rate 2 -2 18 18
Balance at 31 December 2010 34 1,344 551 255 2,184
the accrual of the remaining accounts receivable in the year.
The changes in the scope of consolidation and transfers were due mainly
to the settlement of the subordinated debt between Amey and Tube
Lines totalling EUR 70 million, after its sale in June 2010, which was
considered a cost to sell.
“Restricted Cash and Other Non-Current Financial Assets”
includes guarantee deposits for bond issues, relating mainly to NTE
Mobility Partners LLC (EUR 130 million -EUR 264 million in 2009-) and
Chicago Skyway (EUR 44 million -EUR 36 million in 2009-). The main
increase in this line item relates to the inclusion in the scope of consolida-
tion of the amounts relating to LBJ Infrastructure Group, the concession
operator for the construction, maintenance and management of 21.2 ki-
lometres (13.3 miles) of the LBJ toll road, for EUR 326 million. Also note-
worthy was the decrease of EUR 205 million due to a change in the scope
of consolidation relating to 407 ETR, which was accounted for using the
equity method in 2010 after the divestment of 10% of the shares of that
company, as described in Note 1.2.
consolidated fi nancial statements notes to the consolidated fi nancial statements consolidated fi nancial statements notes to the consolidated fi nancial statements

ferrovial Annual Report 2010 185
The decreases in this line item were due mainly to the concession opera-
tor North Tarrant Express (EUR 133 million) due to the start-up of the toll
road construction work.
Lastly “Other Receivables” includes the following items:
1. Noteworthy in relation to the loans to associates is the long-term
loan of EUR 50 million (EUR 50 million at December 2009) granted by
Ferrovial Servicios to its subsidiary Emesa.
2. Long-term receivables from various municipal councils renegoti-
ated by Cespa amounting to EUR 97 million.
Fair values of the assets
It is considered that the discounted cash fl ows of the assets using a mar-
ket discount rate approximate the carrying amount of the assets. The
diff erence between the carrying amount and fair value of the assets is
therefore not signifi cant.
The changes in these items in 2009, for information purposes, were as
follows:
11. Derivative fi nancial instruments at fair valueA. Description of the main derivative fi nancial instruments
The detail of the derivatives arranged and fair value thereof at 31
December 2010 and 2009, as well as the maturities of the notional
amounts to which the derivatives relate (notional maturities are shown
as positive fi gures and future increases already arranged as negative
fi gures) are as follows:
Millions of Euros
Changes in 2009Available-for-sale
fi nancial assets
Infrastructure pro-
ject receivables
Restricted cash
and other non-
current fi nancial
assets
Other receivables TOTAL
Investment:
Balance at 01/01/09 4 828 290 402 1,524
Additions 17 104 71 0 192
Disposals 0 0 -65 -9 -74
Changes in the scope and transfers 0 -58 271 91 304
Provision 12 0 0 1 13
Eff ect of exchange rate 0 0 -13 -11 -24
Balance at 31/12/09 33 874 554 474 1,935
(*) The items indicated are the main derivatives arranged by the Group that are not considered hedges for accounting purposes, as explained in this note.
Millions of Euros
Fair value Notional maturities
Balances at Balances at 31/12/11 31/12/12 31/12/13 31/12/14
and subse-
quent yearsTotal
notional
amountsType of instrument 31/12/10 31/12/09 31/12/15
ASSET BALANCES 847 861 20 999 -3 760 1,317 3,093
Index-linked swaps BAA (*) 2 32 0 0 0 0 518 518
Interest rate swaps BAA 0 4 0 0 0 0 0 0
Cross currency swaps BAA 641 734 0 1,000 0 750 750 2,500
Index-linked swaps Cintra 190 56 -1 -1 -3 -2 49 42
Equity swaps (*) 13 19 21 0 0 12 0 33
Other derivatives 1 16 0 0 0 0 0 0
Cintra forwards 0 0 0 0 0 0 0 0
Other derivatives 1 16 0 0 0 0 0 0
LIABILITY BALANCES 1,968 1,336 1,354 320 508 1,933 11,066 15,181
Index-linked swaps BAA (*) 345 194 0 0 0 462 3,818 4,280
Interest rate swaps BAA 443 284 0 0 0 1,385 3,120 4,505
Cross currency swaps BAA 22 0 0 0 0 0 500 500
Equity swaps (*) 294 261 111 103 211 0 172 597
Interest rate swaps Cintra 736 486 -87 -5 -7 14 3,229 3,144
Other derivatives 128 111 1,330 222 304 72 227 2,155
Cintra forwards 11 3 187 0 0 0 0 187
Other derivatives 117 108 1,143 222 304 72 227 1,968
NET AND NOTIONAL BALANCES -1,121 -475 1,374 1,319 505 2,693 12,382 18,274
consolidated fi nancial statements notes to the consolidated fi nancial statements consolidated fi nancial statements notes to the consolidated fi nancial statements

ferrovial Annual Report 2010 187
B. Main eff ects on profi t or loss and equity
The changes for accounting purposes in the main derivatives arranged
by fully-consolidated companies, detailing the fair values thereof at 31
December 2010 and 2009, and the impact on reserves, profi t or loss and
other balance sheet items are as follows:
As discussed in Note 2.3.8, derivatives are recognised at market value at
the arrangement date and at fair value at subsequent dates. Changes
in the value of these derivatives are recognised for accounting purposes
as follows:
· The changes in fair value of the derivatives that qualify for hedge
accounting during the year are recognised with a balancing item in
reserves (column I).
· The changes in fair value of the derivatives that do not qualify for
hedge accounting or that are considered to be held for speculative
purposes are recognised as a fair value adjustment in the Group’s
income statement (column II) and are separately refl ected in the in-
come statement (see detail in Note 25).
· “Impacts on Financial Profi t/(Loss)” (column III) refl ects the impact
of fi nancing on fi nancial profi t or loss in respect of interest accrued
during the year.
· “Cash” (column IV) indicates net payments and collections during
the year.
The impact of the diff erence between closing exchange rates at De-
cember 2010 and 2009 is also presented separately (column V).
· Lastly, the “Other Impacts” shows the impacts on profi t or loss from
operations or, in the case of Cross Currency Swaps, the changes in the
debt with regard to the hedged exchange rate (column VI)
BAA derivativesIndex Linked Swaps BAA
BAA has arranged index linked swaps tied to fi xed-rate bonds and, there-
fore, the Company has debt synthetically indexed to infl ation for a total
notional amount of GBP 4,114 million (EUR 4,978 million), of which GBP
1,908 million were arranged in 2010. These derivatives do not qualify
for hedge accounting. The fair value thereof decreased from EUR -162
million in December 2009 to EUR -343 million in December 2010, which
had an impact of EUR -42 million on Ferrovial’s fi nancial loss, as a fair
value adjustment.
Additionally, there were net collections amounting to EUR of 71 million,
which included advances on payment fl ows amounting to EUR 43 million
and EUR 114 million of ordinary settlements. Lastly, period fi nance costs
amounted to EUR 63 million.
Interest Rate Swaps BAA
In order to hedge interest rate risk, BAA contracted interest rate swaps for
a total notional amount of GBP 3,863 million (EUR 4,505 million). These
derivatives are mostly considered to be of cash fl ow hedges/of from bank
borrowings, as explained in Note 24. Only the ineff ective portions of the
hedges or fair value changes in derivatives that do not qualify for hedge
accounting are recognised as fair value adjustments in fi nancial profi t
or loss.
The fair value of these derivatives decreased from EUR -280 million at
December 2009 to EUR -443 million at December 2010, having an im-
pact on reserves of EUR -146 million due to the decrease in UK long-term
interest rates during the year. The expected increase in liabilities aris-
ing solely from the evolution in interest rate curves was partly off set by
the decrease in liabilities resulting from advance payments made during
the year amounting to GBP 74 million (EUR 86 million). Also, ordinary
settlements were made totalling GBP 83 million (EUR 98 million), which
entailed an impact on total cash of EUR -184 million and fi nance costs
on fi nancing of EUR -184 million (EUR -75 million on the net gain or loss
attributed to the Parent) due to the allocation of closed rates for swaps,
higher than market rates, to results. Lastly, the portion of these deriva-
tives not qualifying for hedge accounting had an impact of EUR -7 mil-
lion recognised as a fair value adjustment in Ferrovial’s fi nancial profi t
or loss.
Cross Currency Swaps BAA
BAA has arranged a number of cross currency swaps to hedge the pound
sterling/euro foreign exchange risk on euro bonds issued (see Note 19),
for a total notional amount of GBP 2,137 million, (EUR 3,000 million),
with maturities between 2012 and 2018. The fl uctuations in the ex-
change rates between December 2009 and December 2010 on the
total notional amount gave rise to an impact on the balance sheet of
EUR -94 million (“Other Impacts”), which off sets the change in value of
the eurobonds that constitute the underlying. The inclusion of these CCS
denominated in pound sterling in Ferrovial’s consolidated balance sheet
gave rise to an impact as a result of the exchange rate of EUR +26 million.
Furthermore, net collections amounting to EUR 69 million were recog-
nised (“Cash”), and there was an impact on fi nancial profi t or loss from
fi nancing totalling EUR 32 million, due mainly to the foreign currency
hedges on the interest accrued from the bonds.
Fair value Breakdown of movements
Instrument type
Balan-
ce at
31/12/10
Balan-
ce at
31/12/09
Varia-
tion
Impact on
reserves (I)
Impact on
profi t or
loss, fair
value (II)
Impact on
fi nancial
profi t/loss
(III)
Cash
(IV)
Ex-
change
rate (V)
Other impacts
on the
balance sheet
or income
statement (VI)
TOTAL
Index linked Swaps
BAA-343 -162 -181 0 -42 -63 -71 -5 0 -181
Interest Rate Swaps
BAA-443 -280 -163 -146 -7 -184 183 -9 0 -163
Cross Currency Swaps
BAA619 734 -115 6 -16 32 -69 26 -94 -115
Index linked Swaps
Cintra190 56 134 133 1 1 -1 0 0 134
Interest rate swaps
Cintra-736 -486 -250 -214 0 -94 100 -22 -20 -250
Equity swaps -281 -242 -39 12 -39 -9 9 0 -12 -39
Other derivatives -127 -95 -32 -16 19 -25 32 -19 -23 -32
Cintra forwards -11 -3 -8 -7 0 0 0 0 -1 -8
Other derivatives -116 -92 -24 -9 19 -25 32 -19 -22 -24
Total -1,121 -475 -646 -225 -84 -342 183 -29 -149 -646
consolidated fi nancial statements notes to the consolidated fi nancial statements consolidated fi nancial statements notes to the consolidated fi nancial statements

ferrovial Annual Report 2010 189
Other hedges arranged by BAA
BAA has equity swaps relating to Ferrovial’s share-based payment (see
Note 34). These swaps do not qualify for hedge accounting and, there-
fore, the fair value thereof is recognised as a fair value adjustment in
Ferrovial’s fi nance income (see Note 24). The measurement of the equity
swaps held by BAA at fair value gave rise to fi nance costs of EUR 9 mil-
lion (EUR -4 million in the net profi t or loss), recognised as a fair value
adjustment.
Toll Road division derivativesIndex Linked Swaps Cintra
In 2009 Autema arranged an index linked swap to hedge income vari-
ability, for which an annual CPI of 2.50% was established. This hedge
is deemed to be eff ective and had a gross impact on reserves of EUR 133
million.
Interest rate swaps Cintra
In order to hedge the interest rate risk in its infrastructure projects, Cintra
arranged interest rate hedges on the projects’ debt, establishing a fi xed
or increasing interest rate for a total notional amount of EUR 3,143 mil-
lion at 31 December 2010.
Taken as a whole, measurement at fair value of these hedges fell from
EUR -486 million in December 2009 to EUR -736 million, due to the
overall drop in long-term interest rates. This eff ect is clearly evident in
the derivative instruments arranged to hedge the project debt in the US
(mainly Chicago and SH130), where derivative instrument valuations
have decreased from EUR -334 million in December 2009 to EUR -531
million in December 2010. The other derivative instruments of this kind
(mainly to hedge the interest rate risk in Spanish toll roads) arranged
by Cintra suff ered change in fair value of EUR -151 million in December
2009 to EUR -205 million in December 2010.
Since these derivatives are considered to be totally eff ective, the changes
in fair value had negative impact on reserves of EUR 214 million, while
the changes in settlements and accruals had an impact of EUR -94 mil-
lion on the fi nancial profi t or loss and a net outfl ow of cash totalling EUR
100 million.
ITR Concession Company -a company accounted for using the equity
method- has an interest rate hedge for a notional amount of EUR 1,368
million maturing in 2026, in relation to which an increasing interest rate
between 3.4% at 31 December 2010 and 11.29% at maturity was es-
tablished. The changes in long-term interest rates in the US gave rise to
changes in the fair value of this derivative from EUR -313 million at 31
December 2009 to EUR -454 million at 31 December 2010.
Cintra forwards
Of particular note in this section are the hedges based on forward con-
tracts −in relation to the Canadian dollar− of a portion of the amount
of the dividends expected to be received in 2011, and the amount of the
sale of 10% of Cintra’s ownership interest in the ETR-407 amounting to
CAD 114 million.
Equity SwapsThe derivatives include equity swaps arranged by the Group solely to
hedge the impact on equity of its stock option plans, as described in Note
3.5 on market risk.
These equity swaps do not qualify for hedge accounting. Related gains
or losses are recognised as a fair value adjustment (see Note 24) in fi nan-
cial profi t or loss, which at 31 December 2010 represented an expense of
EUR 39 million for the consolidated Group, of which EUR 9 million relate
to BAA. Note 33 on “Share-Based Payment” contains a breakdown and
description of these equity swaps.
Other derivatives“Other derivatives” primarily relates to the following instruments:
- Ferrovial interest rate swaps, with a fair value of EUR -76 million at 31
December 2010 (EUR -88 million at 31 December 2009) and a notional
amount of EUR 787 million and a fi xed interest rate of 5.2525%. These
derivatives were arranged to hedge possible fl uctuations in interest rates
on the syndicated loan obtained by Ferrovial Infraestructuras to fi nance
the acquisition of the BAA shares. With the merger transactions of Fer-
rovial Infraestructuras and Grupo Ferrovial S.A. and the refi nancing
transaction to refi nance the corporate debt in 2009 one of the three de-
rivative instruments around which this hedge is structured in, for a total
notional amount of GBP 225 million, no longer qualifi es for accounting,
and al changes in the fair value thereof are recognised in the consoli-
dated Group income statement as a fair value adjustment. In order to
hedge this impact, during the fi rst quarter of 2010 the Group arranged a
derivative instrument to “mirror” the previous one for the same notional
amount and with the same maturities, also considered to be for specu-
lative purposes. Both derivative instruments gave rise to a loss of EUR
-6 million in the consolidated Group income statement as a fair value
adjustment. Additionally, the accrual of ordinary settlements of the por-
tion of this hedge qualifying for hedge accounting gave rise to a fi nance
cost on fi nancing totalling EUR 36 million, and a cash outfl ow of EUR 47
million.
- Services Division Interest rate swaps, consisting mainly of the con-
tract relating to the Nacional II (Autovía de Aragón) road. This hedge
was arranged in 2009 in relation to interest rates on debt, representing
a notional amount of EUR 102 million and with a fi xed interest rate of
4.7640%.
- Services Division Currency forwards, the Group arranged Euro / Swiss
franc currency forwards at fair value of EUR 15 million, and a notional
amount of EUR 466 million, to hedge the foreign currency risk relating to
the sale price of Swissport. This transaction that was completed in early
2011, as described in Note 37.
C. Hedge measurement methods
On 1 July 2009, Ferrovial S.A. decided to adopt the amendments to IFRS
7 pursuant to which the signifi cance of each of the Company’s derivatives
must be described in accordance with a fair value measurement hier-
archy.
This hierarchy establishes three categories, based on the items used to
calculate fair value:
- LEVEL 1.Quoted prices (unadjusted) in active markets for identi
cal assets or liabilities.
- LEVEL 2.Inputs other than quoted prices included within Level 1
that are observable for the asset or liability, either directly (i.e. as
prices) or indirectly (i.e. derived from prices); and
- LEVEL 3.Inputs for the asset or liability that are not based on ob
servable market data (unobservable inputs).
All Ferrovial S.A.’s derivative fi nancial instruments and other fi nancial
instruments carried at fair value are included in LEVEL 2 of the fair value
measurement hierarchy.
The valuations performed by the company are in any event compared
against the valuations received from the counterparty banks, on a
monthly basis.
Equity swaps are measured as the sum of the diff erence between the
market price thereof on the calculation date and the unit settlement
price agreed at inception, multiplied by the number of swaps, and the
present value of the fi nance cost agreed upon in the contract.
The other instruments were measured by quantifying the net future pay-
ment and collection fl ows, discounted to the present value, with the fol-
lowing specifi c features:
· Interest rate swaps: these future cash fl ows with fl oating reference
rates are estimated by using current market assessments of the time
value of money; and each fl ow is updated using the market zero-
coupon rate in accordance with the settlement period and currency
in question at the measurement date.
· Cross currency swaps: discount curves existing on the market at the
measurement date for each period, currency and credit profi le are
used to project cash fl ows. Those fl ows with a fl oating reference rate
are estimated by using implicit curves that refl ect the future behav-
iour as perceived by the market at the measurement date; and the
present value of fl ows from collections and payments is calculated
using the discount exchange rate existing at the measurement date
based on the period and currency.
· Index linked swaps: these future cash fl ows are estimated by pro-
jecting the future implicit behaviour of the curves as perceived by
the market on the measurement date, for both reference inter-
est rate and for reference infl ation rates. As in the cases described
above, discount rates are used for each settlement period of the
fl ows and currencies, obtained at the measurement date.
consolidated fi nancial statements notes to the consolidated fi nancial statements consolidated fi nancial statements notes to the consolidated fi nancial statements
D. Net investment in foreign operations
As indicated in Note 3.2, where the decision is taken to fi nance a portion
of an investment in the share capital of foreign operation using specifi c
debt arranged by the Group companies that invest in the share capital of
projects, the debt is usually obtained in the same currency as the project
and acts as a natural hedge of foreign currency.
Net investments in foreign operations include exchange diff erences aris-
ing from the monetary item that forms part of the investment and are
recognised in equity as translation diff erences.
In order to achieve a natural hedge of its investment in BAA, in the fi rst
quarter of 2010 the Parent Ferrovial S.A. redenominated a portion of
its new euro borrowings into pound sterling. At 31 December 2010 this
portion amounted to GBP 699 million (EUR 815 million) (see Note 19).

ferrovial Annual Report 2010 191
12. Non-current assets and liabilities classifi ed as held for saleThe changes in the assets and liabilities classifi ed as held for sale in the
year ended 31 December 2010 were as follows:
Assets and liabilities classifi ed as held for sale include assets or liabilities
that will foreseeably be sold within one year, as described in Note 2.3.12.
At 31 December 2010, assets and liabilities classifi ed as held for sale
relate mainly to the Services Division, specifi cally to Swissport. Also in-
cluded is the ownership interest held in the concession operator Trados
45 in the Toll Roads Division.
Following is a description of the main changes in assets and liabilities
classifi ed as held for sale.
Airports Division:
• On 22 June a sale transaction was completed in which BBA’s owner
ship interest in Airport Property Partnership (APP) was sold for GBP
244 million (EUR 298 million), giving rise to a net gain of GBP 11
million (EUR 12 million).
• On 30 July BAA USA was sold for a USD 50 million (EUR 38 million),
giving rise to a gross gain of EUR 7 million (net gain of EUR 1 million).
Toll Roads Division:
• At 31 December 2010, this heading include the 50% interest that
Cintra Infraestructuras held in Trados 45, a concession holder ope
rating the shadow toll on a stretch of the Madrid M-45 toll ring
road; this sale was completed on 21 January 2011. The transaction
totalled EUR 68 million and gave rise to a net gain of EUR 27 m
illion.
• Lastly, on 15 September 2010 Cintra Infraestructuras entered into
an agreement to sell a 60% ownership interest in Cintra Concesio
nes de Infraestructuras de Transporte de Chile Limitada (Cintra Chi
le). The transaction totalled approximately CLF 7 million develop
ment units (EUR 220 million).
Services Division:
• In November 2010 Ferrovial Servicios, S.A. entered into an agree
ment to sell all of the shares held in the share capital of Swissport
International AG, the Parent of the Swissport Group. The transac
tion totalled CHF 900 million (EUR 695 million). As stated in Note
37 “Events after the Reporting Period”, the transaction was com
pleted in February 2011.
• Also of note was the reclassifi cation of the assets and liabilities
associated with Cespa Portugal to the corresponding headings, as
the Company interrupted the sale process involving this company.
• Amey-Cespa classifi ed its ownership interest in Donarbon
Waste Management Ltd., amounting to EUR 13 million net, as held
for sale. This company is a non-strategic part of Donarbon Group’s
total assets that were acquired in 2010.
13. InventoriesLa composición de existencias al 31 de diciembre de 2010 es la siguiente:
Millions of Euros
Balance at 31/12/10
Balan-
ce at
31/12/09
Balan-
ce at
31/12/08
Change
2010-
2009
Change
2009-
2008
Variación
2009-
2008
Land and building
plots 149 145 159 4 -14
Raw materials and other
supplies150 136 148 14 -12
Property developments in
progress and other148 210 192 -62 18
Write-downs -2 -2 -1 0 -1
Total 445 489 498 -44 -9
Out of total inventories, EUR 204 million relates to the Real Estate Divi-
sion. Of the EUR 131 million, a total of EUR 5 million are subject to owner-
ship restrictions or pledged to secure liabilities.
Assets Liabilities
Changes in 2010Balance
31/12/09
Reduc-
tions due
to sale
Transfers
of non-
current
assets
Exchange
rate eff ect
Balance
31/12/10
Balance
31/12/09
Reduc-
tions
due to
sale
Transfers
of non-
current
assets
Exchange
rate eff ect
Balance
31/12/10
Airports 116 -121 0 5 0 5 -5 0 0 0
APP 81 -84 3 0 0 0
BAA USA 35 -37 2 0 5 -5 0 0
Toll Roads 1,640 -1,641 28 1 28 1,608 -1,608 0 0 0
Trados 45 0 28 28 0 0
Chilean toll roads 1,640 -1,641 1 0 1,607 -1,608 0 0
Services 44 -3 1,444 0 1,485 34 0 857 0 891
Cespa Portugal 41 -41 0 34 -34 0
Swissport 0 1,378 1,378 797 797
Donarbon PFI 107 107 0 94 94
Other 3 -3 0 0 0
Other 2 0 2 0
Held for sale 1,802 -1,765 1,472 6 1,515 1,647 -1,613 857 0 891
consolidated fi nancial statements notes to the consolidated fi nancial statements consolidated fi nancial statements notes to the consolidated fi nancial statements
12. Non-current assets and liabilities classifi ed as held for saleThe changes in the assets and liabilities classifi ed as held for sale in the
year ended 31 December 2010 were as follows:

ferrovial Annual Report 2010 193
14. Trade and other receivablesA. Trade receivablesL
The detail of the balance of “Trade Receivables” at 31 December 2010,
2009 and 2008 is as follows:
For a fuller understanding of trade receivables, the above table shows
the amounts net of advances and amounts billed in advance for con-
struction work, in which they are registered under liabilities, under
“Trade Payables” (see Note 21). This balance includes:
- Contract-stipulated advances which will be discounted from future
billings for work performed;
- Amounts billed in advance for construction work, which occurs when
the billings are issued prior to the work being completed, without giving
rise to cash fl ows.
At 31 December 2010, a total of EUR 300 million (EUR 280 million at 31
December 2009) had been deducted from “Trade Receivables” relating
to receivables factored without recourse prior to their due date. These
assets were removed from the balance sheet since it was considered that
they met the conditions stipulated in paragraph 20 of IAS 39 regarding
the derecognition of fi nancial assets.
The detail of trade receivables for sales and services, by business seg-
ment, distinguishing between public authorities and private customers
is as follows:
Millions of Euros
ConceptsBalance at
31/12/10
Balance at
31/12/09
Balance at
31/12/08Change
Change
2009-2008
Trade receivables 2010-2009 Change 2.556 -174 -286
Retentions for guarantees 2009-2008 148 170 -28 -22
Amounts to be billed for work performed 342 426 500 -84 -74
Total trade receivables for sales and
services2,558 2,844 3,226 -286 -382
Advances -154 -189 -181 35 -8
Amounts billed in advance for construc-
tion work-602 -592 -399 -10 -193
Total net trade receivables 1,802 2,063 2,646 -260 -584
Millions of Euros
ConceptsBalance at
31/12/10
Balance at
31/12/09
Balance at
31/12/08Change
Change
2009-2008
Other receivables 2010-2009 Change 424 186 -6
Receivable from public authorities 2009-2008 186 192 -35 -6
Total other non-trade receivables 755 604 616 151 -12
Millions of Euros
Balances 2010 Public authorities Private customers TOTAL
Construction 969 76.75% 293 23.25% 1,262
Services 865 81.45% 197 18.55% 1,062
Airports 6 2.94% 198 97.06% 204
Toll Roads and Car Parks 13 65.00% 7 35.00% 20
Other and adjustments 0 0.00% 10 100.00% 10
Closing balance 1,853 72.44% 705 27.56% 2,558
As it can be seen from the foregoing table, 72.44% of the Group’s cus-
tomers are public authorities. The most signifi cant balances receivable
from private customers relate to the Construction Division. In order
to manage credit risk relating to private customers, the Construction
division has implemented pre- and post-contracting measures. Pre-
contracting measures include the consultation of debtor registers, rat-
ings and solvency studies, while post-contracting measures during the
execution of construction work include the follow-up of contractual inci-
dents and non-payment events.
B. Other accounts receivable
The detail of “Other Accounts Receivable” at 31 December 2010, 2009
and 2008 is as follows:
consolidated fi nancial statements notes to the consolidated fi nancial statements consolidated fi nancial statements notes to the consolidated fi nancial statements

ferrovial Annual Report 2010 195
“Other Receivables” includes balances receivable arising outside the
ordinary course of business carried on by each segment and advances to
suppliers amounting to EUR 50 million (EUR 69 million at 31 December
2009, EUR 72 million at 31 December 2008).
“Receivable from Public Authorities” includes balances receivable from
public authorities other than income tax.
EUR 131 million were deducted from “Other Current Receivables” cor-
responding to 50% of the sale price of TubeLines, since that amount was
factored without recourse to a bank. These assets were removed from
the balance sheet since it was considered that they met the conditions
stipulated in paragraph 20 of IAS 39 regarding the derecognition of fi -
nancial assets.
C. Provisions
Operating provisions are recognised as described in Note 2.3.7-c. The
change in operating provisions is as follows:
15. EquityThe detail of the main impacts net of taxes that aff ected the changes in
equity in 2010 is as follows:
Following is a description of the main changes in shareholders’ equity
in 2010, the positive evolution of which gave rise to an increase of EUR
1,910 million.
Consolidated profi t for the year totalled EUR 2,163 million for the Parent.
Hedging instruments: recognition of the revaluation of the eff ective
portion of derivatives qualifying for hedge accounting (see Note 11), the
negative impact of which was EUR 96 million net of taxes for the Parent.
The main changes in the fair value of hedges relate to interest rate
swaps, caused by fl uctuating market reference rates. The main changes
involved BAA, with a negative impact of EUR 51 million, the Toll Roads
division EUR 29 million, especially at Chicago Skyway and SH-130 Con-
cession Company and the Services Division with an impact of EUR -34
million.
Defi ned benefi t plans: these include the impact on equity of actuarial
gains and losses arising from adjustments and changes to the Group’s
defi ned benefi t plan assumptions, as described in Note 17, which have an
impact for the Parent of EUR 20 million net of taxes.
Translation diff erences: most of the currencies in which Ferrovial has in-
vestments (see Note 3) have increased in value against the euro, particu-
larly the Canadian dollar and the pound sterling, currencies to which the
Group is most exposed in terms of equity. This had a positive impact of
EUR 316 million for the Parent.
Dividends: dividend payments reduced the Group’s total equity by EUR
308 million, of which EUR 220 million relates to the dividend approved
by the shareholders at the Annual General Meeting and EUR 88 millio-
Millions of Euros
Changes in provision 2010 2009 2008Change 2010-
2009
Change 2009-
2008
Opening balance -290 -242 -173 -48 -69
Amounts charged to the income state-
ment-15 -137 -60 122 -77
Reductions/Amounts used 1 100 -24 -99 124
Eff ect of exchange rate -3 -11 14 8 -25
Changes in the scope of consolidation
and transfers97 0 1 97 -1
Closing balance -210 -290 -242 80 -48
2010
Attributable to
equity holdersAttributable to non-
controlling interestsTotal equity
Equity at 1 January 2,986 1,570 4,556
Changes in accounting policies 116 48 164
Equity at 1 January restated 3,102 1,617 4,719
Consolidated profi t for the year 2,163 -348 1,815
Impact on reserves of hedging instruments -96 -61 -157
Impact on reserves of defi ned benefi t plans 20 23 42
Translation diff erences 316 49 365
Net income/expense recognised directly in equity 240 11 250
Total income and expense recognised directly in equity 2,403 -338 2,066
Dividends paid -308 -76 -385
Capital increases/reductions 130 130
Transactions with owners -308 53 -255
Changes in the scope of consolidation and other changes -2 101 99
Equity at 31 December 5,195 1,434 6,629
Group management considers that the carrying amount of trade receiv-
ables approximates their fair values.
consolidated fi nancial statements notes to the consolidated fi nancial statements consolidated fi nancial statements notes to the consolidated fi nancial statements

ferrovial Annual Report 2010 197
A. Share capital and share premium
At 31 December 2010 the share capital amounted to EUR 147 mil-
lion and was fully subscribed and paid. Share capital is represented by
733,510,255 ordinary shares of a single class and a par value of twenty
euro cents (EUR 0.20) per share. There have been no changes with re-
spect to 31 December 2009.
At 31 December 2008, the share capital amounted to EUR 140 million.
In 2009 the share premium increased from EUR 193 million at 31 Decem-
ber 2008 to EUR 3,022 million as a result of the share premium relating
to the merger between Cintra, S.A. and Grupo Ferrovial, S.A. In 2010 the
share premium remained unchanged.
At 31 December 2010, the shareholder holding more than 10% of the
share capital of Grupo Ferrovial, S.A. was Portman Baela, S.L., with
44.607%, a percentage reduced to 44.268% at the beginning of 2011.
The shares of the Parent are listed on the continuous market of the
Spanish stock exchanges and they all carry the same voting and dividend
rights.
B. Treasury sharesThere were no treasury shares at 31 December 2010.
The decrease in the balance of EUR 72 million at 31 December 2008
arose from the merger process between Cintra, S.A. and Ferrovial Group.
C. Other reserves
The changes in “Other Reserves” in 2010 and 2009 were as follows:
Changes in 2010Translation
diff erencesHedges Defi ned benefi t plans Other
Total other
reserves
Balance at 01/01/10 -391 -357 -134 -147 -1,028
Changes in accounting policies -4 -4
Balance at 01/01/10 restated -394 -357 -134 -147 -1,032
Change 316 -96 20 113 353
Balance at 01/01/10 -84 -453 -114 -28 -679
Changes in 2009Translation
diff erencesHedges Defi ned benefi t plans Other
Total other
reserves
Balance at 01/01/09 -514 -617 112 -170 -1,190
Change 120 260 -246 23 158
Balance at 01/01/09 -394 -357 -134 -147 -1,032
2009
Attributable to equity
holders
Attributable
non-controlling
interests
Total equity
Equity at 1 January 1,756 2,206 3,962
Changes in accounting policies 45 90 136
Equity at 1 January restated 1,802 2,296 4,098
Consolidated profi t for the year -74 -395 -469
Impact on reserves of hedging instruments 260 194 453
Impact on reserves of defi ned benefi t plans -246 -144 -390
Translation diff erences 120 -182 -61
Income and expense recognised directly in equity 135 -132 2
Total income and expense recognised directly in equity 61 -528 -466
Dividends paid -281 -103 -384
Capital increases/reductions 166 166
Merger 1,443 -160 1,283
Transactions with owners 1,162 -96 1,065
Changes in the scope of consolidation and other changes 77 -55 22
Equity at 31 December 3,101 1,618 4,719
relate to the interim dividend approved by the Board of Directors on 28
October 2010.
Changes in the scope of consolidation: the impact of changes in the
scope of consolidation and other changes related to non-controlling
interest is signifi cant due mainly to the sale of 10% of 407 ETR toll road
and the accounting of the remaining 43.23% using the equity method
discussed in Note 1.2.
For information purposes, the detail of the main changes in equity in
2009 is as follows:
consolidated fi nancial statements notes to the consolidated fi nancial statements consolidated fi nancial statements notes to the consolidated fi nancial statements
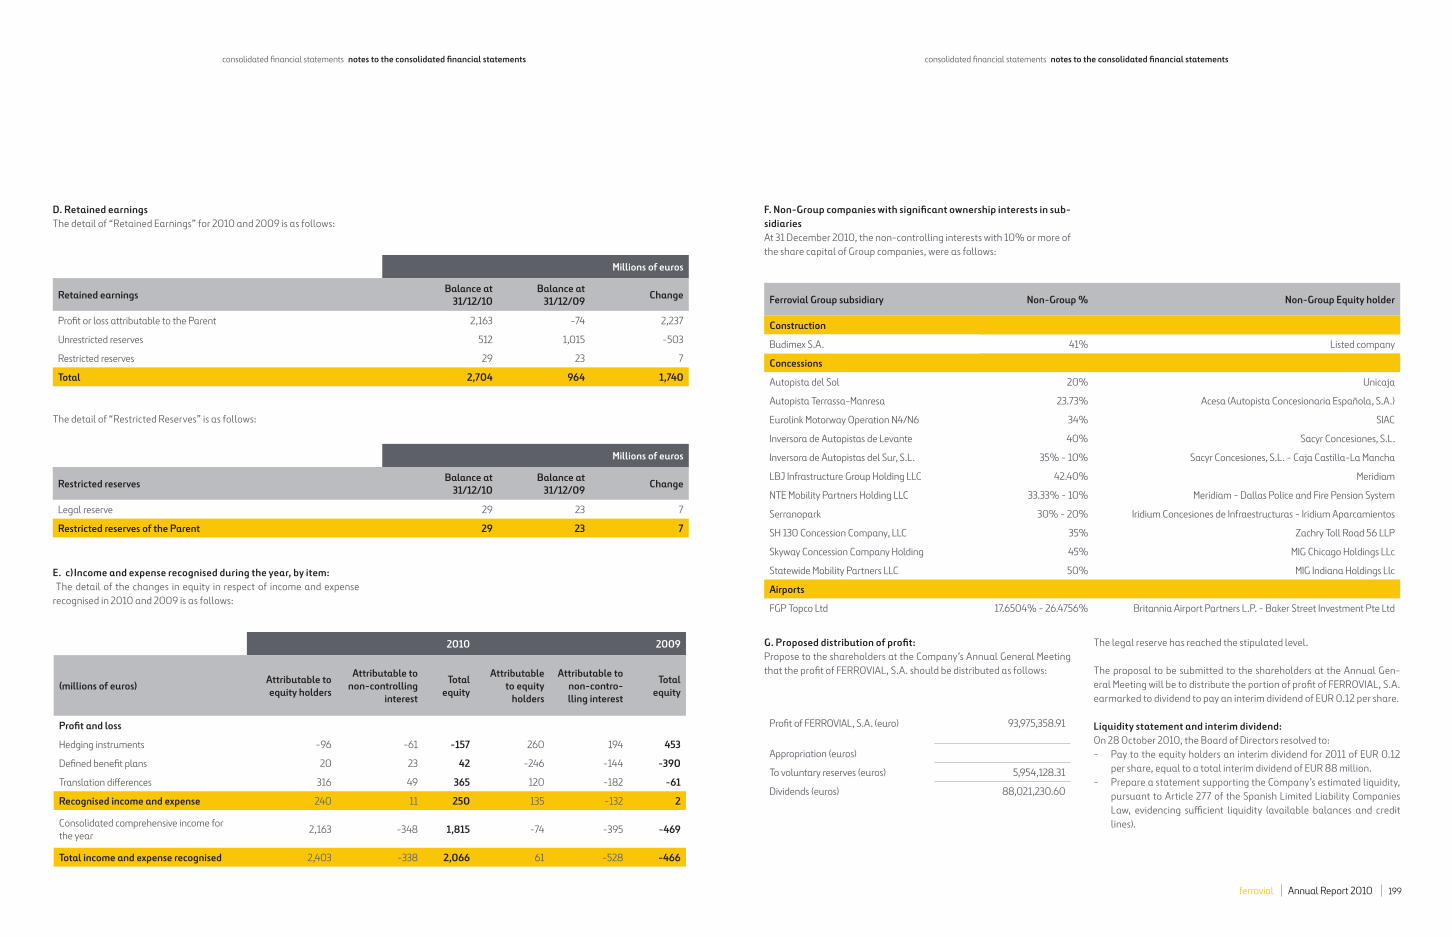
ferrovial Annual Report 2010 199
F. Non-Group companies with signifi cant ownership interests in sub-
sidiaries
At 31 December 2010, the non-controlling interests with 10% or more of
the share capital of Group companies, were as follows:
G. Proposed distribution of profi t:
Propose to the shareholders at the Company’s Annual General Meeting
that the profi t of FERROVIAL, S.A. should be distributed as follows:
The legal reserve has reached the stipulated level.
The proposal to be submitted to the shareholders at the Annual Gen-
eral Meeting will be to distribute the portion of profi t of FERROVIAL, S.A.
earmarked to dividend to pay an interim dividend of EUR 0.12 per share.
Liquidity statement and interim dividend:
On 28 October 2010, the Board of Directors resolved to:
- Pay to the equity holders an interim dividend for 2011 of EUR 0.12
per share, equal to a total interim dividend of EUR 88 million.
- Prepare a statement supporting the Company’s estimated liquidity,
pursuant to Article 277 of the Spanish Limited Liability Companies
Law, evidencing suffi cient liquidity (available balances and credit
lines).
Ferrovial Group subsidiary Non-Group % Non-Group Equity holder
Construction
Budimex S.A. 41% Listed company
Concessions
Autopista del Sol 20% Unicaja
Autopista Terrassa-Manresa 23.73% Acesa (Autopista Concesionaria Española, S.A.)
Eurolink Motorway Operation N4/N6 34% SIAC
Inversora de Autopistas de Levante 40% Sacyr Concesiones, S.L.
Inversora de Autopistas del Sur, S.L. 35% - 10% Sacyr Concesiones, S.L. - Caja Castilla-La Mancha
LBJ Infrastructure Group Holding LLC 42.40% Meridiam
NTE Mobility Partners Holding LLC 33.33% - 10% Meridiam - Dallas Police and Fire Pension System
Serranopark 30% - 20% Iridium Concesiones de Infraestructuras - Iridium Aparcamientos
SH 130 Concession Company, LLC 35% Zachry Toll Road 56 LLP
Skyway Concession Company Holding 45% MIG Chicago Holdings LLc
Statewide Mobility Partners LLC 50% MIG Indiana Holdings Llc
Airports
FGP Topco Ltd 17.6504% - 26.4756% Britannia Airport Partners L.P. - Baker Street Investment Pte Ltd
Profi t of FERROVIAL, S.A. (euro) 93,975,358.91
Appropriation (euros)
To voluntary reserves (euros) 5,954,128.31
Dividends (euros) 88,021,230.60
D. Retained earnings
The detail of “Retained Earnings” for 2010 and 2009 is as follows:
E. c) Income and expense recognised during the year, by item:
The detail of the changes in equity in respect of income and expense
recognised in 2010 and 2009 is as follows:
The detail of “Restricted Reserves” is as follows:
Millions of euros
Retained earnings Balance at
31/12/10
Balance at
31/12/09Change
Profi t or loss attributable to the Parent 2,163 -74 2,237
Unrestricted reserves 512 1,015 -503
Restricted reserves 29 23 7
Total 2,704 964 1,740
Millions of euros
Restricted reservesBalance at
31/12/10
Balance at
31/12/09Change
Legal reserve 29 23 7
Restricted reserves of the Parent 29 23 7
2010 2009
(millions of euros)Attributable to
equity holders
Attributable to
non-controlling
interest
Total
equity
Attributable
to equity
holders
Attributable to
non-contro-
lling interest
Total
equity
Profi t and loss
Hedging instruments -96 -61 -157 260 194 453
Defi ned benefi t plans 20 23 42 -246 -144 -390
Translation diff erences 316 49 365 120 -182 -61
Recognised income and expense 240 11 250 135 -132 2
Consolidated comprehensive income for
the year2,163 -348 1,815 -74 -395 -469
Total income and expense recognised 2,403 -338 2,066 61 -528 -466
consolidated fi nancial statements notes to the consolidated fi nancial statements consolidated fi nancial statements notes to the consolidated fi nancial statements

ferrovial Annual Report 2010 201
Defi ned benefi t plans:
The changes in pension plan obligations and plan assets in 2010 and
2009 were as follows:
2010 2009 Change
Millions of euros Provision SurplusNet
balanceProvision Surplus
Net
balanceProvision Surplus
Net
balance
Defi ned benefi t plans -151 0 -151 -476 22 -454 325 -22 303
BAA -77 0 -77 -313 0 -313 236 0 236
Amey -74 0 -74 -162 0 -162 88 0 88
Swissport 0 0 0 -1 22 21 1 -22 -21
Other plans 0 0 0 -27 0 -27 27 0 27
Swissport 0 0 0 -27 0 -27 27 0 27
Total -151 0 -151 -503 22 -481 352 -22 330
Millions of euros 2010 Millions of euros 2009
DEFINED BENEFIT PLANS Amey Ltd Group BAASwissport
Group
Amey Ltd
GroupBAA
Changes in pension obligations
Obligations at beginning of year 571 2,599 361 407 2,097
Exchange diff erences 20 91 1 -11 165
Liabilities acquired 0 0 0 0 0
Current service cost 13 57 15 9 60
Past service cost -53 0 0 0 14
Borrowing costs 34 151 13 28 136
Actuarial gains/losses 19 39 -2 106 204
Other impacts on equity 28 -22
Benefi ts paid and other -29 -87 -15 32 -77
Obligations at end of year 603 2,829 374 571 2,599
On 18 November 2010, the interim dividend was paid amounting to EUR
88 million net.
Pursuant to Article 277 of the Spanish Limited Liability Companies Law,
the amounts to be distributed did not exceed the profi t earned since the
end of the previous fi nancial year, after deducting estimated income tax
payable on such profi t and the amount that must be appropriated to le-
gal reserves.
16. Deferred incomeThe changes in “Deferred Income” in 2010 and 2009 are as follows:
Grants are carried at fair value when it is reasonably certain that the rel-
evant amount will be collected (see Note 2.3.14).
17. Provisions and pension surplusThis item refl ects the provisions and/or pension plan surplus and other
employee retirement bonuses, including both defi ned benefi t and de-
fi ned contribution plans. The detail of the provisions and/or surplus
recognised in the balance sheet in this connection is as follows:
Liquidity summary 2010
(millions of euros)
Available cash (Corporate + FA + FS + Cintra) 433
Available credit Ferrovial S.A. 566
Available credit Ferrovial Agroman, S.A. 66
Other credit lines of subsidiaries 8
Total liquidity available for distribution 1,075
Millones de Euros
Changes in 2010Balance at
01/01/10
Transfers and
otherAdditions Disposals
Eff ect of ex-
change rate
Balance at
31/10/10
Grants 179 -8 10 -17 1 164
Other deferred income 53 1 -22 32
Total 232 -8 11 -39 1 196
Millones de Euros
Changes in 2009Balance at
01/01/09
Transfers and
otherAdditions Disposals
Eff ect of ex-
change rate
Balance at
31/10/09
Grants 188 111 114 -234 0 179
Other deferred income 62 2 -12 1 53
Total 250 111 116 -245 1 232
consolidated fi nancial statements notes to the consolidated fi nancial statements consolidated fi nancial statements notes to the consolidated fi nancial statements

ferrovial Annual Report 2010 203
2010 2009
Main assumptions Amey Ltd Group BAASwissport
Group
Amey Ltd
GroupBAA
Salary increase 2.5%- 5% 5.10% 1.0% - 5.0% 4.01% 5.20%
Discount rate 5.50% 5.50% 3.5% - 9.0% 5.70% 5.70%
Expected infl ation rate 2.60% 3.60% 1.30% 3.50% 3.70%
Expected returns on assets 4.0%-8.2% 6.30% 2.8% - 6.8% 4.5%-8.5% 5.70%
Mortality (years) 84.5-89.1 85.9-87.9 83.1-87 84.5-87.9 84.8-85.9
Millions of euros 2010 Millions of euros 2009
Amey Ltd
GroupBAA Total
Swissport
Group
Amey Ltd
GroupBAA Total
Actuarial gains/losses on obligations -19 -39 -58 2 -106 -204 -309
Actuarial gains/losses on assets 16 89 105 20 38 -251 -193
Other impacts on equity -7 22 15 0 -43 0 -43
Actuarial gains/losses recognised (*) -9 72 63 21 -111 -455 -544
· There were actuarial gains and losses on obligations amounting to
EUR 19 million at the Amey Group and EUR 39 million at BAA.
· Actuarial gains and losses on assets (EUR 89 million) arising from
the diff erence between expected returns at the beginning of the year
(EUR 161 million) and actual returns (EUR 250 million) on assets at
BAA, and actuarial gains and losses on assets at Amey (EUR 16 mil-
lion) due to the diff erence between expected returns at the begin-
ning of the year (EUR 33 million) and actual returns (EUR 49 million)
thereon.
The summary of the main actuarial assumptions used to calculate the
defi ned benefi t pension plan obligations is as follows:
Millions of euros 2010 Millions of euros 2009
DEFINED BENEFIT PLANS Amey Ltd Group BAASwissport
Group
Amey Ltd
GroupBAA
Changes in plan assets
Fair value at beginning of year 406 2,286 357 305 2,177
Exchange diff erences 14 80 2 24 168
Expected return on assets 33 161 17 23 163
Actuarial gains/losses 16 89 20 38 -251
Other impacts on equity 21 0
Employee contributions 4 13 9 4 17
Employer’s contributions 53 223 0 27 107
Benefi ts paid and other -19 -100 -10 -14 -97
Fair value at end of year 529 2,752 395 406 2,286
Recognised liability in balance sheet
Obligation at end of year -603 -2,829 -374 -571 -2,599
Fair value of plan assets at end of year 529 2,752 395 406 2,286
Subtotal -74 -77 21 -165 -313
Total -74 -77 21 -162 -313
BAA Group has 3 defi ned benefi t plans covering a total of 21,228 em-
ployees, while Amey Group has 10 defi ned benefi t plans covering a total
of 6,919 employees.
In 2010 the most signifi cant event at the BAA Group and at the Amey
Group was the decrease in the pension shortfall which decreased from
EUR 313 million in 2009 to EUR 77 million in 2010 (at the BAA Group)
and from EUR 162 million in 2009 to EUR 74 million (at the Amey Group).
A. Actuarial gains and losses:
The detail of the impact of the defi ned benefi t pension plans recognised
directly in equity is as follows:
consolidated fi nancial statements notes to the consolidated fi nancial statements consolidated fi nancial statements notes to the consolidated fi nancial statements

ferrovial Annual Report 2010 205
Millions of euros 2010 Millions of euros 2009
Plan assets (fair value)Amey Ltd Group BAA Swissport Group Amey Ltd Group BAA
Eur % Eur % Eur % Eur % Eur %
Equity instruments 361 8.20% 608 7.88% 1116.10 -
6.40%263 8.50% 715 8.20%
Debt instruments 109 4.2%-5.5% 1,141 5.16% 117 n/a 98 4.5%-5.7% 1,274 5.50%
Buildings 15 8.10% 0 n/a 91 3.90% 13 8.50% 0 n/a
Cash and other 44 4.00% 1,003 0.50% 771.20 -
4.2%32 4.50% 297 0.50%
Total plan assets 529 2,752 396 406 2,286
2010 2009
DEFINED BENEFIT PLANS
Amey
Ltd
Group
BAASwissport
Group
Amey
Ltd
Group
BAA
Impact on profi t before tax (*)
Current service cost 13 57 15 9 60
Borrowing costs 34 151 13 28 136
Expected return on assets -33 -161 -17 -23 -163
Past service cost -53 0,5 0 0 0
Other -10 -14 0 0 17
Total recognised in the income statement -49 35 11 14 50
The mortality assumptions used by the BAA Group to calculate its pen-
sion obligations are based on the actuarial mortality tables, entailing
an estimated life expectancy of between 85.9 and 87.9 years. In case of
the Amey Group, this life expectancy for its pension plans is estimated to
range between 84.5 and 89.1 years.
There are also other impacts on equity due mainly to corporate transac-
tions, of particular note being the EUR -22 million of the BAA Group as a
result of the sale of Gatwick Airport.
B. Employer’s contributions:
In 2010, contributions were made at the BAA Group amounting to EUR
223 million, of which EUR 93 million relate to the regular annual contri-
butions agreed upon with the benefi ciaries and EUR 130 million which
relate mainly to the contributions made to redress the balance in the
plan after the sale of Gatwick Airport discussed earlier.
In 2010 contributions at the Amey Group totalled EUR 53 million, EUR 22
To assess expected returns on assets, the actuaries used the following
criteria:
At the BAA Group:
Equity instruments: equal to annualised FTSE actuaries share indices
15-year returns plus a risk premium of 3.7%.
Debt instruments: performance composed of 20% of returns on long-
term UK gilts and 80% of returns on corporate bonds.
Cash and other: returns on 3-month deposits.
At the Amey Group:
Equity instruments: expected returns of between 7.2% and 8.5%.
Debt instruments: the returns on sovereign debt and the performance
of the corporate bonds debt making up the plan are used to calculate the
returns on these instruments.
Buildings: forecast returns 0.1% below returns on equity instruments.
Cash and other: long-term returns available for Swaps.
Actual returns:
The BAA Group had actual returns on its plan assets totalling EUR 250
million in 2010 and EUR 86 million in 2009. The returns at the Amey
Group totalled EUR 49 million in 2010 and EUR 61 million in 2009. The
diff erence between forecast and actual returns is recognised in equity.
Neither the BAA nor Amey Groups’ plans include fi nancial assets issued
by the company itself or buildings occupied by it.
D. Impact on the income statement:
The detail of the impact of the defi ned benefi t pension plans on the in-
come statement is as follows:
million to rebalance the plan as a result of the sale of Tube Lines in the
year, EUR 20 million to rebalance the rest of the plan, with the remainder
involving ordinary contributions.
The projected contributions agreed upon with the benefi ciaries for 2011
at both BAA and Amey total EUR 93 million and EUR 11 million, respec-
tively. Additionally, the Amey Group agreed on special contributions
amounting to EUR 21 million for the coming year.
C. Return on assets:
The summary of the defi ned benefi t pension plan assets by type stated
at their fair value and including the expected percentage return thereon
for 2010 and 2009 is as follows:
(*) Expenses are positive and income is negative.
consolidated fi nancial statements notes to the consolidated fi nancial statements consolidated fi nancial statements notes to the consolidated fi nancial statements
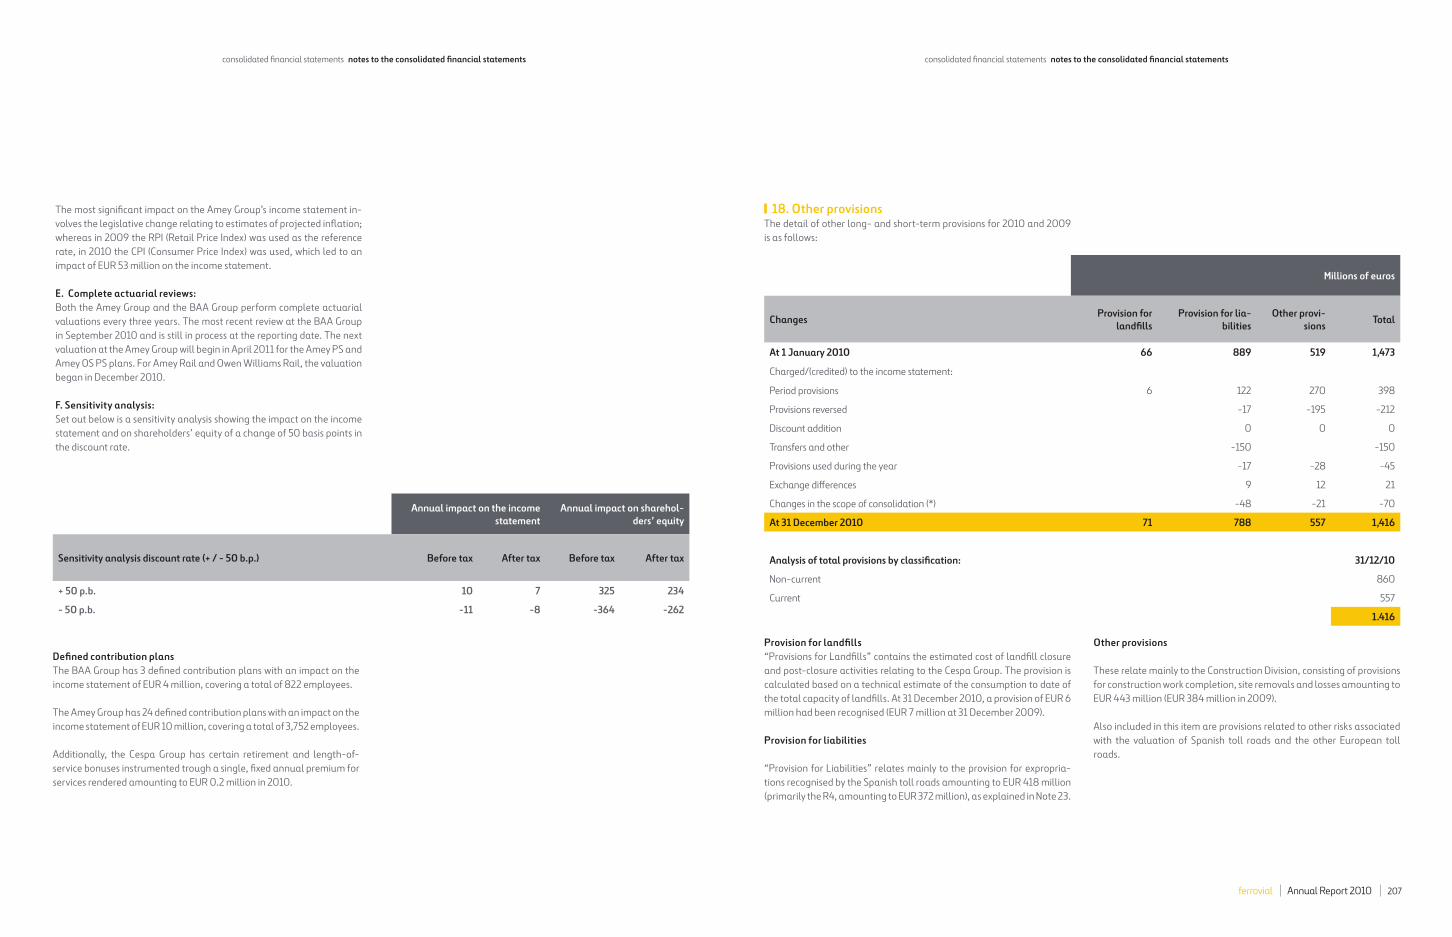
ferrovial Annual Report 2010 207
The most signifi cant impact on the Amey Group’s income statement in-
volves the legislative change relating to estimates of projected infl ation;
whereas in 2009 the RPI (Retail Price Index) was used as the reference
rate, in 2010 the CPI (Consumer Price Index) was used, which led to an
impact of EUR 53 million on the income statement.
E. Complete actuarial reviews:
Both the Amey Group and the BAA Group perform complete actuarial
valuations every three years. The most recent review at the BAA Group
in September 2010 and is still in process at the reporting date. The next
valuation at the Amey Group will begin in April 2011 for the Amey PS and
Amey OS PS plans. For Amey Rail and Owen Williams Rail, the valuation
began in December 2010.
F. Sensitivity analysis:
Set out below is a sensitivity analysis showing the impact on the income
statement and on shareholders’ equity of a change of 50 basis points in
the discount rate.
Defi ned contribution plans
The BAA Group has 3 defi ned contribution plans with an impact on the
income statement of EUR 4 million, covering a total of 822 employees.
The Amey Group has 24 defi ned contribution plans with an impact on the
income statement of EUR 10 million, covering a total of 3,752 employees.
Additionally, the Cespa Group has certain retirement and length-of-
service bonuses instrumented trough a single, fi xed annual premium for
services rendered amounting to EUR 0.2 million in 2010.
Annual impact on the income
statement
Annual impact on sharehol-
ders’ equity
Sensitivity analysis discount rate (+ / - 50 b.p.) Before tax After tax Before tax After tax
+ 50 p.b. 10 7 325 234
- 50 p.b. -11 -8 -364 -262
18. Other provisionsThe detail of other long- and short-term provisions for 2010 and 2009
is as follows:
Provision for landfi lls
“Provisions for Landfi lls” contains the estimated cost of landfi ll closure
and post-closure activities relating to the Cespa Group. The provision is
calculated based on a technical estimate of the consumption to date of
the total capacity of landfi lls. At 31 December 2010, a provision of EUR 6
million had been recognised (EUR 7 million at 31 December 2009).
Provision for liabilities
“Provision for Liabilities” relates mainly to the provision for expropria-
tions recognised by the Spanish toll roads amounting to EUR 418 million
(primarily the R4, amounting to EUR 372 million), as explained in Note 23.
Other provisions
These relate mainly to the Construction Division, consisting of provisions
for construction work completion, site removals and losses amounting to
EUR 443 million (EUR 384 million in 2009).
Also included in this item are provisions related to other risks associated
with the valuation of Spanish toll roads and the other European toll
roads.
Millions of euros
ChangesProvision for
landfi lls
Provision for lia-
bilities
Other provi-
sionsTotal
At 1 January 2010 66 889 519 1,473
Charged/(credited) to the income statement:
Period provisions 6 122 270 398
Provisions reversed -17 -195 -212
Discount addition 0 0 0
Transfers and other -150 -150
Provisions used during the year -17 -28 -45
Exchange diff erences 9 12 21
Changes in the scope of consolidation (*) -48 -21 -70
At 31 December 2010 71 788 557 1,416
Analysis of total provisions by classifi cation: 31/12/10
Non-current 860
Current 557
1.416
consolidated fi nancial statements notes to the consolidated fi nancial statements consolidated fi nancial statements notes to the consolidated fi nancial statements

ferrovial Annual Report 2010 209
19. Net cash positionThe following table contains a breakdown, by segment, of the net cash
position in order to refl ect the Group’s net borrowing situation. The net
cash position is understood to be the balance of items included in cash
and cash equivalents (including current restricted cash) and non-current
restricted cash, less current and non-current borrowings (bank borrow-
ings and bonds).
The breakdown of the net cash position also makes a distinction between
infrastructure projects and other Group companies:
Millions of euros
Movements
Provisión
Vertederos
Provisión por
responsabi-
lidades
Otras
provisionesTotal
At 1 January 2009 60 648 452 1,161
Charged/(credited) to the income statement:
Period provisions 7 146 155 309
Provisions reversed -143 -40 -183
Discount addition 0 0
Transfers and other 257 -46 211
Provisions used during the year -1 -30 -13 -44
Exchange diff erences 10 10 20
At 31 December 2009 66 889 519 1,473
Analysis of total provisions by classifi cation: 31/12/09
Non-current 954
Current 519
1,473
Millions of euros
Balance
31/12/10
Balance
31/12/09
Balance
31/12/08
Change
2010-2009
Change
2009-2008
Construction 2,274 1,955 1,948 320 7
Services -832 -1,212 -1,228 380 16
Airports 22 -75 -1,916 97 1,841
Toll Roads 572 30 390 542 -360
Corporate and other -2,005 -1,870 -740 -135 -1,130
Net cash position excluding infrastructure projects 31 -1,172 -1,546 1,203 374
BAA -14,529 -13,855 -12,906 -674 -949
Other airports 2 3 8 -1 -5
Toll Roads -5,026 -7,104 -6,574 2,078 -530
Construction -129 -96 -86 -33 -10
Services -138 -47 -68 -91 21
Net cash position of infrastructure projects -19,820 -21,099 -19,626 1,279 -1,473
TOTAL NET CASH -19,789 -22,271 -21,172 2,482 -1,099
In 2010, the euro fell sharply against the main foreign currencies in which
Ferrovial Group denominates its net cash position, primarily in pound
sterling (BAA) and US dollars (US toll roads). This had a negative impact
on the net cash position of EUR -676 million in infrastructure projects
and EUR -25 million at other companies. An overall explanation of the
evolution in the net cash position for 2010 is included in Note 31 “Cash
Flow” and in the additional disclosures presented in the directors’ report.
consolidated fi nancial statements notes to the consolidated fi nancial statements consolidated fi nancial statements notes to the consolidated fi nancial statements

ferrovial Annual Report 2010 211
2010
Millions of euros
Non-
current
restricted
cash
Non-current
investments
Current res-
tricted cash
Other cash
and cash
equivalents
BorrowingsIntra-group
transactions
Total net cash
position
BAA 43 444 15,017 -14,530
Other airports 2 2
Toll roads 551 6 1 191 5,769 -5 -5,025
Construction 5 141 8 -129
Services 8 54 -92 -138
Net cash position of infras-
tructure projects551 6 44 649 20,981 -89 -19,820
19.1 Proyectos de infraestructuras
A. Analysis of the net cash position of infrastructure projects
The detail of the net cash position of infrastructure projects in 2010 is
as follows:
B. Cash and cash equivalents and restricted cash
As indicated in the note on fi nancial risks, infrastructure project fi nanc-
ing agreements occasionally impose the obligation to arrange certain
restricted accounts to cover short-term or long-term obligations relating
to the repayment of the principal or interest on the borrowings and to
infrastructure maintenance and operation.
Restricted cash is classifi ed as current or non-current depending on
whether it must remain restricted for less than or more than one year.
In any event, these funds are invested in highly-liquid fi nancial products
bearing fl oating interest. The type of fi nancial product in which the funds
may be invested is also restricted by the fi nancing agreements or, where
no restrictions are stipulated, the decision is made on the basis of the
Group’s policy for the placement of cash surpluses.
Current balances are recognised under “Cash and cash equivalents” in
the balance sheet whereas non-current balances are included in “Fi-
nancial Assets”.
The detail of current and non-current restricted cash balances, by proj-
ect, is as follows:
Millions of euros
Balance
31/12/10
Balance
31/12/09
Balance
31/12/08
NTE Mobility Partners 130 264
LBJ Infrastructure Group 326
407 ETR 132 128
Chicago Skyway 44 36 35
EuroScut Algarve 19 18 19
EuroScut Norte 30 22 14
Other 2 1 1
Non-current restricted cash 551 473 197
BAA 43 205 85
407 ETR 146 110
Chicago Skyway
Services 9
Other 1
Current restricted cash 44 351 204
Total restricted cash 595 824 401
The main changes in restricted cash arose from the pledge of funds from bonds issued by LBJ Infra-
structure Group which will be used to fi nance construction. Conversely, the decrease arising from
changing the consolidation method of 407 ETR should be mentioned, which after the 10% divest-
ment in this company began to be accounted for using by the equity method (see Note 1.2). There
is also a signifi cant decrease in the restricted cash of NTE Mobility Partners due to the beginning of
construction works on the toll road and the application of the funds to this purpose.
As regards BAA, at 31 December 2009 a restricted amount of EUR 161 million (GBP 143 million)
was recognised relating to the gain on the sale of Gatwick to meet the payment of the pension plan
defi cit amounting to EUR 130 million that arose in 2010 (see Note 17) and which accounts for most
of the decrease in current restricted cash.
The heading “Other Cash and Cash Equivalents” relates to bank accounts and highly-liquid invest-
ments subject to interest rate risk.
consolidated fi nancial statements notes to the consolidated fi nancial statements consolidated fi nancial statements notes to the consolidated fi nancial statements

ferrovial Annual Report 2010 213
Changes in exchange rates between 2010 and 2009 increased the indebtedness, which totalled
EUR 746 million. Thus, if a constant exchange rate is applied, the net change in the debt would be
EUR -2,429 million.
C. Breakdown of infrastructure project borrowings
C.1 Analysis of short-term and long-term balances by project
C.2 Maturities by currency and fair value of infrastructure project debt
2010 2009 Change 2010-2009
Millions of euros BondsBank bo-
rrowings Total Bonds
Bank bo-
rrowingsTotal Bonds
Bank bo-
rrowingsTotal
LONG TERM 10,022 9,544 19,566 10,523 10,591 21,114 -501 -1,047 -1,548
BAA 8,185 6,552 14,737 6,485 7,543 14,028 1,700 -991 709
407 ETR 2,738 2,738 -2,738 -2,738
Skyway Concession Co. LLC 1,019 112 1,131 930 103 1,033 89 9 98
NTE Mobility Partners 291 291 272 272 19 19
LBJ Infrastructure Group 428 428 428
Spanish toll roads 1,148 1,148 1,661 1,661 -513 -513
Other toll roads 99 1,536 1,635 98 1,178 1,276 1 358 359
Construction 142 142 86 86 56 56
Services 54 54 20 20 34 34
SHORT TERM 11 1,404 1,415 591 950 1,541 -580 454 -126
BAA 280 280 444 444 -164 -164
407 ETR 582 582 -582 -582
Skyway Concession Co. LLC 6 6 4 4 2 2
NTE Mobility Partners 1 1 -1 -1
LBJ Infrastructure Group
Spanish toll roads 1,042 1,042 486 486 556 556
Other toll roads 11 76 87 9 14 23 2 62 64
TOTAL 10,033 10,948 20,981 11,114 11,542 22,655 -1,081 -594 -1,674
Fair valueCarrying
amount
2010
Maturities
Total
maturitiesBorrowings Currency 2010 2009 2008 2010 2012 2013 2014 2015
2016
más
Bonds of infrastruc-
ture projects 10,088 11,704 7,266 10,032 0 793 462 598 1 7,413 9,268
BAA 8,201 6,687 3,596 8,185 793 462 598 0 5,506 7,359
GBP 5,177 4,281 2,284 5,267 0 462 0 0 4,405 4,867
EUR 3,024 2,406 1,312 2,918 793 0 598 0 1,101 2,492
Toll Roads 1,887 5,017 3,670 1,847 1 1,907 1,909
CAD 3,685 2,591
USD 1,770 1,202 961 1,738 1,807 1,807
EUR 117 130 118 109 1 101 102
Bank borrowings
of infrastructure
projects
11,239 11,749 11,830 10,949 1.147 1,206 2,491 823 1,533 3,979 11,179
Airports 7,088 8,167 8,375 6,832 46 664 2,458 776 1,480 1,614 7,038
GBP 7,088 8,158 8,361 6,832 46 664 2,458 776 1,480 1,614 7,038
EUR 9 14
Toll Roads 3,955 3,476 3,305 3,921 1,102 541 29 38 47 2,205 3,963
USD 633 331 223 633 653 653
EUR 3,322 3,145 3,082 3,288 1,102 541 29 38 47 1,553 3,310
Construction EUR 142 86 90 142 126 126
Services 54 20 60 54 1 4 8 6 34 53
GBP 60
EUR 54 20 54 1 4 8 6 34 53
Total borrowings
of infrastructure
projects
21,327 23,453 19,096 20,981 1,147 1,999 2,954 1,421 1,534 11,392 20,447
consolidated fi nancial statements notes to the consolidated fi nancial statements consolidated fi nancial statements notes to the consolidated fi nancial statements

ferrovial Annual Report 2010 215
The variations between the total maturities of bank borrowings and the
carrying amounts of the debt at 31 December 2010 is explained mainly
by the diff erence between the nominal values and carrying amounts of
the debts, as certain adjustments are made in accordance with appli-
cable accounting regulations (especially unpaid accrued interest and
the application of the amortised cost method). Maturities of BAA bonds
include the maturities of the cross currency swaps hedging foreign ex-
change fl uctuations that aff ect the debt (see Note 11 on “Derivative Fi-
nancial Instruments”). The debt maturities do not include interest. The
fair value refl ected in the table above is calculated as follows:
1. Bonds listed in active markets: market value.
2. Fixed-interest bank borrowings: future cash fl ows are discounted at
an equivalent market interest rate.
3. Floating-interest bank borrowings: no signifi cant diff erences are
deemed to exist between the fair value of the borrowings and their
carrying amount and, therefore, the carrying amount is used.
Maturities in 2011 relate to:
· Autopista Madrid Sur, with maturities amounting to EUR 554 mil-
lion. The original maturity of the debt was January 2011, but was
extended to July 2011.
· Autopista del Sol, maturity in March 2011 of the syndicated loan
which totals EUR 492 million.
· BAA, maturity of EIB debt amounting to EUR 46 million in December
2011.
· Autopista Eurolink M-3, maturity in June 2011 totalling EUR 37 mil-
lion of the syndicated loan.
· Algarve internacional, maturity of EIB loan of EUR 10 million in De-
cember 2011.
· Autopista Euroscut Norte, maturities of EUR 6 million in July 2011.
· Autopista Eurolink M4M6, maturities of EUR 2 million in December
2011.
C.3 Exposure to interest rate risk of infrastructure project
borrowings
With the aim of completing the information on exposure to interest rate
risk presented in Note 3, below is the detail of debt components indicating
the portion subject to fi xed interest rates, the portion hedged by deriva-
tives and fl oating-rate debt:
Debt hedged by IRS (interest rate swaps) relates to derivatives that con-
vert fl oating-rate bank borrowings to fi xed interest rates (see details in
Note 11).
Millions of euros
Type of debtBalance
31/12/10
% Balance
31/12/09
% Balance
31/12/09
%
Airports 15,017 14,471 13,253
Fixed 2,455 16% 3,955 27% 2,938 22%
Infl ation-index
fi xed4,995 33% 2,725 19% 2,316 17%
Hedged (IRS) 3,539 24% 4,085 28% 4,765 37%
Floating 4,028 27% 3,706 26% 3,235 24%
Toll Roads 5,768 8,079 7,182
Fixed 1,189 21% 2,837 35% 1,892 26%
Infl ation-index
fi xed0% 1,071 13% 850 12%
Hedged (IRS) 3,053 53% 2,819 35% 3,270 46%
Floating 1,526 26% 1,352 17% 1,170 16%
Construction 142 86 90
Fixed 78 55%
Hedged (IRS) 58 41%
Floating 6 4% 86 100% 90 100%
Services 54 19 60
Fixed 0% 0% 21 35%
Hedged (IRS) 47 87% 19 98% 39 65%
Floating 7 13% 2% 0%
Total borrowings of infras-
tructure projects20,981 22,655 20,586
Fixed 3,723 18% 6,792 30% 4,851 24%
Infl ation-index
fi xed4,994 24% 3,796 17% 3,167 15%
Hedged (IRS) 6,697 32% 6,923 30% 8,074 39%
Floating 5,567 26% 5,144 23% 4,494 22%
consolidated fi nancial statements notes to the consolidated fi nancial statements consolidated fi nancial statements notes to the consolidated fi nancial statements

ferrovial Annual Report 2010 217
C.4 Information on credit limits and credit drawable for infrastruc-
ture projects
Set out below is a comparative analysis of borrowings not drawn down
at year end:
Balances at 31/12/10
Debt limitAmount
drawn down
Amount
drawable
Debt per
books
Airports 16,946 14,398 2,548 15,017
BAA 16,946 14,398 2,548 15,017
Toll Roads 7,590 5,871 1,719 5,768
US toll roads 3,940 2,459 1,481 2,371
Spanish toll roads 2,279 2,210 69 2,191
Other toll roads 1,371 1,202 169 1,206
Construction 153 126 27 142
Services 212 53 159 54
Total borrowings of
infrastructure projects24,901 20,448 4,453 20,981
Balances at 31.12.2009
Debt limitAmount
drawn down
Amount
drawable
Debt per
books
Airports 17,834 14,604 3,230 14,472
BAA 17,834 14,604 3,230 14,472
Toll Roads 9,581 8,170 1,411 8,077
407 ETR 3,274 3,274 3,320
US toll roads 2,639 1,611 1,028 1,535
Spanish toll roads 2,273 2,178 95 2,146
Other toll roads 1,395 1,107 288 1,076
Construction 10 10 86
Services 194 22 172 20
Total borrowings of
infrastructure projects27,619 22,806 4,813 22,655
C.5 BAA’s borrowings: Changes in 2010 and 2009 and main interest
rate and covenant terms
The detail of the BAA Group’s borrowings for 2010 and 2009 and the
most signifi cant changes therein are as follows:
In 2010 the positive evolution of the pound sterling against the euro
had a foreign exchange impact of EUR 510 million on BAA’s borrowings
(1 pound sterling = 0.887 euros at 31 December 2009; against 1 pound
sterling = 0.857 euro at 31 December 2009). Had the exchange rate not
changed, debt would have increased by EUR 35 million (GBP 30 million).
C.5 .A Designated airports
Bonds
The carrying amount of the bonds is EUR 8,185 million (GBP 7,018 mil-
lion), including transaction costs, redemption, premiums and discounts.
The diff erence between the nominal value of such bonds and the carry-
ing amount thereof arose from the recognition at fair value made upon
BAA’s acquisition (2006) thereof. The total bond balance includes EUR
5,267 million issued in pounds sterling and EUR 2,918 million issued in
euros, related exchange risks having been hedged at fair value, as ex-
plained in Note 11 on derivative fi nancial instruments. The bonds mature
from 2012 to 2039. The changes were due to:
The variations between the total bank bor-
rowings and the debt per books at 31 Decem-
ber 2010 are due mainly to the diff erence
between the nominal values and carrying
amounts of the debts, as certain adjustments
are made in accordance with applicable ac-
counting regulations (especially in regard of
unpaid accrued interest and the application of
the amortised cost method).
The drawable balance of EUR 4,453 million
(EUR 4,814 million at 31 December 2009) in-
cludes EUR 2,548 million relating to BAA (EUR
3,320 million at 31 December 2009), which
consists basically of credit lines obtained to
fi nance investments. The main balance in the
Toll Roads segment also relates to amounts
not drawn down that were obtained to fi nance
toll roads under construction.
Following is a more detailed description of in-
terest rates, maturities and covenants for the
main infrastructure project borrowings.
Millions of euros
2010 2009Change
2010-2009
Bonds 8,185 6,485 1,700
Refi nancing facility 1,507 2,539 -1,032
Senior capex facility 1,476 735 741
European Investment
Bank386 419 -33
Subtotal designated
airports11,554 10,178 1,376
Subordinated debt 199 1,752 -1,553
Not designated airports 1,209 1,155 54
Toggle facility 1,055 941 114
Repo facility 170 -170
Class B1 Loan 718 718
Other liabilities 282 275 7
TOTAL 15,017 14,472 545
Millions of euros
Bonds at 31 December 2009 6,485
Issue: 4.125% EUR 500 maturing in 2016 476
Issue: 7.125% GBP 325 maturing in 2017 370
Issue: 6.250% GBP 400 maturing in 2018 457
Sale existing bond: 6.450% EUR 900 maturing in 2031 258
Impact of exchange rate 152
Other -9
Bonds at 31 December 2010 8,185
consolidated fi nancial statements notes to the consolidated fi nancial statements consolidated fi nancial statements notes to the consolidated fi nancial statements

ferrovial Annual Report 2010 219
1. Performance of pound sterling against the euro, giving rise to an in-
crease of EUR 152 million in borrowings.
2. Issuance of new bonds with a carrying amount of EUR 1,303 million
(GBP EUR 1,117 million):
a. Bonds issued in euro for a nominal amount of EUR 500 million ma-
turing in 2016.
b. Bonds issued in pound sterling for a nominal amount of GBP 325 mil-
lion and GBP 400 million with maturities in 2017 and 2018, respec-
tively.
Refi nancing facility
These borrowings were granted to BAA as part of the 2008 refi nancing
process, with a carrying amount of EUR 1,507 million (GBP 1,292 million).
This debt has some maturities falling between 2011 and 2013 and inter-
est tied to LIBOR plus a spread.
The main changes were due to:
1. Performance of the pound sterling against the euro, giving rise to an
increase of EUR 89 million in borrowings.
2. In 2010 debt amounting to EUR 1,122 million (GBP 962 million) was
repaid, the funds for which came from the bonds issued during the year.
Senior capex facility
These borrowings amounting to EUR 1,476 million (GBP 1,266 million),
were obtained to fi nance the Group’s capex programme and mature in
2013. These borrowings are tied to LIBOR plus a spread.
The changes are due basically to the performance of the pound sterling
against the euro, giving rise to an increase of EUR 26 million in borrow-
ings and an increase of EUR 715 million (GBP 613 million) in drawdowns
to fi nance capex in 2010 and refi nance a portion of the subordinated
debt.
European Investment Bank loan
The loan from the European Investment Bank (EIB) has a carrying
amount of EUR 386 million (GBP 331 million), excluding the cost of capi-
talised borrowings. The EIB loan is repayable up to 2022 and it is recog-
nised at amortised cost.
The changes are explained by:
- Changes in the exchange rate, giving rise to an increase of EUR 12 mil-
lion in this debt.
- Repayment of a nominal amount of EUR 46 million (GBP 39 million).
C.5.B Subordinated debt
In 2010 the subordinated debt, which at December 2009 totalled EUR
1,752 million (GBP 1,555 million) was refi nanced. This transaction was
completed using funds as indicated below:
1. In September a new class B1 loan was arranged for a nominal
amount of GBP 625 million and maturing in 4 years.
2. Capex lines of credit of regulated airports amounting to GBP 375
million.
3. Funds from the divestment in associate APP (see Note 25 “Impair-
ment and Disposal of Fixed Assets”) amounting to GBP 100 million.
4. New subordinated loan amounting to GBP 175 million.
5. The remaining refi nancing was completed by bond issues carried
out during the year.
Millions of pound sterling
2009
Subordinated debt 1,555
Total 1,555
Millions of pound sterling
2010
1. Class B1 Loan 616
2. Capex credit lines 375
3. Proceeds from sale of APP 100
4. New subordinated loan 171
5. New bond issue 294
Total 1,555
At 31 December 2010, the carrying amount of the subordinated debt of
the new class B loan maturing in 5 years totalled EUR 199 million (GBP
171 million).
C.5.C Non-designated airports
The borrowings allocated to the unregulated airports (see Note 2)
amounting to EUR 1,209 million (GBP 1,037 million) mature in 2015. The
changes are due to the changes in the exchange rate which increased the
debt by EUR 41 million plus accrued interest payable.
C.5.D Toggle facility
This debt was arranged to fi nance the acquisition of BAA. It is a super-
subordinated debt and is therefore below the subordinated debt for debt
seniority purposes. The debt amounts to EUR 1,055 million (GBP 905
million), matures on a perpetual basis and bears interest at the LIBOR
plus a spread. The balance of this debt increased by the amount of ac-
crued interest payable in 2010 and also increased by EUR 33 million due
to exchange rate fl uctuations.
C.5.E New class B1 loan
In September 2010, BAA arranged a new 4-year class B1 loan for a nom-
inal amount of GBP 625 million. This loan has a carrying amount of EUR
718 million (GBP 616 million) and was used to refi nance the subordinated
debt as discussed above.
C.5.F Other borrowings
In 2010 this item relates mainly to accrued interest payable.
C.5. G BAA’s debt covenants
Most fi nancing agreements include certain conditions the infringement
of which gives rise to obligations for the borrower. These covenants are
used by credit institutions to ensure that the concession operators fulfi l
the debt commitments acquired.
• Bonds and Refi nancing Facility: require compliance with certain cov-
enants under the Common Terms Agreement (CTA).
• Non-regulated airports: a minimum debt service coverage ratio must
be maintained.
• The company must achieve certain ratios such as leverage (net debt/
RAB) of 0.70x for senior debt and 0.85x for junior debt. At 31 December
2009, all of the current ratios were being achieved.
C.5. H Collateral and guarantees
The assets of Heathrow and Stansted airports secure the refi nancing
facility, the aforementioned credit lines, the bond issues and, lastly, the
subordinated debt. The assets of the non-regulated airports secure the
related borrowings.
C.6 Toll Road division borrowings
The breakdown of toll road borrowings, by project, showing the main
characteristics and changes therein, is as follows:
consolidated fi nancial statements notes to the consolidated fi nancial statements consolidated fi nancial statements notes to the consolidated fi nancial statements

ferrovial Annual Report 2010 221
Millions of euros
Borrowings 2010 2009 2008
407 ETR – Canada 3,320 2,801
US toll roads 2,371 1,535 1,184
Chicago Skyway 1,137 1,038 1,071
North Tarrant Express Managed Lanes − NTE 291 274
LBJ Infrastructure Group 428
SH-130 515 223 113
Spanish toll roads 2,191 2,147 2,147
Ausol I and II 491 485 490
Inversora Autopistas de Cataluña / A. Terrasa Manresa 641 627 620
Inversora A. Sur / A. R-4 Madrid Sur 552 547 559
Inversora A. Levante / A. Madrid Levante 507 488 478
Irish toll roads 413 393 396
Eurolink M4-M6 138 138 143
Eurolink M3 275 255 253
Portuguese toll roads 793 684 654
Euroscut Algarve 225 233 245
Euroscut Azores 254 147 93
Euroscut Norte Litoral 314 304 316
Total toll roads 5,768 8,079 7,182
The table below shows the main changes in toll road borrowings:
Millions of euros
407 ETR –
CanadaUS toll roads
Portuguese
toll roadsOther
Total toll
roads
2009 borrowings 3,320 1,535 685 2,539 8,079
Changes:
Exchange rate -424 102 -322
New bond issue 459 459
Extension of existing debt 276 104 64 444
Other -2,896 4 -2,892
2010 borrowings 0 2,372 793 2,603 5,768
C.6. A 407 ETR – Canada
The decrease arising from change in the consolidation method of 407
ETR should be mentioned, which, after the 10% divestment in this com-
pany, began to be accounted for using the equity method (see Note 1.2).
At the end of 2009, this company’s debt totalled EUR 3,320 million.
C.6. B Chicago Skyway
This concession operator is fi nanced by a senior bond issue underwritten
by F.S.A., structured as follows: (i) Series A of USD 439 million maturing
in 2017, and; (ii) Series B of USD 961 million with fi nal maturity in 2026.
It also has syndicated subordinated bank fi nancing drawn down by USD
155 million, maturing in 2035.
C.6.C SH -130
Syndicated bank fi nancing in two tranches: Tranche A to fi nance part of
the construction work amounting to USD 686 million, of which USD 424
million had been drawn down at 31 December 2010, and Tranche B to
ensure liquidity (not drawn down), during the fi rst fi ve years of business
amounting to USD 35 million, both with fi nal maturity in 2038. There is
also a TIFIA debt tranche of USD 430 million to fi nance part of the con-
struction work, maturing in 2047, of which USD 293 million had been
drawn down at 31 December 2010.
C.6. D North Tarrant Express Managed Lanes - NTE
The project is fi nanced through the issue of PAB (Private Activity Bonds)
amounting to USD 400 million maturing in 30 years. There is also a TIFIA
loan granted by the US Federal Government of USD 650 million with a
repayment profi le of 35 years from operation start-up, with no amounts
having been drawn down at year-end. The drawdown amount relates to
the bonds issued.
C.6.E LBJ
This concession operator is fi nanced through the issue of PAB (Private Ac-
tivity Bonds) amounting to USD 615 million maturing in 30 years. There
is also a TIFIA loan granted by the US Federal Government amounting
to USD 850 million with a repayment profi le of 35 years from operation
start up, with no amounts having been drawn down at year-end. The
drawdown amount relates to the bonds issued.
C.6. F Ausol I and II
Ausol toll road refi nanced EUR 492 million in April with a bridge loan
maturing in March 2011, currently being refi nanced.
C.6. G Inversora Autopistas de Cataluña / A. Terrasa Manresa
It refi nanced its debt in 2008 through a syndicated structure, replacing
its short-term fi nancing for other long-term fi nancing amounting to EUR
392 million, maturing in 2035..
C.6. H Inversora A. Sur / A. R-4 Madrid Sur
The Radial 4 toll road had syndicated borrowings of EUR 557 million
outstanding at 31 December 2010. Tranche A amounts to EUR 97 mil-
lion and matures in 2011; Tranche B amounts to EUR 100 million and
matures in 2011; and the EIB tranche amounts to EUR 357 million and
has fi nal maturity in 2033, although the guarantee expires in 2011. The
syndicated loan of this toll road originally matured in January 2011, but
was extended an additional six months until July 2011, and is currently
undergoing a long-term refi nancing process.
C.6.I Inversora A. Levante / A. Madrid Levante
The Ocaña − La Roda toll road has syndicated bank fi nancing with an
outstanding amount of EUR 512 million maturing in 2012. This is a mini-
perm structured loan that will be refi nanced on a long-term basis.
C.6. J Eurolink M4-M6
Financing consists of an EIB loan of EUR 94 million in 2027 and bank fi -
nancing of EUR 49 million with fi nal maturity in 2027.
C.6. K Eurolink M3
Syndicated bank loan drawn down at 31 December 2010 by EUR 280 mil-
lion, comprising a bridge loan of an outstanding amount of EUR 15 mil-
lion and forward fi nancing of EUR 265 million, the fi nal maturity dates
being 2011 and 2025, respectively.
C.6. L Euroscut Algarve
This company has structured debt in two tranches secured by Syncora
Guarantee Inc, one of which is composed by bonds totalling EUR 101 mil-
lion maturing in 2027 and the other by EIB borrowings of EUR 130 million
maturing in 2025.
C.6.M Euroscut Azores
Syndicated bank fi nancing for a drawn down amount at 31 December
2010 of EUR 258 million until 2033.
C.6. N Euroscut Norte Litoral
Financing structure based on a syndicated loan for an outstanding
amount of EUR 300 million, with fi nal maturity in 2026.
C.6. O Guarantees and covenants for toll road borrowings
The fi nancial conditions (applicable interest rates) of the toll road debts
are subject to the achievement of certain ratios based on fi nancial ag-
gregates such as gross profi t from operations (EBITDA), net debt and
consolidated shareholders’ equity. In general, the aforementioned fi -
nancing arrangements are subject to pledges of concession operator
assets (insurance policies receivables, current accounts, concession re-
ceivables, etc.), forming a package of guarantees for lenders. In certain
cases there is also a pledge on the concession operator’s shares.
consolidated fi nancial statements notes to the consolidated fi nancial statements consolidated fi nancial statements notes to the consolidated fi nancial statements

ferrovial Annual Report 2010 223
Most agreements include certain conditions the infringement of which
gives rise to obligations for the borrower. These covenants are used by
credit institutions to ensure that the concession operators achieve the
debt commitments acquired.
The most common covenants included in the majority of infrastructure
project fi nancing agreements are as follows:
- Restrictions on the availability of cash balances, the most common
being reserve accounts for debt servicing and for extraordinary
maintenance.
- Payment of dividends to shareholders subordinated, for example, to
the maintenance of required levels of restricted cash.
- Material adverse change or eff ect (MAC or MAE) clauses regulating
cases in which a number of circumstances or events have or could
have a relevant adverse eff ect on the value, business, operations,
assets or liabilities of the concession operators.
- Limit on the maximum volume of borrowings that may be obtained by
the concession operator.
- Limit on the level of default by the concession operator, above which
the debt repayment could be demanded (cross-default threshold).
- Periodic disclosure obligations during the debt period.
- Achievement of fi nancial ratios for borrowings and liquidity.
At 31 December 2010, none of the applicable covenants in force had
been breached.
C.7 Services division borrowings:
The bank borrowings of the Services Division infrastructure projects re-
late to the Cespa Group totalling EUR 54 million at 31 December 2010.
These borrowings were arranged in 2009 and 2010 to fi nance the Eco-
parc Can Mata (EUR 43 million) and Gestión Medioambiental de Toledo
(EUR 11 million) concession projects.
19.2 Net cash position excluding infrastructure projects
A. Breakdown of the net cash position excluding infrastructure proj-
ects
The detail of the net cash position excluding infrastructure projects in
2010 is as follows:
Millions of euros
Non-
current
restricted
cash
Current
restricted
cash
Other cash
and cash
equivalents
Deuda
Financiera
Operaciones
Intragrupo
Posición
Neta Tota
Construction 1,057 49 1,266 2,275
Services 0 4 117 170 -784 -833
Airports 3 19 22
Toll Roads and Car Parks 2 201 369 572
Corporate and other 8 613 1,844 -781 -2,005
Net cash position excluding infrastructure
projects0 14 1,991 2,063 89 31
The main changes in the net cash position excluding infrastructure proj-
ects are discussed in Note 31 on “Cash Flows”.
B. Breakdown of borrowings excluding infrastructure projects
B.1 Analysis of current and non-current balances by business
division
The distribution of bank borrowings is as follows:
Millions of euros
2010 2009 2008
Non-
currentCurrent TOTAL
Non-
currentCurrent TOTAL
Non-
currentCurrent TOTAL
Change
2010-
2009
Change
2009-
2008
Construction 28 21 49 17 32 49 21 65 86 -37
Services 99 71 170 266 89 355 198 200 398 -185 -43
Airports 0 0 0 1,583 1,583 -1,583
Corporate and
other1,815 29 1,844 1,970 276 2,246 870 441 1,311 -402 935
Total bank
borrowings exclu-
ding infrastructu-
re projects
1,943 120 2,063 2,253 397 2,650 2,672 706 3,378 -587 -728
consolidated fi nancial statements notes to the consolidated fi nancial statements consolidated fi nancial statements notes to the consolidated fi nancial statements

ferrovial Annual Report 2010 225
B.2 Maturities by currency and fair value of borrowings excluding
infrastructure projects
The diff erences between the total maturities of bank borrowings and the
carrying amounts of the debt at 31 December 2010 are explained mainly
by the diff erence between the nominal values and carrying amounts of
the debts, as certain adjustments are made in accordance with appli-
cable accounting regulations (especially unpaid accrued interest and the
application of the amortised cost method). The debt maturities do not
include interest.
The total fair value of bank borrowings excluding infrastructure projects
at 31 December 2010 was EUR 2,063 million (EUR 2,650 million at 31
December 2009).
The 2011 maturities total EUR 59 million and relate mainly to the Servic-
es Division, particularly Inagra (EUR 17 million), Cespa Portugal (EUR 13
million), Donarbon (EUR 11 million), Sopovico (EUR 5 million), Recogida
de Residuos de Barcelona (EUR 4 million) and other (EUR 9 million).
B.3 Exposure to interest rate risk excluding infrastructure projects
In order to complete the information on exposure to interest rate risk pre-
sented in Note 3, following is the detail of the various debt components
indicating the portion subject to fi xed interest rates, the portion hedged
by derivatives and fl oating-rate debt.
CurrencyFair value
2010
Ca rrying
amount
Maturities
Total maturities2010 2012 2013 2014 2015 2016 and
after
Construction 49 49 1 13 0 0 3 13 30
EUR 32 32 13 13
USD 11 11 11 11
PLZ 6 6 1 2 3 6
Services 170 170 58 42 9 8 9 14 140
EUR 116 116 40 6 9 8 9 14 86
GBP 46 46 11 35 46
CHF 6 6 6 6
OTRAS 2 2 1 1 2
Corporate and other 1,844 1,844 0 1,834 0 0 0 0 1,834
EUR 883 883 873 873
GBP 815 815 815 815
CHF 146 146 146 146
Total bank borrowings
excluding infrastructure
projects
2,063 2,063 59 1,889 9 8 12 27 2,004
Millions of euros
Type of debtBalance at
31/12/10
% Balance at
31/12/09
% Balance at
31/12/08
%
Construction 49 50 86
Fixed 0 0% 0 0% 22 26%
Hedged (IRS) 18 36% 23 46% 0 0%
Floating 31 64% 27 54% 64 74%
Services 170 354 398
Fixed 4 2% 3 1% 7 2%
Infl ation-index fi xed 0 0% 23 6% 20 5%
Hedged (IRS) 30 18% 27 8% 0 0%
Floating 136 80% 301 85% 371 93%
Airports 0 0 1.583
Fixed 0 0% 0 0%
Hedged (IRS) 0 0% 1.583 100%
Floating 0 0% 0 0%
Corporate and other 1,844 2,246 1,311
Hedged (IRS) 820 44% 1,188 53% 60 5%
Floating 1,024 56% 1,058 47% 1,252 95%
Total bank borrowings
excluding infrastruc-
ture projects
2,063 2,650 3,379
Fixed 4 0% 3 0% 29 1%
Infl ation-index fi xed 0% 23 1% 20 1%
Hedged (IRS) 868 42% 1,237 47% 1,643 48%
Floating 1,191 58% 1,386 52% 1,687 50%
consolidated fi nancial statements notes to the consolidated fi nancial statements consolidated fi nancial statements notes to the consolidated fi nancial statements

ferrovial Annual Report 2010 227
The debt balances hedged by IRSs (interest rate swaps) relates to deriva-
tives that convert fl oating-rate bank borrowings to fi xed interest rates
(see Note 11).
B.4 Information on credit limits and drawable credit
Set out below is a comparative analysis of borrowings not drawn down
at year end:
The diff erences between total bank borrowings and the carrying amount
thereof at 31 December 2010 are explained mainly by the diff erence be-
tween the nominal values and carrying amounts of the debts, as certain
adjustments are made in accordance with applicable accounting regu-
lations.
Set out below is a more detailed description of interest rates, maturities
and covenants for the main borrowings excluding infrastructure proj-
ects:
Balances at 31/12/2010
Borrowings Debt limitAmount drawn
down
Amount
drawable
Consolidated
debt
Construction 111 30 81 49
Services 273 140 133 170
Corporate and other 2,539 1,834 705 1,844
Total bank borrowings excluding infrastructure projects 2,923 2,004 919 2,063
Balances at 31/12/09
Borrowings Debt limitAmount drawn
down
Amount
drawable
Consolidated
debt
Construction 99 23 76 50
Services 459 311 148 355
Corporate and other 2,889 2,245 644 2,245
Total bank borrowings excluding infrastructure projects 3,447 2,579 868 2,650
The main changes during the year include:
a) Redenomination or transfer of EUR 854 million of tranche A1 denom-
inated in euro to a new tranche A3 denominated in pound sterling.
b) Early repayment of a portion of the nominal amount of the exist-
ing debt amounting to EUR 152 million relating to EUR 79 million of
tranche A1 and EUR 73 million of tranche A3.
c) Total repayment of tranche B amounting to EUR 251 million.
d) The fall in value of the euro vis-à-vis the Swiss franc and pound ster-
ling led to increased indebtedness of EUR 23 million and EUR 35 mil-
lion, respectively.
B.5 Corporate: Borrowings of Ferrovial, S.A.
B.5.1 Changes in borrowings
The changes in Ferrovial, S.A.’s borrowings in 2010 were as follows:
Millones de Euros
Balance at
01/01/10Increase Decrease Transfers Interest
Eff ect of
exch. rate
Balance at
31/12/10
Non-current bank borrowings 1,911 0 -183 0 24 58 1,810
Tranche A1 1,788 0 -110 -854 16 0 840
Tranche A2 123 0 0 0 0 23 146
Tranche A3 0 0 -73 854 8 35 824
Current bank borrowings 251 0 -251 0 0 0 0
Tranche B 251 0 -251 0 0 0 0
Finance leases 0 3 0 0 0 0 3
Total 2,162 3 -434 0 24 57 1,813
consolidated fi nancial statements notes to the consolidated fi nancial statements consolidated fi nancial statements notes to the consolidated fi nancial statements

ferrovial Annual Report 2010 229
B.5.2 Main features of the bank borrowings
A. Structure
(i) Accounted for using the amortised cost method.
Millions of euros
Principal Interest (i) Total
Tranche A1 824 16 841
Tranche A2 146 0 146
Tranche A3 815 8 823
Total bank borrowings 1,785 24 1,810
Tipo de deuda Millions of euros
Balance at
31/12/10%
Balance at
31/12/09%
Fixed 0 0% 0 0%
Hedged 793 44% 793 42%
Floating 992 56% 1,111 58%
Total 1,785 1,904
- Tranche A1, denominated in euros.
- Tranche A2, denominated in Swiss francs. The amount drawn down
against this tranche may be converted to euros at the end of any in-
terest period, provided that the amount is converted only once dur-
ing the life of the tranche for the total amount drawn down in Swiss
francs.
- Tranche A3, available in pounds sterling.
There are also undrawn credit lines:
- a tranche C, forming part of the corporate debt, consisting of a re-
volving working capital facility of EUR 541 million, which has a maxi-
mum duration of three years; and
- a bilateral credit line of EUR 120 million maturing in 2013.
The borrowings at 31 December 2010 are structured in a single tranche
maturing in December 2012, which, in turn, is subdivided into three sub-
tranches, based on the currency in which the related amounts are drawn
down. The amounts drawn down are as follows:
B. Applicable interest rates and credit limits
The interest rate applicable to the principle of fi nancing is EURIBOR (for
amounts drawn down in euros) / LIBOR (for amounts drawn down in
Swiss francs and pounds sterling) plus a spread.
For the purposes of the accrual and settlement of interest on amounts
drawn down, each drawdown will be divided into interest periods of three
or six months (at Ferrovial’s discretion).
For the same purposes, each Tranche C drawdown will have a duration
of 15 days or one, two, three or six months (at Ferrovial’s discretion), while
in the bilateral credit facility the drawdowns can be made every 15 days.
As regards exposure to interest rate risk, set forth below is a detail of debt
components indicating the portion tied to fi xed interest rates, the portion
hedged by derivatives and portion tied to fl oating rates.
Millions of euros 2.011 2.012 2.013 2.014 2.015 Total
Tranche A1 869 869
Tranche A2 146 146
Tranche A3 815 815
Total 0 1,830 0 0 0 1,830
As regards Ferrovial, S.A.’s exposed borrowings, a fl uctuation of 100 ba-
sis points in the interest rate would have an impact of EUR 10 million on
the income statement (EUR 7 million on the net profi t).
C. Maturities
The detail of the nominal maturities of the bank borrowings is as follows:
The diff erences between the nominal amount refl ected in the table
above and the Tranche A1 principal amount is due to the accounting ad-
justment of the fees on the transaction using the amortised cost method,
as mentioned previously.
D. Financial obligations and guarantees
Ferrovial S.A. must fulfi l the following fi nancial obligations during the
term of the fi nancing, which will be assessed every six months:
i. The Group’s Net Financial Debt/EBITDA ratio must not exceed certain
pre-established levels.
ii. The Group’s EBITDA/Net Finance Costs ratio must not fall below cer-
tain pre-established levels.
For the purposes of fulfi lling the above-mentioned ratios, the Group is
deemed to include the consolidated Group companies, excluding infra-
structure projects, and other companies (mainly Amey, Budimex, Web-
ber, BAA and BNI).
The company was achieving both ratios at 31 December 2010.
consolidated fi nancial statements notes to the consolidated fi nancial statements consolidated fi nancial statements notes to the consolidated fi nancial statements