management - nasa carbonate l . butyrolactone 3. dimethylsulfoxide 4. dimethyl formamide 5....
TRANSCRIPT

NASA CR - 54874
FOURTH QUARTERLY REPORT
Research and Development of a High Capacity
Nonaqueous Secondary Battery
R.G. Selim, K . R . Hill, and M.L.B. Rao
July - September, 1965
Prepared for
NATIONAL AERONAUTICS AND SPACE ADMINISTRATION
November 11, 1965
CONTRACT NAS 3-6017
Technical Management
Space Power Systems Division
National Aeronautics and Space Administration
Lewis Research Center, Cleveland, Ohio
Mr. Robert B. King
P. R . Mallory & Co. Inc. Laboratory for Physical Science
Northwest Industrial Park Burlington, Massachusetts
https://ntrs.nasa.gov/search.jsp?R=19660006498 2018-06-26T04:44:18+00:00Z

TABLE OF CONTENTS Page No.
Abstract
Summary
I. Introduction
11. Cathodes
3 A. Characterization of CuF and CoF L 1. X-ray examination
L. Solubility of CuF and CoF, 2 3
Formal Reduction Potentials in Nonaqueous Solvents B.
C . Discharge of CuF 2 1. Discharge in Acetonitrile
2 . Discharge in Butyrolactone
3 . Discharge of Teflon Containing Mixes
4. Discharge of Naphthalene Containing Mixes
D. Discharge of Other Materials
E . Discharge in Starved Electrolyte
F.
G.
Cycling of Silver Chloride Electrodes
Cycling of Copper Chloride Systems
111. Anodes
A.
B.
C . Bulk Lithium Metal Electrodes
D. Lithium Deposition in Acetonitrile
Effect of Water on Lithium Deposition
Cycling of Lithium in Starved Electrolyte
Tv. Solvents
A. Solvent Purification
1. Propylene Carbonate
L . Butyrolactone
3 . Dimethylsulfoxide
4. Dimethyl formamide
5 . N-nitroso Dimethylamine
6 . Acetonitrile
7 . n-Butyl formate
i
ii
.
1
1
1
2
4
13
1 3
1 6
1 8
20
21
24
26
27
3 4
3 4
42
44
50
52
52
52
54
55
56
57
57
57
TABLE OF CONTENTS (Con't .}
Page No.
B. Cathodic Behavior in Propylene Carbonate Solutions 57
C . Cathodic Behavior in Acetonitrile Solutions ;1
D. Mass Transport Properties in Starved Electrolytes 64
V. Future Work 66 .
.
.

.
Figure 1.
Figure L.
Figure 3.
Figure 4 .
Figure 5.
Fig1w-e 6 .
Figure 7 .
Figure 8 .
Figure 9 .
Figure 10
Figure 11.
LIST OF FIGURES Page No.
Anodic Dissolution of Silver in Propylene Carbonate
Anodic Dissolution of Cadmium, Lead and Copper in Propylene Carbonate
Reduction Potentials of Metal/Metal Ion Couples
Reduction Potentials of Metal/Metal Ion Couples
Cathodic Discharge of CuF7 in Acetonitrile
n; ccharrro of C I I F
Cathodic Discharge of Various Materials
Cell for Starved Electrolyte Studies
Cycling of Copper Electrode in Propylene Carbonate
Cathodic Efficiency o n Cycling of Copper in Propylene Carbonate
Cycling of Copper Electrode in Butyrolactone
-
in RlltyrDlactOnp - -- 2 --- --- -A" " v l y v
Figure 12. Cycling of Copper Electrode in Dimethylformamide
Figure 13. Vapor Phase Chromatogram of Water in Propylene Carbonate
Figure 14. Vapor Phase Chromatograms in Propylene Carbonate
Figure 15. Va;m Phase Chromatograms of Propylene Carbonate
Figure 16. Vapor Phase Chromatograms of Propylene Carbonate
Figure 17. Cathodic Chronopotentiometry in Propylene Carbonate- 0.1M LiBF
Figure 18. Cycling of Lithium in Propylene Carbonate
Figure 19. Cathodic Chronopotentiometry on Lithium and Platinum
Figure LO. Current-Potential Curve for Bulk Lithium Anodization
Figure 21. Deposition Efficiency of Lithium in Acetonitrile
Figure L L . Reduction in Propyl-ammonium Salt Solutions
Figure 23. Reduction in Magnesium Salt Solutions
Figure 24 . Cathodic Chronopotentiometry in Acetonitrile
Figure L 5. Cathodic Chronopotentiometry in Acetonitrile
4
6
7
8
9
1 4
1 7
2 2
25
28
3 0
3 2
3 3
3 5
3 6
3 8
39
40
45
47
49
5 1
59
60
62
63
Figure 26 . Mass Transport Properties in Starved Electrolyte Cell 65

Table 1.
Table 2 .
Table 3 .
Table 4.
Table 5 .
‘i’abie 6.
Table 7 .
Table 8.
Table 9 .
Table 10.
Table 11.
Table 12.
Table 13.
Table 14.
LIST OF TABLES
Solubility of CuF a n d CoF in Organic Solvents L 3 Formal Reduct ion Potentials
Discharge of CuF in Acetonitrile 2 Discharge of CuF in Butyrolactone L Discharqe of CuF
Discharge of GuF
Discharge of CuCl i n Propylene Carbonate
Discharge of AgCl in LiClO
Deposition of Lithium in P.C. (0.11 M in Water)
Cycling of Lithium in Starved Electrolyte
Purification of Propylene Carbonate
Purification of Butyrolactone
Purification of Dimethyl sulfoxide
Electrochemical Behavior in Acetonitrile
Mixes with Teflon Binder
blixes with iu’aphthaiene L
L
Solutions 4
Page No.
3
11
1 3
1 0
19
20
2 1
23
4 1
43
53
5 5
56
61

Research and Development of a High Capacity
Nonaqueous Secondary Battery
R.G. Selim, K . R . X i l l , and M.L.E. Rao
ABSTRACT /5-7g7 The individual processes and phenomena attending secondary
cell operation a re discussed and experimental data presented concerning
lithium deposition and cycling, ionic solvation , cathode construction
and discharge efficiency, and solvent purification. Solvents of particular
interest a re propylene carbonate, butyrolactone , .dimethylformamide ,
dimethylsulfoxide, and acetonitrile.
i

Research and Development of a High Capacity
Nonaqueous Secondary Battery
by R. G. Selim, K. R. Hill , and M.L.B. Rao
SUMMARY
The objective of our work is to learn enough about the processes which
occur during secondary cell operation to enable u s , a t the end of the contract
period, to make appropriate recommendations concerning the direction in
which future development work o n secondary, non-aqueous cells should take.
A variety of phenomena and properties will influence cell performance.
Some of these are discussed i n the remainder of this summary. It is most un-
l ikely that a fortuitous combination of necessary conditions will be found which
immediately result i n the development of a complete cell with satisfactory char-
acter is t ics . Thus, we have continued to focus attention on specific phenomena
and properties. The purpose of t h i s is to generate enough data to allow s o m e
interpretation of the behavior observed with prototype electrodes and ce l l s , and
to indicate areas in which further study is required before it is expedient to
undertake a serious cell development program.
An important property of the solvent is its ability to solvate ions. One
expects significant differences to exist for different solvents.
i n the solubility of s a l t s a s well a s the oxidation-reduction potentials of
redox couples. We have begun an investigation of the latter: and the most sig-
nificant point is that copper (11) is evidently considerably less strongly solvated
in butyrolactone , propylene carbonete , and acetonitrile than in water. This
influences the relative stability of copper (I) and copper (11) to the degree tha t ,
i n these solvents, copper (I) is i n fact the spec ies produced in largest quantity
This is reflected
ii

on anodization. The solubility of CuF has a l so been investigated. M o s t note-
worthy is the enhanced solubility in the presence of lithium salts.
propylene carbonate we have found the solubility of CuF
th i s increases to 0 .02 to 0 . 0 3 M when the solution is made 0 . 1 M i n LiC104
or LiBF4. While, this may be the result of impurities we believe it more likely
that copper (11) is displaced from its fluoride by lithium ions.
' *
2 Thus, in
to be about 0.0001 6 M , 2
The mode of electrode construction is critical i n determining the behavior
2 of cathode sa l t s . We nave attempted to imprclvz: the p e r f o m a x e of CuF
ekctmdes through the incorporation of Teflon powder binders.
remained about 40-50% a t currents of 0.5 to 5 mA c m
conducted i n excess propylene carbonate - LiClO
indicate that the reduction proceeds through an intermediate, soluble copper (I) spec ie s , which escapes from the electrode before further reduction can occur.
We have attempted to improve the electrode structure through the initial incor-
poration and subsequent sublimation of naphthalene which , we believe, may
increase the porosity. Again the maximum efficiency realized was 51 % a t 4.2
mA c m
Efficiency stiii - 2 . These discharges were
The results may electrolyte. 4
- 2 . Considerable t ime is required to completely remove the naphthalene.
One expects a difference in performance between discharge i n excess
electrolyte and in starved electrolyte. Cells incorporating CuF2 and lithium
have been subjected to discharge in starved electrolyte. A t currents of 1 to
10 mA c m
the efficiencies varied from 13% to 42% and reflect, we believe, inadequate
cell construction and leakage of electrolyte from the cell.
- 2 the discharge curves were flat , and there was little polarization but
Porous copper electrodes have been cycled in three electrolytes. Each
cycle consis ts of anodic oxidation for a pre-determined period of time,
followed by cathodic discharge to a specified cut-off voltage.
continuous. In a propylene carbonate - LiAlCl
cycles at 1 0 mA c m
70-76% of the current passed during the preceding anodization could be recovered
before polarization occurred. In butyrolactone - LiC1 and dimethylformamide -
Cycling was
copper could be cycled for 32 4 with 70-76% efficiency. That i s , on cathodization - 2
iii
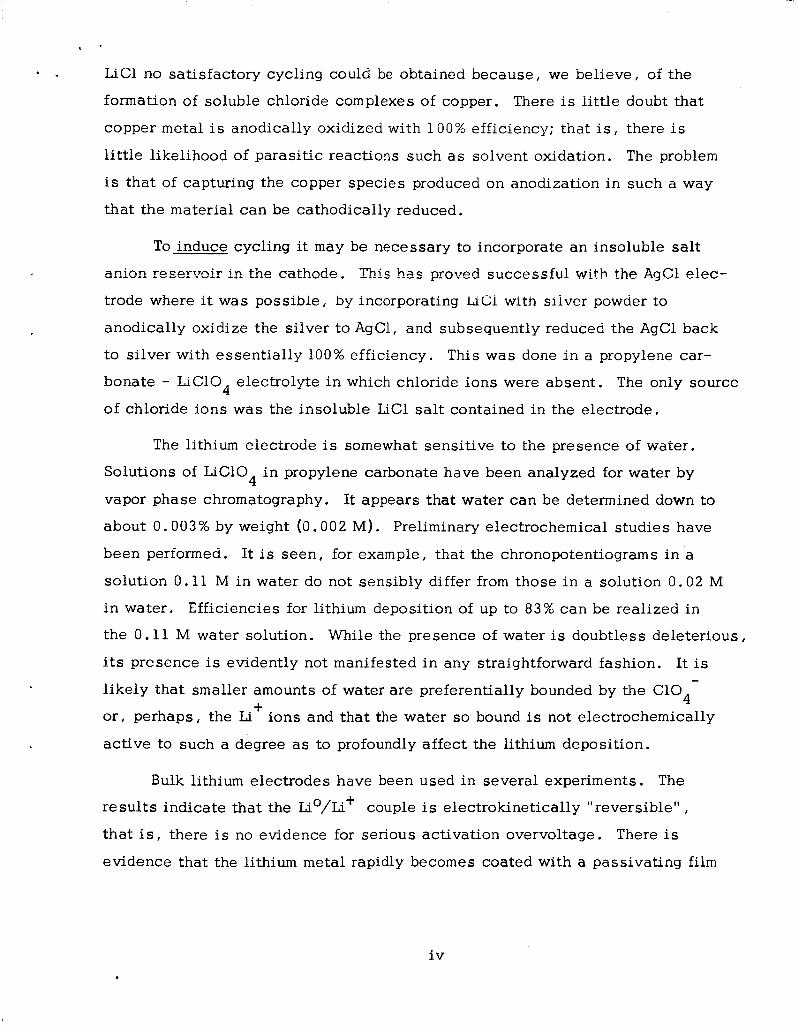
. . ' . LiCl no satisfactory cycling could be obtained because, we believe, of the
formation of soluble chloride complexes of copper.
copper metal is anodically oxidized with 100% efficiency; that i s , there is
little likelihood of parasitic reactions such a s solvent oxidation. The problem
is that of capturing the copper species produced on anodization i n such a way
that the material can be cathodically reduced.
There is little doubt that
To induce cycling it may be necessary to incorporate an insoluble salt
anion reservoir i n the cathode. This hac proved successful with the AgCl elec-
trode where it was possible, by incorporating LiGl with silver powder to
anodically oxidize the silver t o AgC1, and subsequently reduced the AgCl back
to silver with essentially 100% efficiency. This was done i n a propylene car-
bonate - LiClO electrolyte i n which chloride ions were absent. The only source
of chloride ions was the insoluble LiCl salt contained i n the electrode. 4
m, i n e lithium eiectrode is somewhat sensit ive to the presence of water.
Solutions of LiClO i n propylene carbonate have been analyzed for water by
vapor phase chromatography. It appears that water can be determined down to
about 0 .003% by weight (0.002 M). Preliminary electrochemical studies have
been performed. It is seen , for example, that the chronopotentiograms i n a
solution 0.11 M i n water do not sensibly differ from those i n a solution 0 . 0 2 M
i n water. Efficiencies for lithium deposition of up to 83% can be realized i n
the 0.11 M water solution. While t h e presence of water is doubtless deleterious,
its presence is evidently not manifested i n any straightforward fashion. It is
likely that smaller amounts of water are preferentially bounded by the C104
or, perhaps, the Li
active to such a degree a s to profoundly affect the lithium deposition.
4
- +
ions and that the water so bound is not electrochemically
Bulk lithium electrodes have been used i n several experiments. The
resul ts indicate that the Lio/Li+ couple is electrokinetically "reversible" ,
that i s , there is no evidence for serious activation overvoltage. There is
evidence that the lithium m e t a l rapidly becomes coated with a passivating f i lm
i v

which inhibits chemical reaction with the electrolyte and a l so results i n a
significant i R drop.
The primary problem with the lithium electrode is that of inducing more
efficient deposition and decreasing the rate of chemical reaction. We believe
th i s will turn out to be a much more complex problem than is generally under-
stood. I t h3s seemed desirable to develop a broader phenomenological des-
cription of cathodic behavior i n various electrolytes.
fcr v a r i ~ i ~ s aretnnitri le and Fropylene carbonate solutions. These results will
not be further discussed in t h i s summary other than to note that the results in
acetonitrile are not, generally, qualitatively different from those in propylene
carbonate and primarily reflect the greater rate of m a s s transport i n acetonitrile
because of its lower viscosity.
The results are described
The purification of solvents is expected to be important. Work has con-
tinued and results are reported on the purification and subsequent gas chrom-
atographic analysis of propylene carbonate, butyrolactone , dimethylformamide ,
acetonitri le, n-butyl formate, N-nitrosodimethylamine and dimethylsulfoxide.
The results cannot be conveniently summarized other than to note that vacuum
distillation does not effect a s clean a separation a s might be desired and that
water , which is but one of a number of impurities in most of the solvents, has
not been reduced to levels of less than 0 .002 M , even after prolonged stand-
ing over molecular s ieves .
V
I. INTRODUCTION
The answers t o two questions of primary importance are sought with
respect to secondary cell electrodes:
What properties must a n environment have to allow one to induce
cyclability of cathode materials ?
~ ~ n - - r V V l l Q L ------:-- p1upCz;l L L G J -17-+ I I I U i l C UI. an nnxrirnnmont u.. 1 --..---.----- h 5 x . 7 ~ to allow one to efficiently
cycle the lithium electrode?
We believe much of the confusion that ex is t s in the study of non-
aqueous systems ar i ses from a n unsatisfactory differentiation between the
inherent properties of materials -- anodes I cathodes, solvents I solutes I
etc. I -- and the nature of t h e interactions between materinls.
A further problem in this area a r i ses from the l a c k of established
criteria by which systems or environments shall be evaluated. It i s ,
therefore, as much an objective of our work to attempt to determine the
best criteria by which systems should be evaluated with respect t o further
development as it is t o determine what t hese systems are . In our work to
date we have considered various individual phenomena and interactions
which I we believe I are likely to be relevant t o secondary cell operation.
The criteria by which systems will be evaluated will be a composite of the
degree to which systems show satisfactory behavior with respect to t h e
various specific conditions required for cyclable cells
A. Cathodes
For reasons discussed previously (3rd Quarterly Report I p . l ) , we still
consider the CuF
whether t h e CuF electrode is cyclable is probably meaningless, so s ta ted. 2
The proper question i s , what can be done to effect an environment in which
one may expect to induce cyclability of CuF
electrode the best cathode candidate. The question of L
We now consider the conditions 2 '
v i

~ requisite for cyclability i n describing the work of the past quarter.
1. The environment in which cyclability may be induced should be one
in which the electrochemically act ive cathode material is trapped in t h e
electrode region. This is t o prevent direct chemical reaction with the
anode material and to have the act ive material available for subsequent
cathodic discharge.
The m o s t desirable cathode material is probably a n insoluble salt.
Eiiring :he past quartsr we have investigated the solubility of CuF, and
CoF
dimethylformamide (DMF); and I acetonitrile (AN).
are satisfactorily low, but these results should be considered tentative in
view of solubilization through impurities in the salt or solvent.
L r- i n four solvents ( p . L): propylene carbonate \YGJ; butyroinctoiie (BL); 3 The apparent solubilities
The composition of the two salts was therefore analyzed (p. 1,3-4).
CoF3 I as received from t h e vendor I was found to be grossly impure. CuFL
was found to be satisfactorily pure.
L. The environment in which cyclability may be induced should be one
in which the electrochemically act ive cathode material may be efficiently
discharged.
We have previously reported (3rd Quarterly Report, pp. 68-79), the
resul ts of a large number of experiments concerned with the cathodic
discharge of CuF
of interest to investigate what may be done to enhance efficiency.
Efficiencies of ~5-50% were generally realized. It is 2 '
During the past quarter, attempts were made to improve the physical
stabil i ty of the CuF electrode through incorporation of a Teflon binder (p. 18).
The results were unsatisfactory in that improved efficiency at low currents
was not realized.
2
During the past quarter, we have attempted to improve the performance
of the CuF electrode through inducing porosity by incorporation of naphthalene.
in the electrode m i x , followed by subsequent sublimation (p. 19). 2
The resul ts

were no better than those obtained by incorporating a sa l t in the m i x which,
by solubilization, may result in a porous electrode or a more concentrated
electrolyte.
It is a possibility t h a t inefficiency might be inherent in the operation
of cathodes in poorly conducting, non-aqueous media. We have studied the
discharge of seven other cathode materials ( p . LO-23 ) . Efficiencies were
sufficiently satisfactory to indicate that the nature of the medium is not
L . . * L V * i n h m r P n t l v -..-a, **-..*---* 1 i m i t i n g to cathodic discharge.
It is a possibility that inefficiency might be inherent in the nature of
the reduction of CuF2. We have attempted to use X-ray diffraction as a
means of studying the reaction ( p . 1-2). The resul ts a re not yet satisfactory
because of a number of experimental problems.
3 . The environment in which cyclability may be induced should be one in
which the reduction product of the electrochemically act ive cathode material
may be subsequently re-charged , anodically, t o its original form.
For an insoluble sa l t cathode material, th i s environment must be one
in which ex is t s a reservoir of anions available for re-precipitation of the
cathode salt on charge. Two types of reservoirs are considered: one in which
the anions are soluble,. t h e other in which the anions a re present in an insol-
uble salt. We have considered both types of si tuations.
The cycling of copper electrodes in three soluble chloride media has
been investigated (pp.26-31.). In only one situation could the copper be
anodically oxidized t o a n insoluble salt.
not rendered immobile on anodic oxidation but simply went into solution.
Satisfactory cycling behavior up to thirty-two cycles was obtained in the
first electrolyte.
In the other , the copper ions were
The u s e of an insoluble anion reservoir has been investigated with
AgCl electrodes (p. 25-26). The results indicate that the principle is valid
vi ii

and can be used for secondary cell cathode cycling.
We do not yet have enough information to indicate what types of
electrolytes may be required for similar operation of the CuF electrode and
a re attempting to acquire such information through such measurements as
oxidat ion potentials , which reflect important differences between solvents
with respect to solvation energies.
2
B. Anodes
We know the lithium electrode is cyclable in various media. The
In the past our problem remains one of inducing more efficient cycling.
approach has been to consider what type of electrochemical behavior would
be observed if the reduction of lithium were a simple, reversible, one-electron
process and compare this with the type of behavior actually observed
(2nd Quarterly Report, pp. 7-26). The results have consistently shown that
the process of reduction to the m e t a l is , in fact, not simple.
T o learn m o r e about the general nature of cathodic reduction in non-
aqueous electrolytes we have continued to investigate other systems
(p. 49-50, 56-63) and hope, by the end of the contract period, to have
established a fairly clear phenomenological description of a sufficient variety
of systems to allow a reasonable assessment of the expected relative utility
of the systems.
We have examined the behavior of bulk lithium electrodes (pp. 43-48).
This has been of interest primarily in indicating the existence of resis t ive
f i l m s formed on the electrode surface through reaction with the electrolyte
which then inhibit further reaction.
The cycling of the lithium electrode has been studied over several
In t h e systems chosen for study the results did not cycles (pp. 4.~-43).
indicate a catastrophic or serious cumulative failure.
ix

The role of impurities on the lithium electrode remains unsolved.
We have further investigated the effect of water and found (pp. 3 3 - 4 )
in the conditions studied, no catastrophic effect on lithium deposition.
C . Solvents
Solvents have been examined with respeci io piirifizztisn throcqh
vapor phase chromatography (pp. 51-56).
X

11. CATHODES
3 II-A. Characterization of CuF, and. CoF
II-A- 1. X-ray examination
X-ray diffraction has been used as an auxiliary technique
for studying e?ectiode behavior. Our initial objective was simply to examine
the electrode both before and after discharge to see what insolubie materiais
form as a result of discharge.
A major problem involved the pick-up of water both by the
CuF and by the LiClO incorporated in the electrode m i x . The pick-up of water
by CuF is shown by the data given below. Samples of CuFz taken from the
bottle were treated as indicated. The subsequent X-ray spectra were well-defined.
All of the l ines could be identified a s belonging either to CuF2 or to CuF 2H20.
The relative intensit ies of the l ines agreed satisfactorily with those given i n the
literature.
strongest lines; for CuF, a t 3.219E, and for CuF
2 4
2
2 '
For convenience we compare the relative intensit ies of the two
2H,O a t 4.72 8. 2' L
Relative Maximum Intensity : CuF2.2H 0 CuF2 2
L
Sample Treatment
Powder, directly from bottle
Powder, dried i n vacuum oven a t
Powder pressed at 6000 lb.
1 5OoC for 1/2 hr.
after 1 hr.
after 6 hrs.
after 23 hrs.
after 47 hrs.
Powder, placed in desiccator with water
3.3 0.7
7.4 ca. 0.3
5.8
4.5
3.0
2.0
0.0
2.0
3.0
4.3
4.8
3.7
It would appear that the sample used is largely anhydrous CuF2.
1

N e x t , several m i x e s of CuF2, LiC104 , and acetylene
black were prepared and subjected to X-ray examination. The results were
quite variable. In the "best" mix the relative intensity of the major C-F 2
2 to the CuF2. 2H 0 line was 2.5 to 1 .0 . However, in another m i x no CuF
lines were observed at all, indicating extensive hydration. The LiC104. 3H2G
spectrum was evident i n varying degree i n all mixes. In addition a number of
xnknown l ines were observed at the following spacings: 6.32, 5 .71 , 5.2? ,
4.35, 4 .06 , 3.92, and 3.832. We do not know the source of these l ines . We
have no information on the X-ray spectrum of anhydrous LiC104, but certainly
such wide spacings as 6.328 cannot derive from this material.
line
2
Finally, two of the m i x e s were discharged to 30% of theor-
etical capacity and the spectra examined. Two materials were evidenced in the
discharged m i x e s , CuF and CuF .2H 0. No l ines for LiClO . 3H20 were ob- 2 2 2 4 served. Al l of the previously described unknown l ines disappeared except t h a t
l ine at 5.27g; which was quite pronounced i n both discharged specimens. In
addition the first line for metallic copper, at 2.0882, was observed, though the
intensity was weak. Since this l ine is sufficiently widely separated from the
nearest l ines for CuF or CuF .2H 0, it is probable that metallic copper had , 2 2 2 i n fact, been formed. We had also sought evidence for the formation of insol-
uble LiF; however, the three strongest l ines for this material overlap those for
CuF .2H 0 and it was not possible to obtain information on the presence of 2 2 LiF.
II-A-2. Solubility of CuF, and CoF3 L
To a 50 ml . sample of solvent was added enough solid
CuF2 or CoF
salt. The samples were allowed to stand, with frequent agitation, in plastic
stopperer f lasks for one month. The specific conductance of the solutions was
measured and i n addition the concentration of soluble copper or cobalt species
such that , i f totally soluble , the solution would be 0 . 1 M i n the 3
2

. * a . measured a s follows. Ten ml . of solution were added to a 1 0 0 m l . volumetric
flask. To this was added fifteen m l . of a 1 M NH3/1 M NH
solution diluted to 1 0 0 ml .
from the difiusion current the concentration i n the initial samples was deter-
mined by comparison with the diffusion currents obtained with standard copper
or cobalt solutions. In an ammonia buffer the reduction of copper (Ii), polar-
ographically, proceeds i n two s t e p s . E for the first reduction is a t about
-0. lV, and for the second at about -0.35 V. The height of the second wave
should be double that of the first and this was observed for all four copper
S S F . ~ ~ S .
complex. E
separated from the anodic dissolution wave of mercury.
cobalt (m) to cobalt (II). The second wave, with E
cobalt (II) to cobalt (0). Since two electrons are involved i n the second reduc-
t ion, the total height of the second wave is triple that of the first. In propylene
carbonate, butyrolactone, and acetonitrile it was observed that the first wave
was absent , indicating that only cobalt (11) was actually present i n solution.
In dimethylformamide the double wave was obtained indicatin9 the material i n
solution to be cobalt (111) , t h i s , however, may have resulted from some oxida-
t ive attack of cobalt (11) to form the cobalt (111) dimethylformamide complex.
C1 buffer and the
The solution was examined polarographically, and 4
1/2
The pelarcgraphic reduction of cobalt i n the amm~i i i a buffer is i C G i e
€or the first wave occurs at such potentials that it cannot be
This reduction is of
about -1.05 V , is for
1/2
1 /2
Table 1
SOLUBILITY OF CuF2 AND CoF3 I N ORGANIC SOLVENTS
CoF Specific Conductance 3
Solvent CuF Conc. Specific Conductance Conc (M 1-I) (ohm-1 cm-1) (M l-i) (ohm-’ crn-l)
Propylene O.O0016(C~+~) 3.5 x 0.0011 (CO’~) 6.0 x
Butyrolactone 0 . 0 0 0 2 2 ( C ~ + ~ ) 5.1 x 1 0-6 O.O0126(C0+~) 7.4 x lo-’
Acetonitrile 0 . 0 0 0 7 5 ( C ~ + ~ ) 2.3 x 0.00053(C0+~) 1 . 7 x
Carbonate
Dim ethyl- 0 . 0 0 0 3 4 ( C ~ + ~ ) 1.4 x lo-’ 0.0017(C0+~) 2 . 2
3

We do not consider such data necessar i ly valid s ince they may
reflect the presence of solubilizing impurities i n the solvent and i n the salt.
We were particularly suspicious that the CoF was rather grossly impure s ince
the brown material contained pieces of both metallic looking and fibrouc mate-
rial. This material was examined i n two ways. The total cobalt content was
determined by weighing out a sample of the "CoF I ' and dissolving by warming 3
with concentrated HC1. Water w a s added and a n excess of cmccntrated
afiifilUiLid Lo convert Ene solution to a 1:l NH,/NH,Cl buffer. A few drops of
30% H 0 were added and the solution warmed until g a s evolution ceased.
Finally more of a n ammonia buffer was added and the solubon examined polaro-
graphically. The polarogram was excellent , corresponding to that expected r'or
a cobalt (111) - ammonia system, indicating complete oxidation of cobalt (11)
by the hydrogen peroxide. The results indicated the salt to contain 8.89 m i l l i -
m o l e s of total cobalt per gram of salt. The actual amount of cobalt (111) in the
salt was assayed by adding a n amount of salt to a hydrochloric acid - potassium
iodide solution.
backtitrated with sodium thiosulfate. The resul ts indicated the salt to contain
4.25 m i l l i m o l e s of cobalt (111) per gram of salt. Assuming both cobalt (11) and
cobalt (ID) to be present as the anhydrous fluorides one calculates the init ial
salt to contain 49% by weight CoF3 and 45% by weight of CoF2, the remaining
6% being impurities.
3
- 2 2
The iodine generated through oxidation by cobalt (111) was
II-B . Formal Reduction Potentials i n Nonaqueous Solvents
The procedure used by u s for determining the formal reduction poten-
tials of various metals i n non-aqueous solvents involved the in-situ generation
of the m e t a l ions . Specifically, the m e t a l of interest is anodically oxidized
i n quiet solution for a given period of t i m e ; the open circuit potential immed-
ia te ly after the current is turned off is the quantity of interest .
A conventional H-cell was used. The large compartment contained
about 200 m l . of electrolyte and in th i s compartment the usual lollipop
4

electrode assembly was used for the working electrode. A platinum helix i n
the same compartment was the counter electrode, In the smaller compartment ,
containing about 25 ml . of electrolyte and separated from the larger compart-
ment by a fritted g lass d i sc , was immersed a silver wire.
The electrolyte i n both compartments was a 0.5 M LiC104 solution
i n the solvent of interest. In addition, to the solution i n the smaller compart-
ment (coiltairiing the silver wire) was added an amount of solid AgC104 such
that the concentration of this sait was 0 . Oi Tv?.
comprised the reference electrode, the Ag/Agt (0.01 M) couple.
Thiis the srnd1er compartment
The purpose of using the LiClO solutions was three fold: to in-
hibit the development of density gradients during electrolysis and subsequent
convective effects, to mainzain the activity coefficients constant, and to pre-
vent ionic migration. These are , of course , the reasons supporting electrolytes
are normally used i n electrochemical experiments.
4
The m e t a l i n question was anodically oxidized , in quiet solution,
a t various currents for exactly 25 sec. The potential during anodization and
the open circuit potential after anodization were recorded. In Figure 1 are shown
a ser ies of runs performed on silver i n propylene carbonate , 0 .5 M i n LiC104.
Since there is a recorder t i m e lag of about 0 .5 sec. for full scale
deflection, we have arbitrarily used the potential observed exactly 0 .5 sec . after the cessat ion of anodization as the potential of interest.
of the anodization curves varied from m e t a l to metal and from solution to solution.
Typical curves are shown i n Figure 2 for the other three metals studied, copper , cadmium, and lead. Although the appearance of the anodization curves was
not very reproducible, t h e subsequent open circuit potential traces were repro-
ducible.
The appearance
%
In Figure 3 are shown resul ts obtained i n propylene carbonate and
acetonitrile solutions. In Figure 4 are shown the results obtained in the
butyrolactone solution. Each point i n the two figures gives the potential
5

-0 5 ..
% - 0 . 4 . '
-a 0 & .c, \ $ -0.3 4 9
. , .~ . _ _ . " . . _ _ _ _ ,- . I
. .
w 0 -0 u 4 2 2 -O
\" 2 0; +o
4 0
> rn .Id 4 g +o v
4 5 +o
s +o z w
a
+O
TIME (Seconds)
Figure I: ANODIC DISSOLUTION OF SILVER IN PROPYLENE CARBONATE
Measurements performed in propylene carbonate, 0.5 M in LiCIOq . A silver m e t a l d i sc was anodized at the current density indicated in quiet
solution for 25 sec. The potential during anodization and the open circuit
potential following anodization were recorded a s shown in the above
figure.
6

-1.0
- -0.9 at
-0.6 2 2 l-i
0 & -0.5 \
- -0.4 5
2 -0.2 G W B
a 0 -0.1
0
I
- t - - - I
- _ . . - - 3
0 5 10 15 20
TIME (Seconds)
25 30
Figure 2: ANODIC DISSOLUTION OF CADMIUM, LEAD AND COPPER IN PROPYLENE CARBONATE
Experiments performed in identical fashion to those described i n figure 1.
7

i -1 * \ I
Cd (in P.C.) .. - a -
a, 4
Cu (i -0.6
4 2 4-0.4
-0 - Pb (in A.N. )
0 n
VI
+e.z -1.5 -1.0 -0.5 0 +0.5 +I .o
OF CURRENT DENSITY (mA cm-’) LoGl 0
Figure 3: REDUCTION POTENTIALS OF METAL/METAL ION COUPLES
Measurements obtained, a s described in text, in propylene carbonate (P. C.)
and acetonitrile (A. N.).
8

-1.0
-0.8
h
Q) a 0
u a Q) w . u
Ll +I
-4-n c
0" G 2 ' -0 .4 4 0
[I]
01 -0.2
+I 4 0 > Y
4
I3
w h
a
s z o 0
w Cd - I w
0
+e.2 ---- -
-1.5 -1 . 0 -0.5 0 +o. 5 +1.0 OF CURRENT DENSITY (mA
Figure 4: REDUCTION POTENTIALS OF METAL/METAL ION COUPLES
Measurements obtained a s described in text in butyrolactone.
LoGIO
9

measured 0.5 sec. after the cessation of anodization (performed on the m e t a l
indicated) a t the current indicated.
We are interested i n comparing the potentials of 0.01 M solutions
of the m e t a l ion i n the 0.5 M LiClO solution. To make this comparison we use
the si lver electrode behavior as a reference system. As a n example, we note ,
from Figure 3 , that the potential observed on the silver electrode was zero versus
the reference electrode at log i = -0.5, or i = 0.28 mA c m
ence electrode is a n A g i o . 01 74 Ag
silver electrode is equal to that of the reference electrode, the coiizeztratior!
of si lver ions at the working electrode surface must then be 0.01 M. Thus we
may say that , i n the propylene carbom te, 0.5 M LiC104, solution anodization
of si lver m e t a l at 0.28 mA cm for 25 sec. i n quiet solution will produce, 0.5
sec . after cessat ion of anodization, a concentration of silver ions at the elec-
trode surface of 0.01 M.
4
-2 . Since the refer-
system, when the potential of the working +
-2
To determine the formal potentials of the other couples we first
assume the diffusion coefficients are similar to that of the si lver ion. We a l so
assume that the equilibrium potential is rapidly establ ished, that is, we assume
the exchange currents for copper, lead, and cadmium to be sufficiently large
that the rate of establishment of the true equilibrium potential is more rapid
than the recorder response.
To continue the example , we consider copper which, for reasons
later discussed i n th i s section, we assume to be anodized to copper (I). If the
assumptions discussed i n the preceding paragraph are valid then, as with
silver, a current of 0.28 mA c m for 25 sec. i n quiet solution should result i n
a concentration of copper (I) at the electrode surface of 0.01 M , 0.5 sec. after
cessat ion of anodization. The potential corresponding to this current on
Figure 4 (log i = -0.5) is -0.15 V. We take this to be the formal potential of
the 0.01 M copper (I)/copper metal redox couple versus the silver reference
system.
-2
10

Since lead and cadmium are oxidized to the divalent spec ies , it is -2 c lear that twice the current , i. e. I 0.56 mA c m
conditions to produce a 0.01 M concentration at the electrode surface.
Figure 3 one sees that the potentials corresponding t o this current (log i =
-0.2) are -0 .94 for cadmium and -0.83 for lead.
, is required under the s a m e
From
Finally, it was desired to measure the potential of the lithium/lithium
ion couple i n the s a m e solution. This was done by depositing l i t h i l ~ ! mats! or,
the copper d isc v:orkir,g electrode. Tne subsequent open circuit potential was
then measured and was constant for a sufficiently long period of t ime (e. g. for
57 min. i n acetonitrile, longer i n P.C. and B.L.) to allow meaningful measure-
ments.
In Table 2 below are shown the resul ts obtained to date and are com-
pared with those calculated for aqueous solutions which have been calculated
from the Nernst equation.
Table 2
FORMAL REDUCTION POTENTIALS
Measured potential of rnetal,/metal ion couple versus silver/silver ion (0.01 M)
couple i n solvent indicated, made 0.5 M i n LiClO 4
Potential (Volts) i n
H2° Couple PC BL AN
Cu(I), 0.01 M/Cu -0.15 -0.21 -0.58 -0.28
Pb(II) I 0.01 M/Pb -0.83 -0.82 -0.42 -0.87
Cd(U;), 0.01 M/Cd -0.94 -0.96 -0.66 -1.12
Li(I), 0.5 M/Li -3.67 -3.60 -3.20 -3.74
Major shif ts i n potentials doubtless largely reflect the shift , to a
varying degree , of the solvation energy i n the different solvents. This is
11

especial ly pronounced i n acetonitrile and m o s t likely reflects the much stronger
solvation of copper (I) and silver (I) in this solvent through specific inter-
actions (e.g. covalent bonding with the acetonitrile). In P.C. and B.L. we do
not believe the data indicates substantial differences in the solvating power
of these two solvents as compared with water and the shifts may reflect only
variations i n activity coefficients or solvation entropy.
* I
Although one may be quite certain that cadmium and lead go into
solution as the 4-2 ions , there remains s o m e question about the oxidation state
of the soluble copper species.
S O X T I ~ i n d i ~ ~ t i ~ r ; of the i;isfemsd ~xidatioii state of copper.
The following procedure was used to obtain
Copper was deposited n -L on polished platinum electrodes at 25 mA c m
aqueous copper sulfate solution. Subsequent discharges of the copper deposit
i n aqueous solution gave 9 5- 100 % efficiencies.
for 100 sec. from a n acidified
Deposits similarly formed were discharged i n the same nonaqueous
electrolytes i n which the previously described studies were performed. If the
copper goes into solution as the +2 ion, 100% efficiency should ideally be
realized: i f copper goes into solution as the +1 ion, however, only 50% effic-
iency should be realized since, on deposition two electrons were required per
copper atom deposit whereas, on discharge, only one electron would be re-
quired.
i n all cases, and the visible disappearance of copper was also attended by
marked polarization. The efficiencies are calculated by dividing the number
of coulombs passed during anodic dissolution by the number of coulombs
passed during the preceding deposition:
The results are shown below. The anodic discharge curves were flat
Anodization Current Stripping Efficiency i n P.C. B.L. A. N.
1.0 mAcm-’ 79% 59.5% -- -2 2.5 mA c m
5 mAcm-2
10 m~ cm-’
25 mA cm - 2
-- 61 % 45.4%
70% 64% 46.0%
68% -- 46.4%
62% 61.4% --
12

We believe the results i n acetonitrile indicate that copper goes into solution
exclusively as the +1 ion. The results i n butyrolactone suggest copper goes
into solution i n both the +1 and the +2 oxidation s t a t e s , but, predominately,
the +1 s ta te , whereas i n propylene carbonate approximately equal amounts of
copper (I) and copper (11) are formed.
S I
2 II-C. Discharse of CuF
II-C-1. Discharse in Acetonitrile
As described i n the Third Quarterly Report, the best discharge
efficiencies for ZuF were obtained i r i di;aioiii*ile - LiC?(? G A G b L L W A J ne ib" ~ ~ 7 h n r ~ ...*--._ ,
for the 6:3:1 (Ag:CuF2:LiC104) mixes, efficiencies of between 45-49% were ob-
tained at currents of from 2.1 to 17 mA c m Discharges of CuF2 were further
investigated to test the effect of varying the m i x ratio. The results are shown
i n Table 3 below and i n Figure 5.
2
-2 .
Table 3
DISCHARGE OF CuF, I N ACETONITRILE
Mix Ratio Theoretical Ag:CuF :LiC104 Capacity
(mA- hr cm- 2, 2
In 0.5 M LiC104
6:3:1 (Fig. 5) 8.5
2:7:1 (Fig. 5) 8.5
6:3:1 (repeat) 8.5
6:3:0 8 . 5
6:3:0 (Fig. 5) 8.5
1 : l : O (Fig. 5) 8.5
3: 6: 1 17
1 : l : O 17
8:l:l 4.3
8: 0: 5: 1 2.1
8:O. 25:l 1.1
L
Discharge Current
(mA ~ r n - ~ )
4.3
4.3
4.3
4 .3
4.3
4.3
4.3
1.1
4.3
4.3
4.3
Potential of dis- charge plateau (See Fig. 5)
-0.60
-0.65
-0.52
Efficiency
48%
32%
46%
-0.58 Electrode fell off after 1 hr.
-0.40 42%
-0.55 50%
-0.60 Electrode fell off after 65 min.
-0.55 to -0.63 * -0.35 39%
-0.42 30%
-0.58 13% * Discharge continued overnight, for 17 hr. No potential break was observed,
and the discharge was discontinued.
13

-2.0
-1.5
h
w
Cathodic Discharge of CuF in Acetoni,:ile - 0.5 MLiC104 at 3.6 mA.
2
+0.5 --
0
Figure 5: CATHODIC DISCHARGE OF CuFz IN ACETONITRILE 2 All discharge performed on 0.85 c m
Ag:CuF :LiClO as follows:
1 6:3:1
2 2:7:1
electrodes with mix ratio of
2 4
3 6:3:0
4 L:l:O
All electrodes had theoretical capacit ies of 7.2 mA-hr, based on a two-electron
2 reduction of CuF
1 4
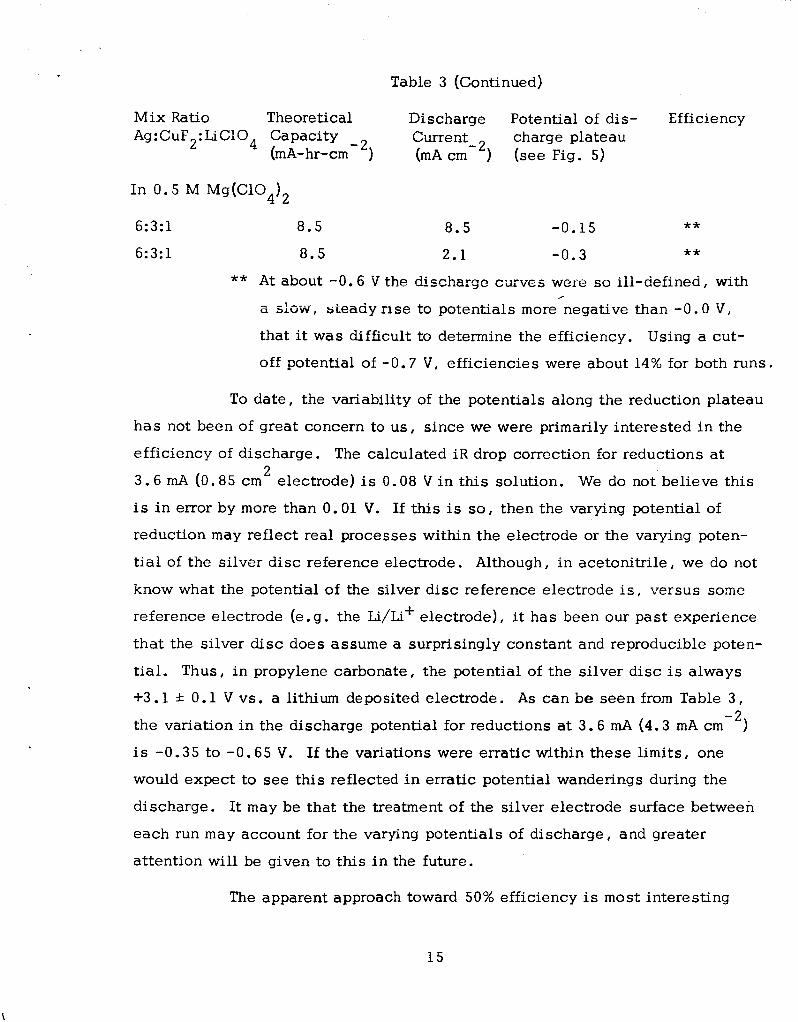
Table 3 (Continued)
Mix Ratio Theoretical Discharge Potential of dis- Efficiency Ag: CuF2: LiCIOq Capacity Current charge plateau
(mA-hr-cm ) ( m A c m ) (see Fig. 5) - 2 - 2
In 0.5 M Mg(C104)2
6:3:1
6:3:1
8.5
8 .5
8.5 -0.15 ** 2.1 -0.3 **
** A t about -0.6 V the discharge curvss were so ill-defined, with
a slow, s teady rise to potentials more negative than -0.0 V ,
that it was difficult to determine the efficiency.
off potential of -0.7 V, efficiencies were about 14% for both runs.
,
Using a cut-
To da te , the variability of the potentials along the reduction plateau
h a s not been of great concern to us , since we were primarily interested i n the
efficiency of discharge. The calculated i R drop correction for reductions at
3.6 mA (0.85 cm electrode) is 0.08 V i n this solution. We do not believe th i s
is i n error by more than 0.01 V. If th i s is so, then the varying potential of
reduction may reflect real processes within the electrode or the varying poten-
tial of the si lver d i sc reference electrode. Although, i n acetonitrile, we do not
know what the potential of the silver d i sc reference electrode i s , versus some
reference electrode (e. g. the Li/Li+ electrode), it has been our past experience
tha t the silver disc does assume a surprisingly constant and reproducible poten-
tial. Thus, i n propylene carbonate, the potential of the si lver d i sc is always
+ 3 . 1 f 0.1 V vs. a lithium deposited electrode. A s can b e seen from Table 3 , -2
the variation i n the discharge potential for reductions at 3.6 mA (4.3 mA c m )
is -0.35 to -0.65 V. If the variations were erratic within these l i m i t s , one
would expect to see th is reflected i n erratic potential wanderings during the
discharge. It may be that the treatment of the silver electrode surface between
each run may account for the varying potentials of discharge, and greater
attention will be given to this i n the future.
2
The apparent approach toward 50% efficiency is m o s t interesting
15

. ' L .
s ince varying the Ag:CuF ratio does not s e e m to change this as markedly as
might be predicted. Various mechanisms m a y be invoked explaining 50%
efficiency, the most obvious is that copper (11) undergoes a one-electron re-
duction to copper (I) as occurs i n chloride m e d i a and i n aqueous ammoniacal
media .
2
As described i n the Third Quarterly R e p o r t , it has been
found that the 6:3:1 electrodes could be discharged i n butyrolactone, 1 M i n
LiBF with efficiencies of 22-26% at currents of 4 . 3 to 17 mA c m . Using
acetylene black instead of silver, efficiencies as large as 49% were obtained
-2 4
a t - 2 - 2 4 . 3 mA c m . The potential along the discharge plateau at 4 . 3 mA c m was
-0.35 V for discharge of the silver m i x electrode , and - 0 . 3 V for discharge of
the acetylene black mix. This indicated, we believe, that there was not much
likelihood of the reaction of CuF with the si lver powder (Note: This reaction is 2 not favored, thermodynamically. )
Further work was done using UClO instead of LiBF as 4 4 the electrolyte. Furthermore, no vacuum distilled butyrolactone was available
at the t ime th i s work was done, and we used the "as-received" material which,
as discussed i n Section I V , contains about 0.04% by weight of water. This is a
concentration of about 0.02 M, corresponding to a limiting current i n quiet
solution of about 1 mA cm
Figure 6. It will be noted that the efficiencies are only about half those
obtained and reported during the Third Quarter.
- 2 . The resul ts are shown i n Table 4 below, and i n
16

/ I 1 I
-2.0 / /
/
-1.5
- w. -1.0 d u ffl
2 $
-0.5
/ i / I
1 1
I I I
/ /
/ /
3.6 e’, Ag/LiClOq m i x
I I
I I
0.5 M LiC104, 3.6 mA , ( 2 4 ; M Mg(C104)2, 3.6 mA
0.5 M Mg(C104)2, 1 . 8 mA
0.5 M Mg(C104)2, 0.9 mA
Discharge of CuF in Butyrolactone 2 +O. 5
+1 .o 0 0.4 0.8 1 . 2 1.6
TOTAL DISCHARGE (mA-hr)
Figure 6: DISCHARGE OF CuF2 IN BUTYROLACTONE 2 Except where indicated, all electrodes (0.85 c m ) of 6:3:1 mix ratio
(Ag:CuF :LiC10 ) with theoretical capacity of 7 . 2 mA-hr 2 4
2.0
17

Table 4
DISCHARGE OF CuF2 IN BUTYROLACTONE
M i x Ratio Theoretical Discharge Ag:CuF2:LiC104 Capacity - 2 Current
(mA-hr c m )
Solution
0 .5 M LiC104 (Fig. 6) 6:3: 1 8.5 4.3
0 . 1 M MgC12 6:3:1
0.1 M Mg(C104)2 6:3:1
8.5 4.3
8.5 4.3
0.1 M Mg(C104)2 6:3:1 8.5 2.1
0 . i b1 Mg(C10q)2 5:3: 1 8 ' 5 1.1
0 .5 M Mg(C10q)2(Fig. 6) 6:3:1 8.5 2 .1
0.5 M Mg(C104)2(Fig. 6) 6:3:1 8.5 1.1
A . 1 0.5 M Mg(C10.) (Fig. 6) 6:3:1 8 . 5 Y . J 3 2
Efficiency
13%
9%
8%
8%
13%
12%
1 2 %
1 2 %
Here three points are , we believe, of particular interest . First is
noted the appearance of an initial reduction plateau i n the magnesium perchlorate
solutions, as w a s observed in acetonitrile. Second, one would expect, were
concentration polarization the limitation to CuF utilization, the efficiency to
significantly increase as the current is decreased. This is not observed, as
c a n be seen i n Figure 6, and suggests inherent structural limitations. Finally,
the potential of reduction is different i n the LiC104 vs. the Mg(C10 ) solution.
The calculated correction for i R drop is, i n the LiClO
a corrected reduction potential of -0.06 V. In the Mg(C10 )
drop correction and the corrected reduction potentials a r e , respectively, at
3 .6 mA (0.32 V), E = +0.14;at 1.8 mA (0.16 V), E = +0.08; at 0.9 mA (0.08 V), E = +O. 09 V. Again, more experimental work is required before these differences
c a n be said to be real.
2
4 2 solution, 0.24 V , giving 4
solution the i R 4 2
- CuF2 ELECTRODES
II-C-3. Discharqe of Teflon Containinq Mixes
Attempts were made to improve the discharge efficiency
18

of CuF2 electrodes through the incorporation of Teflon powder as a binder. The
electrode m i x e s were prepared in the weight ratio given below, and pressed into
the lollipop electrode structure described i n previous reports at 3000 lb. The
theoretical capacity is based on the complete reduction of CuF to the me ta l .
The discharge curves were sufficiently well-defined to give unambiguous
efficiency values. The discharges were conducted i n propylene carbonate,
0 .5 M i n LiC104.
2
Table 5
DISCHARGE OF CuF2 MIXES WITH TEFLON BINDER
M i x Capacity Discharge Efficiency (mA-hr cm-') Curren
(mA cm-')
1 8.5 4.2 51 %
1 8.5 4.2 50%
1 8.5 4.2 28% Pellet soaked i n electrolyte 1 hr . prior to discharge
1 8.5 0.56 22%
1 8.5 0.56
1 4.2 4.2
With copper support screen
37%
42% With copper support screen
1 4.2 4.2 43%
1 4.2 2.1 40%
I 1
I 1
2 4.2 4.2 43 % I 1
1 = 9:l:l:O. 5 Cu:CuF :LiC104:Teflon by weight 2 = 9:l:l:l 2
The failure to obtain increased efficiency with lower discharge
2 currents is again noted. This may result from the slow dissolution of the CuF
into the bulk of the electrolyte which, i f so, is quite serious. Whether the
possible slow dissolution is through impurities i n the electrolyte or is inherent
19

i n the s y s t e m is a matter for further study.
11-C-4. Discharqe of N a h a l e n e Containins Mixes
Attempts were made to improve the porosity of the CuF2
electrode through the incorporation of naphthalene i n the mix and subsequent
removal by sublimation. The results are shown i n Table 6 below. All electrodes
had a theoretical capacity of 8.5 mA-hr cm-2. The m i x ratio was 9:1:1, Cu:
CuF,:Naphthalene . The electrodes were discharged i n propylene carbozate ,
0.5 M in L-;C!O L
t~ grc?vid,de a cnmpa_ri_son with the results shown i n Table 5. 4 '
Table 6
DISCHARGE OF CuF2 MIXES WITH
Treatment of M i x ~
Pressed at 7000 lb. heated at 75OoC
Pressed at 7000 lb. no heat applied
Pressed a t 7000 lb. heated in vacuum
Pressed at 3000 lb. heated in vacuum
Pressed at 7000 lb. heated in vacuum
Pressed at 3000 lb. heated in vacuum
Pressed at 3000 lb. heated in vacuum
Pressed at 7000 lb. heated i n vacuum
Pressed a t 3000 lb. heated i n vacuum
for 1/2 hr.
oven at 6OoC for 1 hr.
oven at 150°C for 1/2 hr.
oven at 15OoC for 1/2 hr.
oven at 15OoC for 1 1/2 hr.
oven at 1 5OoC for 1 1/2 hr.
oven at 15OoC for 1 1/2 hr.
oven at 150°C for 16 hr.
NAPHTHALENE
Discharge of Current Efficiency (mA cm-2)
4.2 0%
4 .2 0%
4.2 4%
4.2 4%
4.2 3%
4.2 15%
0.56 22%
4.2 23 %
4.2 51 %
20
I -
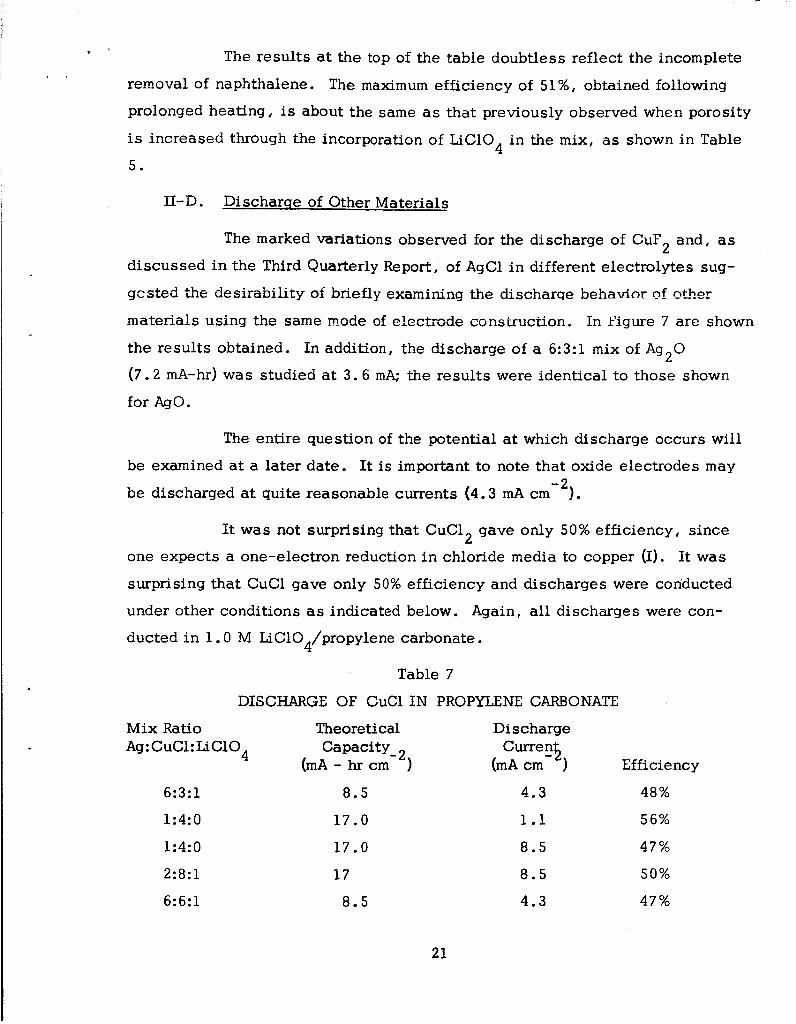
The resul ts at the top of the table doubtless reflect the incomplete
removal of naphthalene. The maximum efficiency of 51 %, obtained following
prolonged heating, is about the s a m e as that previously observed when porosity
is increased through the incorporation of LiClO in the mix , as shown in Table
5. 4
II-D. Discharqe of Other Materials
The marked variations observed for the discharge of CuF2 and, as
discussed i n the Third Quarterly Report, of AgCl i n different electrolytes sug-
gested the desirability of briefly examining the discharqe behavior nf ether
materials using the s a m e mode of e?ectLide construction. i n Figure 7 are shown
the results obtained. In addition, the discharge of a 6:3:1 m i x of A g 2 0
(7.2 mA-hr) was studied at 3.6 mA; the resul ts were identical to those shown
for Ago.
The entire question of the potential at which discharge occurs will
be examined at a later date. It is important to note that oxide electrodes may
be discharged at quite reasonable currents (4.3 mA c m -2 ).
It was not surprising that CuCl gave only 50% efficiency, since
one expects a one-electron reduction i n chloride media to copper (I). It was
surprising that CuCl gave only 50% efficiency and discharges were conducted
under other conditions as indicated below. Again, all discharges were con-
ducted i n 1 .0 M LiC104/propylene carbonate.
2
Table 7
DISCHARGE QF CuCl I N PROPYLENE CARBONATE
Mix Ratio Theoretical Discharge Ag: CuCl:LiC104 Capacity- Currens
( d - h r c m ) (mA cm- ) Efficiency
6:3:1 8.5 4.3 48%
1:4:0 17.0 1.1 56%
1:4:0 17 .0 8.5 47%
2:8:1 17 8.5 50%
6: 6: 1 8.5 4.3 47%
21

. . -2.5
-2.0
-1.5
-1.0
-0.5
0
0 0.9 1 .8 2.7 3.6 4.5
AMOUNT OF DISCHARGE (mA-hr)
Figure 7: CATHODIC DISCHARGE OF VARIOUS MATERIALS 2 Discharge of 0.85 c m electrodes. Mixes were in weight ratio 6:3:1
Ag:Cathode Salt:LiC104. Thexetical capacit ies were 7.2 mA-hr. Except
where indicated, all discharges were done at 3.6 mA. Potentials
are given with respect to a silver d isc R.E. against which the potential
of a lithium electrode in the same solution is about -3.1 V. Discharges
were performed in propylene carbonate] 1 M in LiClO Under the conditions
prevailing in these experiments] the iR drop for reductions at 3.6 mA is about
0.5 V.
4 '
22

p
l -
The resul ts suggest, we believe, that the 50% efficiency is in-
herent i n the system. As was discussed in the Second Quarterly Report, CuCl
is solubilized in chloride media, apparently with the formation of CuClz . If
this were true in the systems here employed one would expect reduction to
proceed: 2CuC1 + e = Cuo i- CuClz . If the complex escapes from the elec-
trode, 50% efficiency will occur. A similar mechanism m a y prevail i n the
discharge of CuF
-
- -
2'
The AgCl electrode was also used to further investigate the ability
to discharge cathodes i n dilute e i ec t rdy -es . Two solutions with approximate
equal conductivities were investigated, a 0.2 M h C i 0 /'piapylenP carbonate
solution (Specific Resistance = 333 ohm-cm), and a 0 .1 M LiC104/Butyrol-
actone Solution (Specific Resistance = 370 ohm-cm). A l l electrodes had a -2 theoretical capacity of 8 . 5 mA-hr c m
powder and, as indicated i n certain cases, LiClO
Table 8 below.
4
and contained 10% by weight of si lver
The results are shown i n 4 '
Solution
Table 8
DISCHARGE OF AgCl I N LiC104 SOLUTIONS
Weight % Discharge Efficiency LiC104 Current
(mA
Propylene Carbonate none 8 . 5 8%
Propylene Carbonate none 2 .1 8%
Propylene Carbonate none 4.3 8%
Butyrolacto ne none 4 .3 67 %
Butyrolactone none 2.1 60%
Butyrolactone none 0.5 78%
Butyrolactone 12% 8.5 65%
Butyrolactone 25% 8 . 5 68 %
Bu tyrolac tone 25% 1 7 67 %
Butyrolactone 25% 4.3 73%
Butyrolactone 25% 1.1 67%
23

The results obtained in butyrolactone are similar to those described
i n the Third Quarterly Report for LiBF /Butyrolactone solutions.
obtained i n propylene carbonate are significantly lower than those observed i n
the LiBP4/hopylene carbonate solutions, reported in the Third Quarterly Report ,
where efficiencies of 1 0 % at 8 .5 mA c m -2 2 . 1 mA c m obtained.
The results 4
-2 -2 , 27% a t 4 . 2 mA c m I and 25% at
II-2. Di scnarqe i n Starved Electrolyte
Ceiis were constructed with a design essentially that shown i n
Figure 8.
me te r . The inside of the sleeve was milled to form a shoulder to separate and
space the two electrodes. This shoulder was 0 .2 c m thick and projected 0 .2
c m into the inside of the sleeve. In earlier experiments a teflon spacer ring,
0 . 2 c m thick was used to separate the electrodes rather than the milled shoulder.
This cell consis ts of a hollow teflon sleeve, 2 c m i n internal dia-
Two electrode "plugs" , milled to fit tightly inside the sleeve were
used. In the work described i n this section these plugs were made of epoxy.
In the face of each plug were sealed s ta inless steel cups to provide the
cavities in which were placed the electrode material.
In the work here described bulk lithium m e t a l was pressed into one
cavity. In the other cavity was pressed a m i x of silver, copper fluoride , and
lithium perchlorate i n the weight ratio 9:l:l (Ag:CuF2:LiC104).
The two plugs were then pushed part way into the teflon sleeve and
a s m a l l amount of electrolyte injected into the space between the two electrodes.
They were then pushed together against the separating shoulder or teflon ring,
and excess electrolyte was expelled. The electrolyte was butyrolactone, 1 M
in LiBFq.
The main problem appeared to be leakage of electrolyte during dis-
charge, thus the efficiencies were low. However , the discharge curves were
24

ELECTROLYTE
ANODE LEAD CATHODE LEAD
SEAL Y SEAL
REFERENCE ELECTRODE
Figure 8: Cell for Starved Electrolyte Studies
25

flat with the exception of the discharge at 20 mA. The results are shown below.
Each cathode had a capacity of 7.2 mA-hr and the area was about 0.85 c m . 2 . *
3 .
Current Potential during discharge Discharge efficiency , 1 . 0 mA
3.6 mA
3.12 V 3.1 V
23%
42%
3.6 mA 2.8 V 23%
3.6 mA 2.8 V 13%
7.9 mA 2.4 V 1 9 %
20.0 mA ill-defined ca. 1 9 % ,
Attempts were made i n m o s t cases IO recimiye the ze!! by reversing
the current after discharge. T h i s was unsuccessful. The cathode polarized by
several volts during charge. On reversing the current again (discharge) satis-
factory discharge plateaus were not observed.
If initial discharge efficiency was limited by loss of electrolyte
through leakage or by gas formation, one would not expect satisfactory charging.
The results indicate one type of difficulty expected i n attempting to learn more
about the cyclability of the CuF electrode i f one cannot first develop a system
which first discharges with reasonable ease. 2
II-F. Cvclinq of Silver Chloride Electrodes
2 ' If LiF is an insoluble product of the cathodic education of CuF
it should then serve as a reservoir for fluoride ions for subsequent anodic oxida-
tion of copper to CuF
electrode.
The validity of this principle was tes ted with the AgCl 2'
A m i x comprising equimolar amounts of silver (0.0290 g. ) and -2
lithium chloride (0.0114 9.) was pressed at 1500 lbs. This was 8.5 mA-hr c m
for a one electron change. The electrode was placed i n propylene carbonate,
0.5 M i n LiCIOq, and subjected to anodization at 8.5 mA c m for 1/4 hr. The
current was reversed and 93% of the previous anodization was recovered before
polarization. A second anodization for 1/4 hr. gave 98% recovery on cath-
odization, and a third anodization, continued until polarization occurred after
23 min., gave 100% recovery on discharge. The electrode remained compact
-2
26 i

. ' l
. . and firmly adherent to the platinum substrate. This indicates that the LiCl
contained i n the m i x did serve as a reservoir for chloride ions.
A second electrode was similarly prepared and anodized a t 4.2 mA -2 -2 c m for 30 min. Subsequent current reversal at 4.2 mA c m gave 100% effic-
iency. A third electrode incorporating LiClO instead of LiCl was subjected
to anodization at 8.5 mA cm
was only 7%.
within the electrode to serve as a reservoir of chloride ions for anodic formation
of insoluble AgC1 is proved, and we see no reason why the ~ T C C ~ E S shcu!d cot
have genera! validity.
4 -2 for 15 min. On current reversal the efficiency
Thus, we believe, the ability of insoluble LiCl incorporated
II-G. Cyclinq of Copper Chloride Systems
Preliminary studies of the cycling behavior of copper electrodes in
chloride media have been conducted. These studies were performed using porous
copper electrodes, 1 c m in projected area. The electrodes were 0 .076 c m
thick and were designated by t h e manufacturer (Clevite Corporation) to have a
porosity of 62%.
copper, or 410 coulombs for one-electron change. This is i n considerable ex-
cess of the amount of current passed during a cycle.
2
Thus the electrodes contained a total of 0.0041 m o l e s of
The electrolyses were conducted in small H-cells, and each com-
partment held about 4 ml . of electrolyte. Both the counter and working elec-
trodes were porous copper. The reference electrode simply consisted of a silver
wire immersed i n the s a m e solution as the working electrode. Three electrolytes
were examined a s described below:
a. Propylene Carbonate , 0.5 M in LiAlC14
The working electrode was anodized at 10 mA for 1000 sec. on
each cycle.
polarization was observed. The first 32 cycles were almost identical and in
Figure 9 is shown the charge and discharge for the 25th cycle.
Cathodization was then performed a t the s a m e current until
Cathodic
27

. .
-0.60
I -0.-95, i
!
01 U
I
I
I
0 400 800 1200 1600 2000
1 I I I +o. 30' . I
TIME (Seconds)
Figure 9: CYCLING OF COPPER ELECTRODE IN PROPYLENE CARBONATE
Figure shows the 25th cycle of a series of cycles performed on a porous
copper electrode i n propylene carbonate, 0.5 M in LiAlC14.
performed by charging the 1 c m electrode at 10 mA for 1000 seconds, followed
by current reversal to the point of rapid polarizqtion.
Cycling was 2
28

. . recoveries (the amount of current passed during cathodization, before polariza-
t ion, divided by the amount of current passed during the preceding anodization)
were from 70-76% for each cycle. The conditions of cycling were then varied a s
shown below:
Cycle No. Anodic Current Cathodic Current Cathodic Recovery
33 34 35 36 37 38 39 40 41 42 43 44 45
10 10 10 i o 1 0 10 10 5 0 50 20 20
5 5
20 20 r n
c n
r n
1 1
1 0 1 0 1 0 1 0 1 0 1 0
J U
o w
J U
73 7 5 59 7 1 67
106 70 69 69 7 4 75 7 1 73
Thereafter the capacity was varied for cycles 46-64. The current
was maintained at 10 mA for both charge and discharge. The resul ts are shown
i n Figure 10.
Finally, on cycles 65 through 81, the electrode was allowed to stand
on open circuit for varying periods of t i m e following charge to see what effect
th i s would have on subsequent cathodic recovery. Recoveries did not vary
markedly with the t ime of open circuit stand. An electrode which had stood
i n solution for 63 hours after charge still gave 61% cathodic recovery.
Although the solution became badly discolored after these cycling
experiments, it is remarkable that so little change was observed i n the cycling
behavior.
b. Butyrolactone , 0.5 M i n LiCl
The results i n this solution were totally unsatisfactory. The
29

. .
20% -
I I 8 I 0% io 20 30 40 50
AMOUNT OF ANODIC CHARGE (Coulombs)
Figure 10: CATHODIC EFFICIENCY ON CYCLING OF COPPER IN PROPYLENE CARBONATE 2 Experiments performed on porous copper electrode (1 c m ) in propylene carbonate,
0.5 M in LiAlC14. Anodic charging was performed at 10 mA to give total amount
of charge indicated. Subsequent cathodization was also performed at 10 mA
to the point of rapid polarization. Efficiencies calculated by dividing the
total amount of cathodic discharge by the amount of the previous anodic charge.
30

. .
first few cycles were conducted by anodizing the electrode at 10 mA for 1000
sec. followed by cathodic discharge. The cathodic discharge was interrupted
after severe polarization was observed. The solid line i n Figure 11 shows the
resul ts obtained on the second cycle. The dashed l ine shows the resul ts ob-
tained after the ninth cycle. Subsequent cycling was then performed auto-
matically. Anodization was continued for 1 hr: and cathc?dizntinn for 15 mir?.
These experiments were discontinued after the 22nd cycle when it was noted that
the resistance across the g l a s s f r i t separating the two compartments had be-
come so large that the electronic constant current supply could not deliver the
desired 10 mA. It had not been known how long this condition had existed, thus
invalidating the results for cycles 10-22.
c. Dimethylformamide, 0.5 M i n LiCl
Preliminary cycling was done by anodizing the electrode at
10 mA for 1000 sec. Cathodization was performed at 10 mA until the electrode
polarized to a n arbitrary cut-off voltage of -0.9 V. In Figure 1 2 , the solid line
shows the 14th and 15th cycles. From cycle 17 on cycling was performed auto-
matically. Anodization was continued for about 800 sec. and subsequent cath-
odization for a third th i s t i m e , 270 sec. In Figure 12 , the dashed line shows the
resul ts for the 23rd and 24th cycle. As cycling continued the curves gradually
changed i n character and this is shown by comparing the resul ts for cycles 23
and 24 with those for cycles 37 and 38 a l so shown in Figure 12.
The changing character of the cycling curves indicates , ye
believe , that significant changes in electrolyte composition are occurring and
further study is necessary before this system is satisfactorily characterized.
31

-2.25
n -1.50 w
0,
4 -0.75
0 2 !2 s w a
+O. 75
f i I I I I I I I I I I I 1 1
I I 1 I I I I I I I I I
I
I
I I 1 !
\i \ ,-;/ Cycle 2 I
!
I I
I I
I \
\ .------.--------------( I Cycle 9
! +l. 50
0 4 00 800 1200 1600
TIME (Seconds)
Figure 11: CYCLING OF COPPER ELECTRODE IN BUTYROLACTONE
Figure shows 2d and 9th cycle of a series of cycles performed on a
porous copper electrode i n butyrolactone, 0.5 M in LiCl. Cycling was
performed by charging the 1 c m electrode at 10 mA for 1000 seconds,
followed by current reversal to a point of rapid polarization as indicated.
2
32

. .
-1.5
I -
-0.9
- 0 . 3 2-37 J _I".. ......._ d-3U d- J
I .... -..- ......
c = charge, followed by cycle number _ .
0 400 800 1200 1600 2000 2400
TIME (seconds)
CYCLING OF COPPER ELECTRODE IN DIMETHYLFORMAMIDE Figure 12:
Figure shows a s examples of the trend observed, several cycles obtained
on a porous copper electrode in dimethylformamide, 0 .5 M in LiCl.
Cycles 14 and 15 (solid line) were part of a group of cycles obtained by
anodization at 10 mA for 1000 sec. followed by cathodization to an arbitrary
cut-off voltage of -0.9 V. Cycles 23, 24, 3 7, and 38 were part of a
further group of cycles in which cycling was automatically done by charging
at 10 mA for 800 sec. followed by discharge a t 10 mA for200 sec.
33

111. ANODES
III-A. Effect of Water on Lithium Deposition
We were particularly interested in using V.P. C . to determine the
water content in total electrolytes -- solvent plus solute. The first problem con-
cerned the ability to determine water in total electrolytes. In Figure 13 are shown
three vapor phase chromatograms obtained with a propylene carbonate solution,
initially 0.1 M in LiBFq. Curve 'a ' is that obtained before the deliberate addition
of water; curves 'b' and 'c' are after the addition of water a s indicated below.
The determination of water from the chromatograms is discussed in the following
sect ion IV.
total from th
ing:
Water added Water found
Curve a 0.00% 0.025%
Curve b 0.10% 0.11%
Curve c 1.00% 0.96%
It might not be expected that water can be eluted satisfactorily
lectrolyte because of decomposition reactions such a s the follow-
LiBFq + H20 = LiOH + HF i- BF3
However, the same amount of water is found by both methods of operation, iso-
thermal and temperature programmed runs. This is shown in Figure 14. The re-
su l t s were obtained in a propylene carbonate solution, initially 0 . 1 M in LiBF4
which had been allowed to stand for several days under a flow of argon. The solid
l ine is a trace of the resul ts obtained by the isothermal run on a 0.4 Microliter
sample. The area of the water peak is 0.22 in2. The dashed l ine is for a Pro-
grammed run obtained with a 4 microliter sample, ten t i m e s the volume used for
the constant temperature run. The area of the water peak, shaded in Figure 14,
is 2.37 in2. In the constant temperature run it will be observed that no peaks
are apparent between the water and the propylene carbonate. The first peak in
Figure 14 is the air peak, the second is propylene oxide: both a re significantly
smaller than the water peak. The results indicate that major amounts of other
materials than water and propylene carbonate are not present.
34

.p*
i i i : i ! i : i : : i f
!
I \ : :
. . . .
'!Area = 2 . 4 3 Ci \Attenuation
2 in = 4
0 10 20 30 40 50
TIME (Seconds)
Figure 13: VAPOR PHASE CHROMATOGRAM OF WATER IN PROPYLENE CARBONATE 0 Performed with 0 . 8 microliter samples. Column temperature = 200 C .
35

0 0 e
0 v) CI)
0 0 0
0 In c*l
h rn a c 0 u P, cn
0 -
0 0
I 0
Figure 14: VAPOR PHASE CHROMATOGRAMS IN PROPYLENE CARBONATE
Figures show the difference between isothermal runs and temperature
programmed runs.

Another question concerns the lower l i m i t s a t which water may be detected.
In Figure 15 are shown three runs obtained with temperature programming on 4
microliter samples. Curve 'A' is the run for a freshly prepared propylene carbonate
solution, 0.1 M in LiBFq. The shaded area representing the water peak , corres-
ponds to a concentration of about 0.01% by weight. Curve 'B' was obtained when
the solution had stood overnight under a stream of argon. The measured area of
the water peak corresponds to a water content of 0.30%. Curve 'CI8 presented
for comparison, is obtained with a sample of propylene carbonate which contained
0.20% by weight of water. It will be observed that significant background is
present, which makes difficult the determination of small amounts of water.
%e estimate that the l i m i t of water content which may be determined under our
procedures is about 0.003% by weight, or8 in piopykne carbcnate, 0.002 k?.
Although we are not ye t confident that vapor phase chromatography
necessarily gives an accurate measure of the total water content in the electro-
lytes -- solvent plus solute -- we do believe it provides a t l ea s t a minimum
estimate of the water content.
A ser ies of electrochemical studies was undertaken in propylene carbonate
solutions , 0 .1 M in LiBFq , concurrently with V. P. C . examination of the electro-
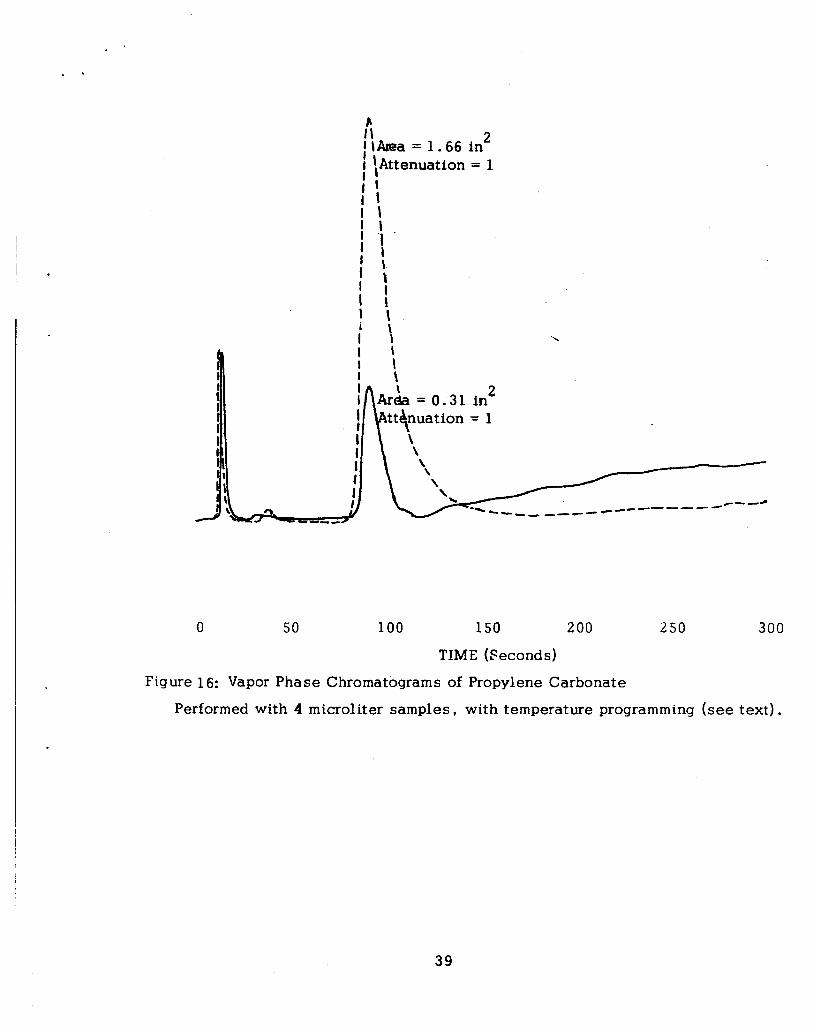
lytes. In Figures 16 and 17 a re shown the m o s t significant resul ts .
The solid l ine in Figure 16 is the vapor phase chromatogram of the freshly
prepared solution. The area of the water peak, 0.31 in2 , corresponds to a water
content of about 0.03% by weight, or 0.02 M. The chronopotentiograms obtained
in this solution on platinum electrodes a t 7 and 0.7 mA cm-2 are shown in Figure 17
by the solid l ine curves.
This solution was then allowed to stand overnight, with argon continuously
bubbled through the solution. The subsequent vapor phase chromatogram is shown
by the dashed l ine in Figure 16. The area of the water peak , 1.66 in2 , corresponds
to a water content of 0.17%, or 0 .11 M. The concentration of water is thus about
equal to that of LiBF4. The chronopotentiograms obtained in this solution are shown
in Figure 17. I t will be noted that relatively little change is observed in spite of
the five-fold increase in water.
37

* - - - - . . . . . .
. . . .
0 In c*)
0 In cu
c U
0 0 4
:I I
-. I : . . . . . . ..
Figure 15: VAPOR PHASE CHROMATOGRAMS OF PROPYLENE CARBONATE
Performed with 4 microliter samples with temperature programming (see text)
all runs done at attenuation = 1 .
0 In
0
38
E I \ 2 I \ h a = 1.66 in I I \Attenuation = 1
I 1 i l ' 1 .
' I ' \ ' 1 I ! I \
I \ I \ I \
f '
I \
f \
I
250 300 0 50 100 150 2 00
TIME (Seconds)
Figure 16: Vapor Phase Chromatograms of Propylene Carbonate
Performed with 4 microliter samples, with temperature programming (see text) .
39

-6
- 5 h
-1
0 0 5 10 15 20
TIME (Seconds)
2 5
4 Figure 17: Cathodic Chronopotediometry in Propylene Carbonate -- 0.1 M LiBF
Chronopotentiograms obtained on polished platinum electrodes a t current
indicated. Solid l ines a re for the freshly prepared solution.
are for the solution which had stood overnight.
Dashed l ines
40

~
This latter solution was further examined with respect to lithium deposition
on beryllium electrodes. The results are shown in the Table below: . .
TABLE 9
Deposition of Lithium in P. C . (0.11 M in water)
Deposition Conditions on Beryllium
0.45 mA cm-2 for 2 5 sec.
0.9 mA cm-2 for 25 sec. 1.2 mA cme2 for 250 sec. 1.2 mA cm‘2 for 250 sec. followed by 5 min. stirring
1.35 mA cm’2 for 25 sec.
1.8 m~ cm-2 for 25 sec.
2.7 mA cm-2 for 25 sec.
3 mA cm-’ for 100 sec.
Anodic Utilization
8 0% 83% 7276, 68%
6 1%
80%
CI J L f 7 0 r A n t O f rclw /o
3 1%
48%
We were of course quite concerned with the water Dickuo. Fifty m l . qf
100-ml. cell. a sample of disti l led propylene carbonate was placed in a capped
The water content was investigated with the results shown below:
Immediately after placing in cell
After bubbling argon through for 3 hrs.
After standing quiet for 15 hrs.
After standing qu ie t for 60 hrs.
After adding Molecular Sieve 4-A and stirring for 10 min.
After adding Molecular Sieve 4-A and standing quiet 90 min.
After adding Molecular Sieve 4-A and standing quiet 17 hrs .
0.010%
0.080%
0.087%
0.083%
0.058%
0.030%
0.019%
It appears the major source of contamination by water is from the argon. We
a re not yet certain whether this is the resul t of leaks in the deaeration system
or a bad tank of argon.
An experiment to determine the effects of electrolysis on the composition
of non-aqueous electrolytes was carried out. A 0.1 M solution of LiC104 in
dis t i l led p. c . was prepared and placed in a small volume H-cell (20 m l * Of
41

. electrolyte Per compartment). The cathode was a rectangular sheet of platinum
foi l , 6 c m in total surface area. The anode was prepared from a fclded strip
of cleaned lithium ribbon. A silver wire reference electrode was a l so placed i n
each compartment. The electrolyte was deaerated with dried argon prior to
placement i n the cell. For the first t e s t , electrolysis was performed for 15,000
sec. at 1 0 mA or 150 coulombs. A clean grey lithium deposit was obtained on
the platinum which gassed slightly throughout the run. Samples for each com-
partment, before and after electrolysis, were examined with V. P. C. The solution,
as prepared, contained 0.023% water and a trace of propylene oxide. After
electrolysis the water i n the catbode Compartment was reduced to 0.009% and
2 uI1luAL .3rn=ll aluuurii - - - - - tca. ' 0. U U l %j of a new component eluting 5 sec. after pr~pjjleile
oxide. The anode compartment composition was unchanged. The total reduction
of water content was about 17 .4 coulombs of the 150 coulombs passed.
2
The solution was further electrolyzed for 18 hrs. Electrolysis was performed
at a current of 5 mA.
new substances more volatile than water i n both compartments. At a column temp.
The m o s t significant result was the appearance of four
of 125uC, peaks were observed at 1 5 , 18, 23, 27 , 43, and 114 sec. The first
is air and the last was water, which, i n the cathode compartment was now
reduced to 0.001%. The peak at 23 sec. has been tentatively assigned to pro-
pylene oxide, while the peak at 43 sec. could be isopropyl alcohol.
Due to the similar retention t i m e s of the four new peaks, resolution is
poor even at low temperatures, which makes identification by substitution very
uncertain.
III-B. Cvclins of Lithium i n Starved Electrolyte
The cell used i n these experiments was again similar to that
shown i n Figure 8. The electrode plugs consisted of stainless steel rods milled
at one end to form a cup to contain the electrode and grooved and fitted with O-ring
seals. Except for the back surface of the cup the rest of the steel between the
electrolyte and the seal was coated with Kel-F. Leakage did not appear to be
serious. In the following experiments the counter electrode was bulk lithium
m e t a l pressed into the electrode cup. The stainless steel itself served as the
42

- working electrode and its potential was monitored. The experiments were con- ducted in butyrolactone, 1 M in LiBF4. Anodization was stopped a s soon a s ex-
cess ive polarization signalled the discharge of the lithium metal formed during
the preceding cathodization.
. *
TABLE 10
Cycling of Lithium in Starved Electrolyte
Electrode Area = 0.85 cm2 Cathodization Anodization
Cel l 1:
Cycle 1 1 mA/’ lOOO sec 1 d/560 sec (55%)
Cycle 2 2 mA/500 sec 1 mA/585 sec (59%)
Cycle 3
Cycle 4
Cycle 5
Cycle 6
Cel l 2:
Cycle 1
Cycle 2
Cycle 3
Cycle 4
Cycle 5
Cycle 6
Cell 3:
Cycle 1
Cycle 2
Cycle 3
Cycle 4
Cycle 5
4 mA/250 sec
8 mA/125 sec
2 mA/500 sec
16 mA/63 sec
2 mA/500 sec
2 mA/500 sec
2 mA/500 sec
1 m ~ / l O o O sec
20 mA/50 sec
13 mA/80 sec
1 mA/586 sec (59%)
1 mA/532 sec (53%)
1 mA/565 sec (56%)
1 mA/482 sec (48%)
1 mA/440 sec (44%)
1 mA/610 sec (61%)
1 mA/590 sec (59%)
1 mA/570 sec (57%)
1 mA/300 sec (30%)
1 m~/220 sec (22%)
1 mA/170 sec (34%)
1 mA/145 sec (29%)
1 mA/133 sec (27%)
1 mA/230 sec (46%)
1 mA/971 sec (49%)
~~ ~
While these results are only tentative, and the experiments of primary
interest in a preliminary evaluation of the cell construction, it is interesting to
note that there is no gross deterioration of cycling efficiency until one goes to
quite high currents (13-20 mA).
43

III-B-2. Cycling of Lithium in Excess Electrolyte.
Preliminary studies on the cycling of the lithium electrode
were conducted in an H-cell in which the working electrode compartment contained
about 50 m l . of electrolyte, propylene carbonate 0 . 5 M in LiClO4. The working
electrode consisted of the electrode support structure described nn Bages 9 1-92
of the Third Quarterly Report. Lithium foil was pressed into the cavity a s des-
cribed in the following sect ion III-C. The amount of lithium was about 125 couhmbs
based on a one-electron change.
The electrode v:=s cyded siiiurrlaticaiiy . Both portion of the
cycle wsi-e for 1000 sec. a t 10 mA. In Figure 18 are shown the resul ts for Cycle 4 .
The curves for cycles 1- 16 were essent ia l ly identical , though the maximum occur-
ring on the charge curve a s shown in Figure 18 was less for the other cyc les .
after ensued a change in the cycling curves and beginning with cycle 2 2 , the curves
had the appearance shown by the dashed l ine in Figure 18 for cycle 2 5 . The anodic
efficiency varied randomly for the remaining cycles up to cycle 39 after which the
cycling was discontinued. The average recovery was 59%.
There-
The results again indicate that no gross, catastrophic failure
occurs and are , therefore, most promising.
III-c. Bulk Lithium Metal Electrodes
Work with bulk lithium metal electrodes is difficult because
of the rapid oxidative attack of the metal by the atmosphere. As described in the
Third Quarterly Report, pp. 48-52, preliminary studies on the discharge of bulk
lithium metal in propylene carbonate indicated that little activation polarization
is observed. That is , the anodic dissolution of lithium metal appears to proceed
with electrokinetic reversibility. This work was performed with the 1/16 in .
thick lithium ribbon. We sought to perform similar measurements with thin lithium
electrodes. The following procedure was evolved. Lithium ribbon, 1/16 in. thick
and 1/2 in. wide was pressed between two polished, s ta in less steel surfaces a t
5000 lb. The two s ta in less steel surfaces with pressed lithium ribbon between
44

-4
-3
-2
-1
0
r
J ------- 1 S I
' \ \ \ t \
-
I ' \
I-
+I -
.
\ \ \
\ '\
1 1 I 1 '\ +2 0 400 800 1200 1600 2000
TIME (Seconds)
Fi gure 18: CYCLING' OF LITHIUM IN PROFYLENE CARBONATE
Performed in propylene carbonate, 0 . 5 M in LiAlC14. See text for
further discussion.
45

. % them are removed to the dry box without exposing the lithium to the atmosphere.
There the s ta in less steel pieces are removed exposing the thin pressed lithium
foil.
. I
Three circular pieces of lithium are punched out of this foil. The die
used is such that the piece of lithium will exactly fi t into the electrode suoport
structure described on pp. 9 1-92 of the Third Quarterly Report. The area is a b u t
0.85 c m 2 . Only the center piece is placed in the support structure.
two pieces of lithium are dissolved in water and the base released is titrated to
determine the total amount of lithium in the foil: and hence I knowing the area I
the thickness may be caiculated. The miiiimoles of lithiurn contained in the
0.85 c m 2 segments varied 1 to 1.3, which is a thickness of lithium of from 8
to 10 mils, or a capacity of 33 to 43 mA-hr cm-2 .
The gther
In the first experiment such segments were discharged anodically. A
discharge a t 11.2 mA cm'2 in propylene carbonate, 0.5 M in LiBF4, gave 78%
efficiency. A discharge a t twice this current, 2 2 mA gave 81% efficiency.
We believe the lower efficiencies are due to the fact that significant amounts of
the lithium were oxidized, in sp i te of the precautions taken, and thus not avail-
able for anodic oxidation.
In a second ser ies of experiments a lithium electrode, prepared a s des-
cribed above, was studied in propylene carbonate, 0 .1 M in LiBF4. This is a n
electrolyte composition which has been extensively used in the past .
In Figure 19, cathodic chronopotentiograms are shown. These are compared
with cathodic chronopotentiograms obtained on polished platinum electrodes in the
same solution a t similar current densities. These chronopotentiograms have not
been corrected for iR drop. The calculated corrections are l isted i n the figure.
The lithium metal open circuit potential in this solution was - 3 . N versus the
si lver d i s c reference electrode.
46

h
w cr: u VI
VI > VI L) - 0 5 .;
L O
-9
-8
-7
-6
-5
-4
-3
-2
-1
0 0 5 10 15 20 25
TIME (Seconds)
Figure 19: CATHODIC CHRONOPOTENTIOMETRY ON LITHIUM AND PLATINUM
Both ser ies of measurements performed in propylene carbonate, 0.1 M in
LiBF4. Curves are direct tracings of chronopotentiograms and have
not been corrected for iR drop. The calculated iR drop which should be
subtracted from the observed potential is given in parentheses.
47

I
~
Two major differences a re observed. First , the potential a t which re-
duction occurs on lithium is markedly different from the Qpen circuit potential a s
shown below. The O.C.V. is - 3 . 1 f .1 V.
Current Den s i ty E- Observed - - iR = ,E Cqrrected
On Li:
4 . 7 d c m - 2 -6.2V + 1.ov -5.2V
3.5 m~ cm-2 -5. OV + 0 . 8 V -4.8V
On Pt:
7.0 mA cm-2 -3.9v + 0 .7V -3.2V 9 ctr I n c ) v r q q t r
- 3 . L V r V . 3 v 3 . c! EL4 cm-2 -4. J V
Extended measurements of this type were not performed s ince the results obtained
on lithium metal electrodes were quite variable; the reduction potential becoming
more negative with increasing time of contact with the electrolyte.
The second major difference is the f ac t that no satisfactory transition
time could be obtained.
The final se r ies of experiments performed in this electrolyte with the
lithium electrode consisted in investigating the anodization potential a s a function i of current. The following procedure was employed. Before each run the lithium 1 I
was anodized for 50 sec. a t 10 mA (0.85 c m 2 electrode) in stirred solution.
Following this preliminary anodization, the electrode was allowed to stand in
quiet solution for exactly one minute. The electrode was then anodized in quiet
solution a t the current indicated for exactly 25 sec. The anodic potentials re-
mained quite constant during the entire 25 sec. The results are shown i n Figure 20.
The dashed line in Figure 18 is the current potentia1 curve calculated if the measured
potential is purely iR drop. The calculated resis tance for the geometry employed in
255 ohms; the apparent res is tance, however, is 333 ohms. This is significantly
larger than any expected error in the calculation of i R drop and resu l t s , we believe,
from the formation of a res is t ive film on lithium. This f i lm may resul t through re-
action of lithium with solvent or with impurities such a s water in the solvent. As
has been d iscussed in previous reports, we believe this f i l m is probably lithium
oxide. Its formation makes difficult the interpretation of any kind of measurements
I
I
I
I
48 I

30
g 10
5
25
L-? 03
0 ’ 15 d
I /
/ I
/
I I
/ /
/ /
/ /
/ I
I I
t
8 / /
- 0 0 -2 -4 -6 -8 -10
POTENTIAL (Volts vs. Li R.E. i n same solut ion)
Figure 20: CURRENT-POTENTIAL CURVE FOR BULK LITHIUM ANODIZATION
See text.
49

performed with solid lithium electrodes.
III-D. Lithium Deposition in Acetonitrile.
In the following section IV are discussed the results of chrono-
potentiometric investigations in acetonitrile. In this section we report only the
resu l t s of extended lithium depositions performed in this solvent.
In Figure 2 1 are shown some resul ts obtained for cathodizations
for a total of 3000 mC ern-'. After deposition a t the current indicated the current
was reversed and anodic utilization determined in the usual fashion by dividing
ihe number of coulombs recovered on anodic dissolution by the nurr?ber qf ccu!ombs
passed during the peced ing deposition.
A t lower total amount of cathodization the efficiencies were
higher a s indicated below for a ser ies of runs performed in acetonitrile, 0 .1 M
in LiBFq.
Current Density Amount of Anodic (mA crn-2) Ca thodiza tion Utilization
(mc cm-2)
On Be:
0.6
3 . 0
300
300
88%
87%, 86%
6.0 300 94%
12.0 300 75%
On Cu:
1.0
3.0
5.0
10.0
5 00
500
500
500
49%
50%
71%, 47%
59%, 65%, 57%
Further study is required and a t present me cannot say
that acetonitrile is better or worse for a cyclable lithium electrode than a re the
other solvents , propylene carbonate, butyrolactone, and dimethylformamide .
50

100%
! .
80%
i .
ik 60% w 4 -0- - - -0- -- on - Pt inA.N., 0.1 M i ~ , LiBF
_ _ _ _-_.....-.- .....\
I ) +-
\ / / .Q
-. -. . . . . .% - L a
...OR- &-i*n*W. N. , 0.1 M'i*iBF4 \ \
in A.N., 0.05 M in LiI
I
-
0 20 40 60 80 100
CURRENT DENSITY ( m ~ cm-2)
Figure 21 : DEPOSITION EFFICIENCY OF LITHIUM IN ACETONITRILE
Results obtained in solution indicated, on substrate indicated, at
current density indicated for cathodic deposition. Deposition performed
in stirred solution for the t i m e required to give 3000 mC c m
Subsequent anodic dissolution performed at 4 mA c m
by d;viding the coulombs passed during anodic dissolution by the coulombs
passed during the preceding cathodization.
-2 of deposition. -2 . Efficiency calculated
51

IV. SOLVENTS
IV -A. Solvent Purification
IV-A-1. Propylene Carbonate
Most of our work has been done with propylene carbonate. These
resul ts will be discussed first . A s discussed in the Third Quarterly Report,
it had been found that the "as-received" propylene carbonate contains
significant amounts of water and propylene oxide and a third major impurity,
which was then unidentified. Isopropyl alcohol, propionaldehyde and
propiolactone were absent i n the starting material. I t has s ince been found
that propionic acid, propionic anhydride, aiid sEy1 zksho! are a lsn ahsent .
The proof of the absence of these constituents is given by the fact +>at,
following the addition of these constituents t o the propylene carbonate,
subsequent vapor phase chromatographic examination discloses entirely
new peaks. It has now been found that the major impurity, previously un-
identified, is probably propylene glycol, s ince the deliberate addition of
propylene glycol enhances the peak for this major impurity.
The determination of the water content i n propylene carbonate by
vapor phase is 5 s follows. Two conditions of operation are followed:
a. Isothermal runs
Injector temperature : 2 2 o O c
Detector temperature: 20oOc
Column tern pera ture :
Water retention t ime: ca. 25 sec.
constant at 2 0 0 ~ ~
b. Temperature programmed runs
In j e c t or tempera tu re : 2 2 o O c
Detector temperature: 20oOc 0
Column temperature: constant at 100 C for first
100 sec. following sample injection, then increased
at 48 per min. up t o 200 C a t 175 sec. Held constant
at 2OO0C until sample has been entirely eluted.
0 0
Under both conditions of operation, the water content in weight
percent is given by:
52

% water (by weight)
T h i s has been establ
additions of water.
-.1 2 = (0.008) (Chart speed , sec. in ) (Area, i n ) (Attenuation) (Sample size , microliters)
shed by running a ser ies of samples with varying known
Vacuum distillation of two 3-kg quantities of propylene carbonate have
been performed. The material was first passed through a column of molecular
s ieves (Linde 4A) into the pot. The column was operated at total reflux a i about
5 mm Hg until constant temperature was obtained. The low boiling material
dist i l led off was collected in a liquid nitrogen cold trap. Vacuum distillation
was then continued at 5 mm H g a t a 9:: reflux ratio. Successive fractivrs *A,-,-- L~~~ec;ieCi - - I 1 - -
tography with the results shown i n Table I below.
a n a anaiyzed for the major component by vapor phase chrsrr,a-
Although a total of seven, and possibly eight, peaks a re observed
in the V.P.C. analysis of propylene carbonate, only four peaks are present
i n more than t race amounts. Data on the retention t i m e s and identification of
t hese four components a re given below:
Table 11
Purification of Propylene Carbonate
Column Operation Retention t i m e (sec.) of Component
N o . 1 No. 2 N o . 3 N o . 4
Constant temperature 13 17 83 2 16
Temperature programmed 31 96 329
Identification: Peak 1: Propylene Oxide
-- -
Peak 2: Water
Peak 3: Propylene Glycol
Peak 4: Propylene Carbonate
Results of Distillation
Conditions of Distillation
Fraction No. Press. Temp. Reflux No. 1 No. 2 No. 3 No. 4
A s received 0.32 0.07 0.42
1 - 50 ml . 5 mm. 76.5 9: 1 --- 0 .06 49.4 50.6
2 - 15 ml . 5 mm. 77-90 9:l -- - 0.13 78.8 20.9
3 - 50 ml. 5mm. 96 9:l --- 0.05 5 . 6
Amount of Component in weiqht percent
and Vol. Ratio ---
- --
53
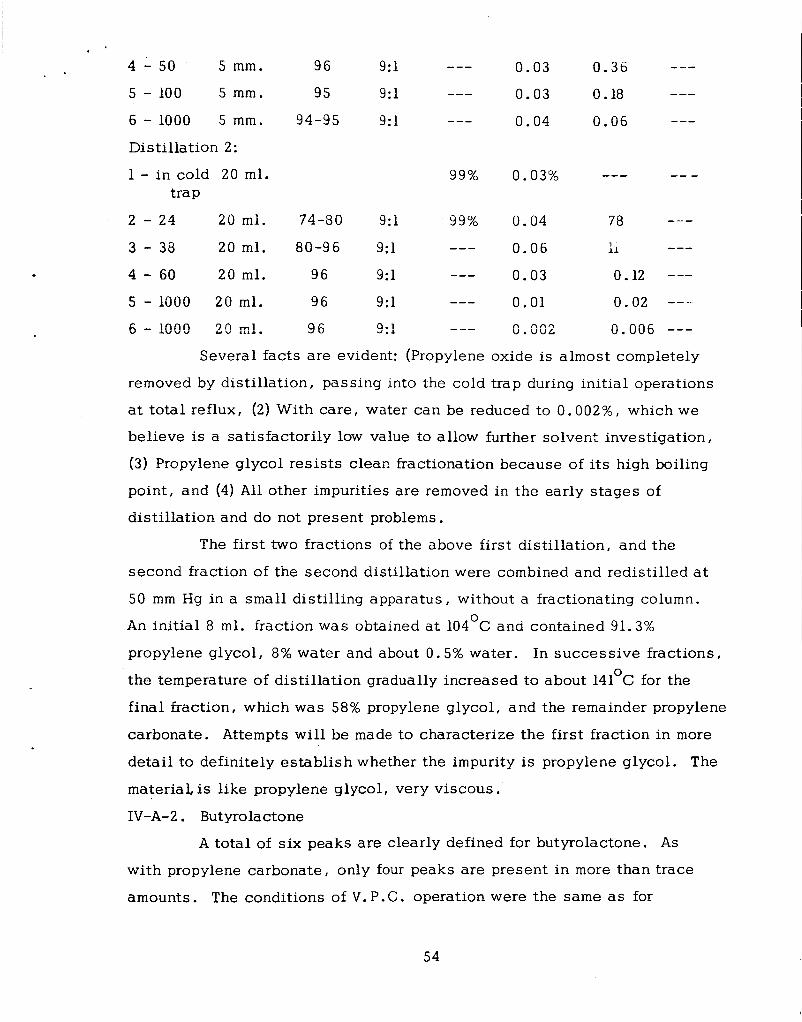
4 - 50 5 mm.
5 - 100 5 mm.
6 - 1000 5 mm.
Distillation 2:
1 - i n cold 20 ml . t rap
2 - 2 1 2 0 m l .
3 - 38 20 ml .
4 - 60 20 ml .
5 - 1000 20 ml .
6 - lo00 20 m l .
96 9:l
95 9:l
94-95 9:l
74 -8 0 3:l
80-96 9:l
96 9:l
96 9:l
9 6 !?:I
Several facts are evident:
--- 99% 0.04 78
--- 0.06 :I ---
0.03 0.12 --- --- 0.01 0 .02 ---.
---
- -- 0 . 002 0.006 _ _ _ Propylene oxide is almost completely
removed by disti l lat ion, passing into the cold trap during init ial operations
at total reflux, (2) With care , water can be reduced to 0.002%, which we
believe is a satisfactorily low value to allow further solvent investigation,
(3) Propylene glycol res i s t s clean fractionation because of its high boiling
point, and (4) A l l other impurities a re removed in the early s tages of
dist i l lat ion and do not present problems.
The first two fractions of the above first dist i l lat ion, and the
second fraction of the second distillation were combined and redistilled at
50 mm Hg in a s m a l l distilling apparatus, without a fractionating column.
An init ial 8 ml. fraction was obtained at 104OC and contained 91.3%
propylene glycol, 8% water and about 0.5% water.
the temperature of distillation gradually increased to about 141 C for the
final fraction, which was 58% propylene glycol, and the remainder propylene
carbonate. Attempts wil l be made to characterize the first fraction i n more
detai l to definitely es tabl ish whether the impurity is propylene glycol. The
material, is l ike propylene glycol, very viscous.
IV-A-2. Butyrolactone
In success ive fractions, 0
A total of six peaks a re clearly defined for butyrolactone. A s
with propylene carbonate, only four peaks a re present in more than trace
amounts. The conditions of V. P.C. operation were the s a m e as for
54

I
propylene carbonate. The data a re shown below:
Table 12
Purification of Butyrolactone
Column Operation Retention T i m e (sec .) of Component
No. 1 N o . 2 No. 3 N o . 4
Constant temperature 26 33 235 453 --- Temperature programmed 56 92 2 54
Identification: Peak 1: Unknown
Peak 2: Water
Peak 3: Unkn0"Vn
Peak 4: Butyrolactone
Results of Distillation
Conditions of Distillation Amount of Component i n Weight Percent
Fraction No. Press. Temp. Reflex N o . 1 No. 2 No. 3
As delivered 0.04 0.032 0.049 and Vol . Ratio
1 - i n cold 10 m l trap
2 - 100 2.5-3 5 5O 9:l
3 - 71 7 76-80° 9:l
4 - 100 7-8 73-80 1: 1
5 - 1000 7-8 76-80 1: 1
Distillation 2:
A s received
1 - 113 8 77-80 9:l
2 - 30 8 77-80 9:l
3 - 1000 7 77-81 1: 1
4 - 500 7 77-80 1: 1
IV-A-3. Dimethylsulfoxide
86
0.01
0.002
0.038
0.021
0.004
0.002
0.001
14
0.025
0.015
0.012
0.005
0.11
0.021
0.009
0.003
0.003
0 .08
0.03
0 .006 ---
0.004
0.019
0.015
---
A total of four peaks a re observed in dimethylsulfoxide. The
first is the air peak, which is small and wil l not be further considered. The
55

last peak is for dimethylsulfoxide, and for constant temperature runs at
200°C occurs at 75 sec. For temperature programmed runs, it occurs at
about 230 sec. The middle two peaks a re not resolved for constant
temperature runs, having a retention t i m e of about 24 sec. They a re re-
solved under temperature programming, the first , a n unknown component
has a retention of 124 sec. , the second, water , has a retention t i m e of
160 sec.
Table 13
Purification of rjiiiieihykt.i!fGxi&
Peaks 1 and 2
Fraction No. Pressure Temperature Reflux Amount of Component in
A s received 0.21%
3 -4 56-60 9:1 0.08% 1 - 64
2 - 150 3 -4 62 9:l 0.65%
3 60 - 62 1: 1 0.15% 3 - 600
We believe dimethylsulfoxide is probably best purified simply by
and Vol. Ratio Weight Percent
passing through a column of molecular s ieves .
IV-A- 4 . Dim ethyl forma m i de
Dimethylformamide, as received, is quite pure. The only material
present in significant amount is water. This material contained 0.016% by
weight of water. About three l i ters were disti l led a t 8 mm Hg at 40-50 C. A
l i ter of this material, which had stood over molecular s ieves for two months ,
contained about 0.0036% water.
0
A molecular weight apparatus of the Cottrell type was obtained for
measuring the boiling points of solvents at one atmosphere. The apparatus
was modified by the addition of a mercury wel l to contain the thermometer and
a drying tube for the reflux condenser. A sample of the dimethylformamide,
which had stood over molecular s ieves (water concentration=O. 004% by weight),
was used for the init ial trails.
days. After five hours, the boiling temperature with s t e m correction applied ,
was 152.7 C (Atmospheric pressure=758.4 mm Hg) , and after 10 days , the
The sample w a s boiled continuously for 10
0
56

0 corrected boiling temperature was 152.8 C(Atmospheric pressure = i '63.6
mm Hg). This material was then re-examined by vapor phase chromatography
and the water content had increased from 0.004% to 0.064%. The concen-
tration of the two minor impurities was about 0.002%. The significant
increase in water content did not lower the boiling point within the degree
of accuracy of the relatively simple apparatus employed.
IV-A-5. N-nitroso Dimethylamine
Preliminary investigation of the as-received material has been
conducted, It was
necessary to conduci V. T. C. axamiixtis:: uzder different conditions than
those described for propylene carbonate.
with isothermal runs performed a t a column temperature of 150 C.
peaks were observed: The air peak a t a retention t i m e of 12 sec., the water
peak at a retention t i m e of 29 s e c . , and the solvent peak a t a retention t i m e
of 107 sec. The amount of water i n the as-reseived material was about
0.098% by weight.
IV-A-6. Acetonitrile
No attempt has yet been made to purify this solvent.
Satisfactory resolution was obtained 0 Only three
A s described i n the Third Quarterly Report, p. 6 , acetonitrile has 0
been distilled at atmospheric pressure a t 81-82 C.
determine the water content i n acetonitrile by V. P. C. since the large solvent
peak completely swamps the water peak. A variety of operating conditions
were tried, but satisfactory resolution of the water peak for amounts of water
less than 10% by weight could not be achieved.
IV-A-7. N-butyl Formate
It is not possible to
Preliminary investigation of the as-received material has been
conducted. N o attempt has yet been made to purify this solvent. A s was
true with acetonitrile, no resolution of the water and solvent peaks can be
achieved, and V. P. C. is not a satisfactory method for the determination of
water content.
IV-B. Cathodic Behavior in Propylene Carbonate Solutions
The electrochemical behavior observed during cathodization i n
various propylene carbonate solutions were described in the Third Quarterly
57

Report, pp. 11-36. Four additional solutions have been examined with the
resul ts described below.
IV-B-1. Propylene Carbonate , 0.1 M n-propyl Ammonium Hexafluophosphate
This solution was particularly interesting because it gave results
characterist ic of the presence of a soluble , reducible, impurity. In the pas t ,
we have noted that the presence of such impurities as water is somewhat
paradoxical in that the expected reduction behavior is not observed. The
resul ts shown in Figure 22 indicate what should be expected and what is, in
fact, observed i f a soluble impurity is reduced without those ext_r ; rnc~)~s
complicatio~s svater zvidectly pisduces . Constancy of iT was observed
at currents from 0.55 to 2.5 mA c m
potentiograms could be obtained on the same electrode.
1/2
-2 . Successive, reproducible chrono-
IV-B-2. Propylene Carbonate , 0.1 M n-propyl Ammonium Tetrafluoborate
Chronopotentiograms were obtained at currents of from 0 .075 to -2 5 mA c m
was observed, but after 7 sec., the potential rose to -1.8V and slowly
increased to -1.9V after 2 5 sec. At 5 mA c m
rose to -3.1V and remained there for the 25 sec. of electrolysis.
gassing was observed.
. At the lowest current, a s m a l l amount of backgrou.id reduction
-2 , the potential immediately
Vigorous
IV-B-3. Propylene Carbonate , 0.1 M n-propyl Ammonium Iodide
Potentiostatic reduction i n stirred solution gave satisfactory steady
state currents with a limiting current plateau a t between -0.7 and -11.2V or
0 .2 5 mA c m . However , satis factory chronopotentiograms reflecting the
presence of material giving this limiting current were not found. Anodic
chronopotentiograms obtained on platinum were sufficiently well-defined to
allow the establishment of transition t i m e measurements. The value of
iT112 was 42 mA cm-2 sec 'I2' whereas a value of 20 would be expected
for a one electron change in a 0.1 M propylene carbonate solution.
IV-B-4. Propylene Carbonate , 0.05 M MgC12
The resul ts a re shown i n Figure 23. These results , we believe,
-2
reflect the growth of a n insulating magnesium salt f i lm .
58

-5
h
w -4 cl: u m
Potentiostatic current vs . potential curve. Limiting current = 1.5
Cathodic chrono-
0 .75 mA cm-2.
- - -- -0-- - -1 I I
r---
-_ .... 0
0 5 10 15 20 2 5
TIME FOR CHRONOPOTENTIOMETRY (seconds)
0 0.5 1.0 1.5 2 . 0 2.5
CURRENT DENSITY FOR POTENTIOSTATIC RUNS ( m ~ cm-2)
Figure 22: REDUCTION IN PROPYLAMMONIUM SALT SOLUTIONS
Electrochemical measurements made on platinum d i sc electrodes
in propylene carbonate, 0 . 1 M in tetrapropyl ammonium hexafluophosphate . Potentiostatic measurements made in stirred solution. Results indicate
the presence of a soluble, reducible impurity.
of salt to 0.15 M increased iT1’2 to 4.1, indicating the impurity is present
in the salt rather than the solvent.
Increasing the concentration
59
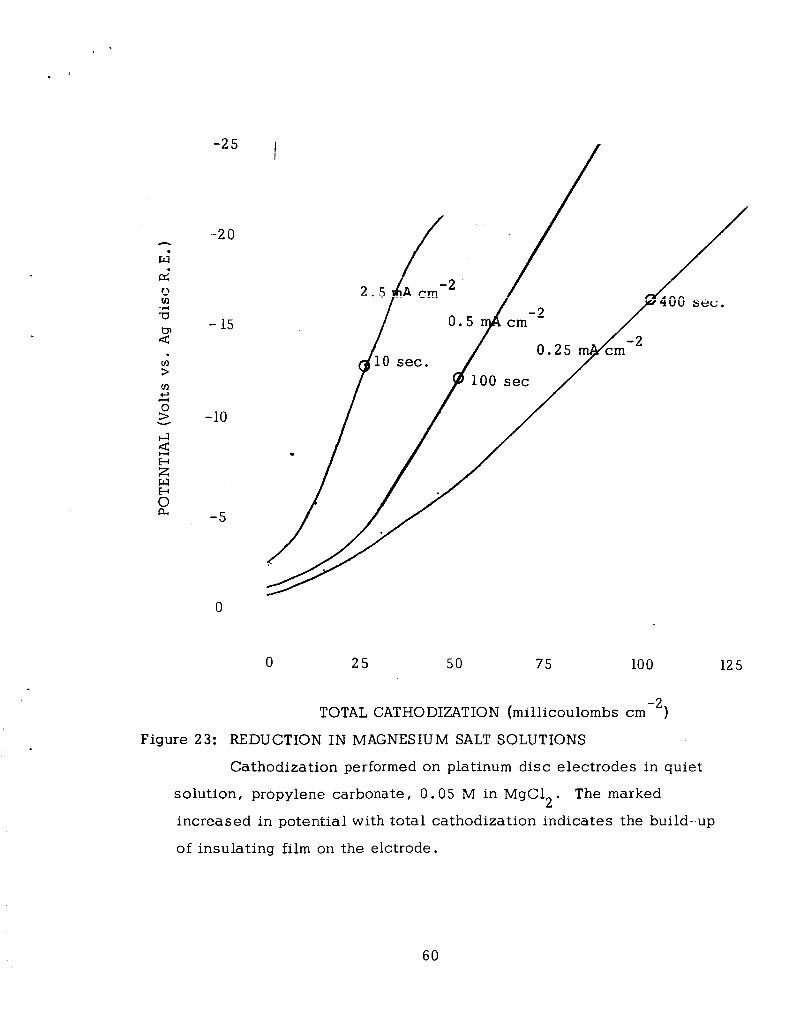
-2 0 A
w
0
0 25 50 75 10 0 12 5
-2 TOTAL CATHODIZATION (millicoulombs c m )
Figure 23: REDUCTION IN MAGNESIUM SALT SOLUTIONS
Cathodization performed on platinum disc electrodes in quiet
solution, propylene carbonate, 0.05 M in MgCIZ.
increased in potential with total cathodization indicates the build-up
of insulating f i lm on the elctrode.
The marked
60

IV-C . Cathodic Behavior i n Acetonitrile Solutions
It is of interest to investigate a variety of solutes i n each solvent
i n order to more fully characterize the electrochemical properties of the
solvent. Five acetonitrile solutions have been examined. Typical chrono-
potentiograms a re shown i n Figures 24 and 25. The dashed l ine and t h e
solid c i rc les indicate the transition t i m e determination. The results a r e
summarized below:
Table 14
Electrochemica1 Behavicr ir! .A.cetonitri!e
Solution iT1l2 (from fig. 23-24) Specific Equivalent R e s is tance Conductance
-1 2 -1 (0 hm - cm) ohm c m equiv
-2 1/2) ( d c m sec
0.1 M LiBF4 64.4 (cathodic) 161 62
0.05 M LiBF4 2 6.4 (cathodic) 2 50 80
0.05 M LiI 3 3 (cathodic) 2 04 98
19 (anodic) 2.04 98
0.05 M KI 2 5.4 (cathodic) 174 115
20 (anodic) 174 115
0.05 M AgC104 34.6 (cathodic) 15 6 12 8
Two problems were noted i n obtaining chronopotentiograms in
acetonitrile. The first was that it was impossible to obtain satisfactorily
reproducible chronopotentiograms for transition t i m e s longer than about
10 seconds.
would correspond to the iT1/2 values found for shorter transition t i m e s as
shown in Figures 24-25. W e believe this is due to the low viscosity of
acetonitri le (0.345).
e f fec t serious convection with a resultant enhancement of the transition
t i m e .
Furthermore, the transition t i m e s were significantly larger than
Thus, one expects the density grandients built up to
61

- 10
-9
-0
-7
-6
-5
-4
-3
-2
-1
0
0 5 0 5 0 5 10 I
I TIME (Seconds) ~
Figure 24: CATHODIC CHRONOPOTENTIOMETRY IN ACETONITRILE
Measurements performed on polished platinum disc electrodes
under conditions indicated.
6 2

-1.5
-1.2
-0.9
-0.6
- 0 . 3
0
+O. 3
+O. 6
+0.9
+l. 2
+l. 5
a 5 0 5 10
TIME (Seconds)
Figure 2 5: CHRONOPOTENTIOMETRY IN ACETONITRILE
Measurements performed on polished platinum disc electrcdes
under conditions indicated.
6 3
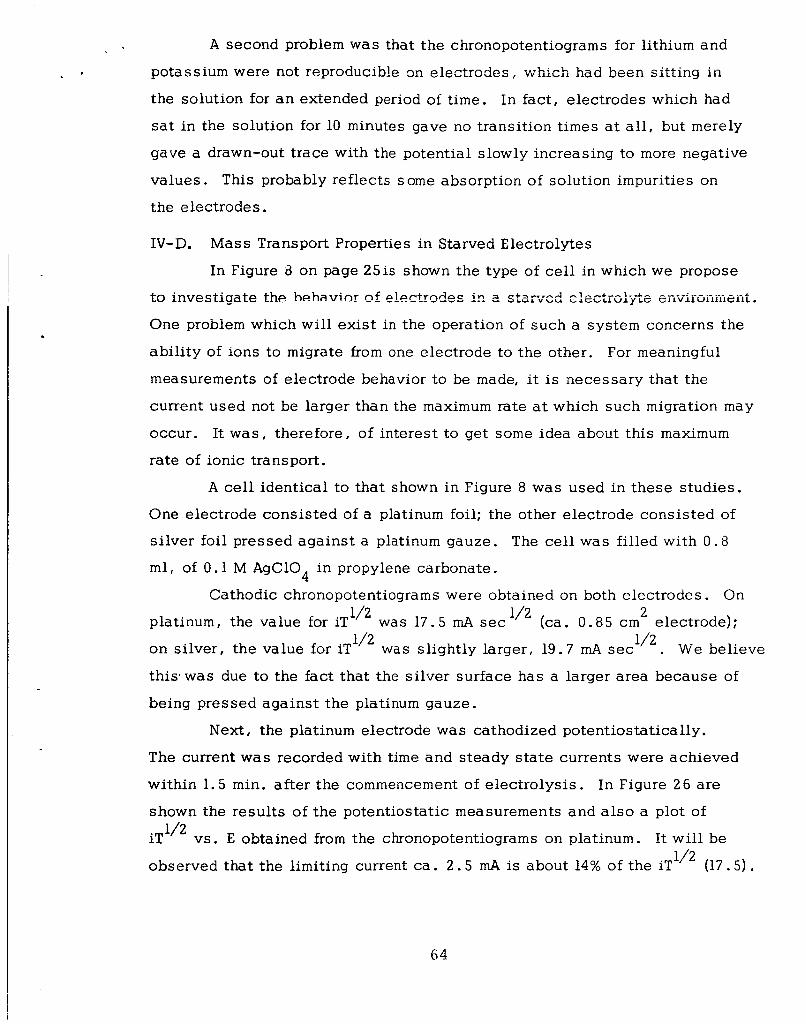
A second problem was that the chronopotentiograms for lithium and
potassium were not reproducible on electrodes, which had been sitting in
the solution for a n extended period of t i m e . In fact , electrodes which had
sat in the solution for 10 minutes gave no transition t i m e s a t a l l , but merely
gave a drawn-out trace with the potential slowly increasing to more negative
values . This probably reflects some absorption of solution impurities on
the electrodes.
IV-D. Mass Transport Properties in Starved Electrolytes
In Figure i3 on page 25is shown the type of cell in which we propose
to investigate the behavior of plpptrndes ir. a star-;ec! eleetio:~?~ efiviroiiiiieai.
One probiem which will exist i n the operation of such a system concerns the
abil i ty of ions to migrate from one electrode to the other. For meaningful
measurements of electrode behavior t o be made, it is necessary that the
current used not be larger than the maximum rate at which such migration may
occur.
rate of ionic transport.
It w a s , therefore, of interest t o get some idea about this maximum
A cell identical t o that shown in Figure 8 was used in these studies.
One electrode consis ted of a platinum foil; the other electrode consis ted of
si lver foil pressed against a platinum gauze. The cell was filled with 0 . 8
m l , of 0 .1 M AgClO in propylene carbonate. 4
Cathodic chronopotentiograms were obtained on both electrodes. On 1/2 2 platinum, the value for iT112 was 17.5 mA sec (ca. 0.85 c m electrode):
o n silver, the value for iT112 was slightly larger, 19.7 mA sec1/2. We believe
t h i s w a s due to the fact that the si lver surface has a larger area because of
being pressed against the platinum gauze.
N e x t , the platinum electrode was cathodized potentiostatically.
The current was recorded with time and s teady state currents were achieved
within 1.5 min. after the commencement of electrolysis.
shown the resul ts of the potentiostatic measurements and a l s o a plot of
iT1” vs . E obtained from the chronopotentiograms on platinum. It wil l be
observed that the limiting current ca. 2 . 5 mA is about 14% of the iT1l2 (17.5).
In Figure 26 a re
64

Lo N
0 hl
v, -
0 4
Lo
0
, -6 0
Current-Potential 0 curve
0
0
J
1 & f / @ec */-
Chrc nopotentiometry at 4 mA
-
-0.3 -0 .6 -0 .9 -1.2 -1.5 0
POTENTIAL (Volts vs . Ag wire R. E . )
Figure 26: MASS TRANSPORT PROPERTIES IN STARVED ELECTROLYTE CELL 2 See text. Chronopotentiometry performed on 0.85 c m platinum
electrode in starved elecrrolyte cell.
obtained at 4 mA c m
figure. Current-potential curves a l s o obtained on 0.85 c m platinum
electrode in starved electrolyte cell by cathodizing the electrode
potentiostatically a t the potential indicated and measuring the
resultant s teady state current which was attained within 1 min. after
the commencemnt of electrolysis.
From the chronopotentiogram
was calculated the iT1’2 curve shown in the -2
2
65

Two other cells were similarly assembled and subjected t o elec-
trolysis such that the si lver electrode was anodically dissolved and silver
cathodically deposited on the platinum electrode. The electrolysis were
conducted at constant current , and the potential of the platinum electrode
recorded. After a period of time, the potential shifted noticeably to more
negative values -- j u s t with a chronopotentiogram. From the t i m e elapsed
until this potential shift , we calculate the number of coulombs of deposition
shown below. A l-micron millipore separator was placed in front of the
platinum electrode.
Amount of Silver Amount of Silver rent (on 0.8 5 c m position before on Ag Electrode Ions in Electrolyte electrode Polarization
2 2 Coulombs 8 Coulombs 2 m A 20 Coulombs
2 2 Coulombs 8 Coulombs . 5 mA 19 Coulombs
Deposition Cur- Coulombs of De- 2
The results indicate that satisfactory ionic transport through the
millipore separator from one electrode to the other may occur without serious 3
problems. The thickness of electrolyte is given by the volume, ca . 0.8 c m
divided by the electrode area , 0.85 c m , or about 0.94 c m . For a 0.1 M
AgClO
based on the specific resistance of 465 ohm-cm of 440 ohm.
the resistance of the cell was measured and was 380 ohm.
cantly less than that predicted and suggests , we believe, that as the electrodes
were pressed together t h e distance between them was less than 0.94 c m , and
some of the elctrolye had been squeezed out of the cell. It will be noted
that the presence of the millipore separator did not increase the resistance.
2
solution in propylene carbonate, this would provide a resistance 4 Before discharge,
This is signifi-
v. FUTURE WORK
Work will be concentrated in three areas:
1. The cycling behavior of the lithium electrode. The cycling
behavior will be studied with particular attention t o the effects of electrode
substrate, electrolyte composition and current density. It will be our
objective to es tabl ish the nature of important differences so that appropriate
recommendations can be made concerning the particular variables about
which further study should be concentrated.
66

2 . Concurrent reactions during lithium deposition. Initial study
wil l be given to the analysis of solutions in which prolonged cathodization
has been conducted. Of immediate interest wil l be the effect of water.
This wil l , as t i m e a l lows, be followed by attempts to determine what other
by-products a re formed during cathodization for a n indication of the
deleterious nature of these by-products.
3 . Anodic formation of Cathode Sal ts . Of major interest will be
the attempt to find the conditions under which, during anodization of
copper metal, insoluble saits are formed. The approach wil l be that , i n
most media when copper metal is anodized, s d u b k copper spec ies aie
formed. An investigation of t h e processes which do occur will be undertaken.
These resul ts wi l l be compared with those obtained when t o the system are
added materials such as LiF, which may be expected t o result in the en-
trapment of copper through formation of CuF
attempt to find whether i n a system where entrapment of copper spec ies is
indicated, this material can be cathodically discharged.
The next s tep will be a n 2'
67

. DISTRIBUTION LIST
National Aeronautics & Space Admin. Washington, D. C. Attention: AFSS-LD/Millie Ruda
MSA/G. F. Csenwein RP/W. C. Scott
RNW/E. M. Cohn FC/A. M. Greg Andrus SL/J. R. Miles PEIW. M. Redler
RP/J. L. sloop
National Aeronautics K Space Admin. Goddard Space Flight Center Greenbelt, Maryland Attention: T. Hennign
H. Carleton J. Shirfey
National Aeronautics & Space Admin. Lewis Research Center 2 1000 Brookpark Road Cleveland, Ohio Attention: Library
Technology Utilization
N. D. Sanders, MS 302-1 J. E. Dilley, MS 500-309 R. L. Cummings, MS 500-201 B. Lubarsky, MS 500-201 H. J. Schwartz, MS 500-201 R. B. King, MS 500-201 M. J. Faari, MS 500-202
Office, MS 3-16
National Aeronautics & Space Admin. Scientific & Technical Info. Facility P. 0. Box 5700 Bethesda 1 4 , Maryland Attention: NASA Repre sentat ive
National Aeronautics & Space Admin. George C. Marshall Space Flight Center Huntsville, Alabama Attention: Philip Youngblood
Eugene Cagle
National Aeronautics & Space Admin. Manned Spacecraft Center Houston 1 , Texas Attention: Richard Ferguson (EP-5)
James T. Kennedy Forrest E. Eastman (EE-4)
National Aeronautics & Space Admin. Jet Propulsion Laboratory 4800 Oak Grove Drive Pasadena 3 , California Attention: A i j i Uchiyama
U . S. Army RandD Liaison Group(9851 DV) APO 757 New York, New York Attention: B. R. Stein
U. S. Army Research Office Box CM, Duke Station Durham, North Carolina Attention: Paul Greer
Army Research Office Office, Chief RandD Department of the Army 3D442, The Pentagon Washington, D. C. Attention: Dr. Sidney J. Magram
Commanding Officer U. S . Army Electronics RandD Lab. Fort Monmouth, New Jersey Attention: Power Sources Division
Command Officer Diamond Ordnance Fuze Labs. Washington25, D. C. Attention: Power Sources Branch
Director U. S. Army Engineer RandD Lab. Fort Belvoir , Virginia Attention: Power Sources Branch

, Director, Advanced Concepts Division Bureau of Ships (Code 3 SO) Washington 2 5 , D. C. Attention: B. Rosenbaum
Dr. Ralph Roberts Head, Power Branch Department of the N a v y Office of Naval Research Washington 25, D. C.
Department of the Navy Office of Naval Research WashiPgtJn 25, D. C. Attentjon: Mr. Harry Fox
Electrochemical Branch Naval Research Taboratory Washington 25, D. C. AtteTtion: J. C. White
U. S. Naval Ordnance Laboratory Department of the N a v y Corona, California Attention: William Spindler
U. S. Naval Ordnance Laboratory White Oak - Silver Spring, Marylclnd Attention: Philip Cole
Commander Air Force Cambridge Research Labs. L. G. Hanscom Field Bedford, Massachusetts Attention: CRO
Captain William Hoover Ai r Force Ballistic Missi le Division Los Angeles 4 5 , California Attention: WDZYA-21, A i r Force
Unit Po s t Office
Wright Air Development Division Wright-Patterson A i r Force Base Dayton, Ohio Attention: ASRMFP-2
J. E. Cooper
Commander Rome Air Development Center Griffiss Air Force Base, New York Attention: RAALD
Headquarters USAF (AFRDR-AS) Washington 2 5 , D. C. Attention: LCOL Wm. G. Alexander
Office of Technical Services Department of Commerce Washington 25 , D. C.
U. S. Atomic Energy Commission Division of Reactor Development Auxiliary Power Erznch (SNAP) Washington25, D. C. Attention: LCOL George Ogburn, Jr.
Power Information Center University of Pennsylvania Moore School Building 200 South 33rd Street Philadelphia 4 , Pennsylvania
Armed Services Technical Info. Agency Arlington Hall Station Arlington 1 2 , Virginia Attention: TTSIA
Office, DDRandE; USW and BSS The Pentagon Washington 25, D. C. Attention: Mr. G. B. Wareham

. I ,
. ' Institute of Jkfcnsc Analysis 1825 Connwticut Avenue, N. W. Suite 1 0 0 Washington 9 , D. C.
Aerojet General Corporation Chemical Products Divis im Azusa, California Attention: Dr. S . 0. Rosenberq
Aeroniitronic Division rhiico (Lorporiii: i 01 1
Ford Koa6 NcwLor t Beach, Califoriii3 Attenticn: Dr. S . W . Weller
Allis.-Chalmcrs Manufacturing C'ocinany 1100 South 70th Street Milwaukee 1 , Wisconsin Attention: Dr. T. G. Kirkland
IIT Research Institute 1 0 West 35th Street Chicago 16, Illinois Attention: Dr. H. T. F r a x i s
Arthur D. Little, Incorporated Cambridge, Massachusetts Attention: J. H. B. George
Douglas Aircraft Co. , Incorporatd Astropower Laboratory Missile and Space Systems Division 2 12 1 Paularino Avenue Newport Beach, California Attention: Librarian
A t o m i c s International Division North American Aviation, Incorporated Canoga Park, California Attention: Dr. H. L. Recht
Rat t elle Memoria 1 Inst it ut e 505 King Avenue Columbus 1 , Ohio Attention: Dr. C . L. Faust
Burgess Battery Company Division of Servel, IncorpoTated Freeport, Illinois Attention: Dr. H. J. Strauss
Catalyst R e search Corporation 6101 Falls Road Baltimore 9 , Mawland Attention: Mr. J. P. Wooley
Delco-Remy Division General Motors Corporation 2401 Columbus Avenue Anderson, Indiana Attention: Dr. J. J. Lander
Dy iiat ec h Corporation 1 7 Tudor Street Cambridge 3 9 , Massachusetts Attention: Mr. R. L. Wentworth
Eagle-Picher Company Couples Department Joplin, Missouri Mention: Mr. E. M. Morse
Electric Storage Battery Company Carl F. Norberg Research Center Yardley , Pennsylvania Attention: Dr. W. S. Herbert
El e ct roc hi m i c a Corporation 1 140 0' Brien Drive Menlo Park, California Attention: Dr. Morris Eisenberg

E l g i n National Watch Company 10 7 1L';ttiona 1 Street Elgin, Illinois Attention: hlr. T. Boswell
Dr. Arthur r le ischer 466 South Center Street Orange, New Jersey
Generai Electric Coitipafiy t(e s edrcii La ljoiGtoiie s Schenectady , New Yoik Attention: Dr. H. Liehhafsky
-
General Electric Company Advanced Technology Laboratories Schenectady , New York Attention: Dr. R. C;. Osthoff
Gulton Industries , Incorporated Alkaliile Battery Division 2 1 2 Dlirham Avenue Metuchen, New Jersey Attention: Dr. R. C. Shair
Globe-Union , Incorporated 900 Keefe Avenue Milwaukee 1 , Wisconsin Attention: Dr. VVarren Towle
Hughes R e search Laboratories Malibu, California Attention: Mr. T. M. Hahn
I. T. T. Federal Laboratories 500 Washington Avenue Nutley 10, New- Jersey Attention: Dr. P. E. Lighty
Living st on Electronic Corporation Route 309 Montgomeryville , Pa. Attention: W. F. Meyers
Lockheed Missiles & Space Company Sunnyvalc, California Attention: Dr. J. E. Chilton
Magna Corporation, Division of Thompson-Ramo-Wooldridge , inc. 101 South East Avenue Anaheim , California Attention: Dr. G. Rohrbach
M a l l e ~ y Battery Company 60 E l m Ftreet Nor th Tarrytown, New York Attention: Mr. E. F. Errico
Marquardt Corporation 1 6 5 5 5 Sat icoy Street Van N u y s , California Attention: Dr. H. G. Krull Dept. of Chemistry American University Washington, D. C.
Attention: Dr. R. T. Foley
Midwe st R e search Inst it ute 42 5 Volker Boulevard Kansas City 1 0 , Missouri Attention: Dr. B. W. Beadle
Monsanto Research Corporation Boston Laboratories Everett 49 , Massachusetts Attention: Dr. J. 0. Smith
University of Pennsylvania E l e ct roc he m i s t ry Laboratory Philadelphia 4 , Pennsylvania Attention: Prof. J. O'M. Bockris
Philco Corporation Division of Ford Motor Company Blue Bell , Pennsylvania Attention: Dr. Phillip Cholet

8
,
Radio Corporation of Amer ica Somerville , New Jersey Attention: Dr. G. S. Lozier
Southwest Research Institute 8500 Culebra Road San Antonio 6, Texas Attention: Dr. Jan A l
Thomas A. Edison Research Laboratory ?y? c G ra CLZ E d i s on Co rn pa n y Wat chung AvIPnnP Wssf Orange, New Iersey Attention: Dr. P. F. Grieger
Thompson Ram0 Wooldridge , Inc. 2 3 5 5 5 Euclid Avenue Cleveland, Ohio Attention: Librarian
Parma Research Center Library Union Carbide Corporation P. 0. Box6116 Cleveland, Ohio Attention: M. S. Wright
We sting house Electric Corporation Research and Development Center Churchill Borough Pittsburgh , Pa. Attention: Dr. S. Barnartt
Yardney Electric Corporation 4 0- 5 0 Leonard Street New York 13, New York Attention: Dr. P. L. Howard
Union Carbide Corporation Consumer Products Company Development Library P. 0. Box 6056 Cleveland , Ohio
Power Sources Division Whittaker Corporation P. 0. Box337 Newbury Park, California Attention: John Ryne
General Motors-Defense Research LaDs. P. 0. Box T Santa Barbara , California Attention: Dr. J. S. Ematko
NASA, Langley Research Center Instrument Research Division Hampton, Virginia Attention: John L. Patterson
MS 234
North American Aviation , Inc. Rocketdyne Division 6633 Canoga Avenue Canoga Park, California
Tyco Laboratories , Inc. Beaver Hil l Waltham , Massachusetts Attention: Dr. Raymond Jasinski
Research Office Rand D Direct orat e Army Weapons Command Rock Island , Illinois Attention: Mr. G. Reinsmith, Chief