management of a new fleet for expansion of …€¦ · · 2012-03-19a feasibility study ......
TRANSCRIPT

PO Box 1390, Skulagata 4 120 Reykjavik, Iceland Final Project 2002
MANAGEMENT OF A NEW FLEET FOR EXPANSION OF FISHERIES IN THE CAPE VERDE ISLANDS:
A FEASIBILITY STUDY
Péricles Augusto Rosário Martins National Institute for Fisheries Development
Cape Verde [email protected]
Supervisor Dr. Ögmundur Knútsson University of Akureyri
ABSTRACT A new fleet has been acquired by the Government of Cape Verde with the objective of taking advantage of the unexploited harvest potential of fish stock in the Cape Verde EEZ. The status of available fish stocks in Cape Verdean waters and the catching potential are analysed in this study. Available data indicates that there is expanding scope only for tuna. Different possible operating scenarios are then inventoried and the status of available fish stocks to Cape Verdean fisheries and their expansion potential are studied. The results indicate that there is substantial scope for expanding fishing for small pelagic species in Senegal and for small pelagic and demersal species in the Angolan EEZ, where free fishing licenses are available to Cape Verdean fisheries. To see how the profitability of the fishing operation may change, sensitivity analyses are conducted by using different catch, sale prices, value of crew share and fuel price (main consumption). A loan amortization schedule is made to show how the loan will be repaid. The results are discussed and recommendations concerning the way of running the fleet are made to the government.

Martins
TABLE OF CONTENTS
1 INTRODUCTION ..............................................................................................................4 2 THE FISHERIES SECTOR IN THE CAPE VERDE ISLANDS ..................................5
2.1 Government policy for fisheries development .......................................................................7 3 STATUS OF FISH STOCKS AVAILABLE TO CAPE VERDEAN FISHERIES ......8
3.1 Cape Verdean EEZ ..................................................................................................................8 3.1.1 Small pelagic species.............................................................................................................8 3.1.2 Tuna and tuna like species.....................................................................................................8 3.1.3 Demersal species ...................................................................................................................9 3.1.4 Lobsters .................................................................................................................................9
3.2 Status of stocks outside the CV EEZ available to Cape Verdean fisheries .......................10 3.2.1 The Senegalese EEZ............................................................................................................11 3.2.2 Angolan EEZ.......................................................................................................................11
4 THE NEW FLEET ...........................................................................................................13
4.1 Exploitation scenarios ............................................................................................................14 4.1.1 Cape Verde scenario............................................................................................................14 4.1.2 Senegal scenario ..................................................................................................................15 4.1.3 Angola scenario...................................................................................................................15
4.2 Fleet operation cost ................................................................................................................16 5 AVAILABLE MARKETS ...............................................................................................17
5.1 Market price ...........................................................................................................................19 6 PROFITABILITY OF THE DIFFERENT SCENARIOS............................................19
6.1 Loan amortization schedule ..................................................................................................20
6.2 Sensitivity analysis .................................................................................................................21 7 DISCUSSION....................................................................................................................23 8 CONCLUSION / RECOMMENDATION......................................................................24 ACKNOWLEDGEMENTS ......................................................................................................25 REFERENCES ..........................................................................................................................26 APPENDIX.................................................................................................................................28
2UNU-Fisheries Training Programme

Martins
LIST OF FIGURES Figure 1: Cape Verde archipelago. Of the ten main islands only the smallest one,
Santa Luzia is not inhabited (Portal de Cabo Verde 2002)....................................4
LIST OF TABLES Table 1:Export of fishing products in volume and in value1992-2000 (INDP 2002,
INE 2002)...............................................................................................................5 Table 2: Summary of catches, effort, no. of boats, fishermen and engines in the
artisanal sub sector 1986-2000 (INDP 2000).........................................................6 Table 3: Total industrial catches (tonnes) in Cape Verde 1991-2000 (INDP 2000). ...7Table 4: Fishing potential (tonnes) and exploitation status of the main resources in
Cape Verde EEZ (INDP 1999). .............................................................................8 Table 5: TAC and exploitation status of fish species in Senegal (FAO 1997). ..........11 Table 6: Status of fish stocks in Angola (SADC 2002). .............................................12 Table 7: Summary of the fisheries sector in Angola (SADC 2002). ..........................12 Table 8: Technical specifications of the 10 new vessels acquired by the Cape Verde
government (Lopes 2000). ...................................................................................13 Table 9: Fish and bait storage system and capacity. ...................................................13 Table 10: The fleet operating in the EEZ of Cape Verde catching tuna from March –
December. ............................................................................................................15 Table 11: The fleet operating in the EEZ of Senegal catching small pelagic from
February – December...........................................................................................15 Table 12: The fleet operating in the EEZ of Angola catching small pelagic and
demersal species from February – December. .....................................................16 Table 13: Variable costs..............................................................................................16 Table 14: Fish exports from Angola (million USD) 1995-1999 (SADC 2002). ........18 Table 15: Price / ton in Euros for different species in different markets (INDP 2002).
..............................................................................................................................19Table 16: Conditions of investment. ...........................................................................19 Table 17: Operating profit and present value. ............................................................20 Table 18: Loan amortization schedule. .......................................................................20 Table 19: Sensitivity analyses of the profitability of fishing operations (in euros)....21
3UNU-Fisheries Training Programme

Martins
1 INTRODUCTION The archipelago of Cape Verde is located 600 km off the coast of Senegal, West Africa (Figure1). There are 10 islands of which nine are inhabited and eight islets. The total population is 430,000. The islands are positioned between latitude 14o 50’- 17 o 20’ N and longitude 17 o 20’ – 22 o 40’ W. They are divided into two groups according to the trade winds that reach them from the African continent: windward and leeward. The total land area of Cape Verde is 4,033 km2 and the shoreline of the islands is approximately 2,000 km. The continental shelf is irregular and narrow. The area of the shelf down to 200 m is 5,394 km2. The shelf plus slope extends down to 500 m, and constitutes an area of 7,650 km2 (Almada 1992).
Figure 1: Cape Verde archipelago. Of the ten main islands only the smallest one, Santa Luzia is not inhabited (Portal de Cabo Verde 2002).
In 2002 the Government of Cape Verde acquired, through the Integrated Fisheries Development Project, co-financed by the African Development Bank and the Arabic Bank for African Economic Development, 10 new 26 m fishing vessels made of glass reinforced plastic. By operating this fleet in a profitable way the government expects to increase the contribution of fisheries to the Gross Domestic Production (GDP), to increase the level of employment, improve exports and increase the balance of payment. Originally it was planned that these vessels should be sold to private Cape Verdean entrepreneurs. Due to the cost of the investment and the low financial and technical capacity of the national entrepreneurs, the government decided to establish a fishing company to manage the new fleet. This company will be created with national and external capital in order to protect national interests and acquire the external know-how and financial capacity. The new fishing company is meant to fulfil the following objectives set by the government (Lopes 2002):
• To increase catches and landings; • To better utilize the production capacity of the processing plants, through the
furnishing of sufficient quantities of raw material; and • To improve the social and economic conditions on the islands.
4UNU-Fisheries Training Programme

Martins
To fulfil these objectives it is clear that the operation of this fleet needs to be profitable in the long run. Profitability requirements in Cape Verde are normally considered to be 15%. Due to the seasonal nature of the Cape Verdean fisheries such a fleet would have to target different species during different seasons if it is to operate throughout the year. This may, however, not be enough to ensure profitability. The fisheries potential within the Cape Verdean EEZ is limited and such an operation is likely to affect the profitability of the artisan and semi-industrial fleets, which are of high social importance. Profitability of the investment will depend on the status of exploitation of the fish stocks, available markets, price and the operation and strategy. There are several options other than increasing fish pressure on local stocks. Fishing agreements exist among countries in the sub-region and between Cape Verde and the other African Portuguese Speaking Countries (PALOP). Free fishing licenses are available for the Cape Verdean fleet in Senegal, Gambia, Guinea Bissau, Guinea Conakry, Sao Tome, Angola and Mozambique. In this study an inventory is made of the different operating scenarios for the fleet. Their potential profitability is analysed and recommendations are made to the government concerning optimal operation of the fishing company. This includes:
• Looking at fishing in Cape Verde EEZ and the potential there. • Looking at fishing in other EEZs and the potential there. • Looking at potential markets near fishing grounds. • Constructing different scenarios, using assumptions based on the present
study. 2 THE FISHERIES SECTOR IN THE CAPE VERDE ISLANDS
The importance of an economic activity is usually measured by its contribution to the GDP of the country. In Cape Verde the relative contribution of fisheries to GDP has been decreasing and is now less than 4% (Governo de Cabo Verde 2001) but it employs directly and indirectly around 20,000 people (Cadima 1996). Fisheries exports (Table1) are very important for the equilibrium of the balance of payment. Fish and fish products constitute the main animal protein source in Cape Verde and are the staple food for a large part of the population. Finally the fisheries sector has cultural value, is of recreational importance and attracts tourism.
Table 1: Export of fishing products in volume and in value1992-2000 (INDP 2002, INE 2002).
Year 1992 1993 1994 1995 1996 1997 1998 1999 2000 Fish Exp. (tonnes) 2,274 994 1,974 1,289 2,636 3,115 2,448 1,236 344 Fish Exp.(Th.US$) 205 184 196 160 171 178 203 190 100 Tot. Exp. (Th.US$) 312 408 687 1,046 1,295 1,016 1,170 % from fish exports 58.9 48 23.3 16.3 13.7 19.9 16.3
5UNU-Fisheries Training Programme

Martins
The value of fish export in the last nine years has varied from 160–205 thousand US$. In 2000 there was a decrease in fish export due to an embargo set by the EU. It is still in force and although official export figures for 2001 and 2002 are not available, it is likely that they would show a further contraction. Commercial species are grouped into large pelagic, small pelagic, demersal species and lobsters and they are all caught in both the artisanal and industrial sub sectors. The artisanal sub sector’s fleet (Table 2) is composed of around 1,400 wooden open deck boats 4–8 m long, with 5-25 HP out-board engines and 2-4 crew (INDP 2000). These boats operate in coastal areas, using mostly hand line, purse seines up to 250 x 25 m, gill nets and beach seines 50–90 x 3-8 m (INDP 2000). The catches are rarely preserved in ice and usually landed in small fishing ports for local consumption.
Table 2: Summary of catches, effort, no. of boats, fishermen and engines in the artisanal sub sector 1986-2000 (INDP 2000).
Catch Year Catch/ tonnes
Effort/ trips
Number of boats
No. of Engines
No. of fishermen Kg/trip Ton/boat Ton/fisher
1986 4,764 119,851 1,276 550 3,821 40 3.7 1.2 1987 4,005 135,478 1,327 536 4,003 30 3 1.0 1988 4,092 116,663 1,387 573 4,182 35 3 1.0 1989 6,391 154,368 1,404 599 4,258 41 4.6 1.5 1990 4,935 137,998 1,363 634 4,392 36 3.6 1.1 1991 4,884 138,534 1,376 628 4,576 35 3.5 1.1 1992 4,308 112,737 1,328 675 4,143 38 3.2 1.0 1993 4,829 123,016 1,354 881 4,388 39 3.6 1.1 1994 5,347 134,699 1,455 1,000 5,481 40 3.7 1.0 1995 4,547 128,732 1,476 1,012 5,538 35 3.1 0.8 1996 4,912 134,667 1,424 986 5,406 36 3.4 0.9 1997 4,920 140,404 1,400 986 5,675 35 3.5 0.9 1998 5,242 148,158 1,400 986 5,724 35 3.7 0.9 1999 5,968 155,009 1,267 920 4,283 39 4.7 1.4 2000 6,977 173,856 1,267 920 4,283 40 5.5 1.6
The industrial sub sector (Table 3) operates around 60 10–26 m long wooden, plastic or steel vessels with in-board engines (up to 625 HP) targeting small pelagic and demersal species, tuna and lobsters. The production is always preserved in ice mainly for export and processing plants. Up to 1992, tuna and tuna like species and lobsters constituted the main target species for the industrial vessels. In 1992-1999 there was a good market for horse mackerel. A long-line fleet based at the Canary Islands paid good prices, making these fisheries more profitable than the pole and line fisheries for skipjack tuna. This explains the relatively low level of catches of tuna in 1992-1998 and the corresponding increase in the small pelagics (Table 3). Since 1999 the development of the tuna fishery has been hampered by lack of live bait and an import embargo set by the EU in 2000. To date the embargo is still in effect.
6UNU-Fisheries Training Programme

Martins
The activity of the industrial fleet is regulated by licenses issued by the General Directorate of Fisheries at the Ministry of Agriculture and Fisheries.
Table 3: Total industrial catches (tonnes) in Cape Verde 1991-2000 (INDP 2000).
Year Tunidae S. Pelagic Demersal Lobsters Diverse Total 1986 2,215 327 36 2,578 1987 3,007 216 33 51 3,307 1988 1,840 221 209 25 2,295 1989 1,860 210 121 30 2 2,223 1990 1,351 244 16 30 3 1,644 1991 2,105 309 2 70 8 2,494 1992 967 1,179 2 106 11 2,265 1993 832 1,193 20 76 50 2,171 1994 940 1,823 58 68 20 2,909 1995 1,737 1,990 126 60 35 3,948 1996 1,640 2,230 240 29 104 4,243 1997 1,233 3,230 137 25 82 4,707 1998 1,188 2,734 156 27 113 4,218 1999 2,065 2,003 164 35 136 4,403 2000 1,742 1,892 90 29 91 3,844
2.1 Government policy for fisheries development
Until 1992 the government was active in commercial fisheries. It then sold its fishing company. The private sector has not managed to fill the gap left by the government company, forcing the government to revise its policies. Buying 10 new fishing vessels is an attempt to re-vitalise the industry. The government policy for fisheries development is presented in “Programa do Governo 2001-2005” and can be summarised as follows:
• To reconsider the state as an investor in the sector. • To promote external investment in the fisheries sector. • To create incentives for savings as a way to built financial capacities for the
investment and writing off old debts. • To motivate the private enterprise initiatives. • To institute sanitary and quality control in order to meet the requirements of
the domestic and external markets. • To adjust the legislation of the sector to the new national and international
requirements, in substance of exploitation and preservation of the resources. • To monitor and regulate foreign fleet activity for the evaluation of its global
impact in order to identify the strategies that maximise the economic and social benefits of this activity.
• To update information on the state of the resources in order to be able to furnish global and specific recommendations for the sustainable exploitation of the resources.
• To emphasise environmental education and strengthen preservation of biodiversity.
7UNU-Fisheries Training Programme

Martins
3 STATUS OF FISH STOCKS AVAILABLE TO CAPE VERDEAN FISHERIES
3.1 Cape Verdean EEZ Over-fishing is a threat to the future of many people who depend on the resources of the sea, either for their employment and income or their nutrition. About 70% of the commercial species worldwide are already fully exploited or depleted (FAO 2000). The historical evolution of the catches and the results from marine research show that although Cape Verde has a large EEZ, it has limited fish resources (Table 4). Demersal stock is relatively small. They have a low regenerating capacity and are very sensitive to fishing pressure.
Table 4: Fishing potential (tonnes) and exploitation status of the main resources in Cape Verde EEZ (INDP 1999).
Resources Estimated TAC Average catch Expansion potential Thunidae 25,000 – 30,000 7,500 17,500 Small pelagic 10,000 – 12,000 4,500 5,500 – 7,500 Demersal 3,000 – 5,000 900 2,100 – 4,100 Lobster 50 - 70 47 Fully exploited
3.1.1 Small pelagic species In Cape Verde the main pelagic species are horse mackerel, Decapterus macarellus (Cuvier 1833) with an estimated potential of 10,000-2,000 tonnes (INDP 1997) and bigeye scad, Selar crumenophthalmus, (Bloch 1793) estimated at 1,000–1,500 tonnes (Carvalho and Caramelo 1996). Like most short lined pelagic species their abundance tends to fluctuate with fluctuations in environmental conditions. The catches of horse mackerel increased until 1997 because of the demands for frozen bait for the Canary based long lining tuna fleet and decreased again after this period. Juveniles of both species constitute the main bait for tuna fishing with pole and line and they are frequently caught for human consumption. According to INDP’s management issues no more purse seiners can be licensed. 3.1.2 Tuna and tuna like species The archipelago of Cape Verde is located in a productive zone for tropical tuna and tuna like species. The estimated TAC for coastal and deep-sea waters is 25,000 tonnes (Hallier 1996) and they are considered moderately exploited (INDP 1996). The tuna and tuna like species are exploited by national and foreign fleets, with different fishing gears. The total catches of both fleets are below the estimated potential yield. The catches of the foreign fleet appear to be underestimated but they have never exceeded 3,000 tonnes. The low exploitation level in Cape Verde has been attributed to lack of bait. Although this is partly true it’s not the main reason. There are external factors, such as low and decreasing prices for skipjack tuna in the international market, which hinder its traditional fishing (Hallier 1996). In the Cape Verde waters the most important species are: yellowfin tuna (Thunnus albacares) (Bonnaterre 1788), bigeye tuna (Thunnus obesus) (Lowe 1839) and skipjack tuna
8UNU-Fisheries Training Programme

Martins
(Katsuwonus pelamis) (Linnaeus 1758). They are mainly caught by hand line or with pole and line. To catch skipjack live bait is essential and therefore all pole and line vessels are equipped with purse seines. Yellowfin and bigeye can be caught with long line using dead bait, frozen or fresh. A pole and line vessel catches annually around 250-450 tonnes, the average specific catch composition from August to November is: 70% skipjack, 25% yellowfin and 5% bigeye. From April to August and from October to December it changes to 70% yellowfin, 10% bigeye and 20% skipjack. INDP recommends maximising the catches of the national fleet. 3.1.3 Demersal species Although the catches have been increasing slowly, it seems that stocks are intensively exploited in certain areas. They are made up of very small populations, with limited genetic diversity and slow individual growth. They are very sensitive to fishing effort. Generally it is difficult to increase the catches of rocky bottom demersal species (Monteiro 1998). The sandy bottom demersal species are under-exploited and their potential is estimated at 700-2,800 tonnes/year (Thorsteinsson et al. 1995). The species living below 200 m are slightly exploited but recent studies show that they are not abundant and therefore they will not support high fishing effort (Menezes et al. 2001). INDP recommends preserving the demersal species for the national fleet and banning the use of gillnets and trawsl on the rocky bottom and sea mountains. 3.1.4 Lobsters Four species of lobster are caught on the continental shelf of Cape Verde, the pink, green and brown spiny lobsters and slipper lobster. They are very sensitive resources with slow population growth and relatively sedentary. The pink spiny lobster (Palinurus charlestoni) is an endemic species in Cape Verdean waters. It lives in depths between 100-450 m, the largest density around 200 m (Almada Dias 1995). They are caught in baited traps that are placed on the seafloor linked to a buoy. Usually traps are set in the afternoon and hauled in the morning. Until 1992 different potential estimations have considered the annual catch potential to be around 1,000 tonnes for all four species (Postel 1966, Fouéré 1981). In 1992 M. E. Carvalho and D. Latrouite estimated the pink spiny lobster’s potential to be between 100 and 150 tonnes and Almada (1992) estimated it to be around 70 tonnes for males and 34 tonnes for females. Demersal surveys from 1995 to 1999 show that the CPUE tends to decrease and this trend has continued since then (INDP 2002).
9UNU-Fisheries Training Programme

Martins
Evaluation shows that they are economically over-exploited (Eide et al. 1996) and at the present time only four vessels are operating for spiny lobster. INDP recommends extending the closed season by two months from July to November and maintaining the actual fishing effort (number of boats and traps). The green spiny lobster (Panulirus regius) (De Brito Capello 1864), is distributed from southern Morocco to northern Tanzania. In Cape Verde it lives on rocky bottoms around all the islands at depths up to 50 metres. Brown spiny lobster (Panulirus echinatus) (Smith 1869), is found along the Brazilian coast, Canary Islands, Saint Helene, Assumption and Cape Verde Islands. It prefers rocky and coral bottoms located between 0 and 50 m depths. Slipper spiny lobster (Scyllarides latus) (Latreille 1803), present around the Mediterranean Sea and Atlantic Ocean from south Portugal to south Senegal and around the Canary and Cape Verde Islands at depths of up to 100 m.. The coastal lobsters are caught by diving with autonomic diving-dress from small boats. With regard to the coastal lobsters, INDP recommends replacing the diving technique for traps to preserve this resource for the artisanal sector and to extend the closed season, which is at present from July-September to November. 3.2 Status of stocks outside the CV EEZ available to Cape Verdean fisheries Although most of the fish stocks are considered under-exploited (Monteiro 1998), this study will consider only the extension potential for tuna (Table 4). According to INDP’s recommendations, in order to protect the resources and to avoid social conflicts, demersal and small pelagic species should be reserved for the already existing fishing fleets. This study proposes to analyse different possible operating scenarios out of Cape Verdean waters. Cape Verde has a reciprocal fishing agreement with the sub-region countries and the PALOP. In the past the Cape Verdean public fishing company operated in Senegal and Angola for many years. Now revising its policy for the development of the fishing sector the government has acquired a new fleet and intends to operate it out of the Cape Verde EEZ in order to take advantage of the fishing agreements signed with different countries. Senegal has a better fishing market than Cape Verde and it is close to the most important southwest African markets for tuna and small pelagics such as Abidjan and Thema. Angola is also an attractive market and it has high expansion potential for small pelagic and demersal species. In addition, important Cape Verdean communities live
10UNU-Fisheries Training Programme

Martins
in these two countries, which constitute potential investors in the company and manpower. 3.2.1 The Senegalese EEZ In Senegal, fisheries resources represent important economic and social interests. In fact, in 1999 more than a quarter of foreign exchange earnings (US$ 2.83 billion) came from sea products and fisheries contributed 2.4% of the GDP (World Information 2002). Over the last few years the fisheries sector has become Senegal’s primary economic sector, ahead of both peanuts and phosphate. The annual mean fisheries production in the 1980s has been around 250,000 tonnes, but reached 350,000 tonnes as of 1993. The exploitation of these resources by both artisan and commercial fleets is very important economically and socially. The fisheries sector directly employs 57,000 fishermen, of which 47,000 are in the artisanal sector. The fisheries sector also creates more than 150,000 jobs indirectly, including a large marketing sector consisting mainly of women. In all, it is estimated that 15% of Senegal’s labour force is linked to the fishery sector. The two fisheries industry components, artisanal and commercial, are often complimentary but can also conflict. Therefore, their development must be based on careful decisions guaranteeing the equilibrium of all components of the fisheries systems, including the preservation of the resource and the maximisation of revenues by both the public and private sectors. It is therefore deemed necessary to support research, which allows continuous surveillance of the state of fisheries resources and their levels of exploitation. Although the figures of actual catches are not presented, in Senegal the large pelagic are fully exploited and demersal species are slightly over-exploited. There is only potential for increasing small pelagic fisheries (Table 5).
Table 5: TAC and exploitation status of fish species in Senegal (FAO 1997).
Resources Total allowed catch Status Large pelagic 15,000 – 20,000 Fully exploited Small pelagic 200,000 – 450,000 Moderately exploited Demersal 130,000 Slightly over-exploited
3.2.2 Angolan EEZ The continental shelf is roughly divided in two parts: the northern area with relatively warm waters (Angola current) and the southern area, narrower, with cold waters (Benguela current). The influence of these currents varies according to the season. The diverging currents create strong up-welling leading to high primary production. Over-fishing and hydroclimatic conditions have strongly reduced the potential of fisheries, which is now estimated to be about 360,000 t/y. Of this potential,
11UNU-Fisheries Training Programme

Martins
285,000 tonnes are small pelagic species like horse mackerel and pilchard, 55,000 tonnes are various demersal species and 20,000 tonnes are deep-water crustaceans and molluscs (Table 6).
Table 6: Status of fish stocks in Angola (SADC 2002).
Resources Potential Status Small pelagics 285,000 Under exploited Demersal 55,000 Under exploited Large pelagics 20,000 Under exploited
The actual total catches of the Angolan fisheries were just over 200,000 tonnes in 1999, absolutely identical as in 1998. 170,000 t are fished by the national fleet, including 31,000 t from the artisanal sector, and 32,000 tonnes are caught by foreign vessels. This last figure illustrates a sharp decline of foreign activity that was over 100,000 tonnes in 1997. The state owned fleet is also in constant decline, with only 1,000 tonnes fished in 1999, and is largely compensated by the rapid growth of catch from the private sector that has doubled in the last five years (SADC 2002). Purse-seiners targeting the small pelagic species, are largely dominant, with 80,000 tonnes, followed by the trawlers that showed recently a steady growth, up to 43,000 tonnes in 1999. In total 171,000 tonnes are caught by industrial, or semi-industrial vessels (the industrial registered fleet is about 200 vessels) and 31,000 tonnes are from the artisanal sector (Table 7). The latter is apparently relatively stagnant compared to the industrial sector.
Table 7: Summary of the fisheries sector in Angola (SADC 2002).
Fleet Nr. of vessels Nr. of fishermen Catches (tonnes) Artesanal 3,740 21,500 30,954 Industrial 214 13,500 139,064 Foreign vessels 91 - 32,000 Total 4,045 35,000 202,018
The actual catch of the artisanal sector has been estimated at only 30-50,000 tonnes in recent years. This sector employs most of the fishermen (21,500 of 35,000 in total). Artisanal boats are over 3,700 units but only 14% are engine powered. It appears that all the groups of species are under-exploited (Table 6).
12UNU-Fisheries Training Programme

Martins
4 THE NEW FLEET The fleet is composed of 10 vessels well equipped for navigation and fish detection and capture with pole and line, long line and purse seine. They are all equipped with an extra mobile live bait tank that can be removed when using purse seines or long line. The main characteristics of the vessels are specified in Table 8.The fish hold and the fixed bait tank are insulated and refrigerated to 1o C. Demersal and small pelagic species are preserved in ice respectively in boxes and directly in the fish hold while tuna species are first showered with refrigerated seawater at 1o C.
Table 8: Technical specifications of the 10 new vessels acquired by the Cape Verde government (Lopes 2000).
Length overall 26.00 m Breadth 6.50 m Draught 3.50 m Hull GRP – Glass Reinforced Plastic Crew 17 Fish hold capacity 116.00 m3
Live bait tank 58.00 m3
Fuel capacity 44.00 m3
Water capacity 17.00 m3
Autonomy 23 days Speed 10.5 knotsMain engine Caterpillar: 600 HP; 1,800 rpmAuxiliary engine Cummins Leroy Summer: 2 x 100 KVAIce making machine 3.0 tonnes / 24 hoursWater desalinisation 2.00 m3 / 24 hours
The fishing capacity of the fleet will depend on the available resource and its storage capacity. With such characteristics each vessel would be able to store per trip 75.4 tonnes of small pelagic, 40.6 tonnes of demersal species, 52.2 tonnes of tuna and 1.7– 1.9 tonnes of live bait (Table 9).
Table 9: Fish and bait storage system and capacity.
Species Preserving system Storage capacity Small pelagic In ice free in the fish hold 116 m3 x 650 kg Demersal In ice in plastic tubs in the fish hold 116 m3 x 350 kg Tuna In ice free in the fish hold after being
showered in refrigerated sea water 116 m3 x 450 kg
Bait Live in bait tank 58 m3 x (30-50) kg For tuna and tuna like species the fishing capacity will depend also on available live bait. One ton of live bait is needed to catch 10-30 tonnes of tuna (FAO 1990).
13UNU-Fisheries Training Programme

Martins
4.1 Exploitation scenarios The effective deployment of an industrial fishing fleet must be guided according to the productivity of the operating zones and to the attractiveness of the markets (Lopes 2002). The fleet opens new horizons and facilitates the use of diverse exploitation scenarios what will assure the profitability of the fleet. In this perspective, the fleet will be able to operate in the EEZ of Cape Verde, Senegal and Angola, where free fishing licenses are issued to Cape Verdean vessels. The fleet will operate on the basis of two fundamental parameters: the TAC (expansion potential) and value of the catches. Therefore this study analyses the potentialities of each different EEZ and the nearest available markets. In order to maximise the profitability the landings and the commercialisation of the catch as well as the vessel’s provisions will be effectuated in the country the fleet is operating in. Each type of fishing is characterised by its specificity defined basically by the fishing gear used. Therefore the fishing of small pelagic with purse seines, according to the abundance of species, can be organised in highly productive short trips. This particularity can change the foreseen scenarios because each trip may become shorter and will increase the probability of higher catches and profits. For each scenario unforeseen lost days are predicted. 4.1.1 Cape Verde scenario According to the status of fish stocks in Cape Verde (Table 4) the study considers the hypothesis of fishing only tuna and tuna like species not only to prevent social conflicts with the artisanal sector and the already existing industrial fleet, but also to protect the small pelagic, demersal and lobster resources. The fleet will operate from March to December because in January and February the weather conditions are very bad. During these 10 months each vessel will make 24 trips of 11 days each and four effective fishing days (Table 10). To get the necessary live bait to catch tuna each vessel will be sailing to Senegal and back for six days per month. In the Cape Verde EEZ the fish is caught mostly around the sea mountains.
14UNU-Fisheries Training Programme

Martins
Table 10: The fleet operating in the EEZ of Cape Verde catching tuna from March – December.
ACTIVITIES NO. DAYS Searching and fishing bait 3 Searching fish 0.5 Fishing 4 Sailing towards landing site 0.5 Landing 2 Crew resting 1 Total days per trip 11 Number of months 10 Number of trips 24 Number of days at sea 192 Number of days in the port 72 Unforeseen lost days 36 Total operation days 300
4.1.2 Senegal scenario In this scenario the fleet will operate from February – December (Table 11). During this period 36 trips of eight days duration and four effective fishing days each are made. The predicted catch for the whole fleet is 13,700 tonnes of horse mackerel and pilchard. In this EEZ, fish is abundantly found in open sea and therefore only four days per month are predicted for sailing and fish searching.
Table 11: The fleet operating in the EEZ of Senegal catching small pelagic from February – December.
ACTIVITIES NO. DAYS Searching fish 0.5 Fishing 5 Sailing towards landing site 0.25 Landing 1 Crew resting 1 Total days per trip 8 Number of months 11 Number of trips 36 Number of days at sea 216 Number of days in the port 72 Unforeseen lost days 42 Total operation days 330
4.1.3 Angola scenario In this scenario the fleet will operate for 11 months, each vessel realising 42 trips of seven days each and three of effective fishing (Table 12). According to the potential of the EEZ of Angola (Table 6) the whole activity will be addressed to small pelagic and demersal species.
15UNU-Fisheries Training Programme

Martins
Due to the relative widespread abundance of this species, mainly small pelagic, only days per month are predicted for sailing and bait searching and the catches can be landed in the main fishing ports of Luanda, Lobito, Namibe and Matadi.
Table 12: The fleet operating in the EEZ of Angola catching small pelagic and demersal species from February – December.
ACTIVITIES NO. DAYS Searching and fishing bait 0.25 Searching fish 0.5 Fishing 3 Sailing towards landing site 0.25 Landing 2 Crew resting 1 Total days per trip 7 Number of months 11 Number of trips 42 Number of days at sea 167 Number of days in the port 126 Unforeseen lost days 37 Total operation days 330
4.2 Fleet operation cost The main cost in Cape Verde is fuel. Each vessel is equipped with a 600 HP main engine that consumes 96.4 litres and a 2 x 125 HP auxiliary engine consuming 20.1 litres/hour. The calculations for fuel and lubricants are made according to the scenario activity plan and using the formula C= 0.75 x P max x S/d x t x 1/1000 recommended by FAO (FAO 1990). For each scenario I will consider the price in the respective country in the EEZ which the vessels are operating in. For the profitability study variable costs are calculated according to predicted catch or fishing days (Table 13 and Appendix 2, 3 and 4).
Table 13: Variable costs in USD.
Scenarios CAPE VERDE SENEGAL ANGOLA Variable costs / species YFT BET SJT H.mack. Pilchard H.mack. Demersal Crew share per ton sales 71 108 41 32 45 30 144 Ice per tonnes catch 22.7 22.7 22.7 10.2 10.2 10.2 10.2 Fuel per sailing day 952 644 644 Fuel per fishing day 624 422 422 Lubricant per sailing day 143 87 87 Lubricant per fishing day 90 55 55 Food per month 1,851 1,851 1,851 Fishing gear % of revenue 1% 1% 1% Water per month 160 150 150 Salary per month 34,120 34,120 34,120 Agency per fishing month 1,800 1,800 1,800 Communic. per fishing month 1,310 1,310 1,310
16UNU-Fisheries Training Programme

Martins
Food and water consumption are calculated according to estimates by the Cape Verdean Commercial Navy. The main fishing gears are acquired with the vessels and considered initial investment. One percent of revenue per year is used for supplies and maintenance of fishing gear. Maintenance of vessels and equipments is 3% of revenue per year. For insurance the study considers the best proposal received in Cape Verde. The salary is calculated according to current wages in Cape Verde. It consists of a fixed part paid to the permanent employees and a variable one paid to the seasonal crew members as fishermen and cooks. A crew share is paid at the end of the year for all the crew members as a percentage of the total revenue. For tuna small pelagic and demersal species the study considers 10% of the revenue as the crew’s share. 5 AVAILABLE MARKETS Industrial fishing for pelagic species is a dynamic economic activity, characterised by a high level of competitiveness. In the production sector these dynamics and competitiveness are responsible for the needs of improving the efficiency of the vessels by using sophisticated (new) catching methods and new fish finding equipment to locate areas to maximise the fishing effort. There is always a gap between demand and supply of raw material that imposes rules and influences the price of canned products increasing the competitiveness among the different actors of this fishery. It is very important to know the rules of the market in order to take the most advantage in commercial transactions, mainly in what refers to raw material for canneries where, very often, the buying and selling process is concluded before landing the product. In the west coast of Africa the most important pelagic markets for canneries are located in Dakar (Senegal), Abidjan (Ivory Coast) and Thema (Ghana). At present, Dakar is one of the Atlantic Ocean’s major tuna fishing zones with a fleet of line fishing boats made up of French and Spanish Basques. The three tuna processing plants in Dakar have a total capacity of 50,000 tonnes per year. These three plants depend largely on long liners for their supply of tuna as the fleet of line fishing tuna boats based in Dakar is only made up of some 10 units with an average age of 30 years. This lack of supply of fish as a raw material is in fact a major concern for the three tuna processing plants.
17UNU-Fisheries Training Programme

Martins
Tuna prices are generally 10% higher in Dakar than on the international market, among other reasons, because of the competition among the canneries to purchase raw materials (CDI-Partnership 2002). In recent years the Cape Verdean canneries have processed very low quantities due to lack of raw material. The catches landed by the artisanal and the old industrial fleet are sold for local consumption at high prices that can’t be afforded by the canneries. The main markets for Cape Verdean canned fish before the EU‘s embargo were France, Germany and Italy. In December 2001 Frescomar, a Cape Verdean – Portuguese fish processing company became the first Cape Verdean company to be certified by the U.S. Food and Drug Administration and has changed its export strategy to focus on sales to the U.S. market under the African Growth and Opportunity Act (AGOA). It presently processes 16 tonnes of fish (25-30,000 cans) per day in one shift (FDA 2002). All together the Cape Verdean canneries have a processing capacity of about 7 – 8,000 tonnes per year and they employ about 400 persons. In Angola the national fleets land all their catches mainly for national consumption. Foreign fleets land 21,000 tonnes, e.g. 2/3 of their catches. Thus, about 94% of the fish captured is landed in Angola. Most of the fish caught is sold on the national market, as per capita demand of fish is high and not fully satisfied. Fish consumption is on average 16 kg per person per annum: 40 kg in coastal areas, down to 10 kg or less in inland areas. The distribution of fish to the population has been strongly affected by the civil war. Most of the fish is sold fresh. Some 41,000 tonnes (25%) are deep frozen, mainly in Luanda; 6,000 tonnes are dried/salted (Benguela); 4,000 tonnes are processed as fishmeal, and 2,500 tonnes as fish oil (Namibe/Tombua). Less than 1,000 tonnes are canned. Export of fish represents only 5% of total landings (Table 14) and the main item is deep-water shrimp sold to Spain.
Table 14: Fish exports from Angola (million USD) 1995-1999 (SADC 2002).
Years 1995 1996 1997 1998 1999 Exports 24.0 20.3 16.5 20.0 23.8
Some high quality frozen fish and lobsters from the artisanal fishery are processed and exported. For these products marketing and trade are hampered by both war and lack of consistent quality control. There is a recent growing trend for fishmeal and oil exports. The total export value averaged 24 million USD in 1999. Some progress was achieved in 1999 with the publication of the official documents related to quality control requirements. Nevertheless, the last visit by EU inspectors in January 2000 concluded that the competent authority was not sufficiently trained and equipped to comply with the EU quality control requirements. Thus, the exports from
18UNU-Fisheries Training Programme

Martins
the national sector are limited to whole or gutted frozen products. This situation will be maintained for a while considering the limited progress that has been made. The contribution of fisheries products to the Gross Domestic Product (GDP) was 4% in 1999 (SADC 2002). 5.1 Market price According to the government objectives the catches effectuated in Cape Verde and Senegal‘s EEZ should be sold to the national canneries in order to provide them with the raw material they need to continue to be able to guarantee job posts. The catches will be sold immediately after catching in the nearest market at best price. The best price for tuna and tuna like species is offered in Abidjan but for quantities of over 300 tonnes (Table 15). Sailing from Cape Verde or Senegal to land in Abidjan would imply extra costs that would not be covered by the difference in price between Senegal and Abidjan. So all the fish caught in Cape Verde and Senegal or Angola should be preserved in ice and sold in Dakar and Angola respectively for canning and local consumption.
Table 15: Price / ton in Euros for different species in different markets (INDP 2002).
SPECIES Tuna and tunalike Small pelagic MARKETS Yellowfin Bigeye Skipjack H. Mackerel Pilchard
Demersal Species
CAPE VERDE 680 636 345 230 450 1,360 DAKAR 710 1,080 410 320 450 - ANGOLA - - - 320 - 1,450 ABIDJAN 1,418 890 749 - - -
6 PROFITABILITY OF THE DIFFERENT SCENARIOS The profitability of the fishing operation depends on the income and total costs. The operation costs are divided into fixed and variable costs. The conditions of the investment are presented in Table 16. For each scenario the income is calculated according to the number of fishing days and the catch value per month in euros (Appendix 2, 3 and 4). The prices per ton are estimated as averages from recent years.
Table 16: Conditions of investment.
Total Investment 12,370,000 euros Loan – 60% 7,422,000 euros Interest rate 7% Equity – 40% 4,948,000 euros Expected rate of return 15% Weighted average cost of capital (WACC) 10.2%
The net profit is calculated as the difference between the contribution margin and fixed cost before interest and tax for the whole fleet (Appendix 2, 3 and 4).
19UNU-Fisheries Training Programme

Martins
Net profit before tax increases at the end of the considered period by selling the fleet for 20% of initial value. Net profit after interest increases throughout the period. The net present value is the difference between the total present value and the initial investment (Table 17 and Appendixes 5, 6 and 7). The present value is the value today of a future payment or series of payments discounted at the appropriate discount rate. It is calculated according to the following equation:
PV = NP / (1 + IRR). N
Where: PV is the present value, NP is net profit after interest and tax; IRR is the internal rate of return and N is the number of years.
Table 17: Operating profit and present value.
CAPE VERDE (in euros)
SENEGAL (in euros)
ANGOLA (in euros)
Operating profit before interest 1,048,451 2,339,242 3,590,572 Initial investment 12,380,000 12,380,000 12,380,000 Net present value 17,350,606 24,632,388 41,465,157 IRR 4.6% 22.8% 33.4% IRR of equity 1% 46% 72%
6.1 Loan amortization schedule This schedule shows how the loan will be repaid. It gives the required payment each year and a breakdown of the payment showing how much the interest is and the repayment of principal (Table 18).
Table 18: Loan amortization schedule.
Year Loan Payment Interest Repayment Remaining
amount (in euros)
of principal (in euros)
balance (in euros)
1 7,422,000 814,896 519,540 295,356 7,126,644 2 7,126,644 814,896 498,865 316,031 6,810,614 3 6,810,614 814,896 476,743 338,153 6,472,461 4 6,472,461 814,896 453,072 361,823 6,110,638 5 6,110,638 814,896 427,745 387,151 5,723,486 6 5,723,486 814,896 400,644 414,252 5,309,235 7 5,309,235 814,896 371,646 443,249 4,865,986 8 4,865,986 814,896 340,619 474,277 4,391,709 9 4,391,709 814,896 307,420 507,476 3,884,233 10 3,884,233 814,896 271,896 542,999 3,341,233 11 3,341,233 814,896 233,886 581,009 2,760,224 12 2,760,224 814,896 193,216 621,680 2,138,544 13 2,138,544 814,896 149,698 665,198 1,473,346 14 1,473,346 814,896 103,134 711,761 761,585 15 761,585 814,896 53,311 761,585 0 Total 8,148,957 4,068,190 4,080,767
20UNU-Fisheries Training Programme
Martins
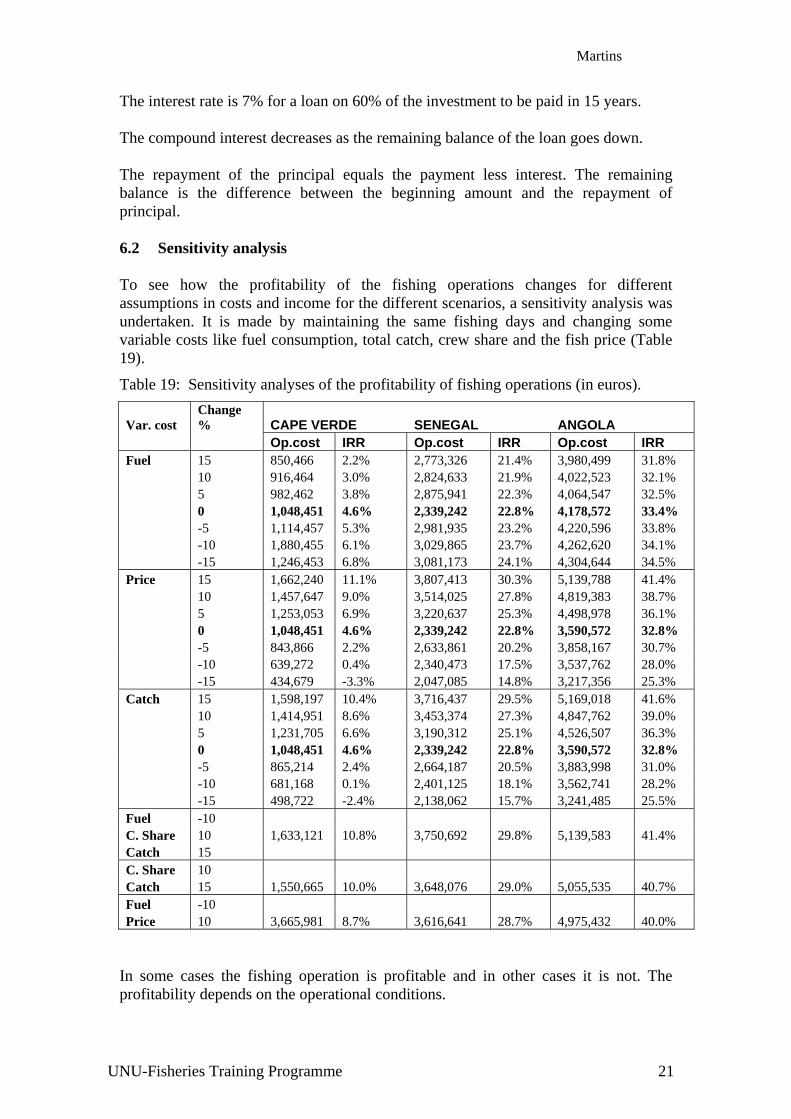
The interest rate is 7% for a loan on 60% of the investment to be paid in 15 years. The compound interest decreases as the remaining balance of the loan goes down. The repayment of the principal equals the payment less interest. The remaining balance is the difference between the beginning amount and the repayment of principal. 6.2 Sensitivity analysis To see how the profitability of the fishing operations changes for different assumptions in costs and income for the different scenarios, a sensitivity analysis was undertaken. It is made by maintaining the same fishing days and changing some variable costs like fuel consumption, total catch, crew share and the fish price (Table 19).
Table 19: Sensitivity analyses of the profitability of fishing operations (in euros).
Var. cost Change % CAPE VERDE SENEGAL ANGOLA
Op.cost IRR Op.cost IRR Op.cost IRR Fuel 15 850,466 2.2% 2,773,326 21.4% 3,980,499 31.8% 10 916,464 3.0% 2,824,633 21.9% 4,022,523 32.1% 5 982,462 3.8% 2,875,941 22.3% 4,064,547 32.5% 0 1,048,451 4.6% 2,339,242 22.8% 4,178,572 33.4% -5 1,114,457 5.3% 2,981,935 23.2% 4,220,596 33.8% -10 1,880,455 6.1% 3,029,865 23.7% 4,262,620 34.1% -15 1,246,453 6.8% 3,081,173 24.1% 4,304,644 34.5% Price 15 1,662,240 11.1% 3,807,413 30.3% 5,139,788 41.4% 10 1,457,647 9.0% 3,514,025 27.8% 4,819,383 38.7% 5 1,253,053 6.9% 3,220,637 25.3% 4,498,978 36.1% 0 1,048,451 4.6% 2,339,242 22.8% 3,590,572 32.8% -5 843,866 2.2% 2,633,861 20.2% 3,858,167 30.7% -10 639,272 0.4% 2,340,473 17.5% 3,537,762 28.0% -15 434,679 -3.3% 2,047,085 14.8% 3,217,356 25.3% Catch 15 1,598,197 10.4% 3,716,437 29.5% 5,169,018 41.6% 10 1,414,951 8.6% 3,453,374 27.3% 4,847,762 39.0% 5 1,231,705 6.6% 3,190,312 25.1% 4,526,507 36.3% 0 1,048,451 4.6% 2,339,242 22.8% 3,590,572 32.8% -5 865,214 2.4% 2,664,187 20.5% 3,883,998 31.0% -10 681,168 0.1% 2,401,125 18.1% 3,562,741 28.2% -15 498,722 -2.4% 2,138,062 15.7% 3,241,485 25.5% Fuel -10 C. Share 10 1,633,121 10.8% 3,750,692 29.8% 5,139,583 41.4% Catch 15 C. Share 10 Catch 15 1,550,665 10.0% 3,648,076 29.0% 5,055,535 40.7% Fuel -10 Price 10 3,665,981 8.7% 3,616,641 28.7% 4,975,432 40.0%
In some cases the fishing operation is profitable and in other cases it is not. The profitability depends on the operational conditions.
21UNU-Fisheries Training Programme

Martins
Profitability is most affected by the catch and price of the catch. Since both are likely to fluctuate, it is important that the foundation of the company is solid so it can ride out periods of unfavourable conditions. Although fuel is the main consumption in it doesn’t affect the profitability much even in Cape Verde, where fuel prices are higher, except when associated with the fish price. According to Table 19, the fleet operation in the Cape Verde scenario, as described in Appendix 2 is unprofitable. If fuel price goes down 10% and crew share is increased by 10% as an incentive to improve catch to 15%, the IRR is improved to 10.8%. In the Senegal and Angola scenarios (Appendix 3 and 4) the fishing operation is profitable. The profitability improves when the fish price and catch rise or fuel price decreases. In the Senegal scenario if the price increases by 15% the IRR will rise by 33%. In the Angola scenario the fishing operation is still profitable even if the fuel price goes up by 15% or if the catch or price goes down 15%.
22UNU-Fisheries Training Programme

Martins
7 DISCUSSION Three different operation scenarios for the new fleet in Cape Verde have been considered: fishing for tuna in Cape Verde, small pelagic in Senegal or small pelagic and demersal species in Angola. The profitability of the Senegal and Angola scenarios is higher because the operating costs are lower and the catches are priced higher. This is mainly due to local fishing conditions and the demand for fish in the markets. At present, Dakar has three tuna processing plants with a total capacity of 50,000 tonnes per year. The lack of supply of fish is a major concern for these plants. On the west coast of Africa the most important pelagic markets for canneries are in Dakar (Senegal), Abidjan (Ivory Coast) and Tema (Ghana). Tuna prices are generally 10% higher in Dakar than on the international market, mainly because of the competition among the canneries to purchase raw materials (CDI-Partnership 2002). Most of the landings are for national consumption. Foreign fleets land 2/3 of their catches. Thus, about 94% of the fish captured is landed in Angola. Most of the fish caught is sold on the national market, as demand for fish is high and not fully satisfied (SADC 2002). In these scenarios the profitability can be improved by reducing the lost days in port resulting in more fishing days and higher catches. Fishing for tuna in Cape Verde is unprofitable mainly because expected catches are low, costs are high, lack of bait, inadequate fish handling and preservation and because of the natural conditions around the islands. The profitability depends mostly on the catch and price of fish at the market. When the price goes down by 10% the IRR is reduced by 91% and it increases by 87% when the catch is increased 10%. Educating and motivating the crew can improve profitability. Increasing the crew’s share should result in higher catches or and upgrading the quality of the fish landed will lead to higher price at the market. The latter should also end the E.U.‘s embargo. As an incentive to increase supplies in the Abidjan market, companies give a higher price for landings of over 300 tonnes of tuna.
23UNU-Fisheries Training Programme

Martins
8 CONCLUSION / RECOMMENDATION It is clear from the results of this study that it will be difficult for the government to fulfil its objectives by operating this new fleet and in the Cape Verde EEZ. The study shows that the most profitable scenario is to fish and land the fish in Angola where the IRR 33.4%. This is due to factors like better markets, lower cost and higher catches. Similarly, in the Senegal scenario the IRR is 22.8%, higher than in the Cape Verde scenario. On the other hand the study shows that the Cape Verde scenario is under the profitability requirements of 15% put forward in the introduction chapter. This can be traced to factors like high operating cost, low catches and low market price. The objectives put forward by the governments by operating these vessels were:
• To increase catches and landings. • To better utilise the production capacity of the processing plants, through the
furnishing of sufficient quantities of raw material. • To improve the social and economic conditions on the islands.
With unchanged conditions it is clear that these objectives will not be fulfilled. Hence it is clear that the government needs to change the conditions of operating the vessels or put less demand on the profitability of the vessel. It is clear that in the long run the government cannot encourage the fishing industry to operate a fishing fleet in an unprofitable way so the only real option for the government is to either in some way make the operation of the fleet profitable or operate it somewhere else and abandon the original objectives. Improvements in profitability can be made in the Cape Verde scenario by changing the actual fishing conditions thus increasing the landings and selling at a higher price. The best market for Cape Verdean fisheries is West Africa Due to these conclusions the study would recommend operating the new fleet in Angola. However, taking into account the objectives of improving the social and economic conditions on the islands and furnishing sufficient quantities of raw material to the processing plants set by the government, it should be recommended to operate the fleet in Cape Verde under the following conditions to overcome the actual situation:
• To change the compensation system by using incentives to encourage higher catches up to 20%.
• To improve fish handling and processing in order to end the E.U.´s embargo and so have better marketing options and get prices at least 15% higher.
24UNU-Fisheries Training Programme

Martins
ACKNOWLEDGEMENTS Creating a project is never an author’s own individual effort. It is for me a great pleasure to thank the staff of the United Nations University Mr. Tumi Tómasson and Mr. Þor Ásgeirsson for their valuable comments, assistance and reviews, and Mrs. Sigridur Ingvarsdottir for her friendly and always useful support. I also would like to thank the supervisor of the project Mr. Ögmundur Knútsson. Many thanks to Mr. Arnljótur Bjarki Bergsson for his camaraderie and useful help. I will always be indebted to Professor Helgi Gestsson for his warm-hearted help and constructive comments. I would like to express my thanks to Dr. Eyjólfur Guðmundsson for his valuable comments and support. My thanks and appreciation to Professor Páll Jensson for his helpful co-operation. My thanks to my friends at INDP for providing me with the necessary information for this project. Finally, very special thanks to the Cape Verdean community for their familial support that made me feel at home in Akureyri.
25UNU-Fisheries Training Programme

Martins
REFERENCES Almada, D. J. M. 1992. Estudo da pescaria da lagosta rosa Palinurus charlestoni do arquipélago de Cabo Verde. University of Algarve. Cadima, E. 1996. Investigacao e gestao pesqueiras. Palestra proferida National Institute for Fisheries Development (INDP), Cape Verde 1996. Caramelo et Carvalho M. E., 1996. Avaliacao do estado do manancial de cavala preta em Cabo Verde. Report. National Institute for Fisheries Development (INDP), Cape Verde 1996. CDI- Partnership, 2002. Senegal + tuna fishing http://europa.eu. Eide, A. Chantre J.et Alfama P. 1996. A bio-economic stock assessment of the pink spiny lobster on the continental shelf of Cape Verde. Report. National Institute for Fisheries Development (INDP), Cape Verde 1996. FAO, 1990. Guia prático do pescador. Editamar, Portugal FAO, 1997. Review of the state of the world fishery resources, Rome 2000. FAO, 2000. The State of the World Fisheries and Aquaculture, Sofia 2000 Fouére, J.1981. Propositions visant à accroître les exportations des langoustes vivantes de la république du Cap Vert. Rapport FAO. Governo de Cabo Verde, 2001. Programa do Governo para a VI Legislatura (2001-2005) http://www.governo.cv/Prog_Gov_2001_2005.pdf accessed November 2002. Hallier, J. P. 1996. Le potentiel thonier dans les îles du Cap Vert. Report. National Institute for Fisheries Development (INDP), Cape Verde 1996. INE, 2002. Evolucao do comercio externo 1993 1999. http://www.ine.cv/ accessed January 2003. INDP, 1997. Boletim estatistico no 7. Mindelo, Cabo Verde INDP, 1999.Boletim estatistico no 9. Mindelo, Cabo Verde INDP, 2000.Boletim estatistico no 10. Mindelo, Cabo Verde INDP, 2002. Pesca e Mercado Dezembro 2002. Mindelo, Cabo Verde Lopes, J.A. 2002. Estudo de viabilidade da Sociedade Anónima. Report. National Institute for Fisheries Development (INDP), Cape Verde 2002. Menezes, Pastor, Fernandes, 2001. Cruzeiro de investigacao dos recursos demersais de profundidade de Cabo Verde : Relatório preliminar. Universidade dos Acores 2001
26UNU-Fisheries Training Programme

Martins
Monteiro, V.M. 1998. Estado de conservacao dos recursos halieuticos em Cabo Verde. INDP Portal de Cabo Verde, 2002. http://www.portaldecaboverde.com Accessed November 2002. Postel, E. 1996. Langoustes de la zone intertropicale africaine Programa Do Governo Para A VI Legislatura (2001 - 2005). http://virtualcapeverde.net/news2/modules/Downloads/docs/prog_gov_2001_2005.pdf SADC, 2002. SADC Marine Fisheries &Resources Sector http://www.schoemans.com.na/sadc/country. Accessed November 2002. Thorsteinsson, V. 1995. Ground fish survey in the waters of Cape Verde 1994. Report. ICEIDA , Reykjavik.1995 World information, 2002. Country Profile http://www.worldinformation.com Accessed November 2002.
27UNU-Fisheries Training Programme

Martins
APPENDIX Appendix 1: Variable cost and sale price for the different scenarios (in Euro) CAPE VERDE YFT BET SJT Crew share per ton sales in Senegal 71 108 41 Salary per month 34.120 Fuel per sailing day 952 Fuel per fishing day 624 Lubricant per sailing day 143 Lubricant per fishing day 90 Food per month 1.851 Fishing gear % of revenue 1% Water per month 160 Ice per tonnes catch 22,7 22,7 22,7 Agency per fishing month 1.800 Communication per fishing month 1.310 Sale price per ton in Cape Verde 680 636 345 Expected sale price per ton in Senegal 710 1.080 406 SENAGAL Horse mackerel Pilchard Crew share per ton sales in Senegal 32 45 Salary per month 34.120 Fuel per sailing day 644 Fuel per fishing day 422 Lubricant per sailing day 87 Lubricant per fishing day 55 Food per month 1.851 Fishing gear % of revenue 1% Water per month 150 Ice per tonnes catch 10,2 10,2 Agency per fishing month 1.800 Communication per fishing month 1.310 Expected sale price per ton in Senegal 317 446 ANGOLA Horse mackerel Pilchard Crew share per ton sales in Angola. 30 144 Salary per month 34.120 Fuel per sailing day 644 Fuel per fishing day 422 Lubricant per sailing day 87 Lubricant per fishing day 55 Food per month 1.851 Fishing gear % of revenue 1% Water per month 150 Ice per tonnes catch 10,2 10,2 Agency per fishing month 1.800 Communication per fishing month 1.310 Expected sale price per ton in Angola 301 1.436
28UNU-Fisheries Training Programme

Martins
Jan Feb Mar Apr May June July Aug Sep Oct Nov Dec Tot.annualRevenueCatchYellowfin tons 0 0 24 24 24 30 30 21 27 33 42 24 279Bigeye tons 0 0 12 12 12 15 15 7 9 11 21 12 126Skipjack tons 0 0 4 4 4 5 5 42 54 66 7 4 195Fishing days 0 0 12 12 12 12 12 12 12 12 12 12 120Sailing days 0 0 6 6 6 6 6 6 6 6 6 6 60Catch per vessel 0 0 40 40 40 50 50 70 90 110 70 40 600Income per vessel 0 0 31.624 31.624 31.624 39.530 39.530 39.518 50.809 62.099 55.341 31.624 413.321Total revenue 0 0 316.236 316.236 316.236 395.295 395.295 395.178 508.086 620.994 553.413 316.236 4.133.205
Variable costsCrew share pr. ton 0 0 31.624 31.624 31.624 39.530 39.530 39.518 50.809 62.099 55.341 31.624 413.321Salary pr. month of fishing 0 0 34.120 34.120 34.120 34.120 34.120 34.120 34.120 34.120 34.120 34.120 341.200Fuel pr. day sailing 0 0 57.136 57.136 57.136 57.136 57.136 57.136 57.136 57.136 57.136 57.136 571.362Fuel pr. day fishing 0 0 74.860 74.860 74.860 74.860 74.860 74.860 74.860 74.860 74.860 74.860 748.596Lubricant pr day sailing 0 0 8.554 8.554 8.554 8.554 8.554 8.554 8.554 8.554 8.554 8.554 85.536Lubricant pr. day fishing 0 0 5.423 5.423 5.423 5.423 5.423 5.423 5.423 5.423 5.423 5.423 54.234Food pr. month fishing 0 0 1.851 1.851 1.851 1.851 1.851 1.851 1.851 1.851 1.851 1.851 18.510Fishing gear 1% of revenue 0 0 3.162 3.162 3.162 3.953 3.953 3.952 5.081 6.210 5.534 3.162 41.332Water pr. month fishing 0 0 160 160 160 160 160 160 160 160 160 160 1.600Ice pr. Tons of catch 0 0 909 909 909 1.136 1.136 1.591 2.045 2.500 1.591 909 13.635Agency pr. month fishing 0 0 1.800 1.800 1.800 1.800 1.800 1.800 1.800 1.800 1.800 1.800 18.000Comm. pr. month fishing 0 0 1.310 1.310 1.310 1.310 1.310 1.310 1.310 1.310 1.310 1.310 13.100Total Variable cost 0 0 220.909 220.909 220.909 229.833 229.833 230.274 243.149 256.023 247.680 220.909 2.320.426
Contribution margin 0 0 95.327 95.327 95.327 165.463 165.463 164.904 264.937 364.971 305.733 95.327 1.812.779Fixed costFixed cost 764.320Depreciation vessels 569.000Depreciation other 19.000Total fixed cost 1.352.320Total operation cost 3.672.746Operating profit 460.459
Apendix 2:Income, operation cost and profit in Cape Verde scenario in Euro
30UNU-Fisheries Training Programme

Martins
Jan Feb Mar Apr May June July Aug Sep Oct Nov Dec Tot.annualRevenueCatchHorse mackerel 0 11 11 11 13 13 14 14 14 13 12 11 137Pilchard 0 99 99 99 117 117 126 126 126 117 108 99 1.233Fishing days 0 16 16 16 16 16 16 16 16 16 16 16 176Sailing days 0 4 4 4 4 4 4 4 4 4 4 4 44Catch per vessel 0 110 110 110 130 130 140 140 140 130 120 110 1.370Income per vessel 0 47.589 47.589 47.589 56.242 56.242 60.568 60.568 60.568 56.242 51.916 47.589 592.703Total revenue 0 475.893 475.893 475.893 562.419 562.419 605.682 605.682 605.682 562.419 519.156 475.893 5.927.031
Variable costsCrew share pr. ton 0 47.589 47.589 47.589 56.242 56.242 60.568 60.568 60.568 56.242 51.916 47.589 592.703Salary pr. month of fishing 0 34.120 34.120 34.120 34.120 34.120 34.120 34.120 34.120 34.120 34.120 34.120 375.320Fuel pr. day sailing 0 25.767 25.767 25.767 25.767 25.767 25.767 25.767 25.767 25.767 25.767 25.767 283.439Fuel pr. day fishing 0 67.520 67.520 67.520 67.520 67.520 67.520 67.520 67.520 67.520 67.520 67.520 675.200Lubricant pr day sailing 0 3.485 3.485 3.485 3.485 3.485 3.485 3.485 3.485 3.485 3.485 3.485 31.363Lubricant pr. day fishing 0 2.210 2.210 2.210 2.210 2.210 2.210 2.210 2.210 2.210 2.210 2.210 24.306Food pr. month fishing 0 1.851 1.851 1.851 1.851 1.851 1.851 1.851 1.851 1.851 1.851 1.851 20.361Fishing gear 1% of revenue 0 4.759 4.759 4.759 5.624 5.624 6.057 6.057 6.057 5.624 5.192 4.759 59.270Water pr. month fishing 0 150 150 150 150 150 150 150 150 150 150 150 1.650Ice pr. Tons of catch 0 1.109 1.109 1.109 1.310 1.310 1.411 1.411 1.411 1.310 1.210 1.109 13.810Agency pr. month fishing 0 1.800 1.800 1.800 1.800 1.800 1.800 1.800 1.800 1.800 1.800 1.800 19.800Comm. pr. month fishing 0 1.310 1.310 1.310 1.310 1.310 1.310 1.310 1.310 1.310 1.310 1.310 14.410Total Variable cost 0 191.670 191.670 191.670 201.389 201.389 206.249 206.249 206.249 201.389 196.529 191.670 2.186.122
Contribution margin 0 284.223 284.223 284.223 361.030 361.030 399.433 399.433 399.433 361.030 322.627 284.223 3.740.909Fixed costFixed cost 813.660Depreciation vessels 569.000Depreciation other 19.000Total fixed cost 1.401.660Total operation cost 3.587.782Operating profit 2.339.249
Appendix3:Income, operation cost and profit in Senegal scenario in Euro
31UNU-Fisheries Training Programme

Martins
Jan Feb Mar Apr May June July Aug Sep Oct Nov Dec Tot.annualRevenueCatchHorse mackerel 60 60 55 50 50 45 0 40 45 55 60 60 580Demersal 40 40 35 30 30 30 0 30 35 35 35 40 380Fishing days 12 12 12 12 12 12 0 12 12 12 12 12 132Sailing days 4 4 4 4 4 4 0 4 4 4 4 4 44Catch per vessel 100 100 90 80 80 75 0 70 80 90 95 100 960Income per vessel 75.474 75.474 66.792 58.110 58.110 56.606 0 55.101 63.783 66.792 68.297 75.474 720.012Total revenue 754.740 754.740 667.920 581.100 581.100 566.055 0 551.010 637.830 667.920 682.965 754.740 7.200.120
Variable costsCrew share pr. ton 83.021 83.021 73.471 63.921 63.921 62.266 0 60.611 70.161 73.471 75.126 83.021 792.013Salary pr. month of fishing 34.120 34.120 34.120 34.120 34.120 34.120 0 34.120 34.120 34.120 34.120 34.120 375.320Fuel pr. day sailing 25.767 25.767 25.767 25.767 25.767 25.767 0 25.767 25.767 25.767 25.767 25.767 283.439Fuel pr. day fishing 50.640 50.640 50.640 50.640 50.640 50.640 0 50.640 50.640 50.640 50.640 50.640 506.400Lubricant pr day sailing 3.485 3.485 3.485 3.485 3.485 3.485 0 3.485 3.485 3.485 3.485 3.485 31.363Lubricant pr. day fishing 6.629 2.210 2.210 2.210 2.210 2.210 0 2.210 2.210 2.210 2.210 2.210 28.725Food pr. month fishing 1.851 1.851 1.851 1.851 1.851 1.851 0 1.851 1.851 1.851 1.851 1.851 20.361Fishing gear 1% of revenue 7.547 7.547 6.679 5.811 5.811 5.661 0 5.510 6.378 6.679 6.830 7.547 72.001Water pr. month fishing 150 150 150 150 150 150 0 150 150 150 150 150 1.650Ice pr. Tons of catch 1.008 1.008 907 806 806 756 0 706 806 907 958 1.008 9.677Agency pr. month fishing 1.800 1.800 1.800 1.800 1.800 1.800 0 1.800 1.800 1.800 1.800 1.800 19.800Comm. pr. month fishing 1.310 1.310 1.310 1.310 1.310 1.310 0 1.310 1.310 1.310 1.310 1.310 14.410Total Variable cost 217.329 212.909 202.390 191.871 191.871 190.015 0 188.159 198.679 202.390 204.246 212.909 2.212.769
Contribution margin 537.411 541.831 465.530 389.229 389.229 376.040 0 362.851 439.151 465.530 478.719 541.831 4.987.351Fixed costFixed cost 880.780Depreciation vessels 569.000Depreciation other 19.000Total fixed cost 1.468.780Total operation cost 3.681.549Operating profit 3.518.571
Appendix 4:Income, operation cost and profit in Angola scenario in Euro
32UNU-Fisheries Training Programme

Martins
Appendix 5: Operating profit and present value for the scenario Cape Verde Year
Operating profit before interest
Interest
Operating profit after interest
Present value
1 1.048.459 519.540 528.919 505.802 2 1.048.459 498.865 549.594 502.603 3 1.048.459 476.743 571.716 499.983 4 1.048.459 453.072 595.387 497.927 5 1.048.459 427.745 620.714 496.421 6 1.048.459 400.644 647.815 495.451 7 1.048.459 371.646 676.813 495.005 8 1.048.459 340.619 707.840 495.072 9 1.048.459 307.420 741.039 495.640 10 1.048.459 271.896 776.563 496.699 11 1.048.459 233.886 814.573 498.239 12 1.048.459 193.216 855.243 500.253 13 1.048.459 149.698 898.761 502.731 14 1.048.459 103.134 945.325 505.666 15 3.324.459 53.311 3.271.148 1.673.304 Total 18.002.885 4.980.603 Initial investment -12.370.000 Net present value 17.350.603 IRR 5% IRR EQ 1%
Appendix 6: Operating profit and present value for the scenario Senegal
Year
Operating profit before interest
Interest
Operating profit after interest
Present value
1 2.339.249 519.540 1.819.709 1.525.322 2 2.339.249 498.865 1.840.384 1.293.086 3 2.339.249 476.743 1.862.506 1.096.924 4 2.339.249 453.072 1.886.177 931.152 5 2.339.249 427.745 1.911.504 790.994 6 2.339.249 400.644 1.938.605 672.429 7 2.339.249 371.646 1.967.603 572.077 8 2.339.249 340.619 1.998.630 487.090 9 2.339.249 307.420 2.031.829 415.072 10 2.339.249 271.896 2.067.353 354.006 11 2.339.249 233.886 2.105.363 302.191 12 2.339.249 193.216 2.146.033 258.197 13 2.339.249 149.698 2.189.551 220.815 14 2.339.249 103.134 2.236.115 189.029 15 4.615.249 53.311 4.561.938 323.253 Total 37.364.735 9.431.636 Initial investment -12.370.000 Net present value 21.801.636
IRR IRR EQ
18% 33%
33UNU-Fisheries Training Programme

Martins
Appendix 7 : Operating profit, present value and IRR – Angola scenario Year Operating profit Interest Operating profit Present value before interest after interest 1 3.590.572 519.540 3.071.032 2.936.811 2 3.590.572 498.865 3.091.707 2.827.363 3 3.590.572 476.743 3.113.829 2.723.138 4 3.590.572 453.072 3.137.500 2.623.918 5 3.590.572 427.745 3.162.827 2.529.494 6 3.590.572 400.644 3.189.928 2.439.668 7 3.590.572 371.646 3.218.926 2.354.249 8 3.590.572 340.619 3.249.953 2.273.056 9 3.590.572 307.420 3.283.152 2.195.916 10 3.590.572 271.896 3.318.676 2.122.664 11 3.590.572 233.886 3.356.686 2.053.141 12 3.590.572 193.216 3.397.356 1.987.196 13 3.590.572 149.698 3.440.874 1.924.687 14 3.590.572 103.134 3.487.438 1.865.475 15 5.866.572 53.311 5.813.261 2.973.682 Total 56.134.580 25.026.279 Initial investment -12.370.000 Net present value 37.396.279 IRR 28% IRR EQ 61%
34UNU-Fisheries Training Programme