management of young teak plantations in panama - o_mi_martin_delgado_d...carlos mantero, udelar...
TRANSCRIPT

María Inés León RadíoDaiana Martín DelgadoSupervisors: Urban Nilsson, SLU Southern Sweden Forest Research Centre Carlos Mantero, UDELAR Universidad de la república Uruguay
Management of young teak plantations in Panama- Effect of pruning and thinning
Swedish University of Agricultural Sciences Master Thesis no. 229Southern Swedish Forest Research CentreAlnarp 2014


Swedish University of Agricultural Sciences Master Thesis no. 229Southern Swedish Forest Research CentreAlnarp 2014
María Inés León RadíoDaiana Martín DelgadoSupervisors: Urban Nilsson, SLU Southern Sweden Forest Research Centre Carlos Mantero, UDELAR Universidad de la república UruguayExaminer: Eric Agestam
Management of young teak plantations in Panama- Effect of pruning and thinning
MSc Thesis in Forest Management – Euroforester Master Program SM001,Advanced level (A2E), SLU course code EX0448, 60 ECTS


ABSTRACT
On high quality wood species, thinning and pruning are compulsory management that must be done not only in early stages but also often during later development of the plantation in order to improve wood quality and growth of individual high-quality trees. In this thesis two trials were carried out to determine the adequate intensities of first thinning and pruning in a teak plantation in order to find the optimum early management to reach the best growth in yield and quality terms. In trial 1 pruning at 3 and 5 metres was combined with a thinning of the 35 % of the initial number of trees, 1111 tree per ha, which meant 15% removal of basal area. In trial 2 four thinning intensities were analyzed: 0, 25, 35, 45 % of the initial number of trees (15, 20 and 30 % of basal area). The variables observed in the different treatments after six months, were analysed using the measurements of diameter, height and form factor. With this data, the increment of height, diameter, basal area and volume according each treatment were calculated. The measured stem-volumes were compared with stem-volume estimated by a function developed by Diego Pérez and Markku Kaninnen, 2003, for teak plantations in Costa Rica that uses only diameter at breast height as independent variable. It was found that this function for teak stem volume can be used for calculating teak wood volume in the Darién region of Panama. Keywords: teak, Tectona grandis, Panama, pruning, thinning, productivity, quality timber.
3

ACKNOWLEDGEMENTS
We would like to thank to all the people that somehow collaborate with us to do this thesis. Professor Carlos Mantero, UDELAR, for his knowledge, constant support and time dedicated to us. Professor Urban Nilsson, SLU, for his time and for giving us the opportunity to carry out this thesis. Diego Pérez for all the given information. Gerardo Medina, Forwood Panamá CEO, for receiving us in Panamá and provide the tools and the people that helped us to set the trials. Timo Lehtonen, Forwood CEO. Jorge Franco for helping in the statistical analysis. Very special thanks to Andrés, José, Joselín, Eleuterio and all the people from Forwood Panamá that helped during our work in the plantations. Thanks very much to our families for their loving and unconditional support.
4

PREFACE
The thesis presented in this manuscript was done in cooperation between Daiana Martín and María Inés León. Two trials were set in order to test different silvicultural managements for Tectona grandis in Panamá. Daiana was mainly responsible for Trial 1, in which different prune height and thinning intensities were tried and María for Trial 2, where different thinning intensities were tested. For each trial a discussion about the results was wrote by corresponding author. The authors worked together in the field work and in the written parts: introduction, literature review, methodology, conclusions and recommendations.
5
CONTENTS
1. INTRODUCTION ................................................................................. 11
2. LITERATURE REVIEW ...................................................................... 13 2.1. The country: Panama ......................................................................................... 13
2.2. The Darién province .......................................................................................... 15
2.3. Species characteristics Tectona grandis(L.f.) .................................................... 19
2.3.1. Taxonomy classification ..................................................................................... 19
2.3.2. Natural distribution ............................................................................................. 19
2.3.3. Bio-ecological requirements and growth ............................................................ 20
2.3.4. Climate, temperature, rainfall ............................................................................. 20
2.3.5. Edaphic factors ................................................................................................... 21
2.3.6. Factors on stand level ......................................................................................... 23
2.3.7. Mycorrhiza ......................................................................................................... 23
2.3.8. Propagation material ........................................................................................... 23
2.3.9. Pests and diseases in the place of origin and in Central America ...................... 24
2.4. Quality of teak plantations vs. natural teak ....................................................... 33
2.5. Teak market ....................................................................................................... 35
2.6. Productivity ....................................................................................................... 39
2.6.1. Rotation length ................................................................................................... 39
2.6.2. Annual Volume increments ................................................................................ 40
2.6.3. Teak growth in Panama ...................................................................................... 42
2.6.4. Site index ............................................................................................................ 45
2.6.5. Site quality and wood production ....................................................................... 46
2.6.6. Equations to predict total and commercial volume. ........................................... 47
2.7. Teak management .............................................................................................. 49
2.7.1. Pruning ............................................................................................................... 49
2.7.2. Criteria for starting to prune ............................................................................... 51
2.7.3. Pruning frequency .............................................................................................. 51
2.7.4. Time of the year for pruning............................................................................... 52
2.7.5. Sprouts removal .................................................................................................. 52
2.7.6. Thinning ............................................................................................................. 55
2.8. Forwood work procedure................................................................................... 61
2.8.1. Land selection ..................................................................................................... 61
2.8.2. Land preparation ................................................................................................. 61
6

2.8.3. From seed to plant .............................................................................................. 62
2.8.4. Planting ............................................................................................................... 63
2.8.5. Management ....................................................................................................... 64
2.8.6. Thinning ............................................................................................................. 64
2.8.7. Final felling ........................................................................................................ 64
3. MATERIALS AND METHODS .......................................................... 65 3.1 Stand management before the experiments installation ..................................... 65
3.2 Work in the field ................................................................................................. 66
3.2.1 Edaphic characterization of the trials site ............................................................ 66
3.2.2. Trial 1: Pruning and first thinning ...................................................................... 71
3.2.3. Trial 2: Different intensities of first thinning ..................................................... 72
3.2.4. Trials design ....................................................................................................... 72
3.2.5. Measurements ..................................................................................................... 73
3.2.6. Criteria for thinning decision .............................................................................. 74
3.2.7. Stem damages characterization .......................................................................... 76
3.3 Calculations ........................................................................................................ 78
3.3.1 Form Factor ......................................................................................................... 78
3.3.2 Tree growth increment......................................................................................... 78
3.3.3 Volume prediction model .................................................................................... 78
3.4 Statistics analysis ................................................................................................ 79
4. RESULTS .............................................................................................. 80 4.1 Trial 1. Pruning and first thinning ..................................................................... 80
4.1.1. Pruning effect on tree height, diameter and volume increment .......................... 80
4.1.2 Mean annual increment ....................................................................................... 81
4.2. Trial 2. Different first thinning intensities ......................................................... 82
4.2.1. Effect of treatments for diameter, height, volume increment per tree and mean annual increment ........................................................................................................ 82
4.2.2 Mean annual increment ....................................................................................... 86
4.2.3. Stem characterization ......................................................................................... 86
4.3. Volume prediction model .................................................................................. 88
5. DISCUSSION ....................................................................................... 89
6. CONCLUSIONS AND RECOMMENDATIONS ............................... 92
7. REFERENCES ...................................................................................... 95
8. APPENDIX ......................................................................................... 100
7

FIGURES
Figure 1. Panama political map, 1995. ................................................................................ 13 Figure 2. Darién province. ................................................................................................... 15 Figure 3. Average precipitation and temperatura, period 1999-2008.................................. 17 Figure 4. Teak natural distribution. ..................................................................................... 19 Figure 5. Teak leaves eaten by Radopterus sp. in Darién, Panama. October 2009. ............ 28 Figure 6. Characteristic damage caused by Walteraniella sp. in Tectona grandis leaves.. 28 Figure 7. Tectona grandis multiple canker caused by Botryosphaeria sp. .......................... 29 Figure 8. Insect holes and fungus on teak stem, 6 months after thinning in ....................... 31 Figure 9. Termites “Comején”............................................................................................. 32 Figure 10. Termites on tree stem. ........................................................................................ 32 Figure 11. Canker. ............................................................................................................... 33 Figure 12. Prices (US$ per m3) of natural forest and plantation teak logs. ......................... 38 Figure 13. Sawing for quality in small teak logs . ............................................................... 39 Figure 14. Distribution of the teak plots. ............................................................................. 43 Figure 15. Relation between age and MAI in dbh (cm/year). ............................................. 44 Figure 16. Teak total volume tendency per hectare according to age. ................................ 44 Figure 17. Teak tendency for Site Index in meters according to the age of the evaluated plantations. ........................................................................................................................... 45 Figure 18. Three years old plantation. ................................................................................. 49 Figure 19. Early pruning keeps knots in a central core, allowing for the production of clear wood outside. .............................................................................................................. 51 Figure 20. Sprouts in 1 year old teak plantation. ................................................................. 53 Figure 21. Prune scar. .......................................................................................................... 54 Figure 22. April 2010, 3 years old teak plantation without thinning................................... 56 Figure 23. April 2010, 3 years old teak plantation with 45 % of thinned trees. .................. 57 Figure 24. April 2010, 17 years old teak plantation without management. ....................... 58 Figure 25. Epicormic branches in 3 years old plantation. ................................................... 59 Figure 26. Seedlings ready to be planted. ............................................................................ 62 Figure 27. Seedling root system. ......................................................................................... 62 Figure 28. Manual planting. ................................................................................................ 63 Figure 29. Chemical weed control. ...................................................................................... 63 Figure 30. Boles from first thinning. ................................................................................... 64 Figure 31. Re-forestation projects in Panama. Trial location. ............................................. 65 Figure 32. Pit Nº1 October 2009, Pit N°1 April 2010, dry season. .................................... 67 Figure 33. Pit N°2. October 2009. ....................................................................................... 68 Figure 34. Pit Nº3 October 2010 ......................................................................................... 69 Figure 35. Pit Nº3, April 2011 ............................................................................................. 69 Figure 36. Plot design. ......................................................................................................... 73 Figure 37. DBH with calliper. ............................................................................................. 73 Figure 38. Plot nº 8 (P8). First file (F1), tree Nº 1. ............................................................. 74 Figure 39. October 2009, blue marks in trees to be removed Nº46 and 44. ........................ 75 Figure 40. Leaning tree. ....................................................................................................... 76 Figure 41. Tree Nº 23, crooked tree. ................................................................................... 77 Figure 42. Tree Nº 3, crooked in the upper part. ................................................................. 77 Figure 43. Box-plot diagram using volume increment per tree in trial 1. ........................... 81 Figure 44. Diameter frequency per treatment before and after thinning in trial 2. ............. 84 Figure 45. Box-plot diagram using volume increment per tree in trial 2. ........................... 85
8

Figure 46. Damage characterization after and before thinning. .......................................... 87 Figure 47. Adjustment between observed volume data in Darien province (Panama) and predicted volume using Diego Pérez and Markku Kaninnen volume model for teak in Costa Rica. ........................................................................................................................... 88 Figure 48. Four weel stuck in the mud. ............................................................................... 93 TABLES Table 1. Panama geographical and political data. ............................................................... 14 Table 2. Data about Darién Province................................................................................... 15 Table 3. Surface in hectares (ha) according to different land use. ...................................... 16 Table 4. Surface and distribution of soil categories (approx.) according to use capacity. .. 18 Table 5. Area with teak in the main origin countries. ......................................................... 20 Table 6. Bio-climatic considerations for planting teak in Costa Rica. ................................ 23 Table 7. Sustainable production capacity of teak plantations in the major tropical countries, 2005. ................................................................................................................... 36 Table 8. Myanmar log prices (natural forest logs). Teak logs, FOB. .................................. 37 Table 9. Teak growing facts in different countries. ............................................................. 41 Table 10. Performance of teak at Mata Air Station, Perlis, Malaysia. ................................ 41 Table 11. Yields for Tectona grandis in Guanacaste, Costa Rica for high, middle and low productivity sites. ......................................................................................................... 42 Table 12. Summary of the averages of Nº trees per hectare, MAI in Diameter, Total height, Basal area and Volume according age ranges in Panama. ...................................... 43 Table 13. Growth characterization according to different ranges. ...................................... 46 Table 14. MAI maximum and at 50 years rotation age in m3ha-1year-1 on best, average and poor site classes. ........................................................................................................... 46 Table 15. Models for estimation of total volume over and under bark for Tectona grandis in Costa Rica. ......................................................................................................... 48 Table 16. Models adjusted for estimating commercial volume (up to an arbitrary diameter or commercial height) over and under bark for Tectona grandis in Costa Rica. . 48 Table 17. Pruning schedule for 5 m logs, Trinidad Site Class 1. ........................................ 55 Table 18. Pruning schedule for two, 2.8 m logs, Trinidad Site Class 2. ............................. 55 Table 19. Site soil visual description Pit 1. ......................................................................... 67 Table 20. Laboratory Analysis Pit 1. ................................................................................... 67 Table 21. Visual soil description Pit 2. ................................................................................ 68 Table 22. Laboratory Analysis Pit 2. ................................................................................... 68 Table 23. Site soil visual description Pit Nº3. ..................................................................... 69 Table 24. Laboratory analysis Pit Nº3. ................................................................................ 69 Table 25. Summary table of each pit. .................................................................................. 70 Table 26. Topographic placement, thinning and pruning form of each plot. ...................... 71 Table 27. Percentage of removed trees according to the number of plot. ........................... 72 Table 28. Average height in October 2009 and April 2010 per diameter class. ................. 74 Table 29. Characterization of observed stem damages. ...................................................... 76 Table 30. Teak average diameter in centimetres before and after thinning, and increment according each treatment. .................................................................................................... 80
9

Table 31. Teak average height in meters before and after thinning, and increment according each treatment. .................................................................................................... 80 Table 32.Teak mean annual increment according each treatment....................................... 82 Table 33. Teak average diameter in centimetres before and after thinning, and increment according each treatment. .................................................................................................... 82 Table 34. Teak average height in meters before and after thinning, and increment according each treatment. .................................................................................................... 85 Table 35. Teak mean annual increment according each treatment...................................... 86 Table 36. Stem characterization observed frequency for the total number of trees before the thinning and six month after the thinning. ..................................................................... 86 Table 37. Trees ha-1 in different damage classes before and after thinning for the thinning treatments and the unthinned control (No thin). ................................................... 87 Table 38. Percentage of absent trees, average diameter and height before and after thinning and total volume at the beginning of the experiment according the number of plot. .................................................................................................................................... 100
10

1. INTRODUCTION
Fast growing forest species require a timely and intensive management schedule to obtain high yield, required log size and high quality timber. Besides the wood esthetic characteristics, sufficient size is an important quality criterion in sawmilling (Person, 1986 mentioned by Kanninen and Pérez, 2005). Tectona grandis is one of the main species being grown in the tropics, which combines two essential elements, productivity and high-quality timber. Teak occurs naturally in India, Myanmar, Laos and Thailand. The growing market for plantation timber favors teak plantations in the tropics in Asia, America (Brazil, Paraguay, Costa Rica, Colombia, Ecuador, El Salvador, Panama, Trinidad and Tobago and Venezuela), Africa (Côte d'Ivoire, Nigeria, Sierra Leona, Tanzania and Togo) and in the Pacific Area (Papua Nueva Guinea, Fiji and Salomon Islands); also as an experimental way in the north of Australia. The reduction in the supply of timber from natural forest and associated increases in price and the environmental concerns of consumers are the main driving forces that promote plantation timber in international markets (ITTO, 2009). In the past few years the forest sector in Latin America and in the Caribbean has increased its production and trade of plantation-based products. The loss of natural forest, the increased environmental regulation on natural resources, the enlargement of protected areas and protection policies have all affected wood production in natural forests (ITTO, 2009). The lack of appropriate forest management is often the cause for low plantations quality and qualitative levels of volume production for commercial and industrial wood (Gómez and Ugalde, 2006). The Forwood Group was founded in 1986 to work with a system of investment in forestry. Nowadays the company is focused on high value teak (Tectona grandis). The Group operates in Sweden and in Panama. The head office is located in Sweden. Since October 2008 the Ukrainian company Nordic Financial Group has joined the Group. Forwood was owned by approximately 500 shareholders in 2010. The teak plantations are established in two regions of Panama (Colón and Darién) and the operations are regulated through subsidiaries: investment company Forwood Management Group S.A., land and management company Forwood Forestry Panama S.A. and cultivation and timber company Forwood Production S.A. (Forwood Group, 2010). Forwood has 1218 ha of teak afforestation, of which 752 ha are situated in the Darién province distributed in 5 plantations (Forwood Group, 2010). An important feature that motivated Forwood for planting teak is that, at the moment, it is the only species of fine dark wood being planted massively, which means low competition in the market. Teak timber has very valuable qualities for outdoor constructions because of its natural resistance against pests and metal corrosion. The
11

design of the wood gives it a beautiful appearance, which makes it attractive for many wood products. Another reason is that the demand for quality timber in Asia (where teak is a native species) has increased markedly in the last years, which is directly proportional with the increase in the building activity. But the availability of the species in natural forest is decreasing and plantations are the answer to meet the demand. Plantations contribute to reduce the use of teak from natural forest (Forwood Group, 2010). Panama was chosen as cclimate conditions near the equator are similar to the ones in the countries from where teak is native which is perfect to obtain good growth and timber quality. Furthermore the Panama Canal offers an exceptional export advantage, reducing costs and time to reach different parts of the world (Forwood Group, 2010).
Aim of this thesis The aim of this thesis is to evaluate if there are differences in growth in a three years old teak stand, when different pruning and thinning treatments are applied, in order to determine the best management to favour the growth and quality of the plantation. To achieve this, two experiments were installed and measurements of height, dbh (diameter at breast high), stem form and visual analysis were taken before the start of the experiment and 6 months after it was installed. The experimental plots were installed in October 2009 in Panama in the Darien Region, in a field that belongs to the Forwood Group enterprise.
12

2. LITERATURE REVIEW
2.1. The country: Panama
Panama is located in Central America and may be considered as a link with South America. The country borders to the North with the Caribbean Sea, to the South with the Pacific Ocean, to the East with Colombia and to the West with Costa Rica. It is an isthmus of 80 km width in the narrowest section, where the Panama Canal is situated (Figure 1).
Figure 1. Panama political map, 1995. Source: Central Intelligence Agency (CIA). In Table 1 geographical and political data about the country is presented, as well as data about planted forest and surface occupied by teak plantations. Only 1.4% of the land suitable for forest is actually covered and teak is the main exotic species planted in Panama, representing 70% of the planted forest area. The climatic conditions are very influenced by the orography. The relief affects the temperature, which is lower with higher elevations. And also affects the atmospheric circulation of the region, modifying the rainfall regime. The climate has a big maritime influence because of the Atlantic and Pacific Oceans, which are the principal sources of humidity content in the air. A semi-permanent anticyclone (Mike Spartz) from the North Atlantic generates the trade winds from the northeast and these winds determine the climate of the country.
13

Table 1. Panama geographical and political data.
There exists a Zone of Intertropical Convergence (ZITC) where the trade winds confluence from both hemispheres (North and South). This zone moves following the apparent movement of the sun through the year. This migration of the ZITC from N to S produces the dry and rainy seasons, which characterize the mayor part of the territory. The temperatures are very stable, varying between 26ºC and 30ºC throughout the year. In the mountains the temperatures go down to 12 and 15ºC (ETESA, 2010).
Surface 7.820.000 ha
(PANNet, 2010)
Geographic coordinates 7°12'07'' and 9°38'46'' North latitude. 77º09'24'' and83°03'07'' West latitude
Capital Ciudad de Panama Political division 9 provinces (Bocas del Toro, Chiriquí, Cocle, Colón,
Darién, Herrera, Los Santos, Panama, Veraguas) and 5 indigenous regions: Emberá Wounaan, Kuna Yala, Madungandi, Ngöbe-Buglé, Wargandi
Population 3.5 million people (United Nations Population Division 2010, mentioned by ITTO 2011)
GDP per capita 5.615 US$ (2009) GDP Forestry 0.2% (2009, estimated value) Forest cover (ha) 3.251.000 (FAO, 2010) Natural forest cover (ha) 3.172.000 (FAO, 2010) Lost in forest cover 1990 – 2010
0.71% average per year (extracted from data, FAO 2010)
Land suitable for forest (ha)
5.700.000 (ANAM, SENADAF, 2001)
Planted forest (ha) 79000 (FAO,2010) Teak afforestation area (ha)
55.000 (FAO, 2010)
14

2.2. The Darién province
The province of Darién is situated next to Colombia, in the southern part of Panama (Figure 2).
Figure 2. Darién province. Source:www.vmapas.com/.../Mapa_Politico_Darien.jpg The population of Darien is over 45 thousand inhabitants which live in a total area of 1.695.500 hectare; half of the area is covered with forest. Teak afforestation is the main planted exotic tree species (Table 2). Table 2. Data about Darién Province.
Population (inhabitants) 45.325 (Contraloria General de la República de Panamá, 2008)
Surface (ha) 1.692.500
GDP agriculture, cattle and silviculture 26.5% (Contraloria General de la República de Panama, 2007)
Total forest cover (ha) 833.350
Planted forest (ha) 3.229 (ANAM, 2004)
Teak afforestation area (ha) 1.929 (Gómez and Ugalde, 2006)
15

More than half of the land in Darién is used for protection or reserve area and is in this land where most indigenous people live (Table 3). Table 3. Surface in hectares (ha) according to different land use.
Land use Ha % Mangles 33.688 2 Mix forest of Cuipo 478.250 28 Cativales 45.688 3 Dry mix palm forest 45.375 3 Swamps 20.188 1 Agricultural area 47.625 3 Protection area 301.250 18 Reserve area 665.138 40 Subtotal 1.637.200 97 Rivers 43.100 3 Total 1.680.300 100
Source: Organization of American States, 2010. The climate in Darién is humid and warm, however climatic variations exist in the zone due to the local topographic conditions. The absolute maximum temperature is 35.5ºC and the minimum 17.2ºC, average temperature fluctuates between 25ºC and 26ºC. The dry season last 3 or 4 month, from January to April and the rainy season from May to November. The rains are irregularly distributed along the year. Precipitation is copious in the mountain lands near to the Atlantic coast (3000 mm – 4000 mm) and increase in the Pacific mountains in the south-east of the region (4000 – 5000 mm). In the central area and to the south-west, precipitation decreases and fluctuates between 1700 - 2800 mm year-1 (OAS). In the closest climatic station to Darién, Garachiné, annual precipitation varied between 494 mm in 2002 to 2341 mm in 2007. The period of the maximum precipitations is from June to December and this part of the year is considered the “rainy season” (Figure 3).
16

Figure 3. Average precipitation and temperatura, period 1999-2008. Source: Elaborated with data given by Hidromet Panamá. Winds from the north-east and north-west are dominant in the end of December up to April in the major part of the region. From May to December, winds from the south are dominating as well as local winds originating from the sea, the valleys and the adjacent mountains (OAS, 2010). In this area the probability of hurricanes is between 0.1 and 0.9 hurricanes per year (Mendez, ____). Darién region presents four different physiographic landscapes: Alluvial landscape: The topography is flat and the soils originate from fresh fluvial sediments and marine sediments. The first ones run along the principal rivers and get new sediments because of floods that occur periodically. In contrast, the soils from marine or sediments form very poor drained lands (mangroves). Undulating plain landscape: The topography is slightly waved with slopes not steeper than 15%. This landscape can be found in the valleys of regional rivers. Hilly landscape: The landscape is dominated by hills and slopes. The hills were originated from the tectonic movements from the tertiary period and climate factors, mainly rainfall. Slopes vary between 15 and 50%. Mountain landscape: Two parallel mountain systems form the mountain landscape in the oriental region. The highest mountains are the Puna and Tacaruma with 1220 and 1585 m above sea level respectively. The mountain massif from the Pacific is represented by the hills of Majé and Cañazas in the occidental region. This disappears in
17

the wide estuary of the river Tuira and appears again in the northern sector of Darién (OAS, 2010). In Panama the soils are divided in seven categories from II to VIII according to their fertility. Limitations for agricultural activities and necessities for maintaining the quality and productivity of the lands, increase progressively from II to VIII. In a second group, these soil classes are combined in 4 categories that focus on the agricultural uses of the lands (Table 4). Table 4. Surface and distribution of soil categories (approx.) according to use capacity. Soil categories Surface % ha Appropriate for intensive crops and other uses (Classes II, III y IV)
6.9 116.381
Appropriate for permanent crops, grasses and forestry (Classes V y VI)
25.7 435.902
Marginal for agricultural use, generally suitable for forestry (Class VII)
35.6 596.094
Non appropriate for agricultural use or forestry (Class VIII) 29.1 488.823 Total 97.3 1.637.200
The class II is the best for annual crops like corn, rice, vegetables, yucca, peanut, watermelon, legumes and tropical fruit trees. These soils are Tropofluvent with flat topography. Class III, also with Tropofluvents, can be used for rice, corn, legumes, vegetables, plátano and banana, but is more prone to floods and erosion problems. In class IV, mango, marañón, mangotín, piña and other crops can be grown. These are formed by the groups Haplortex in the subclass Paleudol, Tropuldalf and Palendalf in subclass IVe. Class V presents slow permeability and imperfect drainage. One part of these lands belongs to the group Tropacuept. Class VI soils are susceptibles to high erosion due to steep slopes. Adding this factor to the low fertility, these lands are limited to perennial plants, like tropical fruit trees and cattle breeding in the lowest gradients. The soil groups in this class are Hapludol, Eutropept, Distropept, Cromustert Udico, Tropudulty Plintudalf. In class VII the topography can be steep to very steep, being prone to high erosion because of the heavy rains. Moreover in some parts it presents low permeability and poor drainage. The use of these lands is rational forestry exploitation. The soil groups in this class are Hapludol, Distropept, Eutropept, Tropudult and Tropical Fluvacuent. Class VIII is considered not appropriate for forestry or agricultural exploitation. These lands are found in the mountain area. The soil groups in this class are Hapludol, Eutropept, Lytic Troportent and Sulfacuent. These lands are highly susceptible to
18

erosion and are more suited to the protection of watersheds, which provides the maintenance of forests (OAS, 2010).
2.3. Species characteristics Tectona grandis(L.f.)
2.3.1. Taxonomy classification
Teak was previously believed to belong to the family Verbenaceae but recently scientists have questioned this classification based on the use of modern DNA-technique. Probably teak will soon be placed in the family of Labiatae (Teaknet, 2005, mentioned by Keonakhone, 2006).
2.3.2. Natural distribution
Teak growth naturally from approximately latitude 23 to 10 north in the south east of Asia, in an area that includes the majority of the peninsular India, most part of Myanmar (former Burma) and parts of Laos and Thailand (Weaver, 1993). It can be found at latitudes between 9º - 25º 30’ N and longitudes between 73º - 104º 30’ E. Teak in Indonesia is considered to be naturalized (Kadambi 1972, Siswamartana 1999, mentioned by Kobayashi et al. 1999) (Figure 4).
Figure 4. Teak natural distribution. Source: Weaver, 1993. It seems to have been introduced to Java, Indonesia, in the 14th century. There are references to plantations established in India in the early 1800s and in tropical America about 100 years later (Centeno, 1997). The area of the natural teak forests in India, Laos, Myanmar and Thailand totalize 27.9 million hectares (FAO, 1998), Table 5.
19

Table 5. Area with teak in the main origin countries.
According to FAO (2002), the first report on introduction of teak seed in Central America is from 1926, when it was planted in the Summit Botanical Garden of the former Channel Zone of Panama. The seed came from Colombo, probably from the Paranaeniya Botanical Garden. This provenance, that has been called Ceylon - Panama or Sri Lanka - Panama, gave way to teak plantations located in farms dedicated to the banana production of the Chiriquí Land Company. Furthermore, the Good Year Company, dedicated to establish rubber plantations, also planted teak. The shipment of seeds from the Summit Botanical Garden to eleven Central and South American countries and the Caribbean occurred during the period between 1936 and 1948. The United Fruit Company purchased the seeds in February of 1943. Records from the Botanical Garden indicate a second shipment to R.A. Nichols, at the IICA, Turrialba, in April of 1943. By 1967, the Forest Development Project in select zones directed by FAO/UNDP/ITCO used seeds from five places of provenance: Honduras, Panama, Trinidad and Tobago, Quepos (Costa Rica) and Nicoya (Costa Rica).
2.3.3. Bio-ecological requirements and growth
In order to determine whether a site is good or bad for teak plantations, Tanaka et al. 1998, mentioned by Keonakhone, 2006, claims that the following factors should be considered: climate, edaphic factors such as geology, topography and soil and factors on a plant community level such as light, moisture conditions, etc. The type and quality of seeds are also important: rate of growth and quality of teak from plantations are largely dependent on the type and quality of seeds (Centeno, 1997). The available information for teak requirements in Central America is mainly from Costa Rica, which is next to Panama. According to FAO 2002, most of the data of the bio-ecological requirements of teak in Central America comes from the experience and the studies done in Costa Rica and very little from Panama and El Salvador.
2.3.4. Climate, temperature, rainfall
Kaosa-ard (1981, mentioned by Keonakhone, 2006) gives values for optimal temperatures and rainfall for teak growth. Teak grows when the monthly minimum temperature is above 13°C and monthly maximum temperature is below 40°C. Optimal rainfall for teak ranges between 1250 and 3750 mm per year. For the production of high-quality timber the species requires a dry season of at least four months with less
Country Area with teak (thousand ha)
India 8.900 Laos 16 Myanmar 16.518 Thailand 2.500 Total 27.934
20

than 60 mm precipitation per month. Teak has proved to grow well in day temperatures ranging from 27 to 36°C and night temperatures ranging from 22 to 31°C. Another source for information about optimal climate for growth of teak is FAO 1998. In Central America, sites classified as highly productive have rainfalls higher than 2000 mm/year and the limits in temperature to be classified as good for growing teak are on average of 25 to 28 ºC (FAO, 1998). Outside of those temperatures, the species does not grow well. Teak grows well between rainfalls of 1250 and 2500 mm/year. The species requires a 3 to 5 months dry period per year (Ugalde, 1997 mentioned by FAO, 1998). Windy areas should be avoided for growing teak, as this species is prone to be affected by wind and storms (Brown and Pandey mentioned by FAO, 2000).
2.3.5. Edaphic factors
The first step to ensure the good development of a teak plantation is to choose the right site. Teak prefers moderately deep soils (>90 cm) well drained, medium textured, flat or gentle slope (Drechsel and Zech, 1994; Jha, 1999, mentioned by Alvarado, 2006). Best sites for teak are located at the base of mountains or in valleys. These sites allow plenty of space for root growth, and have high water and nutrient availability, with calcium content higher than 10 meq/100 ml of soil in the first stratum (Ugalde and Vásquez,1995). Sites with slopes steeper than 25% must be avoided due to the erosion associated with the foliar characteristics of the species; Miller, 1969, mentioned that due to the large leaf area, teak trees produce a strong shadow which does not allow the understory to develop. During the dry season, teak defoliates and when the rainy season starts, the absence of leaves in the crowns allows the heavy rains to impact on the soil through the decomposed leaves causing erosion. However, thinning may promote development of understory plants preventing soil erosion. According to Kaosa-ard (1981), teak can grow on a variety of soils. However, the quality of the biomass depends on the soil depth, structure, porosity, drainage and moisture-holding capacity. Teak develops best on volcanic substrata and on alluvial soils formed from various parent materials. The optimal soil pH for teak is between 6.5 and 7.5. Under 6 or above 8.5 the growth may be restricted. The calcium content of the soil is also an important factor. Calcium deficiency may result in stunted growth (Tewari, 1992 mentioned by Keonakhone, 2006). pH is one of the most important factor which limits teak distribution. Alvarado & Fallas (2004) demonstrated, in a study done in Costa Rica, the high sensitivity of teak to soil acidity saturation (% Al) since the annual height increment of the trees is severely reduced at values as low as 3% of acidity saturation. A similar effect was found when soil calcium saturation was below 68%, reflecting the need of teak for this element. Under these conditions, a 59% increment in growth was obtained when 1 kg CaCO3 per tree was applied and a 216% increment in tree height was attained when the same amount of lime plus 150 g of the fertilizer formula 14-22-15-4-5 (N-P2O5–K2O-MgO-S) per tree were added to a one year old plantation.
21

Alvarado et al. (2005) found in a study done near the Panama Canal, that the acidity saturation percentage and the Ca saturation percentage proved to be the most limiting factors for growth, which contributes to explain the condition related to the different growth classes. Optimal conditions were given when acidity saturation was less than 8% and when Ca saturation was more than 40%. This situation was even more evident with soils with pH <5.5. The effects of acidity in teak results in the presence of very short growth segments, internodes very close to the apical section, a general yellowing of the tips, which in extreme cases come to die. In addition, the lower leaf foliage presents necrotic at the edges and sometimes in full, effects associated with the low fertility of the soil that causes a deficiency of bases (Ca, Mg and K) in the leaves. In extreme cases it appears that the trees affected by acidity, can be affected more easily by opportunistic organisms. Studies for estimating the needs of liming and fertilization on teak in Brazil, consider that the soil must have a maximum of Al saturation of 10 %, at least 2.5 cmol (+) Ca + Mg dm -3, bases saturation of 65 % and pH = 6 (Olivera, 2003 mentioned by Alvarado and Fallas, 2004). In Oriental Africa values of interchange Al between 2.55 and 6.55 cmol (+) l -1 are high, meanwhile in other places it is advisable to maintain the saturation of Al in the soil under 8% (Expomadera and Coillte 2002, mentioned by Alvarado & Fallas, 2004). Another experiment shows that teak, irrespective of age, has a poor growth when pH in CaCl2 is lower than 4.3, while when pH is above 4.7 the growth is good; under these conditions soils have low values of interchangeable Ca, so it is advisable to leave the bark in the forest when the harvest is done (Zech and Dreschel, 1990 mentioned by Alvarado and Fallas, 2004). Zech and Drechsel, 1990, found in Venezuela that high content of Fe, Al and Mn in soil cause leaves deficiency of P, K, Mg, Zn. The same authors in East Africa found that in leaves the limiting elements were N, Ca, P, affected by excess of Al in the soil and found that a good reason to maintain organic matter in the soil is to correct these symptoms. However, little is known about tolerance of these nutrients (Paniagua and Rodriguez., ____). In Costa Rica it was found that the optimal conditions for planting teak considered a temperature between 25 - 28 ºC. The optimum rainfall varied from 900 - 3700 mm (approx.) with at least three dry month. Deep soil with high fertility and light texture without compaction promoted a good growth. The drainage should be good and winds could be a limiting condition (Table 6).
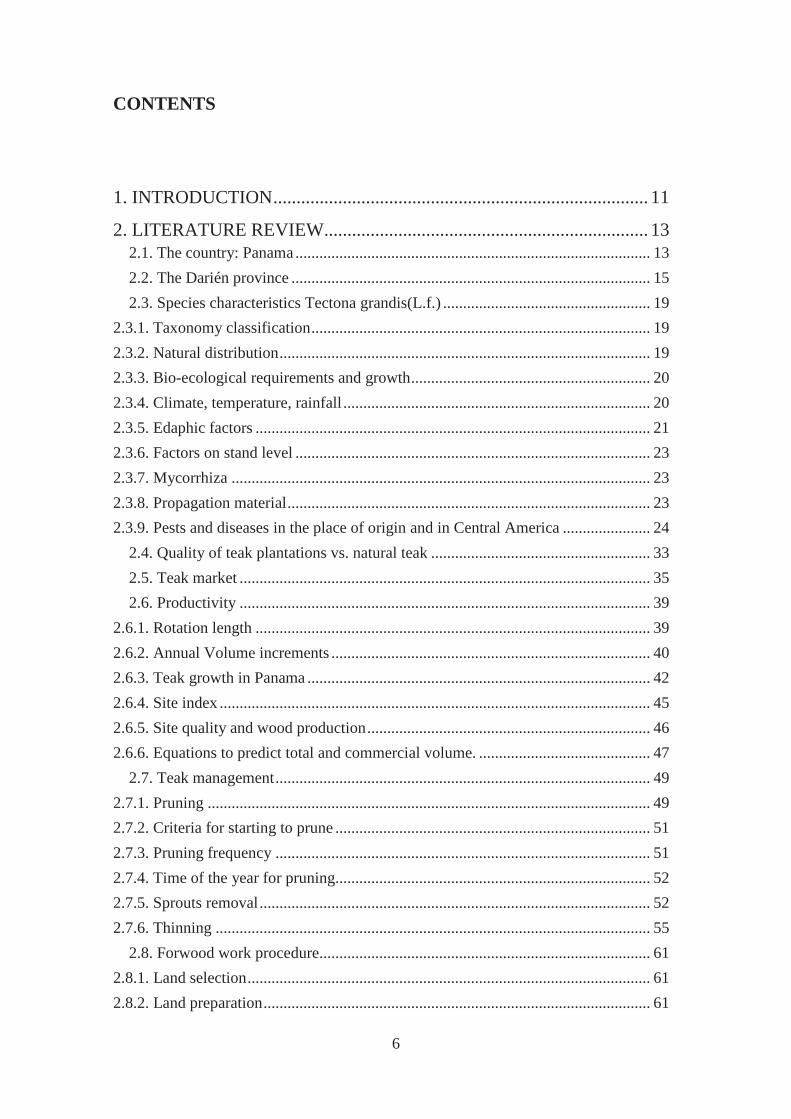
22
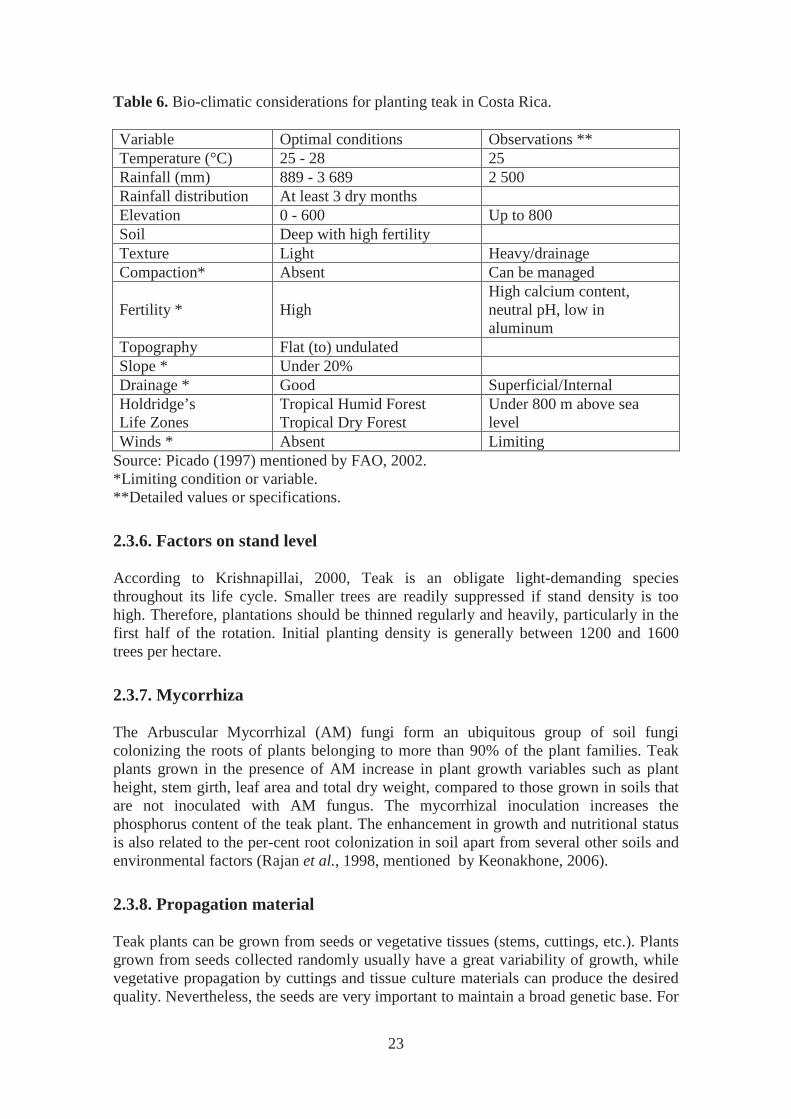
Table 6. Bio-climatic considerations for planting teak in Costa Rica. Variable Optimal conditions Observations ** Temperature (°C) 25 - 28 25 Rainfall (mm) 889 - 3 689 2 500 Rainfall distribution At least 3 dry months Elevation 0 - 600 Up to 800 Soil Deep with high fertility Texture Light Heavy/drainage Compaction* Absent Can be managed
Fertility * High High calcium content, neutral pH, low in aluminum
Topography Flat (to) undulated Slope * Under 20% Drainage * Good Superficial/Internal Holdridge’s Life Zones
Tropical Humid Forest Tropical Dry Forest
Under 800 m above sea level
Winds * Absent Limiting Source: Picado (1997) mentioned by FAO, 2002. *Limiting condition or variable. **Detailed values or specifications.
2.3.6. Factors on stand level
According to Krishnapillai, 2000, Teak is an obligate light-demanding species throughout its life cycle. Smaller trees are readily suppressed if stand density is too high. Therefore, plantations should be thinned regularly and heavily, particularly in the first half of the rotation. Initial planting density is generally between 1200 and 1600 trees per hectare.
2.3.7. Mycorrhiza
The Arbuscular Mycorrhizal (AM) fungi form an ubiquitous group of soil fungi colonizing the roots of plants belonging to more than 90% of the plant families. Teak plants grown in the presence of AM increase in plant growth variables such as plant height, stem girth, leaf area and total dry weight, compared to those grown in soils that are not inoculated with AM fungus. The mycorrhizal inoculation increases the phosphorus content of the teak plant. The enhancement in growth and nutritional status is also related to the per-cent root colonization in soil apart from several other soils and environmental factors (Rajan et al., 1998, mentioned by Keonakhone, 2006).
2.3.8. Propagation material
Teak plants can be grown from seeds or vegetative tissues (stems, cuttings, etc.). Plants grown from seeds collected randomly usually have a great variability of growth, while vegetative propagation by cuttings and tissue culture materials can produce the desired quality. Nevertheless, the seeds are very important to maintain a broad genetic base. For
23

reasonably uniform planting materials from seeds, seedling nurseries or clonal seed orchard are necessary to produce future trees with good quality (Krishnapillai, 2000). In Tectona the unit of dispersal, seed storage and reproduction is the fruit, sometimes called "seed" (FAO, 1987). The seed yield per tree is low (causing problems in relation to progeny testing and especially mass seed production in seed orchards). Furthermore, only a few seedlings are produced per 100 sown seeds in nurseries which add to the problems of low seed production. Also, controlled pollination has turned out to be difficult in teak (Kaosa-ard, 1998). Tectona grandis is one tropical species in which there is evidence that chemical dormancy caused by inhibitors in the pericarp may be more important than physical dormancy (FAO, 1987). For a good germination the seed must be treated. Repeated soaking of seeds in water during night followed by sun drying for two to three weeks is by far, the best method known for improving germination of teak seeds (KFRI, ____). Nowadays CATIE’s seed bank offers pre-treated seed that has the following advantages: Less weight and volume of transport which can save up to 30% in transportation costs Higher germination, up to 90% Increased number of fruits per kilogram, up to 1800 fruits Increased number of plants. Tiles per kilogram up to 2200 plants It does not require pre-treatment before sowing, thereby saving up to 15 days in production Germination times (6 to 20 days) More homogeneous in nursery plants The spectacular gains reported with clonal forestry overall and the low productivity in the Costarican plantations, motivated to the creation of the first Costarican tree improvement and gene conservation cooperative (GENFORES), directed by the Technological Institute of Costa Rica (Badilla and Murillo, 2004).
2.3.9. Pests and diseases in the place of origin and in Central America
About 180 insects in India were reported to feed on teak (Mohanadaset al., 1998). Species that cause major damage in plantations and natural stands in India include two species of defoliators (Hyblaea puera and Eutectona machaeralis) and two borers, one in saplings (Sahyadrassus malabaricus) and the other in standing trees (Cossus cadambae) (Mathew, 1990). H. puera larvae consume the entire leaf, leaving only the major veins. E. machaeralis larvae on the other hand, consume only the green layer of the leaves, leaving all the veins intact, this characteristic has earned for it the popular name, ‘skeletoniser’ (Chacko et al. 1985).
24

Hyblaea puera (Lepidoptera, Hyblaeidae) Hyblaea puera is distributed in the Oriental and Australian regions, in South Africa, parts of East Africa and West Indies (Beeson, 1941 and Browne, 1968 mentioned by Chacko et al., 1985). The teak defoliator, H. puera is recognised as the most serious pest of teak in India. Previous studies in the Kerala Forest Research Institute (Chacko et al., 1985) have demonstrated the enormous growth loss caused by this insect in teak plantations. It was shown that in 4 to 8 year old plantations, trees protected from defoliation by H. puera put forth a mean annual volume increment of 6.7 m3ha-1 compared to 3.7 m3ha-1 of unprotected trees (Mohanadas et al., 1994). The defoliation causes 40% loss of potential volume increment during the early part of the growth season (Chacko et al., 1985). Defoliation occurs in tender leaves and has a regular annual feature, with one or two waves of epidemic defoliations between late April and July, followed in some years by another lighter defoliation between August and October (Chacko et al. 1985). Outbreak populations of H. puera are highly aggregated and mobile. Because of this, parasitoids were not capable of regulating host numbers during outbreaks (Mohanadas et al., 1994). Generally, after one or two epidemics, the population declines due to leaf maturity, natural enemies and density dependent food depletion. Until the next flushing season, the population remains small and non-migratory, but active. Trees with mature leaves, escape from defoliation because they do not elicit egg-laying (Chacko et al. 1985).
Eutectona machaeralis. Synonyms: Pyrausta machaeralis, Hapalia machaeralis (Lepidoptera, Pyralidae). The teak skeletoniser E. machaeralis, which is usually active during the later part of the growth season, has little negative impact on teak growth. The main reasons are that the population is infrequent over years, generally of low intensity, and infection occur late in the season when the leaves are old and the rate of growth is low (Chacko et al.,1985). This species is distributed in the Indo-Malayan Region up to Australia (Beeson, 1941 and Browne, 1968 mentioned by Chacko et al., 1985). Normally the life-cycle is completed within a month, the exact duration depending primarily on temperature. There are 5 larval instars, feeding superficially to begin, later the larvae consume the leaf tissues between the network of veins, thereby skeletonising the leaves. The larvae generally feed on mature, tough leaves, unlike H. puera (Beeson, 1941 mentioned by Chacko et al., 1985).
Sahyadrassus malabaricus (Lepidoptera, Hepialidae). The family Hepialidae (called swift moths) is a primitive family of Lepidoptera, best developed in South America and Australasia (Mani, 1973 mentioned by Nair, 1982).
25

The larva bores into the stem of saplings and lives in a tunnel along the pith. The mouth of the tunnel is covered by a thick mat of wood particles spun together with silk, underneath which the larva feeds on the callus tissue that grows as a result of continuous browsing. The insect has an annual life cycle with most moths emerging in late April and early May. S. malabaricus is not a serious pest. As the larva feeds only on callus growth in the vicinity of the tunnel mouth, the damage caused is negligible. In rare instances, the stem is ring-barked, resulting in drying up of the sapling or the stem breaks off at the point weakened by feeding (Nair, 1982).
Trunk borer Cossus cadambae (Lepidoptera, Cossidae). C. cadambae belongs to the lepidopteran family Cossidae. Cossids are popularly known as goat moths (because of the characteristic odour produced by many members of this group) and carpenter worms (due to the larval habit of boring in the wood). All members of this family without exception are internal feeders inside the woody tissues of plants. There are two peak periods of moth emergence in May and in October. Eggs are laid in small crevices or depressions on the bark of teak trees, either on the main stem or on branches. The colour and sculpturation of the eggs match the surface of the bark rendering detection difficult. The natural enemies of this insect consist of 2 species of birds viz. The golden backed woodpecker (Dinopium benghalense) and an unidentified barbet, both predatory on the larvae, besides 6 species of microbial pathogens affecting various stages of this insect either in the laboratory or in the field. In the pathogenicity trials maximum larval mortality was observed in the case of treatment with the bacterium, Serratia marcescens (83.3%) followed by the fungi Aspergillus flavus and Paecilomyces fumosoroseus (57%) (Mathew, 1990).
Teak`s pests and diseases in Central America. In Costa Rica, 20 species of insects (48%), 18 species of pathogens, two species of vertebrates and one species of mistletoe (Lorathaceae family) were identified as pests on teak. The major impacts on teak are caused by Phomopsis sp., Pseudomonas sp., Hyblaea puera, Rhapdopterus sp., Walterianella sp., Nectria nauriticola, Botryodiplodia sp., Agrobacterium tumefaciens, Neoclytus cacicus, Phyllophaga spp. and “Teak decline” (Arguedas, 2004). The following pests and diseases were found in phytosanitary inspections in commercial plantations of T. grandis in Costa Rica, Guatemala and Panama.
Outbreaks burning (Phomopsis sp.). Outbreaks have been observed in trees from 6 to 24 months of age. The infection begins in apical meristem, young leaves turn dark brown, and then vanish. Apparently, in less
26

than five days the fungus fall along the cortical stem tissue, which initially acquires a brownish purple, then turns black. Sometimes the main veins of the leaves are also affected and necrosis can be observed (Macías et al. 2002, mentioned by Arguedas, 2004).
"Teak net" by Pseudomonas. Affected trees show a slight yellowing and flaccidity of the foliage, which then begins to become necrotic from the edges, until the entire leaf blade and die. In small trees (less than 1.5 m in height), the infection begins to affect also cortical stem tissue, resulting in the death of every individual. The radical system is totally deteriorated, the rootlets bark peels off easily and the thicker tissues become rotten. This disease is very important because it is a bacteria that kills the tree and may contaminate the soil. It has operated efficiently the removal of individuals with their roots from the plantation. The holes left are sprinkled with antibiotics as estreotomicina.
The skeletonizer Hyblaea puera. In Costa Rica, Hyblaea puera (Hyblaeidae, Lepidoptera) known worldwide as the teak "skeletonizer, has been producing since more or less 4 years significant defoliation on teak plantations during the dry season. Larvae fold and unite with silk the edge of the leaf with the leaf blade and make its home. From there it will come out to feed the rest of the film leaf leaving only the primary and secondary veins. If the attack is very severe, you can see up to 12 larvae per leaf and total defoliation, preferring the younger leaves (Fair 1986, Nair et al.1996, Arguedas 1999, Ordóñez 1999 mentioned by Arguedas, 2004).
The defoliator Rabdopterus sp. Rabdopterus sp. is a polyphagous species of the family Chrysomelidae (order Coleoptera). The Adults feed on foliage of teak, producing holes as features elongated and curve about 1.3 cm long and 0.16 cm wide (Arguedas, 2004). Figure 5.
Walterianella sp defoliator. Adults feed on the leaves producing a small scrape on the upper cuticle and parenchyma of approximately10x2mm. For the amount of damage on a single leaf, it can be almost completely perforated and die (Figure 6). Populations are concentrated in one or two trees, and when disturbed, jump and form "clouds" in the environment. It is a plague whose incidence has increased markedly over the past two years (Arguedas, 2004).
27
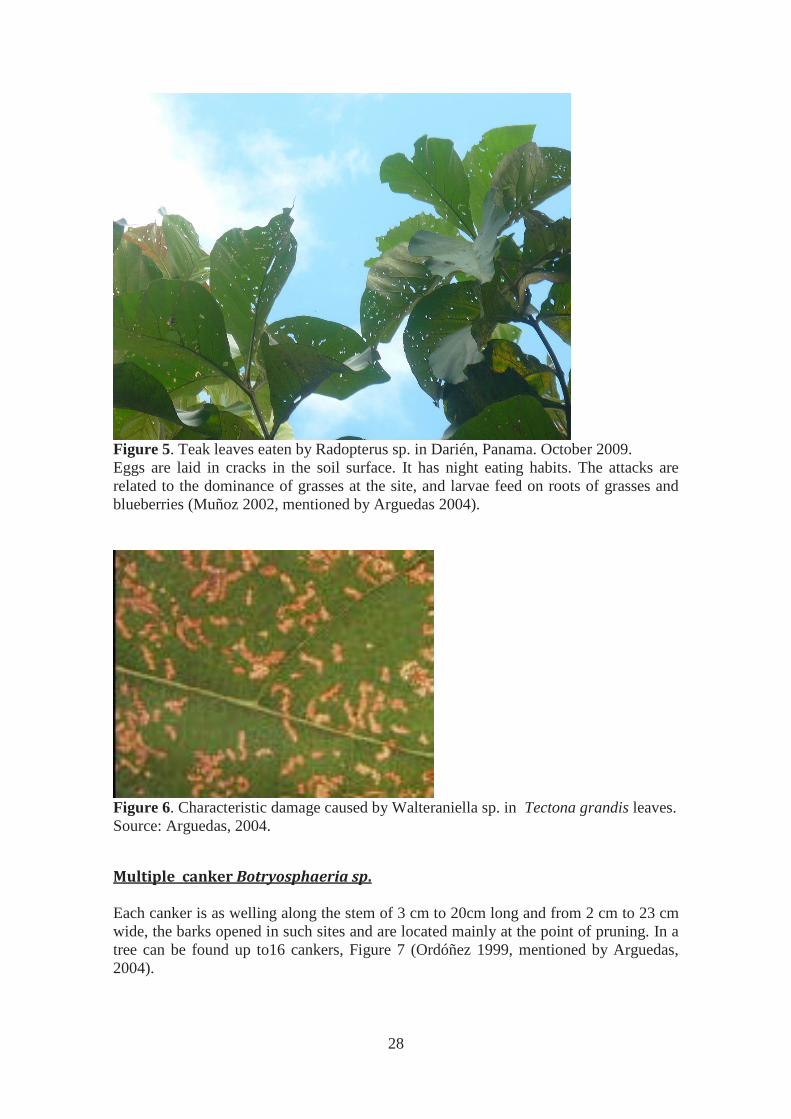
Figure 5. Teak leaves eaten by Radopterus sp. in Darién, Panama. October 2009. Eggs are laid in cracks in the soil surface. It has night eating habits. The attacks are related to the dominance of grasses at the site, and larvae feed on roots of grasses and blueberries (Muñoz 2002, mentioned by Arguedas 2004).
Figure 6. Characteristic damage caused by Walteraniella sp. in Tectona grandis leaves. Source: Arguedas, 2004.
Multiple canker Botryosphaeria sp. Each canker is as welling along the stem of 3 cm to 20cm long and from 2 cm to 23 cm wide, the barks opened in such sites and are located mainly at the point of pruning. In a tree can be found up to16 cankers, Figure 7 (Ordóñez 1999, mentioned by Arguedas, 2004).
28

Figure 7. Tectona grandis multiple canker caused by Botryosphaeria sp. Source: Arguedas, 2004.
Nectria canker (Nectria nauriticola) This canker makes at the base of the stem an oval area of dark crust. This rotten bark can be released manually and observe the exposed xylem tissue. It has been observed that cankers can stay for a long time in the tree, which starts to produce callus tissue and sub-epidermal cortex as a possible defence, causing swollen and deforming large areas mainly at the base of the tree. In the young trees canker can be longitudinal and expanded at the base, some resulting in death tree banding. Many times, 7 years old trees roots are attacked by Fusarium sp. This could be related to the attacks of N. nauriticola, as Fusarium species are the imperfect state of Nectria (Arguedas, 2004).
Elongated canker The typical symptom is a longitudinal cracking of the bark that can drill down to the xylem. In some cases it develops extensively, covering average areas of 12 x 6 cm, and when the bark surface is cut, it is possible to observe the internal tissues completely necrotic (dark brown colour). In other cases, apparently in older cankers, the cracking extends along the stem (up to 60 cm) and the tree form calluses on edges, which defines the perimeter of the same length (Arguedas, 2004).
29

Crowngall “Agrobacteriumhh” Although this disease has been reported for many years, the incidence in teak has increased. A.tumefaciens is a bacteria that produces a disease called "crowngalls" which causes tumours in more than 80 families (Arguedas, 2004).
Stem borer Neoclytuscassicus. In stem pieces stored in yards, mainly from thinning, Neoclytus (Cerambycidae, Coleoptera) borer attacks. Larvae built galleries in the sapwood, no external signs of attack are detected. The stem becomes full of galleries, the adult who builds circular holes of approximately 5 mm in diameter from where they emerge. The first spots jointly form an "M" and the latest form a "V" inverted (Arguedas, 2004).
Rootles eater Phyllophaga spp. The larvae of many species of the genus Phyllophaga, can be considered as the pest with most important feeding ground for tubers and roots. The damage is caused by larvae in their third instar, which are known in the region as "jogotos", "fogotos" or "Grubs." Adults are known as "May beetles" (CATIE 1991, Coto 2000, mentioned by Arguedas, 2004). The impacts are strong on new plantations and established plantations of up to 3 years in the months of September and October. In Panama this pest was discovered in 2003. It was found hundreds or more larvae in some individuals with severely affected root system, both almost total absence of absorption roots, such as perforations in the primary and secondary roots. This situation means that these trees are much more prone to other phytosanitary problems as those produced by soil pathogens (Arguedas, 2004).
Teak decline In plantations older than 7 years in the humid regions (annual rainfall of over 4000 mm), there has been a process of death of individual trees and groups called the "Teak Decline”. The processes of root rot (bark root necrosis) occurs primarily in the apical major regions (approximately 1.0 - 1.5 cm in diameter), where the bark peels off easily. The internal tissues turn usually blackish product of oxidation processes that were possibly accelerated and because mildew stains from wood. Degeneration is also observed in adventitious rootlets, producing rot and death of them, so that the roots tertiary "strip", giving the appearance of "fox-tail" (Arguedas, 2004).
Rust Olivea tectonae. In November 2003, was reported the fungus disease called "Rust". The pathogen was identified as Olivea tectonae first reported in Panama, however it originates from Asia (Arguedas, 2004). Teak leaf begins to change colour from green to yellow and observable orange pustules. Later, the leaf turns dark brown and black hanging from the stem at the tree until it falls to the ground.
30

The absence of thinning, no pruning, too high planting density, inadequate fertilization and especially a poorly selected planting site, favour the development of the disease. A high-density plantation preserves much moisture in the air and if there is no aeration (poor circulation of the wind), no penetration of sunlight, the environment favours the development of the fungus. The fallen leaves on the ground have rust pustules that its spores are spread by wind, allowing the distribution to other plantations. O. tectonae is an obligate parasite, needs of green leaf tissues of teak to survive, however, may remain in a state of uredospores (fungus spores, survival and dissemination structure) until it finds appropriate tissue to develop De Gracia ( ). The following figures show some symptoms that were found in Forwood teak plantation during the essay installation:
Figure 8. Insect holes and fungus on teak stem, 6 months after thinning in Darién, Panama, April 2010.
31

Figure 9. Termites “Comején”.
Figure 10. Termites on tree stem.
32

Figure 11. Canker.
2.4. Quality of teak plantations vs. natural teak
There exists a global debate about if the quality of the wood from teak plantations approaches the quality of that grown in natural forest (Akwasi and Oteng-Amoako, 2004). Teak wood produced in the natural forest from Myanmar, India and Thailand has excellent reputation in the international market with very good prices. Natural teak has a high proportion of heartwood which gives an attractive color, nice texture, straight grain and good mechanic characteristics which are favorable for the process at the sawmill. Moreover, the fact of having a big proportion of heartwood, makes the natural teak products to last longer because of the high resistance of the wood. This fact also means a good potential for carbon storage in the long term (Bhat and Keogh, 2003 mentioned by Akwasi and Oteng-Amoako, 2004). Teak from plantations with rotation length of 21 – 30 years often presents a high content of sapwood and juvenile wood. Therefore, the veined, color, grain and texture are regarded as less attractive than in natural teak. According to some researchers, teak wood from plantations has lower density than in natural stands which is commonly attributed to the faster growth. However there are studies which suggest that these
33

differences are not always evident and even some results of genetic studies in different species have shown no correlation between the two facts (ISTF, 2009). Studies conducted at the Forest Research Institute in Dehra Dun, India, did not find a significant relationship between growth rate and wood density (Sekar, 1972 mentioned by ISTF, 2009). Chudnoff, 1984, found that natural teak wood from Asia has a medium-high specific gravity of 0.55. The wood is quite stable with very little shrinkage during drying. Teak wood contains oily resins called tectoquinones that naturally repel termites and resist rot (Steber, 1997 mentioned by ISTF, 2009). In spite of having an oily feel when fresh, the dry wood glues well. In Costa Rica the specific gravity of plantations teak wood was found to vary with age and also from the inside to the outside of the bole. Wood in the center and at the base of trees was found to have wood specific gravities of 0.40 to 0.45, whereas wood on the outside and higher in the trees has specific gravities of 0.55 to 0.60 (Moya, 2001 mentioned by ISTF, 2009). Wood density for 20 years old teak in plantations in western Venezuela is reported to vary from 0.54 to 0.67 (Valero et al., 2005 mentioned by ISTF, 2009). Bailleres and Duran, 2000 found that teak from 21 year-old plantation can have a similar resistance as mature teak from natural forest. Nevertheless the accumulative effect of the differences in the diverse properties of the wood, combined with the smaller dimensions of teak plantations makes them less valuable than teak from natural forest (Akwasi and Oteng-Amoako, 2004). Bhat, 2000 mentioned by Akwasi A. and Oteng-Amoako, 2004 proposed alternatives to improve the quality of teak wood from plantations. He suggested that it is possible to produce logs with higher yield of naturally durable heartwood per individual tree by accelerating tree growth in short rotation with cautious fertilizer application and genetic improvements on suitable sites. Moreover fast growing provenances and clones can be selected for teak management without reducing the wood´s specific gravity. However, matching the provenances for specific site conditions and product requirements appears to be most crucial in tree improvement programs. According to Akwasi and Oteng-Amoako, 2004, even with genetic and silvicultural improvements, the appearance of the teakwood produced by fast-grown trees is likely to continue to be different from slow-grown natural forest teak in terms of color, grain and texture. Given that one of the main criteria for the market price of a timber is its appearance (another is durability), fast-grown teak is therefore unlikely to ever reach the prices given in the market to old-growth teakwood. Long rotations in teak plantations appear essential if the high potential value of the heartwood is to be realized. Studies in India found that the heartwood content of 51 to 52 year old trees was 77 percent, whereas for 8 year old trees it was only 30 percent (Bhat, 1997, mentioned by Krishnapillai, 2000). The same studies also showed a positive correlation of heartwood percentage with ring width (0.73) and with dbh (0.46), indicating that faster growth rates were associated with higher heartwood content and, by implication, higher-value timber. These results suggest that rotations longer than 8
34

years are necessary for producing high value logs and that faster growth rates may not be detrimental to the value of the timber. The bole form is also a fact considered to be of worse quality in plantations than in natural teak forest. The phenomenon of fluting (irregular involutions and swellings) in the teak stem has been observed in a number of plantations. In an international provenance trial the mean heritability value of stem straightness was found to be 0.83, indicating that the character for stem straightness is strongly controlled by provenance and is thus genetically inherited (Kaosa-ard, 1999 mentioned by Krishnapillai, 2000). Hence, fluting can be minimized if the appropriate genetic material is used in breeding trials to produce plants that exhibit straight stems. Market demand has traditionally been for teak heartwood with no sapwood. However as smaller saw logs from plantations become more common, sapwood inclusions will tend to become more important (ISTF, 2009). Furthermore, there are differences in preference regarding the appearance of the wood. In Indonesia, lighter wood for decorative interior panels for export is desirable, while darker colored wood is preferred for making furniture (ISTF, 2009). In Thailand, teak wood with dark brown stripes is known as tiger stripe teak. The tiger stripe teak is used in furniture, but is not desirable for interior paneling. The causes of the variations in the colour and characteristics of the teak grain are not documented but some researchers suggest that this can be attributed to the soil and site characteristics and also to genetic variation (ISTF, 2009).
2.5. Teak market
The global focus on forest plantations for tropical timber production has been re-enforced by the raising consciousness about the protection of natural forest. Teak as a high quality timber species has become a very interesting option for investors. It is estimated that teak shares 75% of the global high-value tropical timber trade. For a number of political and economic reasons, investments in teak plantations have declined in recent decades in many countries, especially in Africa, and few efforts have been made to improve forest practices or the productivity of existing plantations. On the other hand, in countries where the investment climate is more favorable, investment to expand and improve the quality of teak plantations is expected to continue. In many countries, public polices now tend to provide incentives for plantations, which imply that more private sources are investing in teak than the state, which has been the main investor in the past. As consumers are making a strong environmental pressure in favor of plantation timber, the market demand for teak timber is increasing and the price is expected to continue to be attractive (ITTO, 2009). FAO (2000) has estimated the global sustainable production capacity of teak plantations. The countries shown in Table 5 have a total production capacity of 31.3 million m3 of teak round wood per year, which is 7% of the total volume of tropical timber harvested globally. India, Indonesia and Thailand together have an estimated
35

sustainable production capacity of 24.3 million m³ per year, 78% of the world total volume (Table 7). Table 7. Sustainable production capacity of teak plantations in the major tropical countries, 2005.
Country Commercial planted area (`000 ha)
MAI (m3/ha/year)
Sustainable production (`000 m3/year)
India 2561 5 12805 Indonesia 1470 5 7350 Thailand 836 5 4180 Others 726 4.5 3267 Subtotal Asia - Pacific 5593 - 27602 Nigeria 74 9.5 1260 Ivory Coast 66 11.3 756 Ghana 40 15 200 Sudan 25 4 100 Others 51 4 204 Subtotal Africa 256 - 2353 Brazil 50 9 450 Costa Rica 30 13 390 Others 53 10 530 Subtotal Latin America 133 - 1370 Total 5982 - 31325 Source: FAO (2000), STPC database and other sources. FAO also mentioned that almost as important as volume is the quality of the wood. In general, Asian plantations produce a denser, darker and more uniform wood than those in Brazil and Costa Rica, probably because rotations are between 80 and 120 years in Asia and 25 – 30 years in Latin America. As a result, the products obtained are different, with logs produced in Asia tending to capture a higher price. According to the ISTF (2009), in 2004 Myanmar was estimated to have 60 % of the world´s remaining primary teak forests. Teak trade in Myanmar is controlled by the military and exports are being used for military spending. Myanmar round wood timber trade with China was 295.000 m3 in 1997 and grew to 948.000 m3 by 2002 (Kahrl et al., 2004). However, India is the largest destination for Myanmar timber exports, receiving 76% (770.554 m3) of all hardwood log exports in 2001, according to Myanmar´s published customs statistics (Kahrl et al., 2004. ISTF, 2009). On the other hand, China comprised just 0.3% (3.237 m3) of Myanmar´s official hardwood log exports, but China´s customs statistics record 2001 log imports from Myanmar at 513.574 m3. This discrepancy indicates that illegal logging is taking place on a massive scale along Myanmar´s border with China (Kahrl et al., 2004. ISTF, 2009). Keogh (2008) mentioned that several sources of plantation teak prices are available worldwide. However, their use is limited because they are mostly unsubstantiated and lack precise information about log dimensions, time of data collection and what point along the value chain they refer to (ITTO, 2008).
36

Myanmar base the prices of teak on a traditional log grading system which make differences between highest quality veneer logs from lower grade sawlogs. Grading is based on top diameter, log length and straightness and number of defects. Log prices in Myanmar are listed in Euros per hoppus ton (1 hoppus ton = 1.8027 m3). Table 8, provides FOB log values for 2011. Table 8. Myanmar log prices (natural forest logs). Teak logs, FOB.
Log class € Avg per Ton (traded volume) 2011 Veneer quality Mar Apr 2nd quality nil nil 3rd quality nil nil
4th quality 2.654 (12 tons)
2.588 (11 tons)
Sawing quality
vGrade 1 (SG-1) 1.734 (48 tons)
1.777 (44 tons)
Grade 2 (SG-2) 1.507 (40 tons)
1.581 (41 tons)
Grade 4 (SG-4) 1.175 (200 tons)
1.122 (200 tons)
Grade 5 (SG-5) 764 (118 tons)
729 (139 tons)
Grade 6 (SG-6) 698 (57 tons)
664 (78 tons)
Grade 7 (ER-1) 544 (107 tons)
520 (92 tons)
All grades, except SG-3/5/6, are length 8´x girth 5´&up. SG-3/4/6 is girth 4´&up. SG-3 grade is higher than SG-4 but with lower girth in price. Prices differ due to quality or girth at the time of the transaction. Sources: ITTO TTM reports May, 2011. There are different prices between natural and plantation teak. According to Keogh, 2008, all the plantation teak log prices are significantly lower than the lowest Myanmar grade (SG-6), suggesting that the upper ceiling for plantation teak prices is, with few exceptions, lower than the lowest category of natural forest teak. Most plantation price data lie between US$ 150 and 250/m3 (real prices), equivalent to between US$ 200 and 300 (nominal) (ITTO, 2008) (Figure 12).
37

Figure 12. Prices (US$ per m3) of natural forest and plantation teak logs. Source: ITTO 2008 According to ISTF (2009), in Venezuela there were 5000 ha of teak plantations in the federal forest reserves of Ticoporo and Bum-Bum in the western state of Barinas established during the 1970’s and 1980’s. Most of them were not thinned and had not been pruned. When most of the plantations had reached 20 years of age, trees were in the range of 25 cm to 35 cm dbh, they were sold to Malaysian buyers at a stumpage price of US$ 200/m3. On the north coast of Colombia, near the city of Monteria, at the same time, teak plantations 20 years old were sold to Indian buyers for a stump price of US$ 225/m3, but the real net price after discounting defects was US$ 168/m3. It is difficult to have information about teak log prices from Panama, however, ITTO in 2011 have reported that India bought logs from Panama with prices from 315 to US$ 400/m3. Comparing with other Central American countries in 2011, Panama tends to the cheapest prices for teak logs. Clearly, markets for small diameter teak logs from plantations are different from the traditional markets for large diameter logs. A marketing strategy is needed to demonstrate the value and possible uses of teak from young plantations. One possibility which some growers are trying to apply is showing increasing interest in producing value-added consumer products from their wood and engaging in the processing and marketing of their own finished or semi-finished products, as opposed to trying to sell stumpage or logs.
38

The major challenge for plantation growers is to produce quality teak wood that is acceptable in international markets, see Figure 13. A standardized international log grade system for teak plantation, along with uniform lumber and product grades would help to improve the marketability of teak product, due to the fact that buyers would know the exact quality of the products being offered for sale (ISTF, 2009). Repo
Figure 13. Sawing for quality in small teak logs involves sawing boards, edging boards to remove sapwood and wane and then removing the pith from the center board. Source: ISTF, 2009.
2.6. Productivity
2.6.1. Rotation length
Teak is the premier fine furniture wood being grown in plantations around the world. Although teak was once managed on rotations of 80 to 100 years, current rotation lengths have been shortened to 20 or 25 years for commercial wood production (ISTF, 2009). Shorter rotations of 20 – 30 years for both veneer and sawlog production are being employed in many countries in order to have relatively quick returns (Ball et al., 1999 mentioned by Bhat and Hwan Ok Ma, 2004). Traditional teak management has continued to follow the recommendations made by German foresters in the Nineteenth Century with plantation establishment using the taungya or agroforestry system, where farmers tend the young teak trees and grow food crops in between the tree rows during the first years. In this system, teak seeds are sown in rows 5 or 6 m apart, which allows for crop cultivation between the rows of young trees. The trees are initially thinned around 3 to 5 years of age to improve quality and growth of individual trees. There is subsequent thinning every 5 to 10 years until the trees reach 45, by which age stand density has been reduced to between 200 and 300
39

trees/ha. Following the initial management plans, these final rotation trees were allowed to grow to a harvest age of 80 years. This management system worked well until the latter part of the Twentieth Century, but demand for teak wood has now reduced rotation ages to 40 years and the demand for land for food production is taking priority over the replanting of teak (ISTF, 2009).
2.6.2. Annual Volume increments
In respect to productivity, mean annual increments (MAIs) of above 20 m3ha-1 year-1 have been reported in Indonesia and Trinidad and Tobago (Bell et al.. 1999 mentioned by Bhat and Hwan Ok Ma, 2004). In Indonesia, the average MAI at harvest age, with rotations varying between 40 and 80 years is estimated to be 2.91 m3ha-1year -1. In India, an average yield in 70 year plantation of 172 m3 per hectare (giving an MAI of about 2.46 m3ha-1 year -1) has been reported (FAO, 1985 mentioned Bhat and Hwan Ok Ma, 2004), while the MAI in teak plantations of 40 – 50 year rotations in Benin and Cote dÌvoire was 8 – 11 m3ha-1 year -
1. A yield of 10.2 – 13.3 m3ha-1year -1 has been recorded in Central America for a plantation with a rotation length of 25 – 28 years (Arias, 2003 mentioned by Bhat and Hwan Ok Ma, 2004). A current status of teak plantations for the main teak growing countries was done in 2004 by the Kerala Forest Research Institute (KFRI) in Kerala, India. Three continents were characterized: Asia Pacific, Africa and America (Central and South America.). India with 2.5 million ha of teak is by far the country with most plantations, 45 % of the total teak area. The mean annual increment goes between 2 m3ha-1year-1 in India to 27 m3ha-1year -1 in Nigeria. The rotation length varies from 20 years in Ghana to 80 years in India and Indonesia (Table 9).
40

Table 9. Teak growing facts in different countries.
Country Plantations (thousand hectares)
Initial spacing (m)
Traditional rotation (years)
MAI (m3 ha-1year-1)
Total 5.494 Asia pacific 5.161 Bangladesh 73 1.8 x 1.8 40 7.4
India 2.450 1.8 x 1.8, 2 x 2, 2.5 x 2.5, 3.6 x 2.7/ 3.6
50 - 80 2 – 7
Indonesia 1.760 3 x 3 60 - 80 5 – 6
Malaysia 4 2.4 x 2.4/3 to 4 x 4,5 36 - 40 4 – 10
Sri Lanka 38 3x3 40 7 Thailand 836 2 x 4, 4 x 4 40 - 60 13 Africa 240 Ghana 170 1.8 x 1.8, 2 x 2 20 8 – 10
Nigeria 70 2.44 x 2.44 to 2.96 x 2.96 27
Central/South America 93
Brazil 45 n/d 25 10 – 13 Costa Rica 33 3 x 3 25 - 28 10 – 13 Trinidad and Tobago 15 2.1 x 2.1 50 4 – 8
Source: KFRI unpublished, 2004.n/d no available data In the first years of teak plantations, when favorable conditions are given, it has been found that growth rates can vary between 10 and 20 m3 per hectare per year. However, growth falls to the general reported level of 4 to 8 m3 per hectare per year as the plantation ages (Htwe, 1999; Cao, 1999 mentioned by Krishnapillay, 2000). On the best sites in Myanmar and India, 50-year-old plantations exhibit heights of 30 m and diameter at breast height (dbh) of 60 cm (Krishnapillay, 2000). In Malaysia growth parameters for teak grown developed by the Forest Research Institute Malaysia (FRIM) show that teak could reach 4 m height in the first year, an increment in diameter of 1.5 to 2 cm and 25 to 35 cm of DBH at 15 years (Table 10). Table 10. Performance of teak at Mata Air Station, Perlis, Malaysia.
Height growth 4 m in the first year Diameter growth 1.5 – 2 cm per year DBH 25 – 35 cm at 15 years Total height 22 – 25 m at 15 years Clear bole 12 m at 15 years Volume per tree 0.5 m3 at 15 years
Source: (Krishnapillay, 2000).
41

In Costa Rica, Ugalde and Vásquez in 1995, using data from 14 sites located in the Guanacaste province, in the North Pacific region of Costa Rica made a characterization according to three levels: high, middle and low productivity. The MAI in dbh was from 1.5 or less in a low site and 2.0 or more in a high productivity site. The MAI in volume in a low site was 12 m3ha-1year-1 or less and in a high productivity site was 18 or more. In the highly productive places, the dominant height was 21.7 meters or more at 10 years of age (base age). Plantations with a dominant height lower than 18.1 m, at the same age, were classified as low productive (Table 11). Table 11. Yields for Tectona grandis in Guanacaste, Costa Rica for high, middle and low productivity sites.
Range Productivity sites High Middle Low
MAI-dbh (cm/year) 2.0 or more 1.6 - 1.9 1.5 or less MAI-height (m/year) 2.0 or more 1.6 - 1.9 1.5 or less
G (m2/ha) 20 or more 15.1 - 19.9 15 or less
MAI-G (m2/ha/year) 2.5 or more 1.6 - 2.4 1.5 or less
MAI-Volume (m3/ha/year) 18 or more 12.1 - 17.9 12 or less
Site index at 10 years (m) 21.71 or more 18.09 - 21.7 18.08 or less
Source: Ugalde and Vasquez (1995).
2.6.3. Teak growth in Panama
Osorio and Ugalde, 2003 mentioned by Ugalde and Gómez in 2006, presented the results of a study about teak growth in Panama. The main objective of the investigation was to evaluate the growth and yield of teak under different sites and climate conditions with the aim to know the behavior of this species in this country. Plots were concentrated to the eastern part of the country but plots were also measured in the central and western parts as is shown in Figure 14.
42

Figure 14. Distribution of the teak plots. Source: Osorio R. 2002 The results of the measures done in 150 plots, analyzed by age ranges, showed that MAI in dbh of the trees with less than 5 years old was 2.9 cm, value that decreased as much as 1.6 cm in trees older than 15 years. A big amount of plots are in the range between 5 to 10 years old, mainly because most of the teak plantations in Panama, were established between 1992 and 1997. It is remarkable that the growth is much more accelerated during the first 10 years and the diminishment from 15 years and on; the MAI in volume was between 12.2 in trees over 15 years to 15.8 m3ha-1year-1 in trees with less than 5 years (Table 12). Table 12. Summary of the averages of Nº trees per hectare, MAI in Diameter, Total height, Basal area and Volume according age ranges in Panama. Age ranges (years)
Nº of plots
Trees per hectare MAI Dbh (cm)
MAI TH (m)
MAI BA (m2 ha -1 y -1)
MAI V (m3ha -1 y -1)
Average Min. Max. Nº %
< 5 35 23 822 394 896 2.9 2.7 2.6 15.8 5-10 94 63 729 279 1320 2.6 2.4 2.2 15.2 10-15 13 9 481 196 806 2.0 1.8 1.5 14.3 > 15 8 5 426 180 644 1.6 1.2 1.3 12.2 Total 150 Source: Osorio and Ugalde, 2003. As the major amounts of plots belong to the range between 5 to 10 years old, the variability of the MAI in dbh is higher by this age in comparison with oldest forest. At 5 years, values from 1.8 to 3.6 with average of 2.5 cm year -1 in diameter were registered (Gómez and Ugalde, 2006), Figure 15.
43

Figure 15. Relation between age and MAI in dbh (cm/year). Source: Gómez and Ugalde, 2006. In Figure 16, it is shown the tendency of teak productivity per hectare that could be expected up to an age of 33 years old. The dispersal of the data shows a curve with total volume estimations up to 250 m3 ha-1 in 33 years old plantations (Gómez and Ugalde, 2006).
Figure 16. Teak total volume tendency per hectare according to age. Source: Gomez and Ugalde, 2006.
MAI MAI Log (IMADBH) DBH Age (years)
Age (years)
44

2.6.4. Site index
The site index is a relative measure of forest site quality based on the height of the dominant trees at a specific age. The average tendencies shown in Figure 17, are the result of calculating the site index for each of the 150 plots evaluated, according to the age and average dominant height of the plantations, with a range of age between 4 up to 34 years (Gómez and Ugalde, 2006).
. Site Index SI
Age (years)
Figure 17. Teak tendency for Site Index in meters according to the age of the evaluated plantations. Source: Gómez and Ugalde, 2006. It was found that between 5 to 10 years there is a high variability, with a remarkable relation between the youngest plantations and site index from medium to good. The maximum site index found was 25 m (excellent) and the minimum 10 m (low), according to the model developed by Ugalde and Vallejos in 1998 for a 10 years old plantation. The dispersal of the data about the quality of the sites is significant in relation to the age ranges utilized. For ages above 10 years it can be seen a significant variability, with a maximum of 28 m of height (excellent) and a minimum of 20 m (good), and an average of 24 m (excellent). This indicates that a considerable number of plantations in Panama are in high quality sites. The data shows that for plantations older than 25 years old it can be expected in an excellent site height up to 26 m (Gómez and Ugalde, 2006). Picado in 1997, made a four level characterization of teak plantations according to different dbh and height mean annual increment. In an excellent site, values of 3.1 or more cm year -1 could be reached with increments in height of 3.1 m. Meanwhile in a low site, values of 1.0 or less cm year -1 with increments in height of 1 m or less could be expected (Table 13).
45

Table 13. Growth characterization according to different ranges.
Range MAI dbh MAI height (cm/year) (m/year)
Excellent 3.1 or more 3.1 oe more High 2.1 - 3.0 2.1 - 3.0 Middle 1.1 - 2.0 1.1 - 2.0 Low 1 or less
Source: Picado (1997)
2.6.5. Site quality and wood production
Assuming 50 years as an average age of harvest, Ball et al. in 1999 derived from various yield tables MAI at the culmination age of maximum volume production and MAI. Three site classes categorized as best, average and poor, show maximum MAI in the best site of 21 in Indonesia to 12.3 m3ha-1year -1 in India (Nigeria and Trinidad are not included because inadequate number of sample plots were used), Table 14. Table 14. MAI maximum and at 50 years rotation age in m ha year on best, 3 -1 -1
average and poor site classes.
Country Best Average Poor MAI (max)
MAI (50) MAI (max)
MAI (50) MAI (max)
MAI (50)
India 12.3 10.0 7.9 5.8 2.7 2.0 Indonesia 21.0 17.6 14.4 13.8 9.6 9.6 Myanmar 17.3 12.0 12.5 8.7 5.9 4.3 Nigeria* 23.8 13.3 18.5 9.0 13.1 6.8 Ivory Coast 17.6 9.5 12.2 7.5 6.8 4.3 Trinidad 10.2 6.5 7.5 5.0 5.5 3.9 Ball et al. in 1999 *Yield tables have been prepared based on inadequate number of sample plots and are provisional. Vallejos (1996), in the same zone that Ugalde and Vásquez studied in 1995, determined that the yield of teak could be influenced significantly by the calcium content in soil from 0 to 20 cm of depth. It was found that 18 cmol/l and more are adequate for good teak development. When soil presents lower quantities, it is recommended to correct it with lime applications. It was also determined that water deficit influences negatively the development of teak.
46

In this study, a Site Index prediction model was developed:
Where:
794.0/)268667.0695521.2432112.25( CaDEFHIDSI ×+×−= Ln = the natural logarithm SI = site index Hdom = dominant height (meters) BaseAge =10 years Furthermore, a model relates the SI to the soil calcium content (Ca) and water balance (DEFHID): Where: DEFHID = the number of months with less of 100 mm of rainfall. Ca = the content of calcium (cmol/l)
2.6.6. Equations to predict total and commercial volume.
As the management of teak plantations has been intensified in the last decades, since 2003 Diego Pérez and Markku Kaninnen, have been developing equations to predict total and commercial volume of individual trees. They tested existing equations of total and commercial volume at variable heights and diameters in teak. Utilizing a data base of 112 trees from plantations with average diameters between 2.4 and 58.7 cm and ages between 2 and 47 years old in different sites of Costa Rica. The plantations were selected from 10 different sites from the humid and from the dry region of the country with densities between 156 and 1600 trees per hectare. The adjusted equations presented a high accuracy, while other models in previous studies tended to overestimate the values measured, particularly in dbh bigger than 30 cm. As a result out of a total of 13 models tested, 2 models were selected that estimate total volume using dbh and dbh + total height, even for volume over and under bark. The equations are shown below (Table 15).
))1()1((8253.1)()( 5162.05162.0 ∧∧ −×+= BaseAgeAgeHdomLnSILn
47

Table 15. Models for estimation of total volume over and under bark for Tectona grandis in Costa Rica.
Equation Model r2 adjusted
1-A 0.98
1-B 0.98
2-A 0.99
2-B 0.99
Where: Vob : total volume over bark (m3) dap : diameter at breast height (cm) Vub: total volume under bark (m3) H : Total height of the tree (m) The models adjusted for estimation of commercial volume over and under bark are shown in Table 16. Table 16. Models adjusted for estimating commercial volume (up to an arbitrary diameter or commercial height) over and under bark for Tectona grandis in Costa Rica.
Equation Model r2 adjusted
3-A 0.87
3-B 0.87 4-A 0.98 4-B 0.97
Where: CVob: Commercial volume over bark (m3) at a minimum Commercial Diameter over bark CDob (cm) CVub: Commercial volume under bark (m3) at a minimum Commercial diameter under bark CDub (cm) dbh: diameter at breast height (cm) h: arbitrary commercial height (m) H: total height (m)
2)0297.00884.0( dapVob ×+−=
2)0269.00878.0( dapVub ×+−=
( ) ( ) 2103.15588.1000073.0 HdapVob ××=
( ) ( ) 3475.15633.1000038.0 HdapVub ××=
( ) ( ) ( ( ) ( ))000110,0000137,0000014,04 2322
Hh
HhhdbhCVob ×−×+×××= π
( ) ( ) ( ( ) ( ))0000863,0000107,0000012,04 2322
Hh
HhhdbhCVub ×−×+×××= π
( ) ( ) ( ) ( ) )7839,010297,00884,0 4175,24149,22 −××−××+−= dbhCDobdbhCVob
( ) ( ) ( ) ( ) )7445,010269,00878,0 5236,25372,22 −××−××+−= dbhCDubdbhCVub
48

These models were tested with an independent data base of 44 trees. In general the model for prediction of total volume showed a difference between the real data and the estimated of 8 to 10%, while with the model for prediction of commercial volume this difference was of 15% (Pérez, 2005).
2.7. Teak management
2.7.1. Pruning
Pruning consists in cutting of dead or alive branches from the lowest part of the crown of the trees, preferable when they are alive and have less than 2 or 3 cm in diameter. The scars generate a knot area which disqualifies the timber for certain uses, especially when there are “dead knots”. Teak requires a very intensive pruning regime to produce good quality timber (Gómez and Ugalde, 2006). Low plantation densities reduce the natural pruning and stem straightness. In many species, natural pruning is never a satisfactory option, even after branch senescence, if production of clear wood is a management objective. In afforestation for sawnwood, the physiological process of self-pruning must be replaced by manual pruning (Pérez and Víquez, 2005) see Figure 18. The pruning practice has big impact in the market, especially in species like teak, which has worldwide reputation for the quality of the wood. In teak the physical and mechanical properties are remarkable, as well as elasticity, resistance and durability and these are the reasons why it has great commercial demand (Tewari, 1999, mentioned by Gómez and Ugalde, 2006).
Figure 18. Three years old plantation 5 m pruned (left); three years old plantation 3 m pruned (right). Gómez and Ugalde (2006) mentioned as benefits of pruning, the access to young plantations, control of pests and diseases, desired shape of the trees, improve the apical growth, quality timber (clear wood) and reduced fire risk.
49

According to Courraud and Hubert (1988), mentioned by Gómez and Ugalde in 2006, pruning is a necessary investment, because it will increase the price when standing wood and sawnwood are sold and also the timber is easier to sell. The wood price is the result from the quality of the wood as the presence or absence of external visible defects. Furthermore, the yield in sawn wood is connected to straightness and cylindricity of the log, absence of knots, internal defects, the effective length and diameter. As teak is a heliophilous species, it must have vigorous crowns in order to achieve high increment. But this implies, more branches with bigger diameters which means, more and bigger knots (Courraud and Hubert, 1988; Vincent, 1975; Rojas and Torres, 1994, mentioned by Gómez and Ugalde, 2006). A common strategy to grow long boles clear of knots, is to keep the stand quite closed with high stem number during the first years of the rotation, when rapid height growth occurs. This is meant to keep individual tree crowns small, and consequently limit the size of the branches (Centeno, 1997). The most common tools for pruning are pruning saw, chainsaws and pruners with telescopic pole. The latter is especially useful for coarse branches and when pruning must be done in higher heights (Gómez and Ugalde, 2006). According to the ISTF, 2009, it is not advisable to prune with a machete. In the case of teak, branch wood is relatively hard and requires more time and effort to prune than does the wood of species with softer branch wood. Training and supervision of pruning crews is needed to ensure that a proper pruning operation is carried out. The pruning cut must be made along the tree bole, but care is needed not to cause damage to the surrounding bark. If the branch were to be pruned flush without relieving the branch weight, there is a risk of bark tear-out below the pruned branch, which causes a defect and an entry point for rot fungi (ISTF, 2009). In teak there are three common pruning regimes: - Selection of the best shoot. - Formation pruning: consist of suppressing the bifurcations from the main stem, which tends to develop excessively, to the detriment of the stem diameter growth. - Branch pruning: when the objective is to produce high quality timber, branch pruning must be done in order to increase the clear timber area of the tree (Courraud and Hubert, 1988; ENDA-CARIBE, 1993, mentioned by Gómez and Ugalde, 2006). Knot free sawnwood, improves the working properties of the timber, facilitates peeling, finishing and seasoning and the uniformity of strength (Centeno, 1997). For example, plywood is easier to make when all the reactions of the wood are the same. The presence of areas where the reaction to stencil, notching, drying, joint and tint is varied, makes it more difficult to obtain pieces for cabinet making. Timber with
50

knots is much more sensible to variations in temperature and it may split (Courraud and Hubert, 1988, mentioned by Gómez and Ugalde, 2006).
2.7.2. Criteria for starting to prune
Pruning must start at early stages, while the branches are still thin and can be extracted with low costs. In this way, knot areas will be reduced and the time will be enough to develop clear wood with appropriate diameter to be worked at the sawmill. For these reasons it is recommended in species which form big and thick branches, as teak, to do the first prune up to 3.0 to 4.0 meters. The first pruning should be done near the time of canopy closure (Hawley and Smith, 1972, mentioned by Gómez and Ugalde, 2006). In the first pruning, the pruning height will correspond two thirds of the total height of the tree, when the plantation has a total height of 6 m. The subsequent treatments must be done when the total height has increased 1 or 2 m, or when the diameter reaches the maximum knot heart desired (Courraud and Hubert, 1988; Jara, 1982). An optimum objective is to prune branches when the tree bole is 12 cm in diameter (Figure 19).This, produces a minimal practical core of knots according to ISTF, 2009.
Figure 19. Early pruning keeps knots in a central core, allowing for the production of clear wood outside.
2.7.3. Pruning frequency
The preferable moment to prune is immediately after thinning, when the branches have more than 2.5 to 3.0 cm at the base. In teak it is recommended to do as many prunes as necessary, depending on the amount of branches that the trees form, with the objective to achieve a clear stem up to 10 - 12 m (Gómez and Ugalde, 2006). The same authors stated that frequency and intensity of pruning depend on 3 principal factors:
51

- The portion of living crown which may be eliminated according to the species reaction after thinning. - Diameter of heartwood, which is the central part of the stem around the pith. - Longitudinal and diameter growth (according to the species and site quality) and diameter growth (according to stand density). The amounts of pruning and their intensity will depend on the site quality. It is important not to prune too intensively in order to avoid negative effects on diameter growth. Furthermore, small crowns may make the trees prone to bow or wind-throw when there are strong winds (Gómez and Ugalde, 2006). The length of the sawlogs that are to be harvested must also be considered when developing a pruning schedule.
2.7.4. Time of the year for pruning
The time of the year is indifferent for small branches with diameters under 2.5 to 3 cm or dead branches of any diameter. In the case of alive branches with diameters higher than 3.0 cm, it is preferable to prune when there are good visibility conditions, in the period when the vegetative activity is slow, in order to ensure fast healing of the scars (Courraud and Hubert, 1988; Hawley and Smith, 1972 mentioned by Gómez and Ugalde, 2006).
2.7.5. Sprouts removal
The main stem is selected at early stages and it is done when the shoots are about 60 to 80 cm tall. It is common that the shoots grow many times in the first five years. Therefore, it may be necessary to prune them, to reduce competition (Figure 20). For doing this, all the shoots are cut leaving the best. They are cut with knives or pruning scissors close to the trunk without damaging the rest of the tissues (Gómez and Ugalde, 2006). After pruning teak it is common for secondary branches or suckers to sprout from adventitious buds located just above the pruned branch. This requires a second pruning to remove these suckers while they are still succulent. If they are not removed, they become woody branches and defeat the purpose of the original pruning (Society of American Foresters mentioned by ISTF, 2009).
52

Figure 20. Sprouts in 1 year old teak plantation. International grading rules establish strict standards for classifying high-quality timber, which include the appearance of knots (number, frequency, diameter, sound or unsound). Yield and market prices decrease considerably for trees without pruning interventions, since lumber must be almost knot-free in order to obtain a high value (Figure 21). Knots are widely considered as the most determinant defect for wood quality classification, in large part, because they influence the origin and magnitude of other defects such as pith eccentricity, stem form deviations (from the geometric cylinder shape), and bending (Ninin and Rosso, 1998 mentioned by Pérez, D. and Víquez, E.,2005). Pérez and Víquez, 2005, designed a pruning trial for Tectona grandis plantations in Costa Rica. The treatments consisted of pruning heights of 3.0, 4.0, and 5.0 m, and the Control without pruning. Differences among treatments in dbh and total height were significant at 3.2, 5.2, and 6.1 years of age, but not at 7.3 years. Under an intensive pruning regime, a teak tree at rotation (20 years) may yield over 40% of knot-free volume (over 60% of the merchantable tree volume).
53

Figure 21. Prune scar (left); dead twig (right). Pruning is a costly operation, which should be perceived as an investment to improve the quality of the final product (Centeno, 1997). The discounted improved value of the wood in final felling should exceed the cost for pruning. Pérez et al., 2003, developed a pruning methodology for T. grandis in Costa Rica planted in a high quality site. The first pruning up to 2 - 3 m should be carried when trees reach a total height of 4 - 5 m, at approximately 2 years of age. In a second intervention trees should be pruned up to 4 - 5 m when the stand reaches 9 -10 m of total height, at approximately 3 years of age. In a third intervention, when trees reach a total height of 12 m all the branches are pruned up to 7 m, at approximately 4 years old. Ideally, pruning is only done on trees that will reach rotation age, not on trees that will be removed in thinning that will not produce sawlogs. For this reason, the pruning is coordinated with thinning where possible (Society of American Foresters, mentioned by ISTF 2009). Using the height/age relationship of teak plantations in Trinidad, Miller, 1979, investigated possible pruning and thinning combinations to minimize pruning costs. According to the site and the log length target, two schedules were proposed, the first one to obtain 5 m log and the second to obtain two 2.8 m logs. Both site conditions consider two thinning. In a good site (Class 1) two pruning, the first one at 3 years old when trees reach 7 m, up to 2.5 m and the last one on 5 years old trees up to 5.5 m. In a site with less growth (Class 2) three pruning are proposed, the first when trees reach 6 m, they were pruned up to 2 m, the second in year 5 and the third in year 7 up to 6 m (Table 17 and 18).
54

Table 17. Pruning schedule for 5 m logs, Trinidad Site Class 1. Age (years)
Total height (m) Thinning Prune height
(m) Comments
3 7 Yes 2.5 Prune all trees after thinning
5 10 5.5 Prune only crop trees
7 14.5 Yes Table 18. Pruning schedule for two, 2.8 m logs, Trinidad Site Class 2. Age (years)
Total height (m) Thinning Prune height
(m) Comments
3 6 Yes 2 Prune all trees after thinning
6 10 4 Prune only crop trees
7 11.5 Yes 6 Prune crop trees after thinning
According to Keonakhone, 2006, the expected effect of pruning may be twofold; a reduced amount of branch biomass enables more of the synthesised carbohydrates (biomass) to be allocated to stem wood instead of branch wood and thus increase stem growth. A second type of impact is lost canopy and, thereby, lower photosynthetic capacity and less synthesized carbohydrates and, hence, reduced growth. However, the latter effect might be less important because the lower part of the canopy is shadowed and its contribution to net assimilation might be low or even negative. The results indicate that the pruning seemed to have a positive effect on tree growth measured as either diameter growth, commercial height growth or total height growth. As a general conclusion it seems that the loss of inefficient branches has had a positive impact on tree growth.
2.7.6. Thinning
The thinning could be defined as the removal of the trees with less quality from the afforestation, so as to promote the growth of the best ones. Thinning reduces the number of trees in the plantation with the purpose of maintaining the best trees and concentrates the growth on them (Figures 22, 23 and 24). The appropriate number of thinning depends on the final objective of the plantation, site quality, and market for the remaining logs (Gómez and Ugalde, 2006). The trees are initially thinned around 3 to 5 years of age to improve the stocking of the plantation. There are subsequent thinning every 5 to 10 years until the trees reach 45 years of age, by which age stand density has been reduced to between 200 and 300 trees/ha (International Society of Tropical Foresters, 2009). Success in the management of plantations of fastgrown tropical tree species can only be achieved by performing intensive and timely silvicultural interventions (Ola-Adams, 1990; Lowe, 1976; Larson and Zaman, 1985 mentioned by Kanninen et al., 2004).
55

The management of teak should be focused on producing good-sized logs, in response to dominant market demand and utilization technologies. However, the new forest industry can utilize small diameter but of high quality. This demands more intensive management of plantations for useful products, including the first thinning treatment (Chavez and Fonseca, 2003). .
Figure 22. April 2010, 3 years old teak plantation without thinning.
56

Figure 23. April 2010, 3 years old teak plantation with 45 % of thinned trees.
57

Figure 24. April 2010, 17 years old teak plantation without management. There are several thinning methods: low, high, mechanical and selective. Often, trees have differences in development, due to genetics, damage or competition between trees. Therefore a selective thinning is recommended. As long as consecutive thinning is done, more criteria and technical expertise are required: crown class, vigour, spacing, branches, pattern, health, are examples of variables that need to be considered when selecting trees for thinning (Gómez and Ugalde, 2006). The thinning should be done early and in an intensive way because teak trees cannot recover when the crown has been pressed or underdeveloped (Lamprecht 1990, CORMADERA-OIMT 1997, mentioned by Gómez and Ugalde, 2006).
58

According to Chavez and Fonseca, 2003, many light thinning carried out consecutively over a period of time loose their efficiency because they do not provide the necessary space for a vigorous growth of the remaining trees. In general, the experience shows that teak has good responses to hard thinning without affecting height growth, and favours diameter increment. The program and the interval between thinning depend on the initial density. Teak does not tolerate friction or crown competition because it is a heliophilous species. In windy places, during certain part of the year, hard thinning could be very risky as wind can break crowns, cause wind-throw or crown damage. It is important to promote the adequate silvicultural management during the first years of the plantations, especially about thinning and pruning to achieve the ideal growth of the trees according to the site quality (ANARAP-GTZ, 2002 mentioned by Gómez and Ugalde, 2006). One anomaly of teak is that, after thinning, the additional light that reaches the boles of the trees stimulates adventitious bud development and the formation of epicormic branches. Heavy thinning tends to produce more branching (Figure 25). Such branch initials must be removed; otherwise they will form small knots in the wood, which reduce the value of the logs. To minimize the effect of epicormic branching and maintain the knot defects within a central core, thinning needs to be done at an early age (International Society of Tropical Foresters, 2009).
Figure 25. Epicormic branches in 3 years old plantation.
59

Osorio and Ugalde, 2003, carried out a study about teak growth and productivity in Panama under different site and climatic conditions. It was found that in many plantations tree density was quite high after five years due to lack of thinning which led to negative consequences for the productivity and commercial volume for industrial wood and future rentability of plantations. The lack of thinning resulted in strong competition between trees, with decreasing development of the crowns. On average the density between 5 to 10 years old was 729 trees ha-1. Mean annual increment in height, dbh, basal area and volume showed significant differences when plantations were below 5 years old in comparison with older plantations. Osorio and Ugalde, 2003, found that the MAI in dbh between 1 – 5 years old was 2.9 cm year-1 and decreased progressively over the next 15 years to a MAI of 1.6 cm year-1. For plantations under 10 years old the MAI goes between 2.4 to 2.7 m year-1 and start to decrease over this age up to 1.2 m year-1. Miller (1969), considered basal areas of as high as 18 - 21 m2 ha-1 for doing the first thinning when the trees are about 8 m in height. The second thinning should be done when basal area reaches 15 m2 ha-1, removing 5.75 m2ha-1 (Keogh, 1979, mentioned by Chavez and Fonseca, 2003). Many of the afforestation enterprises do not make the appropriate silvicultural management, like thinning and pruning, because among other things, it is difficult to find market for the wood removed in the first thinning, that usually have small diameters. But in Panama there is a growing awareness that this situation should be corrected. Forestry professionals should demonstrate and make the investors understand that not doing appropriate pre-commercial thinning and commercial thinning lead to serious negative consequences in the development and in forestry production like: a) reduced vigour and quality in stem form; b) tree growth is delayed and do not reach the desired dimension in the expected time for the final felling that guarantee a high quality and competitive prices; and c) plantations with high tree density suppress the growth of the natural regeneration of native species “understory”, promoting erosion and soil runoff, especially in areas with steep slope (Gómez and Ugalde, 2006). A major challenge for teak growers is to develop innovative markets for plantation teak and find uses for low value wood from thinning (International Society of Tropical Foresters, 2009). The recommendations In Costa Rica for high quality sites, is a first thinning between the third and fourth year. About 40 - 50% of the total tree number should be removed. Generally, this thinning does not yield any commercial timber, but it is necessary in order to eliminate competing, malformed, sick or damaged trees (Picado 1997, mentioned by FAO 2002). Gómez and Ugalde, 2006, found that teak plantations in Panama, especially with small and medium dimensions, have received few or poor forest management treatments. Various aspects influenced and explain this, and were analysed in a workshop (AED- ANAM, 2005). High numbers of owners or investors are not familiar with the business, especially about needs and benefits of the silvicultural treatments. In many cases the owners have greater
60

interest on the economic benefits than on the investment that should be done in forest management. Two types of investors could be differentiated: only with interest on the forestry incentives and those with interest on the investment with return target. For those that use forest incentives, there are no rules or controls that allow the government the promotion and ensure of a good forest management. As many articles were removed from the forest law related with forest tax incentives, this promoted the lack of interest in reforestation and in forest management. The lack of control and monitoring, from the government, of the plantations under fiscal incentives, led the forest owners not to do the adequate management. Deficient technical orientation about thinning and market, which has not motivated the forest owners to explore alternatives for selling the wood from the first thinning. Some foreign private companies have better knowledge of the forest activity and this kind of business and they hire forest professionals to carry out the plantation management. Although, it seems that in Panama there is still a lack of information, and scientific studies, to achieve their own experience, necessary to have better results in teak management.
2.8. Forwood work procedure
2.8.1. Land selection
Soil samples are analysed and the site is inspected prior to issuing a permit for establishment of a teak plantation. The site must have been fallow cropland or pasture land as Forwood never fells natural forest to establish teak plantation. Before starting to prepare the establishment of the plantation, the area is inspected by the Panamanian forestry authority “Autoridad Nacional del Ambiente” (ANAM). The site is visited by the ANAM, GPS surveys are conducted and is determined if there exist watercourses. Once the area has been approved for the establishment of a teak plantation, Forwood's work continues.
2.8.2. Land preparation
During the dry season, the soil is harrowed using tractors. Clumps of trees, bushes and vegetation around watercourses are always saved in order to provide "wild corridors" through the cultivated sections. The road network is also established during the dry season.
61

2.8.3. From seed to plant
FSC-certified Tectona grandis seeds grow into plants in 6 to 8 weeks in the controlled environment of one of Forwood's own nurseries (Figure 26 and 27). Nowadays the source of the seeds is CATIE Costa Rica. Once the right infrastructure is in place in and around the project, the three-month long planting process can begin.
Figure 26. Seedlings ready to be planted.
Figure 27. Seedling root system.
62

2.8.4. Planting
The best seedlings are selected and 111 plants are planted per 1000 m2 with 3 m of distance between each plant. The establishment starts in June when the rainy season has stabilized and the ground is sufficiently wet. The plantation is manual, no fertilizer is added during the first three years, areas where plants are not growing are replaced with new seedlings (Figure 28).
Figure 28. Manual planting. The weed control is done during the first year with chemical products (Figure 29) until the trees reach an appropriate height to introduce cattle without being affected. .
Figure 29. Chemical weed control.
63

2.8.5. Management
Management is based on a plan individually adapted to the plantation area. Management covers everything that ensures optimal development of the plant/tree during the rotation period.
2.8.6. Thinning
Thinning is carried out to create good conditions for the best trunks and ensure optimal growth for the stock. Forwood estimates that a total of three thinning will be carried out along the rotation. Thinning are both commercial and non-commercial (Figure 30).
Figure 30. Boles from first thinning.
2.8.7. Final felling
Forwood estimates that final felling will take place 18 - 20 years after initial planting.
64

3. MATERIALS AND METHODS
Two different trials were carried out in the Darién province, Panama, to study how silvicultural managements like prune and thinning affect the growth of 3 year’s old Tectona grandis:
- Trial 1: Pruning and first thinning (Daiana Martín).
- Trial 2: Different intensities of first thinning (María Inés León). Each trial was carried out in different plots located in the same area.The plots were established during the period of the 12 to the 23rd of October, 2009. The experiments were visited and measured in two moments: in October 2009 and 6 months later in April 2010. The experimental field is situated 8 km north east from Agua Fría in the Darién Province, see Figure 31 (red arrow).
Figure 31. Re-forestation projects in Panama. Trial location. Source: Anam, 2010 At the moment of the study, all the trees were 3 years old (2006 afforestation) and the planting space was 3 x 3 m (1111 trees/ha). The seed origin is unclear. The terrain has 5 - 8 % slope gradient.
3.1 Stand management before the experiments installation
The primary treatments implemented during the first two years of the plantation were weeding, together with the removal of secondary apical shoots during the first year. The removal of the weeds was done manually up to 2009, when cattle were introduced in the afforestation. The first pruning up to 3 m was done in July-August 2009.
65

3.2 Work in the field
3.2.1 Edaphic characterization of the trials site
To determine the type of soils in the area where the trials are situated, two type of analysis were carried: site analysis and laboratory analysis. For the visual analysis, 3 pits of 1m x 1m were dug in different slope positions, low, medium and high (Figure 32). The characteristics observed in the soils of each pit site were: Color Texture (loam, sand, clay) Horizon depth Roots Drainage For the laboratory analysis 2 samples were taken from each pit for phyisical and chemical characterization in IDIAP Panama (sample 1: at 30 cm; sample 2: 40-60 cm). The laboratory characteristics studied were: - pH - Content of sand - Content of clay - Content of loam - Ca - K - Organic Matter (O.M.) The soil description and the information obtained from the laboratory analysis are shown below. It was complemented and compared with literature from FAO about soils that can be found in this area, using United State Department of Agriculture (USDA) Soil taxonomy and the Natural Resource Conservation Service.
66

Pit Nº1. This pit was done in Plot Nº1. Table 19 shows the site soil visual description and table 20 the laboratory analysis. Table 19. Site soil visual description Pit 1. Plot 1 (cm) Horizons Color (Dry) Texture Drainage Roots 0 - 4 O Dark Organic Moderately
well drained
Few coarse roots up to 40cm depth, fine roots up to 90 cm
4 - 30 A Light olive brown Sandy Clay Loam
30 - 100 B Pale yellow Clay Table 20. Laboratory Analysis Pit 1. mg/l Cmol/kg Sample %Sand %Loam %Clay pH P K Ca Mg Al C1B (20-30cm) Horizon A 50 20 30 6,8 10 220 20,65 5,58 0,2
C1C (60-80cm) Horizon B 34 20 46 5,3 12 180 16,95 3,17 0,1
Laboratory Analysis Pit 1 (cont.). mg/l Sample %O.M. Mn Fe Zn Cu C1B (20-30cm) Horizon A 2,28 4 16 1 1
C1C (60-80cm) Horizon B 0,28 2 19 1 1
Figure 32. Pit Nº1 October 2009 (left); Pit N°1 April 2010, dry season (right).
1 m
67

Pit Nº2: Pit Nº2 was done in Plot 9 (Figure 33) Table 21 shows the site soil visual description and table 22 the laboratory analysis. Table 21. Visual soil description Pit 2. Horizons Color (Dry) Texture Drainage Roots
0 - 4 O Dark Organic Moderately well drained
Few coarse roots up to 30 cm depth. Few fine roots up to 80 cm depth.
4 – 70 A Light olive brown Sandy Clay Loam
70 – 100 B Pale yellow Clay Table 22. Laboratory Analysis Pit 2. mg/l Cmol/kg Sample %Sand %Loam %Clay pH P K Ca Mg Al C2B (30 cm) Horizon A 38 22 40 7 17 260 16.7 3.92 0.2 C2C (60-80 cm) Horizon B 34 20 46 6.8 15 98 12.8 5.75 0.2
Laboratory Analysis Pit 2 (cont.). mg/l Sample %O.M. Mn Fe Zn Cu C2B (30cm) Horizon A 3.68 7 25 3 1 C2C (60-80cm) Horizon B 0.47 3 22 1 1
Figure 33. Pit N°2. October 2009.
68

Pit Nº3 Pit Nº 3 was done in Plot 21 (Figure 34 and 35) Table 23 shows the site soil visual description and Table 24 the laboratory analysis. Table 23. Site soil visual description Pit Nº3. Horizons Color (Dry) Texture Drainage Roots Moderately
well drained Few coarse roots up to 20 cm depth. Fine roots up to 90 cm.
0 - 4 O Dark Organic 4 - 60 A Greyish brown Clay
60 - 100 B Pale yellow Clay Table 24. Laboratory analysis Pit Nº3. mg/l Cmol/kg Sample %Sand %Loam %Clay pH P K Ca Mg Al C3B (20-30cm) 38 16 46 6.2 6 200 20.6 5.17 0.2 C3C (70-80cm) 40 22 38 5.2 4 212 22.15 5.83 0.1
Laboratory analysis Pit Nº3 (cont.) mg/l Sample %O.M. Mn Fe Zn Cu C3B (20-30cm) Horizon A 2.28 3 20 1 1 C3C (70-80cm) Horizon B 0.47 3 18 1 1
Figure 34. Pit Nº3 October 2010
Figure 35. Pit Nº3, April 2011 Water appeared at 70 cm depth
.
69

Every soil pit presented green spots in the lower layers (50 – 100cm), which indicates lack of oxygen. Differences in texture, organic matter, pH and root development between the three pits were found. In pit Nº1, low/ medium topographic position, it was found more sand in horizon A than in the other pits. The pH was 6.8 and coarse roots were found down to 40 cm depth. In pit Nº 2 was found the highest pH (7) and more organic matter than in the others (3.68), more clay than pit Nº 1 and coarse roots were found up to 30 cm. In Pit Nº 3 were found coarse roots up to 20 cm, more clay than pit 1 and 2 and the pH is 6.2 in the horizon A and 5.2 in horizon B, this could affect the development of the coarse roots being the exploration inferior than in pits Nº1 and Nº2. The horizon A of each pit has a proper pH level for teak (Table 25). Table 25. Summary table of each pit. Horizon Pit Nº1 Pit Nº2 Pit Nº3 Topographic position Low/ medium High Medium
Depth analysis (cm) A 25 30 25 B 70 70 75
pH A 6.8 7.0 6.2 B 5.3 6.8 5.2
O.M (%) A 2.28 3.68 2.28 B 0.28 0.47 0.47
Sand (%) A 50 38 38 B 34 34 40
Loam (%) A 20 22 16 B 20 20 22
Clay (%) A 30 40 46 B 46 46 38
Roots characteristics
Few coarse roots up to 40cm depth, fine roots up to 90 cm
Few coarse roots up to 30 cm depth. Few fine roots up to 80 cm depth
Few coarse roots up to 20 cm depth.
According to the results of the site and laboratory analysis and based on the Soil Taxonomy description (FAO, 1978) the soil where the trials were set, could belong to the Order Mollisol, sub order Paleudol. These soils are shallow to moderately deep, with mollice piped on, developed in volcanic and sedimentary materials, have darkened surface horizons, structured, well-developed granular friable and adequately supplied with bases, mainly Ca and Mg. Present topography varies from gently sloping to extremely steep. Large Group Paleudol Mollisols profiles evolved and are genetically well characterized by the presence of an argillic horizon.
70

3.2.2. Trial 1: Pruning and first thinning
The experimental design was complete randomized blocks with four treatments and three replications on the low, medium and high topographic position (Table 26). The terrain has 5 - 8 % slope gradient. In total 1728 trees were marked and measured. The treatments, with 3 replications each, were: 3 m pruning with 35 % thinning 3 m pruning without thinning 5 m pruning with 35 % thinning 5 m pruning without thinning Table 26. Topographic placement, thinning and pruning form of each plot. Treatments Topographic
placement Thinning Pruning (m) Plot Nº 8 low yes 5 11 low no 5 18 low no 3 19 low yes 3 12 high no 5 14 high yes 3 16 high yes 5 17 high no 3 13 medium no 3 15 medium yes 5 20 medium no 5 21 medium yes 3 The percentage of thinned trees was 35% of the original number (1111 trees ha-1).This percentage includes the trees that were dead. According to basal area the removed area was 15 %.
71

3.2.3. Trial 2: Different intensities of first thinning
The experimental design was complete randomized blocks with 4 treatments and three replications. The treatments were - No thinning
- Thinning 25% of stem number - Thinning 35% of stem number - Thinning 45% of stem number
The number of removed trees was based on initial stem number. The percentages of thinning include the trees that were absent in the plots (Table 27). Table 27. Percentage of removed trees according to the number of plot.
In all the plots regular pruning up to 3 m has been done after the thinning.
3.2.4. Trials design
In both trials the plots were square shaped, 36 m x 36 m (1296 m2) and each plot contained 144 planting spots. Although each planting spot should represent a tree, in certain plots there was only a space with no tree, as the tree died before. A buffer zone of one line was included all around each plot. This line received exactly the same treatment as the plot it was bordering. The effective plot contained 100 trees, starting in the tree Nº14 and ending in the tree Nº131 (Figure 36). The area of the effective plot is 900 m2. Each treatment has three replications.
Plot
Treatment (removed % of stem number)
Treatment (removed % of basal area)
Initial n° of trees per effective plot
Final n° of trees per effective plot
1 45 30 91 55 2 35 20 87 65 3 25 15 88 75 4 45 30 80 55 5 25 15 90 75 6 35 20 86 65 7 35 20 88 65 9 25 15 88 75 10 45 30 85 55 13 No thinning No thinning 80 80 17 No thinning No thinning 77 77 18 No thinning No thinning 90 90
72

Figure 36. Plot design.
3.2.5. Measurements
In the first visit to the experiments (October, 2009), every tree in all plots was permanently marked with a tree number and the position for diameter measurement (Diameter at Breast Height DBH, 1.3 m above ground). After this, all the diameters were measured in two opposite directions at the same level using a caliper (Figures 37 and 38).
Figure 37. DBH with calliper.
1 plot 1296m2 144 trees/plot
12 13 36 37 60 61 84 85 108 109 132 133
11 14 35 38 58 62 83 86 107 110 131 134
10 15 34 39 58 63 82 87 106 111 130 135
9 16 33 40 57 64 81 88 105 112 129 136
8 17 32 41 56 65 80 89 104 113 128 137
7 18 31 42 55 66 79 90 103 114 127 138
6 19 30 43 54 67 78 91 102 115 126 139
5 20 29 44 53 68 77 92 101 116 125 140
4 21 28 45 52 69 76 93 100 117 124 141
3 22 27 46 51 70 75 94 99 118 123 142
2 23 26 47 50 71 74 95 98 119 122 143
1 24 25 48 49 72 73 96 97 120 121 144
73

Figure 38. Plot nº 8 (P8). First file (F1), tree Nº 1. Red mark at 1.30 m where diameter was measured. Total heights were measured to ten trees of each plot, belonging to six different diameter classes, using a Suunto height meter. In each class it was calculated the average height which was assigned to all the trees according to the corresponding diametrical class (Table 28). The plots were geo-referenced with GPS (Garmin). Table 28. Average height in October 2009 and April 2010 per diameter class.
3.2.6. Criteria for thinning decision
In both trials the criteria for the thinning was adjusted with the technicians of the enterprise. The objective was to retain for final felling the trees which showed good quality potential by considering rectitude, higher diameters and the ones not affected or the least affected by diseases.
Diameter class (cm)
Average height October 2009 (m)
Average height April 2010 (m)
Up to 7.9 7.7 8.5 8 to 9.9 10.4 10.7 10 to 11.9 10.5 10.8 12 to 13.9 11.5 11.9 14 to 15.9 12 12.3 16 and more 13 13.9
74

The trees that were removed in both trials were the ones with poor quality, twisted basal log, broken, forked, not well shaped trees, suppressed or wounded. In each treatment, the number of trees to be removed for each thinning percentage was calculated with the following formula:
100* RNT = ( )SN −−
Where: T = Number of trees to remove N = Number of planted trees in the plot =144 R = Percentage of trees to be removed S = Number of standing trees The trees for thinning were marked with blue paint (Figure 39).
Figure 39. October 2009, blue marks in trees to be removed Nº46 and 44. An even distribution of the remaining trees in the plot was attempted according to the possibilities because of the absent trees.
75

3.2.7. Stem damages characterization
The remaining trees in the plot were characterized according to the observed damage (Table 29). Table 29. Characterization of observed stem damages. Characterization Undamaged Crooked Leaning Crooked upper (crooked from the second log up) Crooked + leaning Crooked upper + leaning The following pictures show some of the identified damages:
Figure 40. Leaning tree.
76

Figure 41. Tree Nº 23, crooked tree.
Figure 42. Tree Nº 3, crooked in the upper part. The thinning was carried out with chainsaw.
77

3.3 Calculations
3.3.1 Form Factor
An average Form Factor was calculated with some of the thinned trees using the formula below, where the real volume was calculated measuring each log of the stems.
( ) LdDVr
VaVrFF
×+×=
=
22
8π
HtDBHVa ××= 2
4π
Where: FF = Form Factor Vr = Real Volume Va =Apparent Volume D =Largest diameter d =Smallest diameter L = Log length DBH =Diameter at breast height Ht =Total Height
3.3.2 Tree growth increment
With the data of diameter, height and form factor were calculated the increment of height, basal area and volume per plot and per hectare for each treatment of the different trials.
3.3.3 Volume prediction model
The obtained data was used to determine if an existing model for estimating volume which was developed for Costa Rica by Diego Pérez and Markku Kaninnen, can be used in the Darién region of Panama. The volume of every tree was calculated using the following formula: Where: Vob = volume over bark BA= basal area H = total height FF = form factor
FFHBAVob ××=
78

The results were compared with the volume model using only dbh, with the following formula:
3.4 Statistics analysis
The data of basal area and volume, height and diameter increment for the different treatments was compared by Tukey analysis using a significance level of 5% (α=0.05). The GLM procedure Type IV was used to analyse the effect of treatments on basal area and volume per hectare. The GLM procedure uses the method of least squares to fit data to general linear models. The SAS program was used to compare the mean increment between treatments for each of the analyzed variables, Excel for the tables and R for the box-plot and frequency diagrams. The SAS program results are shown in the appendix. The hypothesis to be proved is that there are differences in mean increments, and that this is explained by the effect of the different treatments.
2)0297.00884.0( dbhVob ×+−=
79

4. RESULTS
4.1 Trial 1. Pruning and first thinning
4.1.1. Pruning effect on tree height, diameter and volume increment
The objective of this experiment was to analyze whether pruning and thinning 15 % of the basal area affects teak growth in a 3 years old teak plantation situated in the Darien Province, Panama. This was obtained comparing the average increment in diameter and in height, the total volume per tree and the mean annual increment between treatments. According to the Tukey analysis, the analyzed variables had no significant difference between treatments with a confidence level of 95%. After six month, the DBH diameter increased between 0.3 cm in 5 m pruned trees without thinning to 0.7 cm in the ones that were thinned. Although as it was mentioned the differences are not significant, trees thinned had in average higher diameter increments (Table 30). Table 30. Teak average diameter in centimetres before and after thinning, and increment according each treatment.
Treatment Average DBH diameter (cm) October 2009 April 2010 Increment
3 m pruned with thinning 10.6 11.3 0.7 3 m pruned without thinning 10.3 10.7 0.4 5 m pruned with thinning 10.4 11.1 0.7 5 m pruned without thinning 11.1 11.4 0.3
The average height after 6 months also did not show differences between treatments. The increment was similar between treatments with values from 0.4 to 0.5 meters. This could be expected in advance thus total height in trees is related with the site conditions (Table 31). Table 31. Teak average height in meters before and after thinning, and increment according each treatment.
Treatment Average height (m) October 2009 April 2010 Increment
3 m pruned with thinning 10.6 11.1 0.5 3 m pruned without thinning 10.5 10.9 0.4 5 m pruned with thinning 10.6 11.2 0.5 5 m pruned without thinning 10.8 11.2 0.4
80

In the following box plot diagram, the volume increment per tree and treatment could be observed. Treatment A is control, 3 m pruned without thinning, B corresponds to 3 m pruned with thinning, C 5 m pruned with thinning and D 5 m pruned without thinning. The increments are quite similar with no statistics differences in between. Although the median in all the box has the same behaviour, when thinning and pruning is done it could be observed trees with outsiders upper growth (Figure 43).
Figure 43. Box-plot diagram using volume increment per tree in trial 1.
4.1.2 Mean annual increment
The mean annual increment also did not show statistical difference after six months. Under this essay conditions the increment was between 15.1 to 18.8 m3 ha-1year-1, corresponding the highest value with 5 m pruned without thinning (Table 32).
81

Table 32.Teak mean annual increment according each treatment.
4.2. Trial 2. Different first thinning intensities
4.2.1. Effect of treatments for diameter, height, volume increment per tree and mean annual increment
The objective of this experiment was to analyze whether removing 0, 15, 20, and 30 % of the basal area affects teak growth in a 3 years old teak plantation situated in the Darien Province, Panama. This was obtained comparing the average increment in diameter and in height, the total volume per tree and the mean annual increment between treatments. According to the Tukey analysis, the analyzed variables had no significant difference between treatments with a confidence level of 95%. Before thinning the average DBH diameter of the trial was between 10.3 to 10.7 cm and after from 10.7 to 11.6 cm. The increment in diameter six month later after thinning was between 0.4 cm, in the control that has no thinning, to 0.8 cm when 20 and 30 % or the basal area was removed. Although as it was mentioned the differences are not significant, trees thinned had in average higher diameter increments than the no thinned (Table 33). Table 33. Teak average diameter in centimetres before and after thinning, and increment according each treatment.
Treatment Average diameter (cm) Removed basal area (%) October 2009 April 2010 Increment 0 10.3 10.7 0.4 15 10.7 11.2 0.5 20 10.7 11.5 0.8 30 10.8 11.6 0.8
Treatment MAI m3 ha-1 year-1
3 m pruned with thinning 15.3 3 m pruned without thinning 15.4 5 m pruned with thinning 15.1 5 m pruned without thinning 18.8
82

The diameter distribution shows some differences after and before the thinning. As it could be seen in the next figure, the diameter frequency distribution has some differences between treatments. In the control without thinning, named A in the graph, the distribution after six months has a similar behavior. When a percentage of the basal area is removed, 15% in treatment B, 20% in C and 30% in D, the diameter distribution changes. After six month there are more trees belonging to the higher diameter classes, which means that the bigger diameter best shaped trees are the ones growing in the site.
83

. Figure 44. Diameter frequency per treatment before and after thinning in trial 2.
84

The average height after 6 months also did not show differences between treatments. The increment was similar between treatments with values from 0.4 to 0.6 meters. This could be expected in advance thus total height in trees is related with the site conditions (Table 34). Table 34. Teak average height in meters before and after thinning, and increment according each treatment.
Treatment Average height (m) Removed basal area (%) October 2009 April 2010 increment 0 10.5 10.9 0.4 15 10.6 11.1 0.5 20 10.6 11.2 0.6 30 10.6 11.2 0.6
The box- plot diagram shows the volume increment per tree according each analyzed treatment. The increments are quite similar with no statistics differences in between; however the median for each treatment has small differences after six months. Values went from 0.005 m3/tree in A, 0.006 m3/tree in B, 0.006 m3/ tree in C and 0.007 m3/tree in D. when thinning is done it could be observed trees with outsiders upper growth (Figure 45).
Figure 45. Box-plot diagram using volume increment per tree in trial 2.
85

4.2.2 Mean annual increment
The mean annual increment also did not show statistical difference after six months. Under this essay conditions the increment was between 15.4 to 17.7 m3 ha-1year-1, corresponding the highest value with 15% of the removed basal area (Table 35). Table 35. Teak mean annual increment according each treatment.
Treatment MAI Removed basal area (%) m3 ha-1 year-1 0 15.4 15 17.7 20 17.6 30 17.6
4.2.3. Stem characterization
Different stem forms were observed and characterized in order to analyse the heterogeneity, before and six month after thinning. The observed frequency for each form in all the trees in the trial and the evolution of these is presented in Table 36 and Figure 46. Table 36. Stem characterization observed frequency for the total number of trees before the thinning and six month after the thinning.
Before thinning Six month after thinning
Effective trees in the plot
Effective trees in the plot
Freq. % Freq. % Undamaged 405 39 405 49 Crooked 184 18 147 18 Leaning 21 2 18 2 Crooked upper 346 34 232 28 Crooked + leaning 66 6 24 3 Crooked upper + leaning 8 1 8 1 Total 1030 100 834 100
86
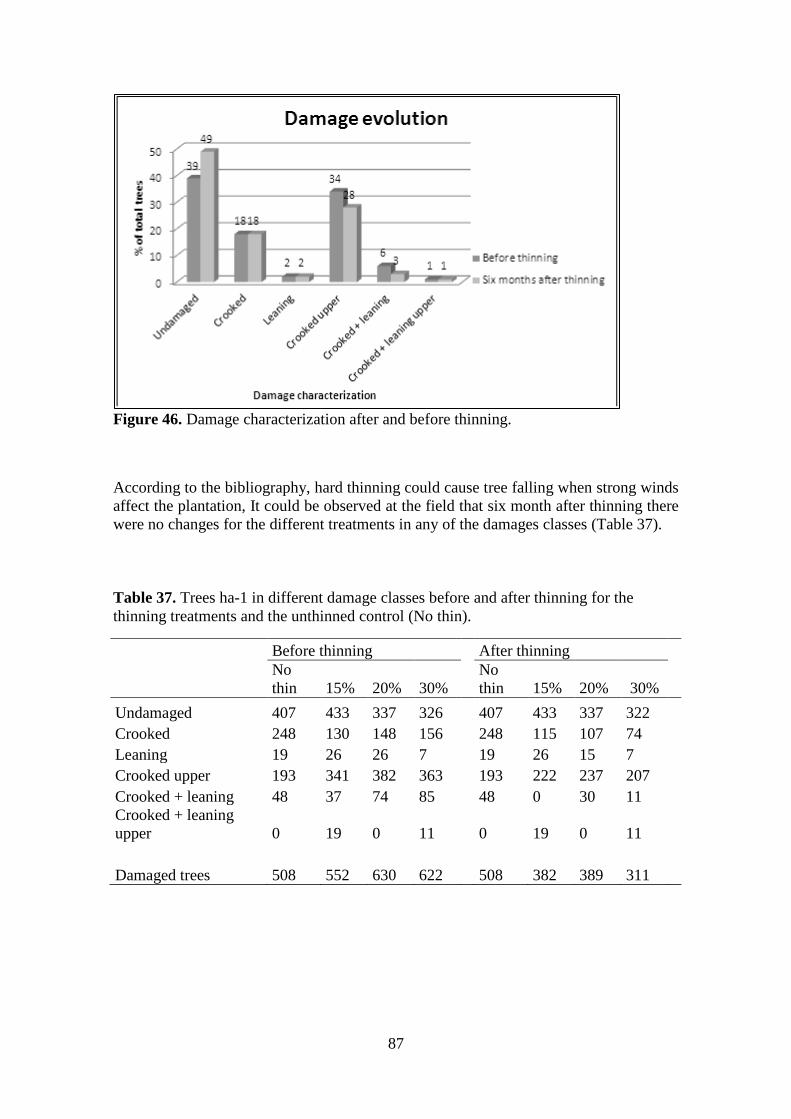
Figure 46. Damage characterization after and before thinning.
According to the bibliography, hard thinning could cause tree falling when strong winds affect the plantation, It could be observed at the field that six month after thinning there were no changes for the different treatments in any of the damages classes (Table 37). Table 37. Trees ha-1 in different damage classes before and after thinning for the thinning treatments and the unthinned control (No thin).
Before thinning After thinning
No thin 15% 20% 30%
No thin 15% 20% 30%
Undamaged 407 433 337 326 407 433 337 322 Crooked 248 130 148 156 248 115 107 74 Leaning 19 26 26 7 19 26 15 7 Crooked upper 193 341 382 363 193 222 237 207 Crooked + leaning 48 37 74 85 48 0 30 11 Crooked + leaning upper 0 19 0 11 0 19 0 11 Damaged trees 508 552 630 622 508 382 389 311
87

4.3. Volume prediction model
The adjustment of the observed volume with the predicted showed an high R2 value of 0.9921 (Figure 47).
Observed volume (m3)
Figure 47. Adjustment between observed volume data in Darien province (Panama) and predicted volume using Diego Pérez and Markku Kaninnen volume model for teak in Costa Rica.
Est
imat
ed v
olum
en (m
3)
88

5. DISCUSSION
The volume analysis showed that in October 2009 before the thinning, the teak plantation in Darién had a MAI of 16.8 m3ha-1year-1(1), demonstrating that the growth on this site is over the average that was found in 2003 by Osorio and Ugalde, 15.8 m3ha-
1year-1, in a study made in Panama with trees under 5 years. In view of this value the experiment site could be considered a good site for growing teak (Table 38 in the Appendix). Picado (1997) mentioned that values of MAI in dbh over 3.1 cm and 3.1 m in height correspond to an excellent site for growing teak. According to this, the plantation used for the trials could be considered an excellent place for growing teak as in this site the MAI reached 3.5 cm in dbh diameter and 3.6 m in height. Considering that Tectona grandis is a species which wood price is given for it quality, it must be applied silvicultural management from early stages. The growth analysis for the different variables analysed in both trials did not show significant differences between treatments in a six month period. The reference period was October 2009 – April 2010 which match with the dry period or winter time, when trees grow less due to low precipitation (Figure 3). Therefore, the time between measurements was not long enough to determine with accuracy which treatment would be the most appropriate. The time period between the measurements should be at least one year, so as to include both dry and rainy season. However according to the visual observations and literature review, it is possible to suggest which of the proposed managements should be applied in this plantation. Trial 1, the pruning and thinning experiment, did not show significant difference in growth variables in the given time (6 month). Nevertheless, pruning up to 5 meters is probably a recommendable treatment since there was no tendency for a negative effect in growth as a consequence of pruning. By doing this early pruning, a positive effect on wood quality will be achieved. The early pruning will result in a large proportion of clear bole at a low cost because the total lift is done in one pruning and branches are small at pruning. However, additional pruning may also need to be carried out in the future to obtain more proportion of clear boles and higher prices. In addition, sprouts need to be removed as they may develop into branches if left on the stem. According to Courraud and Hubert (1988), pruning is a necessary investment, because it will increase the price when standing wood and sawn wood are sold and also the timber is easier to sell. The wood price is the result from the quality of the wood as the presence or absence of external visible defects. Furthermore, the yield in sawnwood is connected to straightness and cylindricity of the log, absence of knots, internal defects, the effective length and diameter. An early pruning has advantages besides its effect on timber quality and cost. It improves the access to young plantations for pest and disease control and it also improves the apical dominance and form of the tree.
1 Based on the supposed that in twelve months growth is almost twice the registered in six months.
89

In trial 2, different thinning intensities, initially 14% of the total number of trees was already absent when the experiment started in October 2009. From the effective trees in the plots, 60% presented defects and 40% of the trees had a good stem form as is showed in Table 36. The major percentages of damage observations were Crooked and Crooked upper. These defects affect the selection for final trees, as the tree shape is of major importance for obtaining good price. Eight percent of the effective trees were leaning and leaning and crooked. Even this seems to be a small percentage, it is of major importance because it did not only affect the damaged trees but also these were affecting the growth of neighbouring trees. All these factors were taken into account for selecting trees for thinning. The second thinning will be done selecting the bad shaped trees that will still be by that time in the afforestation. As it can be seen in Table 36, not all the trees with the worst defects were removed; this is explained by a spacing distribution fact which was determined by the absent trees. It was attempted not to leave big spaces without trees, considering that the plantation was set in a windy area. In Figure 46 is evidenced the less percentage of the crooked upper and crooked and leaning after the thinning. Moreover is important to highlight that none of the possible damages increased after the thinning, even if teak is regarded as a species prone to wind damage (Brown and Pandey, FAO 2000). The damage evolution was also analyzed according to the different treatments applied in the plantation as can be seen in Table 37. The results show after the thinning a better proportion of undamaged trees related with the damaged trees but no changes occurred regarding to this, six month after the thinning. The second thinning will probably be a commercial thinning according to the growth and canopy structure of these plots. If no pre-commercial thinning is done, a bigger percentage of removed trees in the commercial thinning will be damaged which reduces the value of the plantation. Results show that the plots with 30% removed basal area did not show higher increment in individual tree growth compared to lighter thinning. However, it is possible that tree growth in the thinned plots will increase in coming years, which will results in larger trees in future thinning and at clearcutting. But the result indicates that 30% removed basal area with thinning may not be heavy enough to have a significant effect on tree-growth so future studies should include even heavier thinning. In this study a treatment with a higher percentage of thinning was not allowed by the enterprise, as they were concerned about the possible wind damage and also they supposed that more light coming into the stand would affect the stems shape of the remaining trees. The canopy of the plantation was not 100% closed, so density may not yet being a factor affecting the growth of the individual trees in the same way as it will be when the stands are closed. This may be an additional explanation for the lack of statistical significant differences.
90

As a general result for both trials, it was seen that in this plantation, the origin of the seeds was probably not the same for all trees. One indication of this was that different bark structure was observed. There were trees which had very good initial growth and straightness whereas others were forked, twisted and crooked in the upper part. It is possible that some of the initial problems were related to seed origin. As it was mentioned in the literature review (Kaosa-ard, et al,1999 mentioned by Krishnapillai, 2000), an international provenance trial showed that the mean heritability value of stem straightness was as high as 0.83. This indicates how strongly provenance determines the character for stem straightness. The heterogeneity factor may affect the decision about thinning intensity since it is less necessary to remove bad trees in a homogeneous plantation. Making a good selection of provenance according to the site, could improve the success of the seedlings and also obtain better shaped trees, leading to a lighter first thinning. Teak it is a clonable species so this fact could contribute to improve the quality of the stands without losing volume production. In relation to the adjustment of the volume prediction model developed by Diego Pérez and Markku Kaninnen for Costa Rica in 2005, it was found that the model adjusts in a very high percentage with the observed data. The linear regression in all cases was over 90%, indicating that it can be used for calculating volume in the Darién region of Panama.
91

6. CONCLUSIONS AND RECOMMENDATIONS
The market for small wood from thinning is not good in Panama. Small wood is mostly used for fences and the price does not compensate the investment in thinning. So a good combination of site and provenance would help to enhance the good growth of the trees with silvicultural treatments without removing small trees out of the stand. Due to the given situation of the plots and considering the trees that were absent from the beginning and the growth results, a 30% removal of basal area at first thinning is recommended. With this thinning intensity, not only a reasonable percentage of the bad shaped trees will be removed but also there is an adequate space to promote growth of trees that will be removed in commercial thinning and clearcutting. According to the literature review, as teak is an heliophilous species (Hubert and Courraud, 1988; Vincent, 1975; Rojas and Torres, 1994, mentioned by Ugalde and Gómez, 2006) very wide spaces could affect the shape of the trees and promote the growth of coarse branches. In addition, sprouts may develop which need to be removed at a relatively high cost. On the other hand, Krishnapillai, 2001, mentioned that smaller trees are readily suppressed if stand density is too high. Therefore, plantations should be thinned regularly and heavily, particularly in the first half of the rotation. For this reason the best pruning and thinning method should be combined. Teak is a species planted for good quality timber, so proper site conditions, a good provenance selection and appropriate management must be done to achieve the best stem form, growth and wood quality. The site conditions found in the Darien province of Panama are probably good enough to achieve an acceptable teak tree development. Clonal plantation experiments using selected trees should be done in order to use the best individuals according to the available site conditions. A tree plantation for good quality timber is still new and under development in Panama. People who are in charge of doing the plantation, pruning and thinning should be prepared to manage the trees in a different way according to best practice. And this may require new management methods compared to current forest management in Panama. Pests and diseases are a potential risk when introducing new tree species in a region especially if the trees are stressed by water- or nutrient limitations. Management by natural enemies is one option but most important is to constantly monitor development of new pests and diseases. Pruning is required and it should be done in the best time for the trees not to be stress. Results from this study indicate that it is possible to prune up to 5 m height in a 3-year-old plantation without loosing volume-production. Since early pruning has several advantages, the 5 m lift at this age is probably a treatment that can be recommended. A thinning rate of 30% removed basal area will probably lead to increased growth of future crop trees resulting lower cost for harvest and higher price of the product. In
92

addition, thinning results in lower frequency of damaged trees which concentrates growth to the most valuable individuals. In the future, even more intensive thinning should be tried, but care must be taken to do these experiments in areas were wind damage is likely to occur. We recommend doing additional measurements and analysis of the experiments to verify the recommendations that has been put forward here. Moreover, it is recommended that Forwood do trials to test for appropriate provenances for a specific site conditions, and the products that are the final goal for the plantation and evaluate a higher thinning intensity in places with really bad shaped trees. This study indicates that stem volume of teak in Panama can be estimated using the available equations that Diego Pérez and Markku Kanninen developed for Costa Rica in 2005. The R 2 value of 0.992 shows a high adjustment between the predicted volume with the model and the real volume of each tree. Furthermore, since this model only uses the dbh over bark to calculate the volume of the stems, it is lighter work in the field to estimate volume in teak plantations. This is important considering that given the climate conditions, high temperatures, rain (rainy season) in the area, sometimes, it is hard to walk and work. See Figure 48.
Figure 48. Four wheel stuck in the mud.
Moreover, during the stay in the enterprise, it was realized that the people in charge of measuring, go by foot from stand to stand. And sometimes they did not count with appropriate instruments for making measurements.
93

The general impression after doing these trials in the Darién region of Panama and the available information about the region and teak plantations is that there is still a big lack of studies in Panama to find the appropriate provenances and adequate silvicultural treatments. Agreements between Universities and Research organizations and the enterprises would help to reach the best way to find solutions for the problems that sooner or later appear in exotic plantations.
94

7. REFERENCES
AKWASI, A.; OTENG-AMOAKO. 2004. Looking for quality. Ghana forest research institute. Kumasi. Ghana. 2p. Spanish. Available on: www.itto.int/direct/topics/topics_pdf.../topics_id=6680000&no=3 ALVARADO, A.; FALLAS, J. 2004. Saturation of acidity and liming on the growth of teak (Tectona grandis L. f.) in acid soils of Costa Rica. Magazine Agronomía Costarricense 28 (1): 81-87. Spanish. Summary. Available on: http://redalyc.uaemex.mx/pdf/436/43628108.pdf ALVARADO, A.; MOLLINEDO, M.; RUDY, L.; UGALDE, L.; VERJANS, J.M. 2005. Relation soil-tree and site factors in young teak plantations (Tectona grandis), in the West zone of the Panama canal basin. Magazine Agronomía Costarricense 29(1): 67-75. ISSN: 0377- 9424/2005. Spanish. Summary. Available on: www.mag.go.cr./rev_inicio.htm ALVARADO, A. 2006. Nutrition and Fertilization of teak. Informaciones Agronómicas. Magazine Nº 61: 1-8. Spanish. Summary. Available on: http://www.ipni.net/ppiweb/iaecu.nsf/$webindex/B5832D33FFB31A220525717300778B9D/$file/Nutrici%C3%B3n+y+Fertilizaci%C3%B3n+de+la+ Teca.pdf ARGUEDAS, M. 2004. Phytosanitary problems in teak (Tectona grandis L.f.) in Central America: New reports Research Center in Integration Forest - Industry, ITCR, Costa Rica. Spanish. Summary. Available on: http://www.una.ac.cr/inis/docs/teca/temas/M.pdf AUTORIDAD NACIONAL DEL AMBIENTE (ANAM). Available on: www.anam.gob.pa BADILLA. Y.; MURILLO.O. 2004. Vegetative propagation of teak in Costa Rica. Spanish. Summary. Available on: http://www.una.ac.cr/inis/docs/teca/temas/PropagOlman1.pdf BALL, J.B.; HIRAI, S.; PANDEY, D. 1999.Global Overview of Teak Plantations. Paper presented to the Regional Seminar Site, Technology and Productivity of Teak Plantations Chiang Mai, Thailand 26-29 January.14 p. Available on: http://www.fao.org/forestry/460206dd4a3ffc3583aae26be6c4cc5ef851a.pdf BHAT, K. M.; HWAN OK MA. 2004. ITTO Tropical Forest Update. Papers prepared for and presented at the ITTO/Kerala Forest Research Institute International Conference on Quality Timber Products of Teak from Sustainable Forest Management, 2–5 December 2003, Peechi, India. Available on: https:// www.itto.int/direct/.../topics_id=100666&no=5 CENTENO, J. 1997. The management of teak plantations. ITTO Tropical Forest Update, Volume 7, Nº 2. Available on: http://www.ciens.ula.ve
95

CHACKO.K.C.; NAIR, K.S.S.; SUDHEENDRAKUMAR.V.V.; VARMA.R.V. 1985. Studies on the seasonal incidence of defoliators and the effect of defoliation on volume increment of teak. KFRI Research Report 30. Peechi, Thrissur. 78p. Available on :http://www.kfri.org/ CHAVES, E. S.; FONSECA, W. G. 2003. Thinning and growth essays in teak plantations (Tectona grandis L.f.) in the Peninsula of Nicoya, Costa Rica. Instituto de Investigación y Servicios Forestales (INISEFOR) Universidad Nacional, Heredia, Costa Rica. Spanish. Summary. Available on: http://www.una.ac.cr/inis/docs/teca/temas/RAenTECA2.pdf CONTRALORÍA GENERAL DE LA REPÚBLICA DE PANAMÁ. 2010. Available on: http://www.contraloria.gob.pa/DEC/busqueda_rapida.aspx?IDPROV=05 DE GRACIA, E. ____. The rust of teak in Panama. Ministry of agricultural development. Available on: http://www.mida.gob.pa/sanidadvegetal/httpdocs/vigilancia/programas/pr og-roya-teca.html ETESA.2010. Available on: http://www.hidromet.com.pa/ FAO. 1978. Panama Republic – Integrated Development Proyect in the eastern region of Panama – Darién. Spanish. Available on: http://www.oas.org/dsd/publications/Unit/oea30s/begin.htm FAO.1987. A guide to forest seed handling with special reference to the tropics. FAO FORESTRY PAPER 20/2 compiled by R.L. Willan. Available on: http://www.fao.org/docrep/006/ad232e/ad232e00.htm FAO. 1998. Management of natural teak forest. Available on: http://www.fao.org/DOCREP/005/AC773E/ac773e07.htm FAO. 2000. BROWN, C.; PANDEY, D. Teak: a global vision. Unasylva, volume 51, Nº3. Spanish. Available on: ftp://ftp.fao.org/docrep/fao/x4565s/X4565s02.PDF FAO. 2002. Teak (tectona grandis) in Central America. Working Paper 19. Forest Resources Development Service, Forest Resources Division (on line).Available on: ftp://ftp.fao.org/docrep/fao/006/y7205e/y7205e00.pdf FAO. 2010. Teak resources and market assessment 2010. Available on: http://www.fao.org/docrep/015/an537e/an537e00.pdf FAO. 2010. Global forest resources assessment 2010. Main report. FAO forestry paper 163. Available on: http://www.fao.org/docrep/013/i1757e/i1757e.pdf FORWOOD GROUP. 2009. Available on:http://www.forwood.com/eng/plantations.asp
96

FORWOOD GROUP. 2010. Available on: http://www.forwood.com/eng/market-demand.asp http://www.forwood.com/eng/cultivated-teak-environment.asp GÓMEZ, M.; UGALDE, L. 2006. Economic and environmental perspective of teak plantations under sustainable management in Panama. Document produced and review by the U.S. Agency for International Development (USAID) and prepared by the Academy for Educational Development (AED) Available on: http://azueroearthproject.org/aep/wp-content/themes/green- love/reference_pdfs/ARC_applied_science/A.C1009_Ugalde_2006_spa.pdf INTERNATIONAL SOCIETY OF TROPICAL FORESTERS (ISTF).2009. Management of teak plantations for solid wood products. 25p. Reprinted with permission of the society of American foresters. Available on: http://www.istf-bethesda.org/specialreports/teca_teak/teak.pdf INTERNATIONAL TROPICAL TIMBER ORGANIZATION (ITTO). 2008. International pricing mechanism for plantation teak: a proposal to bring transparency to log markets. Keogh, R. Available on: http://www.bomenbelegger.nl/bomenbelegger/pdf%20bestanden/ITTO%20teakprijzen%202008.pdf INTERNATIONAL TROPICAL TIMBER ORGANIZATION (ITTO). 2009. Encouraging Industrial Forest Plantations in the Tropics. Report of a Global Study.Technical Series Nº 33. Available on: www.itto.int/direct/topics/...pdf.../topics_id=2165&no=0&disp=inline INTERNATIONAL TROPICAL TIMBER ORGANIZATION (ITTO). 2011. Status of tropical forest management 2011. Series Nº38. Avaliable on: www.itto.int/direct/topics/topics_pdf.../topics_id=2660&no=0&disp=inline INTERNATIONAL TROPICAL TIMBER ORGANIZATION (ITTO). 2011. Tropical timber market report. Volume 16. May 2011. Available on: http://www.itto.int/mis_detail/id=2661 KANNINEN, M.; MONTERO, M.;PÉREZ, D.; VÍQUEZ, E. 2004. Intensity and timing of the first thinning of Tectona grandis plantations in Costa Rica: results of a thinning trial. Forest Ecology and Management. Available on: http://www.aseanbiodiversity.info/Abstract/51003964.pdf KANNINEN, M. ; PÉREZ, D. 2003. Commercial volume estimation for different diameters and heights for Tectona grandis L. F. in Costa Rica. Revista Forestal Centroamericana 39:56–59. Spanish. Summary. Available on: http://web.catie.ac.cr/informacion/rfca/rev39_40/56_59.pdf KANNINEN, M.; PÉREZ, D. 2005. Stand growth scenarios for Tectona grandis plantations in Costa Rica, Forest ecology and management 210: 425-441
97

KAOSA-ARD, A.; KJǢR, E.; SUANGTHO, V. 1998. Experience from Tree Improvement of Teak (Tectona grandis) in Thailand. Available on: http://www2.sl.life.ku.dk/dfsc/pdf/Publications/Experience.pdf KEONAKHONE, T. 2006. A holistic assessment of the use of teak at a landscape level in Luang Phrabang, Lao PDR.MSc thesis. Uppsala, Sweden. Sveriges lantbruksuniversitet.112 p. KERALA FOREST REASEARCH INSTITUTE (KFRI). Clonal propagation of teak (Tectona grandis L.f.). Available on: http://www.kfri.org/main/res/res_teak.html KRISHNAPILLAI.B. 2000.Silviculture and management of teak plantations. FAOUnasylva - No. 201 - Teak - Vol. 51- 2000/2. Available on: http://www.fao.org/DOCREP/X4565E/x4565e04.htm#P0_0 KOBAYASHI, S; MAJID, .M.N.A.; MORI, T.;TOMA, T.; TURNBULL, J.W.1999. Rehabilitation of degraded tropical forest ecosystems. pp 151 – 155. Workshop proceedings, 2-4 November 1999, Bogor, Indonesia. Available on: http://www.cifor.org/nc/online-library/browse/view-publication /publication/919.html MATHEW, G. 1990. Biology and ecology of the teak trunk borer Cossus cadambae moore and its possible control. KFRI Research Report 68. Peechi, Thrissur. 41p. Available on: http://www.kfri.org/ MENDEZ, B. Hurricanes in Central America and Caribbean Region. Available on: http://www.academia.edu/1021798/Huracanes_y_Ciclones_en_Centroamerica_y_el_caribe_Compilacion_ MOHANADAS, K.; NAIR, K.S.S.; SUDHEENDRAKUMAR, V.V.1994. Development of a management strategy for teak defoliator, Hyblaea purea. KFRI Research report 95. Peechi, Thrissur. 121p. Available on: http://www.kfri.org/ MOHANADAS, K.; NAIR, K.S.S.; SUDHEENDRAKUMAR, V.V.; VARMA, R.V.1998. Establishment of permanent plots to demonstrate the effect of protected teak plantations from the teak defoliator. KFRI Research Report 163. Peechi, Thrissur. 15p. Available on: http://www.kfri.org/ NAIR.K.S.S.; 1982.Seasonal incidence, host range and control of the teak sampling borer,Sahyadrassus malabaricus.KFRI Research Report 16. Peechi, Thrissur. 36p. Available on:http://www.kfri.org/ ORGANIZATION OF AMERICAN STATES (OAS). 2010. Available on: http://www.oas.org/dsd/publications/unit/ oea30s/ch035.htm
98

PANNet. Technologic University of Panama. 2010. Available on: http://www.pa/ PANIAGUA. A.; RODRÍGUEZ. A.______ Liming and fertilization in Tectona grandis(Teak) in the northen región of Huetar in Costa Rica. Nacional University, Heredia, Costa Rica. Spanish. Summary. Available on: http://www.una.ac.cr/inis/docs/teca/temas/Amelia2.pdf PÉREZ, D; VÍQUEZ, E. 2005.Effect of pruning on tree growth, yield, and wood properties of Tectona grandis plantations in Costa Rica. Silva Fennica 39(3): 381–390. PICADO, W. 1997. Literature review and experience in Costa Rica about forest plantations management, with enphasis in the northern región of Huetar, Costa Rica. Spanish. http://www.ots.ac.cr/bnbt/11304.html SAS Institute Inc.,SAS/STAT® User’s Guide, Version 8, Cary, NC: SAS Institute Inc., 1999) Available on: http://www.okstate.edu/sas/v8/saspdf/stat/chap30.pdf UGALDE, L.; VÁSQUEZ, W. 1995. Yield and site quality for Gmelina arborea, Tectona grandis, Bombacopsis quinatum y Pinus caribaea in Guanacaste, Costa Rica. Spanish. Summary. Available on: http://orton.catie.ac.cr/repdoc/A4359E/A4359E.PDF VALLEJOS O.S. 1996. Productivity and relationships of the site index with fisiographics, edafoclimatic and foliar variables for Tectona grandis L.F., Bombacopsis quinatum (Jacq.) Dugand and Gmelina arborea Roxb. in Costa Rica. Spanish. Summary. Available on: http://dspace.utalca.cl/handle/1950/3470 WEAVER, P. L. 1993. Tectona grandis L.f. Teak.SO-ITF-SM-64. New Orleans, LA: U.S. Department of Agriculture, Forest Service, Southern Forest Experiment Station. 18 p. Available on: http://www.fs.fed.us/global/iitf/Tectonagrandis.pdf.
99

8. APPENDIX
Table 38. Percentage of absent trees, average diameter and height before and after thinning and total volume at the beginning of the experiment according the number of plot.
Nº Plot
Absent trees (%)
Average diameter (cm) Average height (m) Total volume (m3) October 2009
October 2009
April 2010
Increment October 2009
April 2010
Increment per hectare
m3 ha -1 year -1 April-
october April-october
Total 16 10,6 11,2 0,6 10,6 11,1 0,5 50,4 16,8 1 9 11,4 12,0 0,6 10,9 11,4 0,5 63,1 21,0 2 13 11,1 12,0 0,8 10,7 11,4 0,7 57,6 19,2 3 12 11,4 12,0 0,6 10,8 11,4 0,6 61,2 20,4 4 20 9,9 10,6 0,7 10,4 10,9 0,5 40,9 13,6 5 10 10,3 10,8 0,5 10,4 10,9 0,5 49,4 16,5 6 14 10,7 11,6 0,9 10,7 11,2 0,6 52,5 17,5 7 12 10,2 10,8 0,6 10,3 11,0 0,6 47,9 16,0 8 13 10,6 11,1 0,5 10,7 11,3 0,5 52,2 17,4 9 12 10,4 10,9 0,5 10,5 11,0 0,5 48,8 16,3 10 15 11,0 12,1 1,1 10,6 11,4 0,8 54,4 18,1 11 11 10,9 11,1 0,2 10,8 11,2 0,4 56,7 18,9 12 13 11,1 11,4 0,3 10,7 11,1 0,4 57,8 19,3 13 20 10,8 11,2 0,3 10,7 11,1 0,4 50,9 17,0 14 24 10,5 11,2 0,7 10,6 11,1 0,5 43,2 14,4 15 23 11,0 11,9 0,9 10,8 11,4 0,6 50,3 16,8 16 29 9,6 10,2 0,6 10,4 10,8 0,4 33,7 11,2 17 23 10,4 10,8 0,5 10,6 11,0 0,4 44,2 14,7 18 10 9,7 10,1 0,5 10,2 10,7 0,4 43,5 14,5 19 20 10,9 11,4 0,5 10,8 11,2 0,4 50,5 16,8 20 19 11,2 11,6 0,4 10,9 11,3 0,4 55,0 18,3 21 23 10,4 11,2 0,8 10,4 11,1 0,7 43,7 14,6
100