management quality and carbon performance of steel … · this report contains our assessment of...
TRANSCRIPT

@tp_initiative transitionpathwayinitiative.org
MANAGEMENT QUALITY AND CARBON PERFORMANCE OF STEEL MAKERS: A COMMENTARY Thursday 21st September 2017
Simon Dietz, Carlota Garcia-Manas, William Irwin, Bruno Rauis, Rory Sullivan and Jeremy Sung

2
CONTENTS
Executive summary .............................................................................................................. 3
1. Introduction .................................................................................................................. 6
1.1. The Transition Pathway Initiative ................................................................................................ 6
1.2. About this report and the companies assessed ........................................................................... 6
2. An overview of the methodology .................................................................................. 8
2.1. Management quality ................................................................................................................... 8
2.2. Carbon Performance ................................................................................................................. 10
2.3. Quality assurance ..................................................................................................................... 11
3. Findings .......................................................................................................................13
3.1. Management quality ................................................................................................................. 13
3.2. Carbon performance ................................................................................................................. 17
3.3. The association between management quality and carbon performance .................................. 21
4. Summary .................................................................................................................... 23
4.1. Summary of the results ............................................................................................................. 23
4.2. Limitations................................................................................................................................ 24
5. Disclaimer ................................................................................................................... 25
Appendix 1 TPI management quality indicators ................................................................. 26
Appendix 2 Detailed assessment of companies’ management quality ............................... 29
Bibliography ........................................................................................................................31

3
EXECUTIVE SUMMARY
The Transition Pathway Initiative (TPI) is a global, asset owner-led initiative, supported by asset owners and managers with over £4/$5.2 trillion of assets under management. The initiative assesses how companies are preparing for the transition to a low-carbon economy, focusing on two elements:
1. Management Quality: the quality of companies’ management of their greenhouse gas emissions and of risks and opportunities related to the low-carbon transition.
2. Carbon Performance: how companies’ carbon performance now and in the future might compare to the international targets and national pledges made as part of the Paris Agreement.
This report contains our assessment of the management quality and carbon performance of the global top 20 steel makers, selected on the basis of market capitalisation.
Our management quality assessment rates companies on 14 indicators, covering such issues as whether the company has a policy on climate change, the extent of its emissions disclosures and targets, and whether climate change is demonstrably a boardroom issue. Companies are placed on a staircase comprising five levels, from failure to acknowledge climate change as a business issue at the bottom (Level 0), to strategic assessment of the risks and opportunities of climate change at the top (Level 4).
Figure ES1 Management quality of the world's top 20 steel makers
LEVEL 0
UNAWARE / NOT ACKNOW-LEDGING
LEVEL 1
ACKNOWLEDGEMENT
LEVEL 2
BUILDING CAPACITY
LEVEL 3
INTEGRATED INTO OPERATIONAL DECISION-MAKING
LEVEL 4
STRATEGIC ASSESSMENT
Acerinox
Arcelor Mittal
China Steel
Hyundai Steel
Posco
Tata Steel
Bluescope Steel
Companhia Siderurgica Nacional
Erdemir
JSW Steel
Voestalpine
Gerdau
JFE Holdings
Kobe Steel
Nippon Steel & Sumitomo Metal
Nisshin Steel
Severstal
Tenaris
Novolipetsk Steel
Nucor
Steel makers’ average management quality score is 1.8 (on a scale of 0-4), which is the lowest of the 5 sectors assessed by TPI so far. In comparison, the average score of the top

4
20 or so companies in the cement, coal mining and oil and gas sectors was 2.1, while in the electricity utilities sector it was 2.6. As Figure ES1 shows, 9 steel makers are on Levels 0 or 1, while only one company, the Spanish steel maker Acerinox, makes it to Level 4.
The steel makers follow other sectors in performing better on the less demanding Level 0-2 indicators than they do on the more demanding Level 3-4 indicators. Performance is notably weak on board oversight of companies’ climate change policies, and there is a lack of quantitative targets to reduce companies’ operational greenhouse gas emissions.
This report also provides an in-depth assessment of the carbon performance of these steel makers. We translate greenhouse gas emissions targets made at the international level into appropriate benchmarks, against which the performance of individual companies can be compared, using the Sectoral Decarbonization Approach. We use modelling from the International Energy Agency to derive benchmark global carbon emissions intensity pathways for steel makers, which are consistent with:
1. A 2 Degrees scenario, commensurate with the overall aim of the Paris Agreement to limit global warming to below 2°C.
2. A Paris Pledges scenario, reflecting the global aggregate of emissions reductions actually pledged by countries as part of the Paris Agreement in the form of Nationally Determined Contributions or NDCs.
Based on public disclosures, we are able to estimate the carbon intensity of steel production for 13 of the global top 20 steel makers today. Seven companies make insufficient disclosures for us to estimate carbon performance using our chosen metric of Scope 1 and 2 greenhouse gas emissions per unit of crude steel production. Across the sector, inconsistent and incomplete reporting of emissions and production volumes is a particular challenge.
We estimate companies’ future carbon intensity on the basis of quantitative targets they have set themselves to reduce emissions. Only 6 out of 20 companies have set such targets. None of these targets extends beyond 2020 and one is only for 2017, which means that it is particularly difficult to form a clear view of the direction of carbon performance in the steel sector.
We find that 8 out of the 13 steel makers disclosing sufficient data on emissions per unit of steel production are aligned with the benchmarks today; their carbon intensity is lower. The average carbon intensity of these 13 companies is also below the benchmarks today. However, there is considerable variation within the group, likely based on differences in steel production route/technology relied upon by the different companies.
Looking to the future, the trajectories of the 6 steel makers with quantitative emissions targets are, on average, aligned with both the Paris Pledges benchmark and the 2 Degrees benchmark. Of the 5 companies with targets for 2020, 3 are below both benchmarks, while the other 2 fall between the 2 Degrees and Paris Pledges benchmarks. However, we find that the 6 companies with targets have a lower average carbon intensity today than the 7 companies without targets, limiting the conclusions that can be drawn about the wider sector. In the steel sector, the Paris Pledges benchmark is relatively undemanding, allowing carbon intensity to increase between 2015 and 2020 and only requiring carbon intensity to be cut by 10% below the 2015 level by 2030. However, the 2 Degrees benchmark is demanding, with carbon intensity falling 39% below the 2015 level by 2030.
5
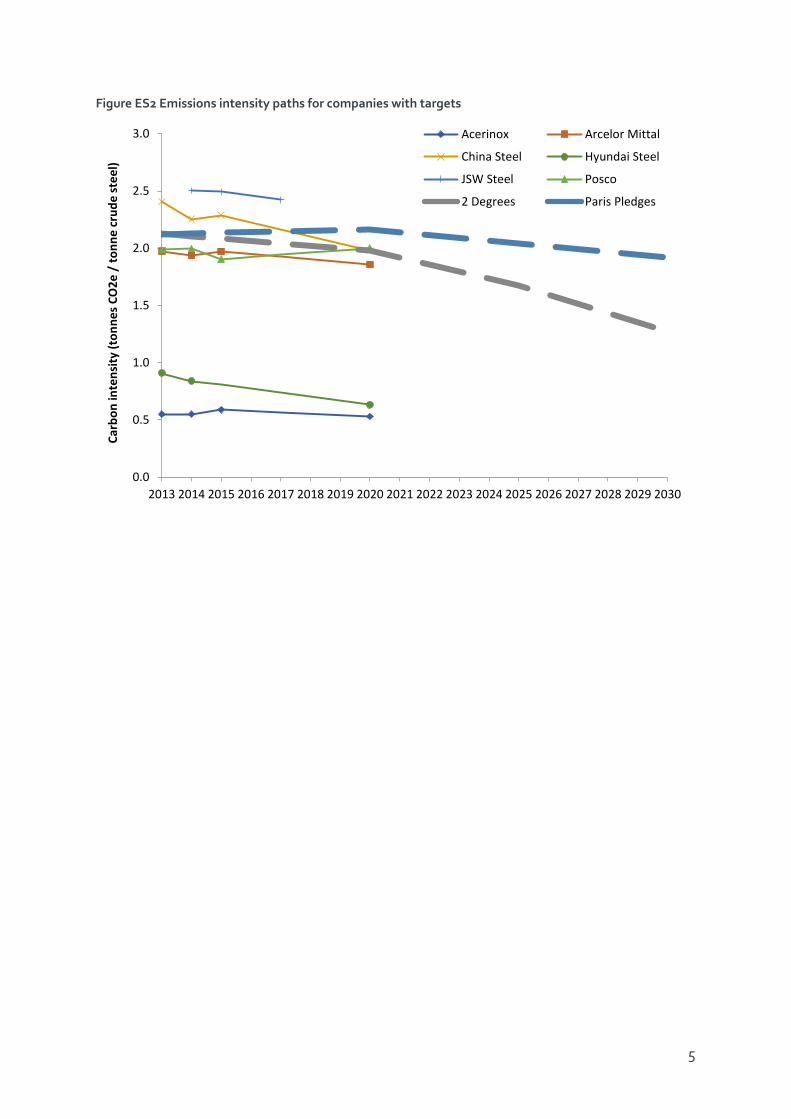
Figure ES2 Emissions intensity paths for companies with targets
0.0
0.5
1.0
1.5
2.0
2.5
3.0
2013 2014 2015 2016 2017 2018 2019 2020 2021 2022 2023 2024 2025 2026 2027 2028 2029 2030
Carb
on in
tens
ity (t
onne
s CO
2e /
tonn
e cr
ude
stee
l)
Acerinox Arcelor Mittal
China Steel Hyundai Steel
JSW Steel Posco
2 Degrees Paris Pledges

6
1. INTRODUCTION
1.1. The Transition Pathway Initiative
The TPI is a global, asset owner-led initiative, supported by asset owners and managers with over £4/$5.2 trillion of assets under management. The TPI aims to evaluate what the transition to a low-carbon economy looks like for companies in high-impact sectors, such as coal mining, electricity, oil and gas, and steel, and to assess how well-prepared companies in these sectors are for the transition to a low-carbon economy. Companies are analysed in two ways:
1. Management Quality: TPI evaluates and tracks the quality of companies’ governance/management of their greenhouse gas emissions and of risks and opportunities related to the low-carbon transition. Companies are assigned to one of five levels, from level 0 (“Unaware of, or not Acknowledging, Climate Change as a Business Issue”) to level 4 (“Strategic Assessment”), based on how they perform against 14 criteria.
2. Carbon Performance: TPI also evaluates how companies’ recent and future carbon performance might compare to the international targets and national pledges made as part of the Paris Agreement.
TPI publishes the results of its analysis through an open online tool hosted by the Grantham Research Institute on Climate Change and the Environment at the London School of Economics (LSE): http://www.transitionpathwayinitiative.org. TPI encourages investors to use the data, indicators and online tool to inform their investment research, decision-making, engagement with companies, proxy voting and dialogue with fund managers and policy makers, bearing in mind the Disclaimer that can be found in Section 5.
1.2. About this report and the companies assessed
This report discusses the results of the TPI assessment of the management quality and carbon performance of the world’s 20 largest steel producers, selected on the basis of market capitalisation.1
The companies that it assesses are set out in Table 1. Companies are listed in 13 different countries, with 4 based in Japan alone. Thirteen companies are classed as large cap, of which 5 have a market value in excess of $10 billion.
1 Companies are drawn from the iron and steel sector, as identified by Industry Classification Benchmark (ICB). Some steel production takes place in other sectors, such as diversified industrials, and it is not included in our report.

7
Table 1 Steel makers covered in this report, further details
Company Country Investibility-weighted2 market capitalisation (USD millions)
Acerinox Spain 2,075
Arcelor Mittal Netherlands 16,005
Bluescope Steel Australia 5,149
China Steel Taiwan 10,251
Companhia Siderurgica Nacional Brazil 2,701
Erdemir Turkey 2,116
Gerdau Brazil 3,555
Hyundai Steel Korea 3,991
JFE Holdings Japan 9,610
JSW Steel India 3,425
Kobe Steel Japan 2,891
Nippon Steel & Sumitomo Metal Japan 19,347
Nisshin Steel Japan 1,268
Novolipetsk Steel Russia 1,866
Nucor United States 19,316
Posco Korea 16,281
Severstal Russia 2,608
Tata Steel India 1,633
Tenaris Italy 8,077
Voestalpine Austria 4,838
The results of the assessment are also available to browse on the TPI’s online toolkit, at http://www.transitionpathwayinitiative.org. This report provides a more detailed analysis of the results, as well as a commentary.
2 Using FTSE Russell free-float methodology, as of 14 February 2017.
8
2. AN OVERVIEW OF THE METHODOLOGY
2.1. Management quality3
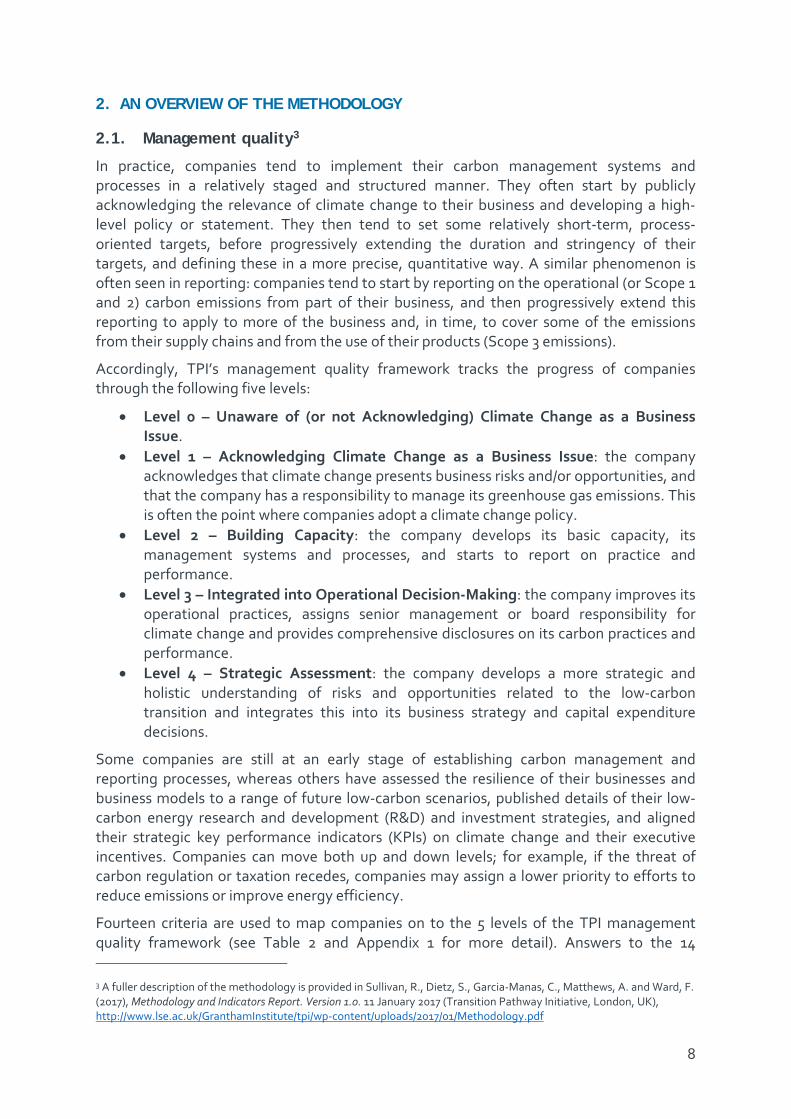
In practice, companies tend to implement their carbon management systems and processes in a relatively staged and structured manner. They often start by publicly acknowledging the relevance of climate change to their business and developing a high-level policy or statement. They then tend to set some relatively short-term, process-oriented targets, before progressively extending the duration and stringency of their targets, and defining these in a more precise, quantitative way. A similar phenomenon is often seen in reporting: companies tend to start by reporting on the operational (or Scope 1 and 2) carbon emissions from part of their business, and then progressively extend this reporting to apply to more of the business and, in time, to cover some of the emissions from their supply chains and from the use of their products (Scope 3 emissions).
Accordingly, TPI’s management quality framework tracks the progress of companies through the following five levels:
• Level 0 – Unaware of (or not Acknowledging) Climate Change as a Business Issue.
• Level 1 – Acknowledging Climate Change as a Business Issue: the company acknowledges that climate change presents business risks and/or opportunities, and that the company has a responsibility to manage its greenhouse gas emissions. This is often the point where companies adopt a climate change policy.
• Level 2 – Building Capacity: the company develops its basic capacity, its management systems and processes, and starts to report on practice and performance.
• Level 3 – Integrated into Operational Decision-Making: the company improves its operational practices, assigns senior management or board responsibility for climate change and provides comprehensive disclosures on its carbon practices and performance.
• Level 4 – Strategic Assessment: the company develops a more strategic and holistic understanding of risks and opportunities related to the low-carbon transition and integrates this into its business strategy and capital expenditure decisions.
Some companies are still at an early stage of establishing carbon management and reporting processes, whereas others have assessed the resilience of their businesses and business models to a range of future low-carbon scenarios, published details of their low-carbon energy research and development (R&D) and investment strategies, and aligned their strategic key performance indicators (KPIs) on climate change and their executive incentives. Companies can move both up and down levels; for example, if the threat of carbon regulation or taxation recedes, companies may assign a lower priority to efforts to reduce emissions or improve energy efficiency.
Fourteen criteria are used to map companies on to the 5 levels of the TPI management quality framework (see Table 2 and Appendix 1 for more detail). Answers to the 14 3 A fuller description of the methodology is provided in Sullivan, R., Dietz, S., Garcia-Manas, C., Matthews, A. and Ward, F. (2017), Methodology and Indicators Report. Version 1.0. 11 January 2017 (Transition Pathway Initiative, London, UK), http://www.lse.ac.uk/GranthamInstitute/tpi/wp-content/uploads/2017/01/Methodology.pdf
9
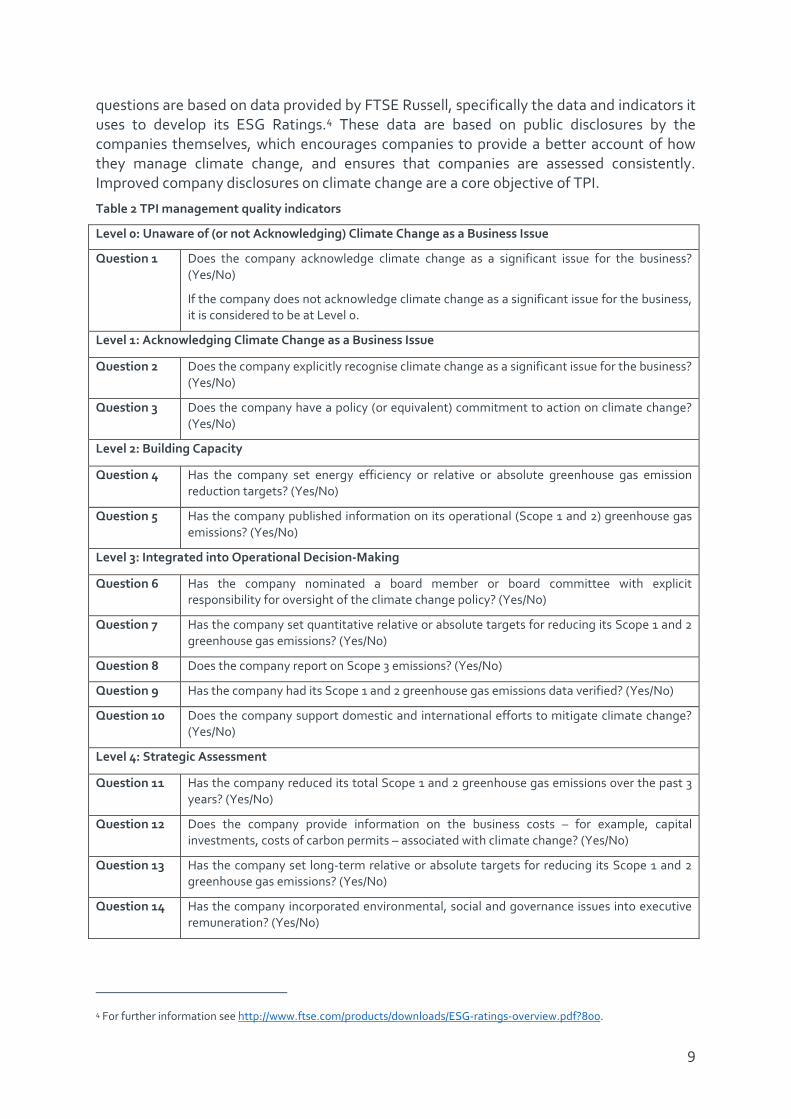
questions are based on data provided by FTSE Russell, specifically the data and indicators it uses to develop its ESG Ratings.4 These data are based on public disclosures by the companies themselves, which encourages companies to provide a better account of how they manage climate change, and ensures that companies are assessed consistently. Improved company disclosures on climate change are a core objective of TPI.
Table 2 TPI management quality indicators
Level 0: Unaware of (or not Acknowledging) Climate Change as a Business Issue
Question 1 Does the company acknowledge climate change as a significant issue for the business? (Yes/No)
If the company does not acknowledge climate change as a significant issue for the business, it is considered to be at Level 0.
Level 1: Acknowledging Climate Change as a Business Issue
Question 2 Does the company explicitly recognise climate change as a significant issue for the business? (Yes/No)
Question 3 Does the company have a policy (or equivalent) commitment to action on climate change? (Yes/No)
Level 2: Building Capacity
Question 4 Has the company set energy efficiency or relative or absolute greenhouse gas emission reduction targets? (Yes/No)
Question 5 Has the company published information on its operational (Scope 1 and 2) greenhouse gas emissions? (Yes/No)
Level 3: Integrated into Operational Decision-Making
Question 6 Has the company nominated a board member or board committee with explicit responsibility for oversight of the climate change policy? (Yes/No)
Question 7 Has the company set quantitative relative or absolute targets for reducing its Scope 1 and 2 greenhouse gas emissions? (Yes/No)
Question 8 Does the company report on Scope 3 emissions? (Yes/No)
Question 9 Has the company had its Scope 1 and 2 greenhouse gas emissions data verified? (Yes/No)
Question 10 Does the company support domestic and international efforts to mitigate climate change? (Yes/No)
Level 4: Strategic Assessment
Question 11 Has the company reduced its total Scope 1 and 2 greenhouse gas emissions over the past 3 years? (Yes/No)
Question 12 Does the company provide information on the business costs – for example, capital investments, costs of carbon permits – associated with climate change? (Yes/No)
Question 13 Has the company set long-term relative or absolute targets for reducing its Scope 1 and 2 greenhouse gas emissions? (Yes/No)
Question 14 Has the company incorporated environmental, social and governance issues into executive remuneration? (Yes/No)
4 For further information see http://www.ftse.com/products/downloads/ESG-ratings-overview.pdf?800.

10
With the exception of Level 0, companies need to be assessed as Yes on all of the questions on a level before they can advance to the next level. For example, in order to be on Level 3, companies need to score Yes on each of Questions 1 to 5. Similarly, in order to be on Level 4, companies need to score Yes on each of Questions 1 to 10.
2.2. Carbon Performance5
TPI’s carbon performance assessment is based on the Sectoral Decarbonization Approach (SDA),[1] which is also being used by the Science-Based Targets Initiative, for example. The SDA translates greenhouse gas emissions targets made at the international level (e.g. under the Paris Agreement) into appropriate benchmarks, against which the performance of individual companies can be compared.
As the name suggests, the SDA takes a sector-by-sector approach, comparing companies within each sector against each other and against sector-specific benchmarks, which establish the performance of an average company that is aligned with international emissions targets.
Applying the SDA can be broken down into the following steps:
• A global carbon budget is established, which is consistent with international emissions targets, for example keeping global warming below 2°C. To do this rigorously, some input from a climate model is required.
• The global carbon budget is allocated across time and to different regions and industrial sectors. This typically requires an integrated economy-energy model, and these models usually allocate emissions reductions by region and by sector according to where it is cheapest to reduce emissions and when (i.e. the allocation is cost-effective). Cost-effectiveness is, however, subject to some constraints, such as political and public preferences, and the availability of capital. This step is therefore driven primarily by economic and engineering considerations, but with some awareness of political and social factors.
• In order to compare companies of different sizes, sectoral emissions are normalised by a relevant measure of sectoral activity (e.g. physical production, economic activity). This results in a benchmark path for emissions intensity in each sector:
Emissions intensity =Emissions
Activity
Assumptions about sectoral activity need to be consistent with the emissions modelled and are therefore taken from the same economy-energy modelling.
• Companies’ recent and current emissions intensity is calculated and their future emissions intensity can be estimated based on emissions targets they have set (i.e. this assumes companies exactly meet their targets).6 Together these establish emissions intensity paths for companies. The length of these paths will vary
5 The methodology followed in assessing the carbon performance of steel makers is described in detail in a separate report, “Carbon Performance Assessment of Steel Makers: Note on Methodology”, which is also available on the TPI website. Therefore we will only provide a condensed version here. 6 Alternatively, future emissions intensity could be calculated based on other data provided by companies on their business strategy and capital expenditure plans.

11
depending on how much information companies provide on their recent and current emissions intensity, as well as the time horizon for their emissions targets, if indeed they have set and disclosed any targets.
• Companies’ emissions intensity paths are compared with each other and with the relevant sectoral benchmark path.
TPI uses two sectoral benchmark paths, both of which are derived from data from the International Energy Agency (IEA), via its biennial Energy Technology Perspectives report:[2]
1. A 2 Degrees scenario, which is consistent with the overall aim of the Paris Agreement to hold “the increase in the global average temperature to well below 2°C above pre-industrial levels and to pursue efforts to limit the temperature increase to 1.5°C above pre-industrial levels”.[3]
2. A Paris Pledges scenario, which is consistent with the global aggregate of emissions reductions pledged by countries as part of the Paris Agreement in the form of Nationally Determined Contributions or NDCs. Several studies have documented that this aggregate is currently insufficient to put the world on a path to limit warming to 2°C, even if it will constitute a departure from a business-as-usual trend.[4]–[6]
In the steel sector, the specific measure of emissions intensity that we use is Scope 1 and 2 greenhouse gas emissions from steel-making, per unit of crude steel produced, in units of (metric) tonnes of CO2 equivalent per (metric) tonne of crude steel. Unlike some other sectors, whose carbon performance is being assessed by TPI (e.g. cement, and electricity utilities), Scope 2 emissions from purchases of power are sufficiently important in the steel sector that they should be included in the measure of company emissions, alongside direct or Scope 1 emissions.
In line with TPI’s philosophy, companies’ emissions intensity paths are derived from public disclosures (including responses to the annual CDP questionnaire, as well as companies’ own reports, e.g. sustainability reports) as far as possible. In particular, only company disclosures are used to estimate recent and current emissions intensity, and company disclosures are also the source of information on targets for future emissions.
But some companies have set targets to reduce the absolute quantity of future emissions, rather than the intensity of their emissions. This raises the particular question of what to assume about those companies’ future activity (i.e. steel production in this case). The approach taken in the TPI is to assume company activity increases at the same rate as the sector as a whole (i.e. this amounts to an assumption of constant market share), using sectoral growth rates from the IEA in order to be consistent with the benchmark paths.
2.3. Quality assurance
Both TPI’s management quality and carbon performance assessments are subject to internal quality assurance, as well as a company review stage, in which all companies are contacted with a draft of TPI’s assessment and invited to check the veracity of the disclosed data being used, as well as being requested to answer specific queries in some cases. The

12
process is described in more detail in the TPI Methodology and Indicators Report.7 The underlying data used in the management quality assessment are also subject to quality assurance by the provider, FTSE Russell.
Twenty companies in the steel sector were contacted by TPI on 10th August 2017 with a draft of their assessment, and given until 13th September 2017 to respond. In total, 4 out of 20 companies responded, as a result of which the assessments of 2 companies changed.
7 Sullivan, R., Dietz, S., Garcia-Manas, C., Matthews, A. and Ward, F. (2017), Methodology and Indicators Report. Version 1.0. 11 January 2017 (Transition Pathway Initiative, London, UK), http://www.lse.ac.uk/GranthamInstitute/tpi/wp-content/uploads/2017/01/Methodology.pdf

13
3. FINDINGS
3.1. Management quality
3.1.1. Overview
Figure 1 shows where these 20 companies sit on the management quality framework. Readers may refer to Appendix 2 for a question-by-question assessment of each company.
Two companies are assessed as being “Unaware of (or not Acknowledging) Climate Change as a Business Issue” (Level 0): Novolipetsk Steel and Nucor. This means they do not have any of the following:
• A policy or an equivalent statement committing them to take action on their greenhouse gas emissions;
• A formal statement recognising climate change and its potential impacts as a significant or material issue for their business;
• Time-specific targets, even qualitative, relating to energy efficiency or relative or absolute greenhouse gas emissions; or
• Disclosures on their Scope 1 and 2 greenhouse gas emissions.
Figure 1 Management quality of the world's top 20 steel makers
LEVEL 0
UNAWARE / NOT ACKNOW-LEDGING
LEVEL 1
ACKNOWLEDGEMENT
LEVEL 2
BUILDING CAPACITY
LEVEL 3
INTEGRATED INTO OPERATIONAL DECISION-MAKING
LEVEL 4
STRATEGIC ASSESSMENT
Acerinox
Arcelor Mittal
China Steel
Hyundai Steel
Posco
Tata Steel
Bluescope Steel
Companhia Siderurgica Nacional
Erdemir
JSW Steel
Voestalpine
Gerdau
JFE Holdings
Kobe Steel
Nippon Steel & Sumitomo Metal
Nisshin Steel
Severstal
Tenaris
Novolipetsk Steel
Nucor
Seven companies are assessed as “Acknowledging Climate Change as a Business Issue” (Level 1): Gerdau; JFE Holdings; Kobe Steel; Nippon Steel and Sumitomo Metal; Nisshin Steel; Severstal; and Tenaris. There are more steel makers on Level 1 than any other individual level. As Appendix 2 shows, all of these companies have a published policy or

14
commitment statement on climate change, which commits them to addressing the issue or to reducing or avoiding their impact on climate change. However, none of them is assessed as formally recognising climate change and its potential impacts as a significant or material issue for the business.
There are 5 companies on Level 2, defined as “Building Capacity”. These are: Bluescope Steel, Companhia Siderurgica Nacional, Erdemir, JSW Steel and Voestalpine. With the exception of Erdemir, all of these companies publish information on their Scope 1 and 2 emissions. However, none of them has set time-specific energy efficiency or greenhouse gas emissions targets.
Five companies are on Level 3, where climate change has been “Integrated into Operational Decision-Making”: Arcelor Mittal, China Steel, Hyundai Steel, Posco and Tata Steel. As Level 3 companies, these steel makers all publish information on their Scope 1 and 2 emissions, and have all set time-specific targets for improving their energy efficiency or reducing their emissions. In addition, all 5 have set quantitative targets to reduce their Scope 1 and 2 emissions, report on their Scope 3 emissions, and have had their Scope 1 and 2 emissions data verified. However, of these 5 companies only Posco and Tata Steel have assigned explicit board responsibility for oversight of the climate change policy, and only China Steel is assessed as supporting domestic and international efforts to mitigate climate change.
Just one company, Acerinox, is on Level 4, which means that it has reached the stage of “Strategic Assessment” of climate change. Reaching Level 4 means that Acerinox has assigned board responsibility for climate change, set quantitative targets for its Scope 1 and 2 emissions, had its Scope 1 and 2 emissions data verified, reports on its Scope 3 emissions, and demonstrates support for domestic and international efforts to mitigate climate change. In addition, Acerinox is assessed as Yes on two Level 4 criteria: it provides information on the business costs associated with climate change, and its target for Scope 1 and 2 emissions qualifies as long-term. However, it has not reduced its aggregate Scope 1 and 2 emissions over the past 3 years, and it is yet to incorporate environmental, social and governance issues into executive remuneration.
The average level-score of all 20 steel makers is 1.8, with 14 out of the 20 companies on Level 2 or below. There is no discernible association between steel makers’ level on the framework and either their market capitalisation or their country of listing.
3.1.2. Scores against individual criteria
Figure 2 looks at how the 20 steel makers as a whole perform against the 14 individual criteria/questions (details in Appendix 2). It helps us identify areas of strength and weakness across all companies.
We see a similar pattern to other sectors whose management quality has been assessed by TPI at the time of writing,8 insofar as a majority of companies satisfy the criteria on Levels 0 to 2, particularly acknowledging climate change as a significant issue (i.e. question 1), and having a policy (or equivalent) commitment to action on climate change (question 3). Three
8 Besides the 20 steel makers assessed in this particular report, TPI has also assessed the management quality of the global top 20 coal mining companies, electricity utilities, and oil and gas producers, and the global top 19 cement producers. These data can be viewed at http://www.lse.ac.uk/GranthamInstitute/tpi/the-toolkit/

15
quarters of companies assessed also disclose information on their Scope 1 and 2 emissions (question 5).
Performance against the more demanding Level 3 and 4 criteria is naturally weaker, with fewer than half of companies satisfying any of these criteria individually, except for reporting data on Scope 3 emissions (12 out of 20).9 Compared with other TPI sectors, notably few companies (4 out of 20) have assigned explicit board responsibility for oversight of the climate change policy, while only 4 out of 20 companies are able to demonstrate support for domestic and international efforts to mitigate climate change. Only a quarter of companies have succeeded in reducing their total Scope 1 and 2 emissions over the past 3 years, have set long-term, quantitative targets to reduce their Scope 1 and 2 emissions, or have incorporated environmental, social and governance issues into executive remuneration.
Figure 2 Number of companies scoring Yes (blue) against individual questions, and No (red)
3.1.3. Comparison with other sectors
Since the beginning of 2017, TPI has assessed the management quality of 99 companies across five high-impact sectors:
• In the electricity utilities sector, TPI’s assessment of which was launched in January 2017, there were no Level 0 companies, there were 10 companies on Levels 3 or 4, and the average score for the sector was a relatively impressive 2.6.
9 In general, the comprehensiveness of companies’ Scope 3 emissions disclosures can vary significantly. Currently we are unable to take into account how comprehensive they are, due to the lack of underlying data in a systematic and comparable form, but expect to be able to do so in future versions of the management quality framework (see Section 4).
0 2 4 6 8 10 12 14 16 18 20
1. Acknowledge?
2. Explicitly recognise as significant issue?
3. Policy commitment to act?
4. Targets?
5. Disclosed Scope 1&2 emissions?
6. Board responsibility?
7. Quantitative targets for Scope 1&2 emissions?
8. Disclosed Scope 3 emissions?
9. Had Scope 1&2 emissions verified?
10. Support domestic and intl. mitigation?
11. Reduced Scope 1&2 emissions in last 3 years?
12. Provided info on business costs of climate change?
13. Long-term, quant targets for Scope 1&2 emissions?
14. Incorporated ESG into executive remuneration?

16
• In the oil and gas sector, also launched in January 2017, there was one Level 0 company, there were 5 companies on Levels 3 or 4, and the average score for the sector was 2.1.
• In the coal mining sector, the assessment of which was released in July 2017, there were 3 companies on Level 0, 7 companies on Levels 3 or 4, and the average score for the sector was again 2.1. There was also a stark difference in the coal mining sector between the performance of the diversified miners (average score 3.8) and the coal mining specialists (average score of 1.3).
• In the cement sector, the assessment of which is being launched at the same time as these data for steel, there are 3 companies on Level 0, 9 companies on Levels 3 and 4, and the sector’s average score is 2.1.
Figure 3 compares the share of steel makers on each level with the overall share of all 99 companies on each level. It also shows the range from the minimum share of companies on a level in any sector, to the maximum. There is some evidence to suggest that the steel sector is a relatively poor performer on management quality. There is a higher-than-average share of companies on Level 0 and especially on Level 1, while the steel sector has the lowest share of Level 4 companies of any sector considered by TPI so far. These results are reflected in the fact that the steel sector has the lowest average management quality score of any of the 5 sectors assessed by TPI so far.
Figure 3 Comparison of management quality in steel with other sectors
0%
10%
20%
30%
40%
50%
60%
0 1 2 3 4
No.
of c
ompa
nies
Level
Min-max range
All
Steel

17
3.2. Carbon performance
3.2.1. Data availability
TPI’s carbon performance assessment is based on companies’ public disclosures of their recent and current emissions, as well as quantitative targets they have set to reduce their emissions in the future. Table 3 provides details of the extent of these disclosures and targets.
Table 3 Publicly disclosed information on company emissions intensity and targets
Company Country 2013-15 emissions
intensity data?
Quantitative emissions targets
Type of target (absolute/intensity)
Acerinox Spain Yes 2020 Absolute
Arcelor Mittal Netherlands Yes 2020 Intensity
Bluescope Steel Australia Yes No
China Steel Taiwan Yes 2020 Intensity
Companhia Siderurgica Nacional
Brazil Yes No
Erdemir Turkey No No
Gerdau Brazil No No
Hyundai Steel Korea 2013-2014 only 2020 Absolute
JFE Holdings Japan Yes No
JSW Steel India 2014-2015 only 2017 Intensity
Kobe Steel Japan Yes No
Nippon Steel & Sumitomo Metal
Japan Yes No
Nisshin Steel Japan Yes No
Novolipetsk Steel Russia No No
Nucor United States No No
Posco Korea Yes 2020 Intensity
Severstal Russia No No
Tata Steel India No No
Tenaris Italy Yes No
Voestalpine Austria No No
We can provide recent and current carbon performance data on 13 out of 20 companies. Of the 7 companies we have had to exclude, 2 companies, Erdemir and Novolipetsk Steel, do not appear to publicly disclose any emissions data. The remaining 5 companies – Gerdau, Nucor, Severstal, Tata Steel and Voestalpine – disclose some emissions data, but they do not appear to be sufficiently complete or well-documented for us to estimate company-wide Scope 1 and 2 greenhouse gas emissions from steel-making. Problems include failing

18
to disclose Scope 2 emissions, and only disclosing emissions for a small share of the company’s production capacity.10
Only 6 steel makers have set company-wide, quantitative targets for their future emissions, which we can use to estimate carbon performance. Of these targets, one expires in 2017 and the remaining 5 expire in 2020. By way of comparison, in the electricity utilities sector 9 out of the world’s 20 largest publicly listed companies had set quantitative emissions targets extending to at least 2020 and 6 had set targets extending to at least 2030.11
3.2.2. Overview of results
Table 4 summarises the steel makers’ carbon performance data and also includes emissions intensity along the 2 Degrees and Paris Pledges benchmark pathways. A company whose emissions intensity is below the benchmarks can be said to be aligned with those benchmarks and therefore with the international commitments underpinning them. A company whose emissions intensity is above the benchmarks is not aligned.
Table 4 Company emissions intensity paths and steel making sector benchmarks, 2013-2030
Company Carbon intensity (tonnes of CO2e / tonne crude steel)
2013 2014 2015 2020 2025 2030
Acerinox 0.550 0.550 0.590 0.531
Arcelor Mittal 1.974 1.938 1.973 1.859
BlueScope Steel 2.120 2.050 1.820
China Steel 2.410 2.254 2.291 1.981
Companhia Siderurgica Nacional 2.612 2.872 2.859
Hyundai Steel 0.910 0.840 0.805 0.632
JFE Holdings 2.071 2.065 2.075
JSW Steel 2.505 2.493
Kobe Steel 2.323 2.366 2.353
Nippon Steel & Sumitomo Metal 1.970 1.990 2.010
Nisshin Steel 2.110 2.170 2.180
Posco 1.988 1.998 1.905 2.002
Tenaris 0.900 0.870 0.900
2 Degrees 2.125 2.104 2.083 1.980 1.672 1.275
Paris Pledges 2.125 2.131 2.136 2.164 2.042 1.923
10 The latter is a relatively widespread problem in the sector. However, in some cases, such as Acerinox and Companhia Siderurgica Nacional, we have been able to find evidence to suggest that the emissions intensity that is disclosed is likely to be representative of all the company’s steel production facilities. 11 Dietz, S., French, E. and Rauis, B. (2017), Carbon Performance Assessment of Electricity Utilities: a Commentary. 7 June 2017 (Transition Pathway Initiative, London, UK), http://www.lse.ac.uk/GranthamInstitute/tpi/wp-content/uploads/2017/06/Commentary-on-electric-utilities-results-7-June-with-disclaimer.pdf.
19
Between 2013 and 2015, 5 out of 13 companies had an emissions intensity12 that was higher than either the 2 Degrees or Paris Pledges benchmarks. These companies, which are therefore not aligned at present, are: China Steel, Companhia Siderurgica Nacional, JSW Steel, Kobe Steel and Nisshin Steel. The remaining 8 steel makers had an emissions intensity that was below the benchmarks over the period 2013 to 2015. These companies are aligned.
On average, the 13 steel makers included in our assessment had an emissions intensity of 1.878 tonnes of CO2e per tonne of crude steel over the period 2013-2015, which is also below both of the benchmarks (see Figure 5).13 The average emissions intensity between 2013 and 2015 of the 5 companies with future targets extending to at least 2020 was 1.536 tCO2e / t steel, while the average of the other 8 companies was 2.091 tCO2e / t steel, which indicates that, for this set of steel makers, the presence of future targets, specifically 2020 targets, is associated with low emissions intensity today.
Beneath the averages, there is wide variation in recent and current emissions intensity across the 13 companies, from a low of 0.563 tCO2e / t steel (Acerinox) to a high of 2.781 tCO2e / t steel (Companhia Siderurgica Nacional). One of the primary sources of variation is the production route/technology a company uses to make steel, in particular whether it is via integrated mills, where iron is made in a blast furnace, the major source of emissions in this steel-making route, or whether it is via scrap-based minimills, where the major source of emissions is the electric arc furnace. Blast furnaces are much more emissions-intensive per tonne of steel product than electric arc furnaces, and minimills have a particularly low emissions intensity.
Figure 4 plots emissions intensity paths for the 6 companies with quantitative targets for their future emissions, which TPI could use to estimate carbon performance. The chart uses data from Table 4. The chart allows us to see more clearly whether companies’ emissions intensity is aligned with the benchmarks in the future.
First, notice that the Paris Pledges benchmark emissions intensity actually increases very slightly between 2015 and 2020, before falling in the period between 2020 and 2030. The more demanding 2 Degrees benchmark emissions intensity falls between 2015 and 2020, but only by about 5%, before falling more steeply in the period between 2020 and 2030. In 2030, the Paris Pledges benchmark emissions intensity is only about 10% below its 2015 level, while the 2 Degrees benchmark is about 39% below its 2015 level. Therefore the IEA’s modelling does not foresee large improvements in the emissions intensity of steel-making being required in the short term. Only after 2020 does the benchmark emissions intensity fall significantly and only then on the 2 Degrees pathway.
12 Calculated as the unweighted average of each company’s emissions intensity between 2013 and 2015. 13 This is the unweighted average emissions intensity across companies.

20
Figure 4 Emissions intensity paths for companies with targets
Assuming company targets are met, 3 out of 5 steel makers will be aligned in 2020, with an emissions intensity below either the 2 Degrees or Paris Pledges benchmarks. They are Acerinox, Arcelor Mittal and Hyundai Steel. Acerinox and Hyundai Steel have a particularly low emissions intensity today and are targeting further cuts by 2020. Hyundai Steel has the most ambitious target of all 5 companies, in terms of the relative reduction in emissions intensity it entails from the 2013-15 average, 28%. Arcelor Mittal starts closer to the benchmarks, but by cutting its emissions intensity by 8% below the 2007 level by 2020 it is able to remain under the 2 Degrees benchmark.14
The remaining 2 out of 5 companies, China Steel and Posco, will have an emissions intensity in 2020 that is fractionally above the 2 Degrees benchmark, but below the Paris Pledges benchmark. China Steel is currently not in alignment with either benchmark, but has set a target of reducing its Scope 1 and 2 emissions intensity by 15% below the 2010 level by 2020. This leads to the largest absolute reduction in emissions intensity of the 5 steel makers from the 2013-15 average, 0.338 tCO2e / t steel. Conversely Posco is currently aligned with both benchmarks, but its target of a 9% reduction in emissions intensity below the 2008 level would, if met, result in the company’s emissions intensity actually increasing between 2015 and 2020.
Figure 5 shows that the emissions cuts targeted by these 5 companies are collectively more than enough to ensure that the average emissions intensity of the same 5 companies in 2020, which is 1.401 tCO2e / t steel, is below the 2 Degrees and Paris Pledges benchmarks.
14 The TPI online toolkit contains further details of specific assumptions made to forecast a company’s emissions intensity: see http://www.lse.ac.uk/GranthamInstitute/tpi/the-toolkit/.
0.0
0.5
1.0
1.5
2.0
2.5
3.0
2013 2014 2015 2016 2017 2018 2019 2020 2021 2022 2023 2024 2025 2026 2027 2028 2029 2030
Carb
on in
tens
ity (t
onne
s CO
2e /
tonn
e cr
ude
stee
l)
Acerinox Arcelor Mittal
China Steel Hyundai Steel
JSW Steel Posco
2 Degrees Paris Pledges
21
However, because only 5 steel makers have 2020 targets and because those steel makers also have, on average, a lower emissions intensity today, care must be taken in drawing broader conclusions.
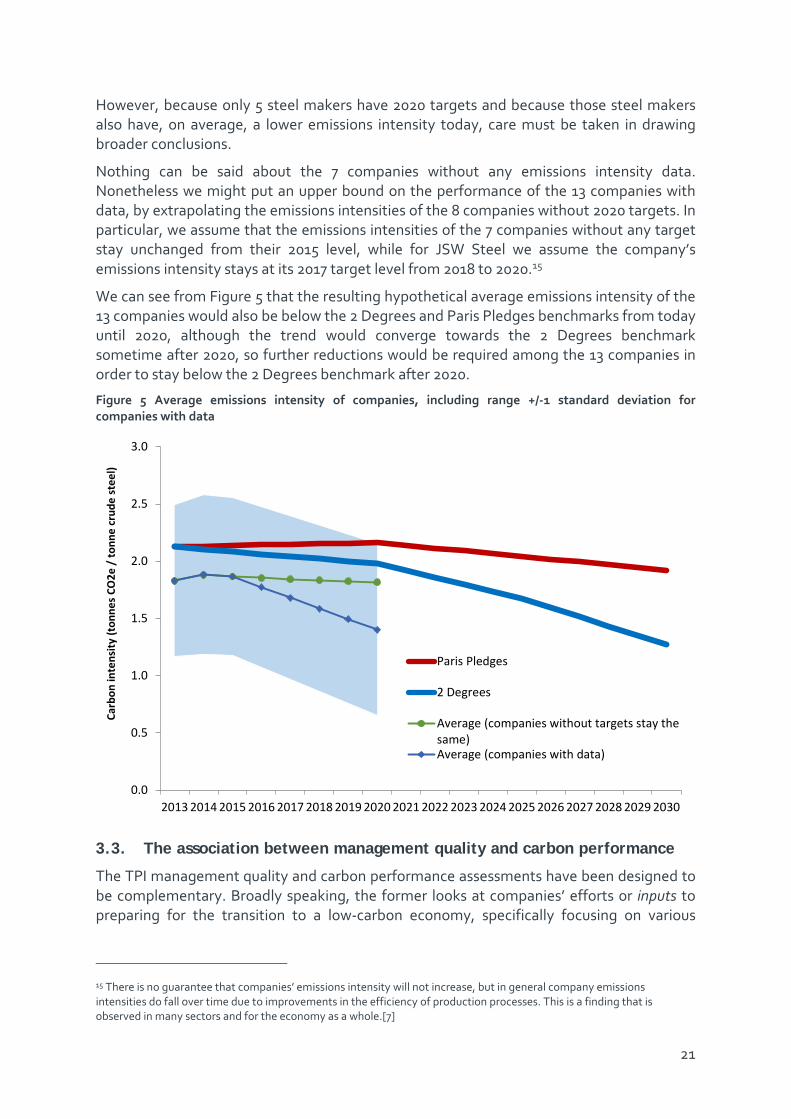
Nothing can be said about the 7 companies without any emissions intensity data. Nonetheless we might put an upper bound on the performance of the 13 companies with data, by extrapolating the emissions intensities of the 8 companies without 2020 targets. In particular, we assume that the emissions intensities of the 7 companies without any target stay unchanged from their 2015 level, while for JSW Steel we assume the company’s emissions intensity stays at its 2017 target level from 2018 to 2020.15
We can see from Figure 5 that the resulting hypothetical average emissions intensity of the 13 companies would also be below the 2 Degrees and Paris Pledges benchmarks from today until 2020, although the trend would converge towards the 2 Degrees benchmark sometime after 2020, so further reductions would be required among the 13 companies in order to stay below the 2 Degrees benchmark after 2020.
Figure 5 Average emissions intensity of companies, including range +/-1 standard deviation for companies with data
3.3. The association between management quality and carbon performance
The TPI management quality and carbon performance assessments have been designed to be complementary. Broadly speaking, the former looks at companies’ efforts or inputs to preparing for the transition to a low-carbon economy, specifically focusing on various
15 There is no guarantee that companies’ emissions intensity will not increase, but in general company emissions intensities do fall over time due to improvements in the efficiency of production processes. This is a finding that is observed in many sectors and for the economy as a whole.[7]
0.0
0.5
1.0
1.5
2.0
2.5
3.0
2013 2014 2015 2016 2017 2018 2019 2020 2021 2022 2023 2024 2025 2026 2027 2028 2029 2030
Carb
on in
tens
ity (t
onne
s CO
2e /
tonn
e cr
ude
stee
l)
Paris Pledges
2 Degrees
Average (companies without targets stay thesame)Average (companies with data)
22
aspects of corporate carbon governance and management, while the latter looks at the outputs of this in terms of companies’ emissions intensity now and in the future.
In the electricity utilities sector, we previously found no association between companies’ management quality and their recent/current emissions intensity, which tends to confirm these two types of assessment are complementary.16 It only makes sense to test the association between management quality and recent/current emissions intensity, because TPI’s management quality framework is designed to reward companies with quantitative emissions targets. Therefore those steel makers with 2020 emissions targets and in turn data on their 2020 emissions intensity will have a relatively high management quality score by definition.
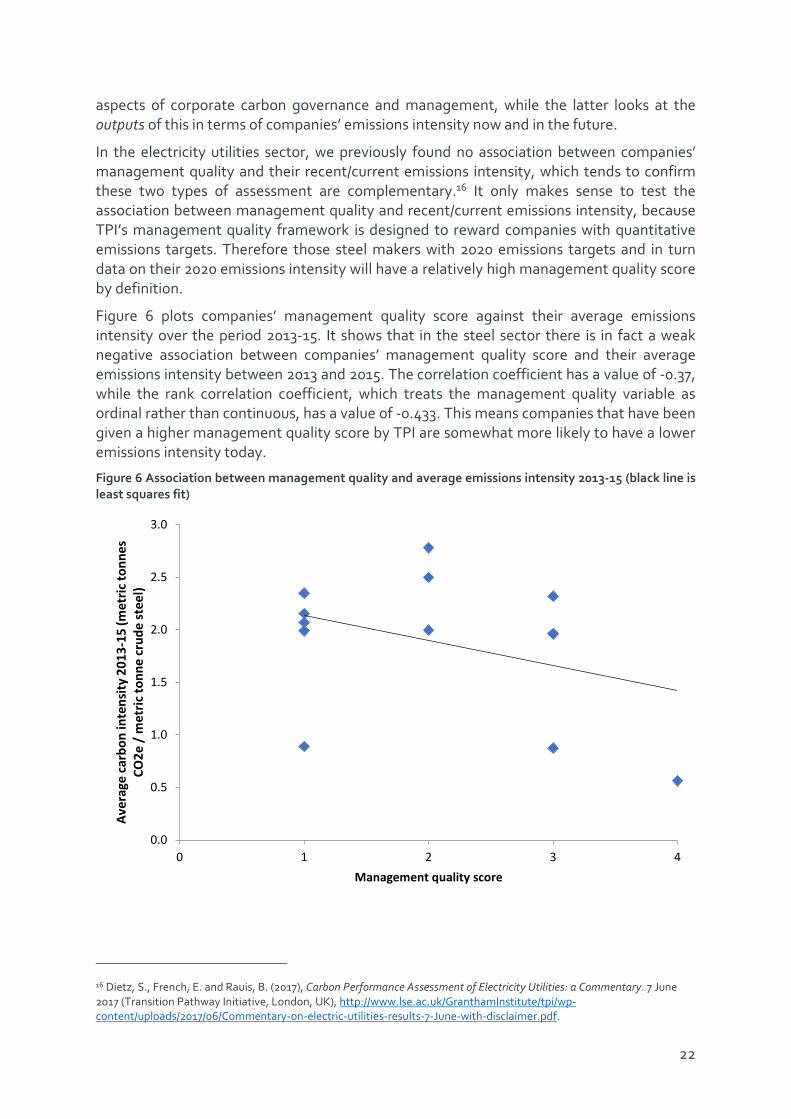
Figure 6 plots companies’ management quality score against their average emissions intensity over the period 2013-15. It shows that in the steel sector there is in fact a weak negative association between companies’ management quality score and their average emissions intensity between 2013 and 2015. The correlation coefficient has a value of -0.37, while the rank correlation coefficient, which treats the management quality variable as ordinal rather than continuous, has a value of -0.433. This means companies that have been given a higher management quality score by TPI are somewhat more likely to have a lower emissions intensity today.
Figure 6 Association between management quality and average emissions intensity 2013-15 (black line is least squares fit)
16 Dietz, S., French, E. and Rauis, B. (2017), Carbon Performance Assessment of Electricity Utilities: a Commentary. 7 June 2017 (Transition Pathway Initiative, London, UK), http://www.lse.ac.uk/GranthamInstitute/tpi/wp-content/uploads/2017/06/Commentary-on-electric-utilities-results-7-June-with-disclaimer.pdf.
0.0
0.5
1.0
1.5
2.0
2.5
3.0
0 1 2 3 4
Aver
age
carb
on in
tens
ity 2
013-
15 (m
etric
tonn
es
CO2e
/ m
etric
tonn
e cr
ude
stee
l)
Management quality score

23
4. SUMMARY
4.1. Summary of the results
This report has assessed the management quality and carbon performance of the world’s 20 largest publicly-listed companies that produce steel.
Steel makers’ average management quality score is 1.8, which is the lowest of the 5 sectors assessed by TPI so far. In comparison, the average score of the top 20 or so companies in the cement, coal mining and oil and gas sectors was 2.1, while in the electricity utilities sector it was 2.6. Only one company, the Spanish steel maker Acerinox, makes it to Level 4.
The steel makers follow other sectors in performing better on the less demanding Level 0-2 indicators than they do on the more demanding Level 3-4 indicators. Performance is notably weak on board oversight of companies’ climate change policies, and there is a lack of quantitative targets to reduce companies’ operational greenhouse gas emissions.
Based on public disclosures, we are able to estimate the carbon performance of 13 of the global top 20 steel makers today. Seven companies make insufficient disclosures for us to estimate carbon performance using our chosen metric of Scope 1 and 2 greenhouse gas emissions per unit of crude steel production. Across the sector, inconsistent and incomplete reporting of emissions and production volumes is a particular challenge.
We estimate companies’ future carbon intensity on the basis of quantitative targets they have set themselves to reduce emissions. Only 6 out of 20 companies have set such targets. None of these targets extends beyond 2020 and one is only for 2017, which means that it is particularly difficult to form a clear view of the direction of carbon performance in the steel sector.
We find that 8 out of the 13 steel makers disclosing sufficient data on emissions per unit of steel production are aligned with the benchmarks today; their carbon intensity is lower. The average carbon intensity of these 13 companies is also below the benchmarks today. However, there is considerable variation within the group, likely based on differences in steel production route/technology relied upon by the different companies.
Looking to the future, the trajectories of the 6 steel makers with quantitative emissions targets are, on average, aligned with both the Paris Pledges benchmark and the 2 Degrees benchmark. Of the 5 companies with targets for 2020, 3 are below both benchmarks, while the other 2 fall between the 2 Degrees and Paris Pledges benchmarks. However, we find that the 6 companies with targets have a lower average carbon intensity today than the 7 companies without targets, limiting the conclusions that can be drawn about the wider sector. In the steel sector, the Paris Pledges benchmark is relatively undemanding, allowing carbon intensity to increase between 2015 and 2020 and only requiring carbon intensity to be cut by 10% below the 2015 level by 2030. However, the 2 Degrees benchmark is demanding, with carbon intensity falling 39% below the 2015 level by 2030.
Lastly we test the association between companies’ management quality score and their average emissions intensity over the period 2013-15. In the steel sector there is in fact a weak negative association between companies’ management quality score and their average emissions intensity between 2013 and 2015. This means companies that have been given a higher management quality score by TPI are somewhat more likely to have a lower emissions intensity today.

24
4.2. Limitations
The current version of TPI’s management quality assessment framework was developed from October 2015 to December 2016. The development work involved: a comprehensive review of the literature, in particular to ensure alignment with existing initiatives and disclosure frameworks; piloting the indicators on a sample of 60 companies across 4 high-impact sectors (automobiles, diversified mining, electricity utilities, and oil and gas); and review by the TPI Steering Group, and by investment and climate change experts. The choice of indicators/questions and their ordering in the management quality framework are inevitably subjective, but the iterative process of research, testing and review just described was designed to make the framework as robust as possible. At present the breadth and depth of indicators is limited by the data FTSE Russell collected in their 2015-16 and 2016-17 research cycles, but enhancements to the 2017-18 FTSE Russell data set, building on the recommendations of Financial Stability Board’s (FSB’s) Task Force on Climate-related Financial Disclosures (TCFD), will provide TPI with the opportunity to extend and refine the management quality framework next year.
TPI’s carbon performance assessment is subject to a number of limitations. Perhaps the most obvious of these is that, like any forward-looking exercise, the accuracy of the conclusions is limited by the accuracy of the projections.
TPI’s projections could turn out to be inaccurate for two broad reasons. The first is that the benchmarks turn out to be inaccurate, because reality turns out differently to what the IEA’s energy model predicts. IEA updates its modelling every two years with the aim of improving the accuracy of its projections and TPI plans to update its benchmark paths accordingly. The second is that the company emissions intensity paths turn out to be inaccurate. An obvious source of inaccuracy in this regard is that company targets are exceeded or overshot. Again, TPI will update its company emissions intensity projections as company targets are added and revised. Another reason why company paths could turn out to be inaccurate is that estimating the future emissions intensity of companies usually involves a number of specific assumptions. For instance, two steel makers have set targets to reduce the absolute quantity of their emissions and therefore TPI has had to make an assumption about these companies’ future steel production (based on the IEA data), in order to convert the target into intensity terms.
Another limitation of the assessment is that, since TPI uses companies’ self-reported emissions and activity data to derive the emissions intensity paths, companies’ paths are only as accurate as the underlying disclosures.
As a result of these caveats, it is clear that the closer a company is to a benchmark, the less confident we can be in conclusions regarding whether it is aligned or not. It is beyond the scope of this study to formally quantify the degree of confidence in the benchmarks.17
The principal challenge in the steel sector, relative to other sectors whose carbon performance TPI is assessing, is inconsistent reporting of emissions and steel production, particularly in terms of whether emissions disclosures are steel-making-specific or operations-wide, whether production is measured in tonnes of crude steel, an equivalent measure or something different (which itself is not always clear), and whether disclosures cover all or merely a subset of a company’s production facilities. 17 Without a random sample of companies, standard statistical measures of confidence cannot be applied.

25
5. DISCLAIMER
1. All information contained in this report and on the TPI website is derived from publicly available sources and is for general information use only. Information can change without notice and The Transition Pathway Initiative does not guarantee the accuracy of information in this report or on the TPI website, including information provided by third parties, at any particular time.
2. Neither this report nor the TPI website provides investment advice and nothing in the report or on the site should be construed as being personalised investment advice for your particular circumstances. Neither this report nor the TPI website takes account of individual investment objectives or the financial position or specific needs of individual users. You must not rely on this report or the TPI website to make a financial or investment decision. Before making any financial or investment decisions, we recommend you consult a financial planner to take into account your personal investment objectives, financial situation and individual needs.
3. This report and the TPI website contain information derived from publicly available third party websites. It is the responsibility of these respective third parties to ensure this information is reliable and accurate. The Transition Pathway Initiative does not warrant or represent that the data or other information provided in this report or on the TPI website is accurate, complete or up-to-date, and make no warranties and representations as to the quality or availability of this data or other information.
4. The Transition Pathway Initiative is not obliged to update or keep up-to-date the information that is made available in this report or on its website.
5. If you are a company referenced in this report or on the TPI website and would like further information about the methodology used in our publications, or have any concerns about published information, then please contact us. An overview of the methodology used is available on our website.
6. Please read the Terms and Conditions which apply to use of the website.
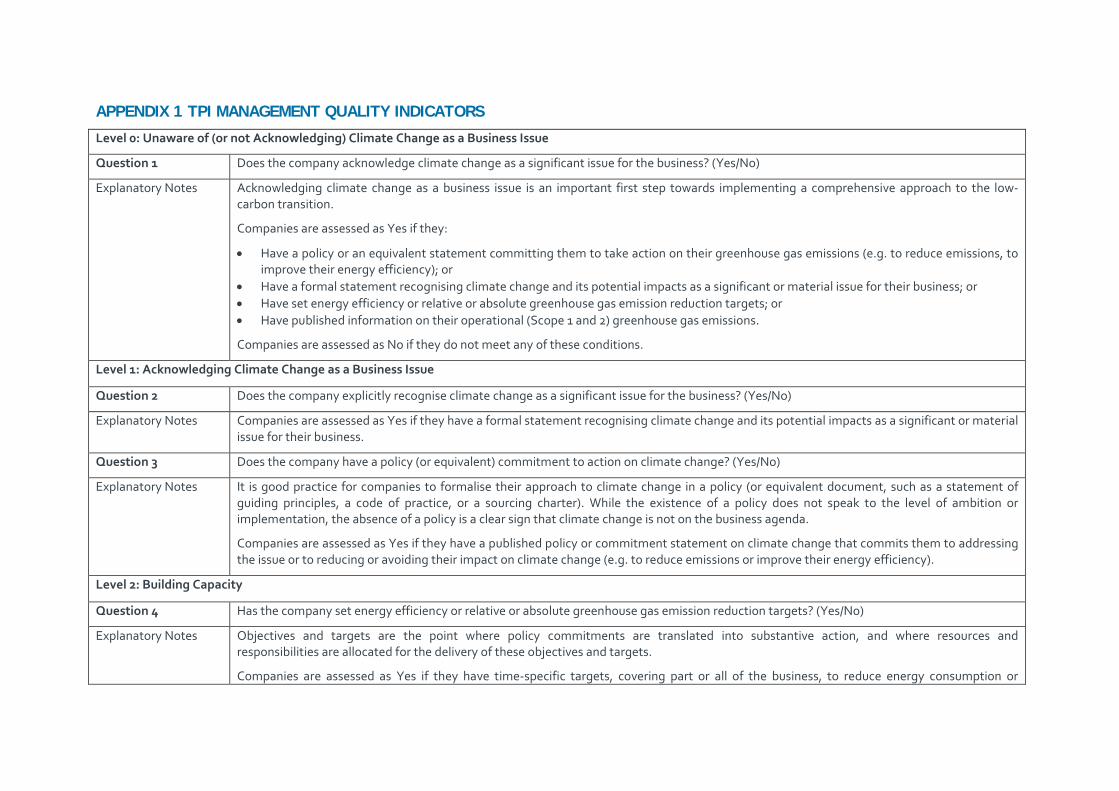
APPENDIX 1 TPI MANAGEMENT QUALITY INDICATORS
Level 0: Unaware of (or not Acknowledging) Climate Change as a Business Issue
Question 1 Does the company acknowledge climate change as a significant issue for the business? (Yes/No)
Explanatory Notes Acknowledging climate change as a business issue is an important first step towards implementing a comprehensive approach to the low-carbon transition.
Companies are assessed as Yes if they:
• Have a policy or an equivalent statement committing them to take action on their greenhouse gas emissions (e.g. to reduce emissions, to improve their energy efficiency); or
• Have a formal statement recognising climate change and its potential impacts as a significant or material issue for their business; or • Have set energy efficiency or relative or absolute greenhouse gas emission reduction targets; or • Have published information on their operational (Scope 1 and 2) greenhouse gas emissions.
Companies are assessed as No if they do not meet any of these conditions.
Level 1: Acknowledging Climate Change as a Business Issue
Question 2 Does the company explicitly recognise climate change as a significant issue for the business? (Yes/No)
Explanatory Notes Companies are assessed as Yes if they have a formal statement recognising climate change and its potential impacts as a significant or material issue for their business.
Question 3 Does the company have a policy (or equivalent) commitment to action on climate change? (Yes/No)
Explanatory Notes It is good practice for companies to formalise their approach to climate change in a policy (or equivalent document, such as a statement of guiding principles, a code of practice, or a sourcing charter). While the existence of a policy does not speak to the level of ambition or implementation, the absence of a policy is a clear sign that climate change is not on the business agenda.
Companies are assessed as Yes if they have a published policy or commitment statement on climate change that commits them to addressing the issue or to reducing or avoiding their impact on climate change (e.g. to reduce emissions or improve their energy efficiency).
Level 2: Building Capacity
Question 4 Has the company set energy efficiency or relative or absolute greenhouse gas emission reduction targets? (Yes/No)
Explanatory Notes Objectives and targets are the point where policy commitments are translated into substantive action, and where resources and responsibilities are allocated for the delivery of these objectives and targets.
Companies are assessed as Yes if they have time-specific targets, covering part or all of the business, to reduce energy consumption or

27
greenhouse gas emissions. These can be process or performance targets, they can focus on energy or on greenhouse gas emissions, they can be expressed in qualitative or quantitative terms, and they can be expressed in relative or absolute terms.
This question is intended to assess whether companies have started the target-setting process. Questions 7 and 13 ask more detailed questions about whether companies have set targets for the reduction of greenhouse gas emissions over the short and long term. Companies that are assessed as Yes on either of these questions (i.e. Questions 7 and 13) are also assessed as Yes on Question 4.
Question 5 Has the company published information on its operational (Scope 1 and 2) greenhouse gas emissions? (Yes/No)
Explanatory Notes Companies are assessed as Yes if they report on their Scope 1 and 2, or their combined Scope 1, 2 and 3 emissions.
Companies that only report Scope 1 emissions are assessed as No.
Companies that report normalised emissions only are assessed as No.
Level 3: Integrated into Operational Decision-Making
Question 6 Has the company nominated a board member or board committee with explicit responsibility for oversight of the climate change policy? (Yes/No)
Explanatory Notes Companies are assessed as Yes if they provide evidence of clear board or board committee oversight of climate change, or if they have a named individual/position responsible for climate change at board level.
Question 7 Has the company set quantitative relative or absolute targets for reducing its Scope 1 and 2 greenhouse gas emissions? (Yes/No)
Explanatory Notes Companies are assessed as Yes if they have set quantified targets to reduce operational greenhouse gas emissions in relative or absolute terms.
This question is more demanding than Question 4, as it is looking for companies to have set quantitative targets to reduce operational greenhouse gas emissions, at least in the short term (i.e. with a target year up to 5 years away). In contrast, Question 4 allows companies to set process targets (e.g. to take particular actions) and to focus these on energy or on greenhouse gas emissions.
This question differs from Question 13, which asks whether companies have set targets for the reduction of operational greenhouse gas emissions in the long term (i.e. with a target year more than 5 years away). Companies that are assessed as Yes on Question 13 are also assessed as Yes on this question.
Question 8 Does the company report on Scope 3 emissions? (Yes/No)
Explanatory Notes Companies are assessed as Yes if they report on Scope 3 emissions separately, or if they provide a total for Scope 1, 2 and 3 emissions.
Question 9 Has the company had its operational greenhouse gas emissions data verified? (Yes/No)
Explanatory Notes Companies are assessed as Yes if their operational greenhouse gas emissions have been independently verified by a third party, or if they state

28
the international assurance standard they have used and the level of assurance.
Question 10 Does the company support domestic and international efforts to mitigate climate change? (Yes/No)
Explanatory Notes Companies are assessed as Yes if they demonstrate support for mitigating climate change through membership of business associations that are supportive, and if they have a clear company position on public policy and regulation.
Level 4: Strategic Assessment
Question 11 Has the company reduced its total Scope 1 and 2 greenhouse gas emissions over the past 3 years?
Explanatory Notes Companies are assessed as Yes if their total Scope 1 and 2 greenhouse gas emissions have reduced over the past 3 years.
For companies that do not report a breakdown of Scope 1, 2 and 3 emissions, total Scope 1, 2 and 3 emissions are used in this calculation.
Companies that do not report Scope 1 and 2 emissions are assessed as No, as are companies that report less than 3 years’ data.
Question 12 Does the company provide information on the business costs – for example, capital investments, costs of carbon permits – associated with climate change? (Yes/No)
Explanatory Notes Companies are assessed as Yes if they quantify the business costs associated with climate change.
Question 13 Has the company set long-term relative or absolute targets for reducing its Scope 1 and 2 greenhouse gas emissions? (Yes/No)
Explanatory Notes Companies are assessed as Yes if they have set quantified long-term targets (i.e. with a target year more than 5 years away) to reduce operational (Scope 1 and 2) greenhouse emissions in relative or absolute terms.
This question is more demanding than Question 7, as it looks for companies to have set long-term quantitative targets (i.e. that are more than 5 years in duration from start to end) to reduce operational greenhouse gas emissions. By contrast, Question 7 asks whether the company has set short-term targets (i.e. less than 5 years in duration).
Question 14 Has the company incorporated environmental, social and governance issues into executive remuneration? (Yes/No)
Explanatory Notes Companies are assessed as Yes if executive remuneration includes incorporates environmental, social and governance performance.

29
APPENDIX 2 DETAILED ASSESSMENT OF COMPANIES’ MANAGEMENT QUALITY
Company Level Level 0 Level 1 Level 2 Level 3 Level 4
1. D
oes t
he c
ompa
ny a
ckno
wle
dge
clim
ate
chan
ge a
s a si
gnifi
cant
issu
e fo
r th
e bu
sine
ss?
2. D
oes t
he c
ompa
ny e
xplic
itly
reco
gnis
e cl
imat
e ch
ange
as a
sign
ifica
nt
issu
e fo
r the
bus
ines
s?
3. D
oes t
he c
ompa
ny h
ave
a po
licy
(or
equi
vale
nt) c
omm
itmen
t to
actio
n on
cl
imat
e ch
ange
? 4.
Has
the
com
pany
set e
nerg
y ef
ficie
ncy
or G
HG e
mis
sion
redu
ctio
n ta
rget
s?
5. H
as th
e co
mpa
ny p
ublis
hed
info
rmat
ion
on it
s Sco
pe 1
and
2 G
HG
emis
sion
s?
6. H
as th
e co
mpa
ny a
ssig
ned
expl
icit
boar
d re
spon
sibi
lity
for o
vers
ight
of t
he
clim
ate
chan
ge p
olic
y?
7. H
as th
e co
mpa
ny se
t qua
ntita
tive
targ
ets f
or re
duci
ng it
s Sco
pe 1
and
2
GHG
em
issi
ons?
8.
Doe
s the
com
pany
repo
rt o
n Sc
ope
3 em
issi
ons?
9. H
as th
e co
mpa
ny h
ad it
s Sco
pe 1
and
2
GHG
em
issi
ons d
ata
verif
ied?
10. D
oes t
he c
ompa
ny su
ppor
t dom
estic
an
d in
tern
atio
nal e
ffort
s to
miti
gate
cl
imat
e ch
ange
? 11
. Has
the
com
pany
redu
ced
its to
tal
oper
atio
nal S
cope
1 a
nd 2
GHG
em
issi
ons o
ver t
he p
ast 3
yea
rs?
12. D
oes t
he c
ompa
ny p
rovi
de
info
rmat
ion
on th
e bu
sine
ss c
osts
as
soci
ated
with
clim
ate
chan
ge?
13. H
as th
e co
mpa
ny se
t lon
g-te
rm
targ
ets f
or re
duci
ng it
s Sco
pe 1
and
2
GHG
em
issi
ons?
14
. Has
the
com
pany
inco
rpor
ated
ESG
is
sues
into
exe
cutiv
e re
mun
erat
ion?
Acerinox 4 Yes Yes Yes Yes Yes Yes Yes Yes Yes Yes No Yes Yes No
Arcelor Mittal 3 Yes Yes Yes Yes Yes No Yes Yes Yes No No No Yes Yes
Bluescope Steel 2 Yes Yes Yes No Yes No No No No No Yes No No Yes
China Steel 3 Yes Yes Yes Yes Yes No Yes Yes Yes Yes No Yes Yes Yes
Erdemir 2 Yes Yes Yes No No Yes No No No Yes No No No No
Gerdau 1 Yes No Yes No No No No No No No No No No No
Hyundai Steel 3 Yes Yes Yes Yes Yes No Yes Yes Yes No No Yes Yes No
JFE Holdings 1 Yes No Yes Yes Yes No No Yes No No Yes Yes No No
JSW Steel 2 Yes Yes Yes No Yes No No Yes Yes Yes No No No Yes
Kobe Steel 1 Yes No Yes Yes Yes No No No No No No No No No
Nippon Steel & Sumitomo Metal 1 Yes No Yes Yes Yes No No Yes No No Yes Yes No No

30
Nisshin Steel 1 Yes No Yes No Yes No No Yes No No Yes No No No
Novolipetsk Steel 0 No No No No No No No No No No No No No No
Nucor 0 No No No No No No No No No No No No No No
Posco 3 Yes Yes Yes Yes Yes Yes Yes Yes Yes No No No Yes Yes
Severstal 1 Yes No Yes Yes No No No No No No Yes No No No
Companhia Siderurgica Nacional 2 Yes Yes Yes No Yes No No Yes Yes No No No No No
Tata Steel 3 Yes Yes Yes Yes Yes Yes Yes Yes Yes No No Yes No No
Tenaris 1 Yes No Yes Yes Yes No No No No No No No No No
Voestalpine 2 Yes Yes Yes No Yes No No Yes No No No No No No

BIBLIOGRAPHY
[1] O. Krabbe et al., “Aligning corporate greenhouse-gas emissions targets with climate goals,” Nat. Clim. Chang., vol. 5, pp. 1057–1060, 2015.
[2] International Energy Agency, Energy Technology Perspectives 2016. Paris: International Energy Agency, 2016.
[3] UNFCCC, “Paris Agreement,” 2015.
[4] United Nations, “Adoption of the Paris Agreement,” 2015.
[5] UNEP, “The Emissions Gap Report 2015: A UNEP Synthesis Report,” 2015.
[6] R. Boyd, J. Cranston Turner, and B. Ward, “Intended nationally determined contributions: what are the implications for greenhouse gas emissions in 2030?,” London, 2015.
[7] IPCC, “Climate Change 2014: Mitigation of Climate Change (Fifth Assessment Report of Working Group III of the Intergovernmental Panel on Climate Change),” Geneva, Switzerland, 2014.