management strategies explained - orix · bond investment aircraft / ships private equity...
TRANSCRIPT

In 37 countries and regions, ORIX conducts a
diverse array of businesses including leasing,
loan, investment, life insurance, banking, asset
management, auto-related business, real estate,
and environment and energy. We manage this
business portfolio by dividing it into six segments
(Table 1).
To better comprehend ORIX’s mid-term strategic
directions, growth trajectories and business
evolution, in FY2016.3 we also began grouping
the business portfolio into the three categories of
“Finance,” “Operation” and “Investment” (Table 2).
We believe that the combined picture of the
three categories together with the six segments
allows a deeper understanding of ORIX (Table 3).
Table 1: Six Segments
ORIX currently manages its businesses in a portfolio divided into six segments.
Segment Main Business
Corporate Financial Services
Leasing, loan and fee business for small and medium-sized enterprises (SMEs)
Maintenance Leasing Auto-related, test and measurement instruments and other equipment rental
Real EstateReal estate development and rental, facilities operation, REIT asset management, real estate investment and advisory services
Investment and Operation
Environment and energy business, private equity investment, concessions, loan servicing
Retail Life insurance, banking, card loan business
Overseas BusinessLeasing and loan through overseas subsidiaries, ship and aircraft-related operations, private equity investment, investment in bonds, asset management
Finance Operation Investment
Main Risk Credit risk Operation risk and business risk Market risk
Capital Requirement Low Medium High
▼ ▼ ▼
Japan Ex-Japan Environment / Infrastructure
FinancialServices
MaintenanceServices Others Fixed Income Tangible Assets Equity
Corporate Financial Services Leasing / Loan / Fee business
Yayoi / New business development
Maintenance Leasing ORIX Auto / ORIX Rentec
Real Estate Real estate facility operation REIT /Real estate investment advisory Real estate investment
Investment and Operation Environment and energy / Concession Loan servicing
Private equity investment / Daikyo
Retail Banking / Consumer finance Life insurance / HLIKK
Overseas Business Leasing /Loan
Robeco /Houlihan Lokey Bond investment Aircraft / Ships Private equity
investment
The following table presents ORIX’s business portfolio matrix of six segments and three categories.
Six S
egm
ents
Three Categories
Table 3: Our Business Portfolio Matrix of Six Segments and Three Categories
Management Strategies Explained
ORIX’s Business Portfolio
22 ORIX INTEGRATED REPORT 2016
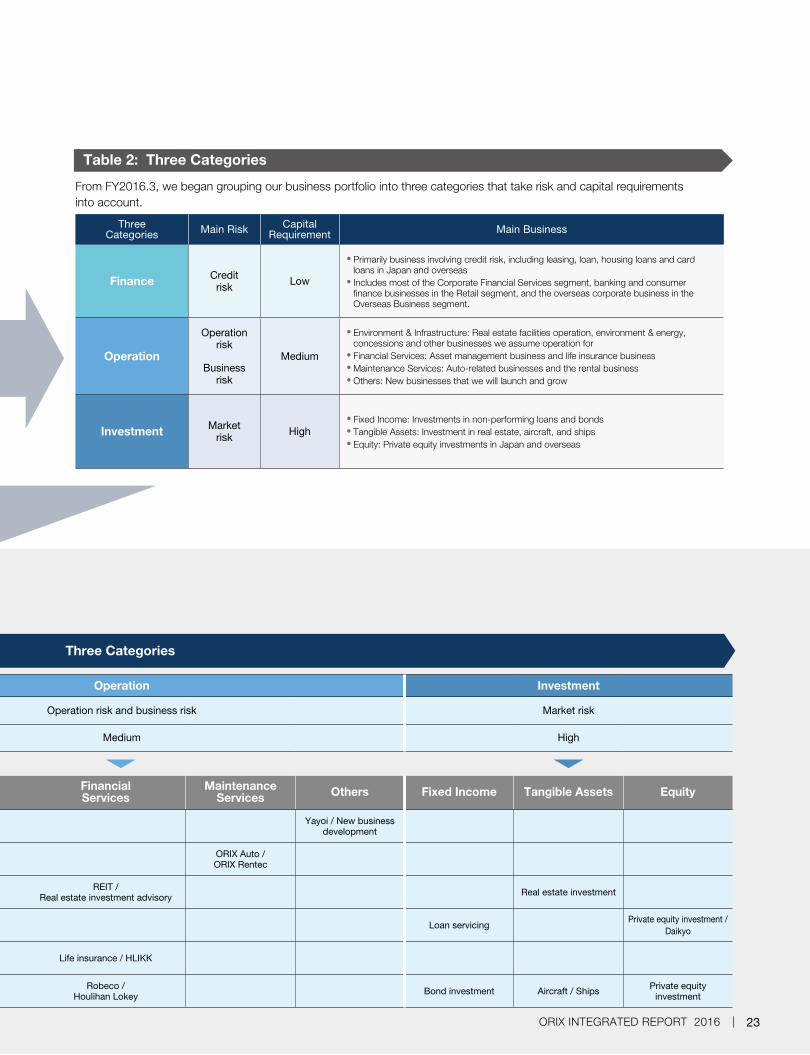
Table 2: Three Categories
From FY2016.3, we began grouping our business portfolio into three categories that take risk and capital requirements into account.
Three Categories Main Risk Capital
Requirement Main Business
Finance Credit risk Low
● Primarily business involving credit risk, including leasing, loan, housing loans and card loans in Japan and overseas
● Includes most of the Corporate Financial Services segment, banking and consumer finance businesses in the Retail segment, and the overseas corporate business in the Overseas Business segment.
Operation
Operation risk
Business risk
Medium
● Environment & Infrastructure: Real estate facilities operation, environment & energy, concessions and other businesses we assume operation for
● Financial Services: Asset management business and life insurance business
● Maintenance Services: Auto-related businesses and the rental business
● Others: New businesses that we will launch and grow
Investment Market risk High
● Fixed Income: Investments in non-performing loans and bonds
● Tangible Assets: Investment in real estate, aircraft, and ships
● Equity: Private equity investments in Japan and overseas
Finance Operation Investment
Main Risk Credit risk Operation risk and business risk Market risk
Capital Requirement Low Medium High
▼ ▼ ▼
Japan Ex-Japan Environment / Infrastructure
FinancialServices
MaintenanceServices Others Fixed Income Tangible Assets Equity
Corporate Financial Services Leasing / Loan / Fee business
Yayoi / New business development
Maintenance Leasing ORIX Auto / ORIX Rentec
Real Estate Real estate facility operation REIT /Real estate investment advisory Real estate investment
Investment and Operation Environment and energy / Concession Loan servicing
Private equity investment / Daikyo
Retail Banking / Consumer finance Life insurance / HLIKK
Overseas Business Leasing /Loan
Robeco /Houlihan Lokey Bond investment Aircraft / Ships Private equity
investment
The following table presents ORIX’s business portfolio matrix of six segments and three categories.
Three Categories
23ORIX INTEGRATED REPORT 2016
20162015201420132012201120102009200820072006 20162015201420132012201120102009200820072006
20162015201420132012201120102009200820072006
20162015201420132012201120102009200820072006
20162015201420132012201120102009200820072006
20162015201420132012201120102009200820072006
2016201520142013201220112010200920082007200620162015201420132012201120102009200820072006
2.49 2.53
1.96
0.24 0.450.81
0.99
1.33
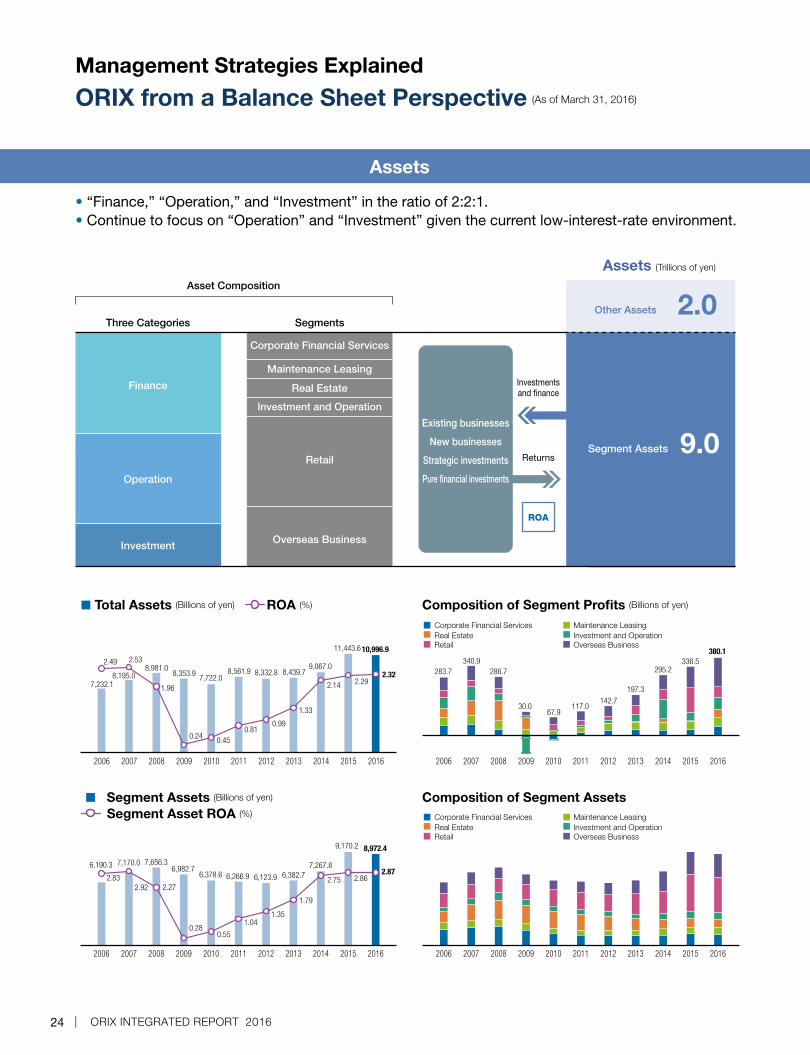
2.14 2.292.32
11.510.5
7.4 6.2
5.1 3.0 1.7
13.8
18.3 19.8
11.7
2,152.21,919.3
1,643.61,380.71,306.61,287.2
1,157.31,258.91,186.4947.0
2,310.49392898888
8684
7575
70
91
2.862.75
1.79
1.351.04
0.550.28
2.272.922.83
2.87
10,996.911,443.6
8,972.49,170.2
7,267.86,382.76,123.96,266.96,378.6
6,982.77,656.37,170.06,190.3
9,067.08,439.78,332.88,561.9
7,722.08,981.0
8,195.07,232.1
8,353.94,014.5
4,466.14,776.9
5,417.44,893.0
4,207.6 3,991.7 3,850.7 3,802.5 3,907.2 4,126.1
1.92.0 2.3 2.8 3.0 3.3
4.2 4.3 4.0 4.7
1.7
18.821.219.516.6
15.316.713.914.0 14.5 13.1
21.0
■ Total Assets (Billions of yen) ROA (%) ROE (%)Composition of Segment Profits (Billions of yen) ■ Adjusted Long- and Short-Term Debt(excluding deposits)* (Billions of yen)
Adjusted Debt/Equity Ratio* (Times)Overseas Business
Real EstateMaintenance Leasing
RetailInvestment and Operation
Corporate Financial Services
Overseas BusinessReal Estate
Maintenance Leasing
RetailInvestment and Operation
Corporate Financial Services
Composition of Segment Assets ■ ORIX Corporation Shareholders’ Equity (Billions of yen)
Shareholders’ Equity Ratio (%)
■ Segment Assets (Billions of yen)
Segment Asset ROA (%)
Adjusted Share of Long-Term Debt* (%)
380.1336.5
295.2
197.3
142.7117.0
67.930.0
286.7340.9
283.7
Interest
Returns
Funding
Funding
Liabilities and Shareholders’ Equity (Trillions of yen)
Shareholders’ Equity 2.5
Long- and Short-Term Debt 4.3
Deposits 1.4
Policy Liabilities 1.7Other Liabilities 1.1
Composition of Liabilities
Financialinstitutionsand bondinvestors
Shareholders
More than three years
More than one year andwithin three years
Within one year
Deposits
By Funding Method
Borrowings fromfinancial institutions
Financial institutions
Bonds and CP, etc.
Foreign institutional investors
By Maturity DateFinance
Overseas Business
Three Categories Segments
Investmentsand finance
Assets (Trillions of yen)
Retail
Investment and Operation
Real Estate
Maintenance Leasing
Corporate Financial Services
Segment Assets
Operation
Investment
9.0
Other Assets 2.0
Returns
ROA
Asset Composition
Individuals and others
ROE
Existing businesses
New businesses
Strategic investments
Pure financial investments
• “Finance,” “Operation,” and “Investment” in the ratio of 2:2:1.• Continue to focus on “Operation” and “Investment” given the current low-interest-rate environment.
Assets
Management Strategies Explained
ORIX from a Balance Sheet Perspective (As of March 31, 2016)
24 ORIX INTEGRATED REPORT 2016

20162015201420132012201120102009200820072006 20162015201420132012201120102009200820072006
20162015201420132012201120102009200820072006
20162015201420132012201120102009200820072006
20162015201420132012201120102009200820072006
20162015201420132012201120102009200820072006
2016201520142013201220112010200920082007200620162015201420132012201120102009200820072006
2.49 2.53
1.96
0.24 0.450.81
0.99
1.33
2.14 2.292.32
11.510.5
7.4 6.2
5.1 3.0 1.7
13.8
18.3 19.8
11.7
2,152.21,919.3
1,643.61,380.71,306.61,287.2
1,157.31,258.91,186.4947.0
2,310.49392898888
8684
7575
70
91
2.862.75
1.79
1.351.04
0.550.28
2.272.922.83
2.87
10,996.911,443.6
8,972.49,170.2
7,267.86,382.76,123.96,266.96,378.6
6,982.77,656.37,170.06,190.3
9,067.08,439.78,332.88,561.9
7,722.08,981.0
8,195.07,232.1
8,353.94,014.5
4,466.14,776.9
5,417.44,893.0
4,207.6 3,991.7 3,850.7 3,802.5 3,907.2 4,126.1
1.92.0 2.3 2.8 3.0 3.3
4.2 4.3 4.0 4.7
1.7
18.821.219.516.6
15.316.713.914.0 14.5 13.1
21.0
■ Total Assets (Billions of yen) ROA (%) ROE (%)Composition of Segment Profits (Billions of yen) ■ Adjusted Long- and Short-Term Debt(excluding deposits)* (Billions of yen)
Adjusted Debt/Equity Ratio* (Times)Overseas Business
Real EstateMaintenance Leasing
RetailInvestment and Operation
Corporate Financial Services
Overseas BusinessReal Estate
Maintenance Leasing
RetailInvestment and Operation
Corporate Financial Services
Composition of Segment Assets ■ ORIX Corporation Shareholders’ Equity (Billions of yen)
Shareholders’ Equity Ratio (%)
■ Segment Assets (Billions of yen)
Segment Asset ROA (%)
Adjusted Share of Long-Term Debt* (%)
380.1336.5
295.2
197.3
142.7117.0
67.930.0
286.7340.9
283.7
Interest
Returns
Funding
Funding
Liabilities and Shareholders’ Equity (Trillions of yen)
Shareholders’ Equity 2.5
Long- and Short-Term Debt 4.3
Deposits 1.4
Policy Liabilities 1.7Other Liabilities 1.1
Composition of Liabilities
Financialinstitutionsand bondinvestors
Shareholders
More than three years
More than one year andwithin three years
Within one year
Deposits
By Funding Method
Borrowings fromfinancial institutions
Financial institutions
Bonds and CP, etc.
Foreign institutional investors
By Maturity DateFinance
Overseas Business
Three Categories Segments
Investmentsand finance
Assets (Trillions of yen)
Retail
Investment and Operation
Real Estate
Maintenance Leasing
Corporate Financial Services
Segment Assets
Operation
Investment
9.0
Other Assets 2.0
Returns
ROA
Asset Composition
Individuals and others
ROE
Existing businesses
New businesses
Strategic investments
Pure financial investments
• Diversify funding sources and lengthen funding structure.• Based on financial leverage that enables us to maintain our single A credit rating, we aim to achieve
ROE of 11%-12%.
Liabilities and Shareholders’ Equity
* Adjusted long- and short-term debt (excluding deposits), adjusted debt/equity ratio and adjusted share of long-term debt show the figures after adjustment that exclude the impact of certain
liabilities and retained earnings attributable to the consolidation of the VIEs. For an explanation of the most directly comparable financial indicators calculated and presented in accordance with
U.S. GAAP and Non-GAAP financial indicators, please refer to pages 80-81.
25ORIX INTEGRATED REPORT 2016

Overview of FY2016.3Solid Start Toward Our Medium-Term Targets for FY2018.3
Net income for FY2016.3 increased 10.8% year-on-year to
¥260.2 billion. This was the second consecutive year of re-
cord net income, and the seventh consecutive year of net
income growth. Return on equity (ROE) was 11.7%, higher
than the previous fiscal year and above 11% for the second
consecutive year. FY2016.3 was therefore a solid start toward
our FY2018.3 target for net income of ¥300.0 billion. As for
our other FY2018.3 targets, we have already achieved ROE
between 11% and 12% and have maintained our single A
credit rating.
The first half of FY2016.3 was strong, with the Nikkei av-
erage recovering to the ¥20,000 range for the first time in 15
years. The second half, however, brought dizzying change
to the economies of the world. Falling oil prices had a pro-
nounced effect, while stock prices declined worldwide because
of unsettling developments in China and the forecast for the
global economic growth rate was downgraded. In Japan, rat-
ing agencies downgraded Japanese government bonds and
the Bank of Japan implemented negative interest rates.
Given this environment, we successfully implemented our
medium-term strategy of expanding non-finance businesses by
investing in growth, turning over assets through divestitures that
were well-timed with market conditions, entering new businesses
such as the concession business, and generating organic growth.
FY2016.3 Review
Expansion in Non-Finance Businesses
Organic Growth + Investment in Key Areas
Environment & Energy
● Secured 890MW of solar power generation capacity, of which 410MW commenced operation as of the end of FY2016.3
● Invested in a large-scale wind power project in India with a total capacity of 1,000MW
● An investment fund we jointly established with Robeco/ADB closed its first investment
Private Equity Investment
Network in Asia
● Acquired SMS, an auto-loan company in Indonesia● Increased investment in ACLEDA, a Cambodian commercial bank● Established a new private equity investment company in the United
States, which closed its first investment● Decided on private equity investments to acquire Cosmolife and Kyoto
Biken
Concession Business
● Obtained rights to operate Kansai International Airport and Osaka International Airport
Organic Growth
Auto Vehicles under management increased from 1.17 million to 1.23 million units
Life Number of new policies exceeded 500,000 for the Insurance third consecutive year
Yayoi Acquired Misoca to further strengthen cloud-based business
Management Strategies Explained
CEO Inoue on Strategy
Makoto InoueDirectorRepresentative Executive OfficerPresident and Chief Executive Officer
26 ORIX INTEGRATED REPORT 2016

Strategy through FY2018.3Grow by Concentrating on Operation and Investment
Our medium-term strategic direction through FY2018.3
remains unchanged. We will concentrate on expanding
non-finance businesses by generating organic growth and
investing in key areas.
From FY2016.3, in addition to our existing structure of six
segments, we began explaining our business portfolio and fu-
ture strategy using the three categories of Finance, Operation
and Investment. These categories represent the respective
risk profiles and capital requirements of our businesses, and I
would like to use them to explain how we intend to grow.
Adequate returns on loans and finance leases are difficult
to obtain in the current low interest rate environment, and
excessive interest rate competition is not in our interest. We
therefore intend to grow by investing greater financial and
human capital in Operation and Investment, which already
support earnings.
Looking at the three categories, the share of pretax prof-
its and segment assets from Operation increased steadily
during the three years through FY2016.3. Pretax profits from
Operation excluding non-recurring items increased by ap-
proximately ¥70 billion, while Operation assets increased by
approximately ¥1 trillion, both significantly outpacing growth
in Finance and Investment. The acquisition of Robeco in July
2013 was the primary factor driving growth. Other key fac-
tors included steady growth in the maintenance leasing, life
insurance, and environment and energy businesses, and the
December 2014 acquisition of Yayoi.
Investment encompassed assets totaling ¥1.6 trillion as of
March 31, 2016. Investments in fixed income involving invest-
ment in bonds and non-performing loans totaled about ¥300
billion, investment in tangible real estate assets totaled about
¥550 billion, investments in ships and aircraft totaled about
¥250 billion, and private equity investments in Japan and
overseas totaled about ¥500 billion. Our Investment portfolio
is diversified by asset class and market to avoid significant
concentrations of risk. We have rebalanced our portfolio
since FY2013.3 by decreasing real estate investment and in-
creasing aircraft and domestic private equity investment.
Categories Finance Operation Investment
Main Risk Credit risk Operation risk and business risk Market risk
Capital Requirement Low Medium High
▼ ▼ ▼
Japan Ex-JapanEnviron-
ment/Infra-structure
Financial Services
Mainte-nance
ServicesOthers Fixed
IncomeTangible Assets Equity
Corporate Financial Services
Leasing, Loan,
Fee business
Yayoi, New business development
Maintenance Leasing ORIX Auto, ORIX Rentec
Real Estate Facilities operation
REIT,RE investment
advisory
Real estateinvestment
Investment and Operation
Environment and energy, Concession
Loan servicing
Private equity investment,
Daikyo
RetailBanking,
Consumer finance
Life insurance,
HLIKK
Overseas Business Leasing, Loan
Robeco, Houlihan
Lokey
Bond investment
Aircraft, Ships
Private equity investment
Seg
men
ts
Business Portfolio in Three Categories
27ORIX INTEGRATED REPORT 2016

Note 1: Excludes valuation gains (approximately ¥58.4 billion) associated with consolidation of Daikyo
Note 2: Excludes bargain purchase gains (approximately ¥36.1 billion) and ordinary profit/loss
contribution associated with HLIKK, and capital gains (approximately ¥15 billion) from the sale
of Monex shares
Note 3: Excludes capital gains/valuation gains (approximately ¥39.6 billion) associated with the IPO of
Houlihan Lokey and ordinary profit/loss contribution from HLIKK
Note 1: Excludes assets of HLIKK (approximately ¥1.4 trillion)
Note 2: Excludes assets of HLIKK (approximately ¥1.0 trillion)
500
400
0
100
200
300
2013 2014 2015 2016 2018(Estimate) (Estimate)
70
80
40
80
120
100(Note 1)
80
60
200(Note 2 : 130)
90
100
190(Note 3: 150)
■ Finance ■ Operation ■ Investment ■ Finance ■ Operation ■ Investment
12
0
2
4
6
8
2013 2014 2015 2016 2018
3.0
1.5
1.8
3.4
2.0
1.9
3.8
1.7
3.6(Note 1: 2.2)
3.9
1.6
3.4(Note 2 : 2.5)
10
(Billions of yen) (Trillions of yen)
We expect Operation to continue making the largest con-
tribution to pretax profi ts and assets during the three years
through FY2018.3. Our focus for growth in each of the three
categories will be as follows.
In Finance, we will move beyond traditional loans and
leases in the Corporate Financial Services segment to reori-
ent our earnings structure from fi nance revenues to services
income by continuing to enhance our electronic payment
services and our lineup of fee-based services such as low-
cost money transfer services. As another measure that will
require somewhat more time before we see a full-scale
contribution to earnings, we will aggressively enter markets
in which we forecast growth as a result of deregulation and
changes in the business environment, as exemplifi ed by our
recent entry into agricultural businesses.
In the Operation category, our environment and energy
business is making steady progress in developing mega-
solar projects and captive power capacity. Internationally,
we entered the wind power generation business in India in
March 2016, and intend to establish ORIX as a renewable
energy company in Asia, the United States and elsewhere.
Inquiries about concession business projects have been
increasing because of our track record in acquiring conces-
sions at Kansai International Airport and Osaka International
Airport. The concession business is promising and we intend
to nurture it into a core operation.
The outlook for the real estate business is expected to
remain favorable because the facilities operation business is
benefitting from growth in inbound demand. We are highly
selective in making new investments as a matter of policy.
However, we expect inbound needs to increase and will
screen and investigate new investments in Japanese inns
and hotels.
ORIX Life Insurance has always had highly competitive
products. However, we expect price competition to intensify
and are therefore developing direct sales channels that we
will service using our own sales personnel, improving prod-
uct proposal capabilities, and differentiating ORIX from other
companies.
ORIX Auto and ORIX Rentec are both industry leaders that
are highly profi table and generate stable cash fl ow. We will
continue to aggressively add assets, broaden auto-related
services such as telematics services, and expand rental
products such as AI equipment. We will also expand our au-
to-related business internationally, primarily in Asia, through
local subsidiaries that deploy the extensive expertise we
have acquired in Japan.
In the Investment category, we will add assets, particularly
by investing in tangible assets and making equity invest-
ments. We believe the market for tangible real estate assets
is near its peak, and intend to focus on developing our land
bank rather than significantly increasing new real estate
investment. Our focus in making aircraft investments will
remain on the narrow-body type.
Pretax Profi ts by Category Segment Assets by Category
28 ORIX INTEGRATED REPORT 2016

Our equity investment operations will sell portfolio assets
because the price of private equity investments in Japan re-
mains high. At the same time, we will avoid competition while
investing in the core areas of health care, IT, food, and life-
style-support services. Overseas, we will make investments
using the investment management company established by
Mariner Investment Group in the United States. We intend
to uncover good investments in Asia, mainly through tie-ups
with powerful partners.
We view the two years through FY2018.3 as the time to
achieve our medium-term targets and firmly position ORIX for
continued growth thereafter. We will concentrate on Opera-
tion and Investment, and increase the share of stable earn-
ings from Operation. We will also execute well-timed asset
sales. In addition, we will aggressively take on the challenge
of new businesses and intend to identify businesses that will
be new pillars of growth for ORIX. At the same time, we will
conduct our businesses prudently, giving full consideration to
the increasingly uncertain outlook inside and outside Japan,
instability in financial and capital markets, and rising political
and geopolitical tensions in some regions. The growth of Op-
eration will entail facing an increasing number of previously
nonexistent risks, so we will heighten our emphasis on risk
management.
The ORIX Business ModelThe ORIX Way and Our Strengths
We have built the ORIX business model over the 50 years
since the Company was established, and it will continue
to evolve in step with our operating environment. But even
as the ORIX business model evolves, the ORIX Way and
our strengths will remain constant. I would like to share our
perspectives on the ORIX Way and our strengths to deepen
understanding of how we will achieve our medium-term tar-
gets over the coming two years and subsequently generate
steady growth.
Two features of our organizational operations are strong
leadership by management and formation of cross-depart-
mental teams. These features enable agile business activities.
The Group aggregates all information for senior man-
agement, including me. ORIX therefore constantly identifies
current realities at Group divisions and companies. ORIX also
looks within the Group with a focus on its sales network in
Japan largely to collect information on deals and projects,
again aggregating this data for senior management. De-
pending on the project, I bring together people from within
the Group to make up a team. This way, senior management
gains project and market information, and becomes aware
of the people assigned to the project before it can offer well-
informed instructions. Because senior management can see
the big picture, they can make appropriate decisions and
give instructions quickly. Good deals can disappear in a day
or two, so we must always be on the lookout for information
Finance • Transition to services income by enhancing lineup of fee-based services
Operation
Environment/Infrastructure
• Focus on completing mega-solar projects and increasing captive power capacity • Strengthen market position as a major renewable energy player in markets including Asia and U.S
Financial Services • Expand direct distribution channels in the life insurance business
Maintenance Services • Use competitive advantage to further develop value-added services and expand in Asia
Investment
Tangible Assets • Real estate and aircraft leasing businesses: focus on existing real estate development projects and narrow-body aircraft investments
Equity Investment • Add investments in healthcare, IT, food and lifestyle-support businesses
Value Creation through FY2018.3
Management Strategies Explained / CEO Inoue on Strategy
29ORIX INTEGRATED REPORT 2016
so that we do not miss out.
Our decision-making bodies centralize authority and share
information. The Investment and Credit Committee approves
deals. The Committee discusses and assumes authority for
decisions for debt deals that exceed ¥600 million and equity
deals that exceed ¥5 million. Although the deals decided
by senior management are quite small, discussing these
projects enables a timely understanding of sales and market
conditions. The Group Executive Officer Committee acts as
a forum for sharing information. Senior management and
Executive Officers gather to share important matters such as
the progress of Group strategies.
The ORIX Group has a team work mindset that is well
entrenched. People who have specialized knowledge work
in ORIX’s broad portfolio of businesses. Each division works
toward its objectives in its day-to-day operations, but each
is also deeply aware that it is part of the ORIX Group. When
forming teams for certain projects as described above, we
bring together multifaceted real estate, business investment,
accounting, legal and treasury professionals who immediately
begin working together with a unified team mindset. Working
together with ORIX’s national sales network generates sub-
stantial strengths. We have become a leader in Japan’s solar
power business because of the contribution of our salespeo-
ple in Japan, who understand the importance of promoting
this business as a group. We emphasize fully exercising our
strengths as a team through intradivisional collaboration that
links our respective knowledge and expertise. This gives
ORIX a strength that none of its competitors can match and
contributes substantially to its growth.
An organization cannot function with strong senior man-
agement alone. Moreover, talented people will not generate
strengths as a group if they each move in their own separate
directions. Organizational management becomes more com-
plex as a company grows and its businesses become more
diverse, but I expect ORIX to continue making the best use of
its strengths in leadership and team formation.
ORIX makes various investments including pure financial
investments and strategic investments. Our approach to in-
vesting is as follows.
We do not feel we should pay a premium for strategic
investments. We rigorously consider entry price. We make
both pure financial and strategic investments after discuss-
ing internal rate of return (IRR) with the assumption that we
will sell them in five to seven years. Investments involve the
risk of impairment if the profitability of the investment is less
than expected. We therefore make sure we are not paying
the wrong entry price when considering deals, and reject
deals without hesitation if price competition drives entry price
above our limits. The fact is, unreasonable investments will
eventually go bad, and we do not want to waste shareholder
capital.
A good partnership with stakeholders is vital to the suc-
cess of any investment. We take a hands-on approach for
virtually every investment we make in Japan. ORIX makes
consensual investments after discussions with the manage-
ment of the investee to preclude problems after we invest.
We value a relationship of mutual trust with our investees.
ORIX takes the same approach with overseas investments,
in many cases creating long-lasting relationships based on
mutual trust. We work with blue-chip local partners so that
we can accommodate the various cultural considerations we
encounter internationally. Well-managed deals with partners
and management we trust do not require us to send indi-
viduals from Japan. About 8,200 employees are involved in
our Overseas Business segment, and only 75 of them are
Japanese employees stationed abroad. We believe the best
approach is to let trustworthy local management and per-
sonnel handle local business. Investment ultimately comes
down to people. We therefore devote time to speaking with
our partners and deepening mutual understanding to make
our investments successful.
ORIX makes mostly pure financial and strategic invest-
ments. In some cases, if we see synergy with our investee
we change the strategy we decided upon initially to trans-
form a pure financial investment into a strategic investment.
The converse also happens. We need to review our invest-
ment strategy to accommodate changes in our operating
environment. Our mindset is flexible and we review our
strategies as needed. Moreover, we always consider our exit
strategy regardless of our investment strategy. We are ready
to sell at any time, which helps make sure we do not miss
opportunities to sell when we review our strategy. This mind-
set applies to ORIX’s entire portfolio, not just its investments.
We always consider the price we could get for each of our
businesses, not just when actually deciding whether or not
to sell. And we certainly do sell if the timing is right. That is in
fact management’s job.
30 ORIX INTEGRATED REPORT 2016

Our People and Our Relationship with SocietyIndividual Contributions Not Only to the Group, but Also to Society through Business Activities
We have added employees as our businesses have
grown, and the Group now employs more than 30 thousand
people. Hiring and nurturing people at the same speed at
which we are expanding has become an issue for us. When
I was a young employee at ORIX, the Company was not as
big as it is now, so I was often assigned to important roles
with substantial responsibility. Quintessentially, on-the-job
training at the front lines of the business is the best way to
nurture people, but ORIX’s current scale and diverse busi-
ness portfolio present difficulties for individually relevant
on-the-job training. We therefore want to further enhance
our commitment to personnel training. ORIX has tradition-
ally hired many specialized professionals from outside the
Company. They generally hit the ground running and excel,
but sometimes they are initially confused by our corporate
culture that eschews routine work and requires people to
think and act independently. However, they soon realize that
this corporate culture provides them with ample flexibility
to achieve what they wish, stimulating them and their col-
leagues to energetically exercise their capabilities. ORIX’s op-
erations will also become more global. We will enhance the
global facility of our people so that each employee feels part
of the global ORIX Group, well-motivated by their work, and
even more committed to contributing to the Group.
ORIX prioritizes contributing to society through its busi-
ness activities. Our growth has enhanced public awareness
of ORIX and our presence in the community. Of note, we
have greater contact with individuals because of our recent
expansion in business-to-consumer operations. I want these
individuals and all other stakeholders to view their relation-
ship with ORIX favorably. How can ORIX help society? What
does society think and expect of ORIX? Is ORIX making itself
a vital part of society? We will constantly keep these ques-
tions in mind as we go about our business.
Shareholder ReturnsAn Optimal Balance between Investments in Sustainable Growth and Stable Returns to Shareholders
Dividends per share for FY2016.3 increased 27% year on
year to ¥45.75. The payout ratio increased to 23% from 20%
for the previous fiscal year. In addition, the interim dividend
for FY2017.3 will increase to ¥23.00 from ¥22.00 for the
FY2016.3 interim dividend. Our focus on using our capital
to invest in sustainable growth has not changed, but neither
has our commitment to stable shareholder returns.
I serve as an outside director for an ORIX investee, which
makes me a shareholder asking that company to pay div-
idends and repurchase its shares. However, the question
preceding that request is whether the investee has a growth
strategy. Companies without a growth strategy and limited
prospects for growth should think about returning capital
to shareholders. On the other hand, ORIX is trying to
achieve its medium-term targets and subsequently maintain
sustainable growth. We will maintain this commitment to our
medium-term targets and continue to grow this company
with an optimal balance between investment and returns to
shareholders.
Management Strategies Explained / CEO Inoue on Strategy
31ORIX INTEGRATED REPORT 2016

Building a Powerful Financial Base So That We Are Ready for Changes in the External Environment
ORIX diversifies funding sources, lengthens durations, lev-
els out maturity ladder and ensures proper liquidity to sup-
port earnings growth and strengthen its finances. We need
to build an even stronger financial base in view of current
economic changes, particularly growing foreign exchange
and interest rate market volatility and rising geopolitical risk.
ORIX’s business structure itself is changing dynamically, so
we will use funding methods that fit with our business port-
folio. We will enhance funding aligned with our global opera-
tions, expanding local bank funding and continuing to raise
money from local capital markets. Our objective is to opti-
mize funding as a Group with approaches such as the effec-
tive use of project finance in business fields that are growing.
Ensuring Soundness and Increasing Corporate Value with Proper Capital Controls
For financial soundness, we emphasize proper capital
controls with a medium-term objective of maintaining our
credit rating in the single A range. While we are aggressively
considering M&A for future growth, we will carefully assess
the impact any large-scale transaction may have on our
credit rating. An employed capital ratio in the 80 percent
range is right for ORIX to ensure financial soundness and the
flexibility to make new investments, and it was at that level
as of March 31, 2016 (Graph 1). Graph 2 shows how we are
properly controlling capital throughout our business portfolio
in ways such as reducing capital employed in the Real Es-
tate segment and redeploying it for future growth. We have
also taken new approaches to funding by obtaining a sub-
ordinated term loan, or hybrid loan, totaling ¥94.0 billion in
May 2016. Although a hybrid loan is recognized as a liability
under accounting standards, certain credit rating agencies
Proper Capital Controls and Deeper Dialogue with Stakeholders
Management Strategies Explained
A Message From the CFO
Kazuo KojimaDirectorRepresentative Executive OfficerDeputy President and Chief Financial Officer
32 ORIX INTEGRATED REPORT 2016
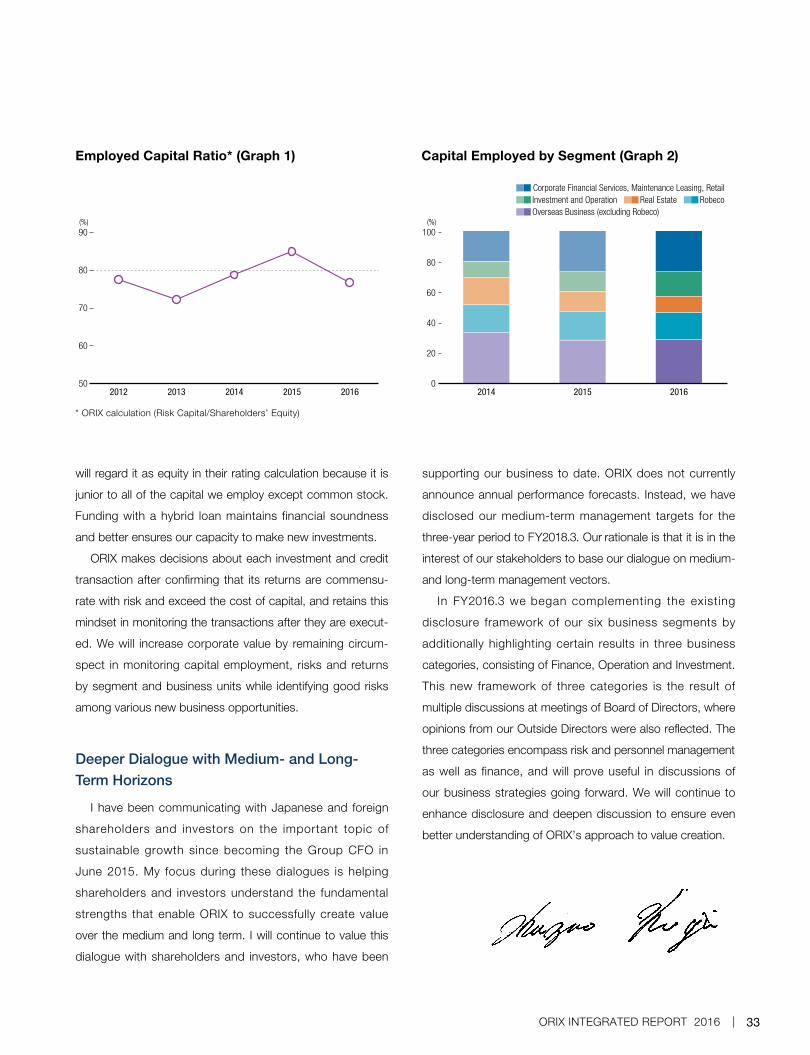
* ORIX calculation (Risk Capital/Shareholders’ Equity)
90
50
60
70
80
2012 2013 2014 2015 2016
100
0
20
40
60
80
2014 2015 2016
(%)(%)
■■ Corporate Financial Services, Maintenance Leasing, Retail■■ Investment and Operation ■■ Real Estate ■■ Robeco ■■ Overseas Business (excluding Robeco)
will regard it as equity in their rating calculation because it is
junior to all of the capital we employ except common stock.
Funding with a hybrid loan maintains financial soundness
and better ensures our capacity to make new investments.
ORIX makes decisions about each investment and credit
transaction after confirming that its returns are commensu-
rate with risk and exceed the cost of capital, and retains this
mindset in monitoring the transactions after they are execut-
ed. We will increase corporate value by remaining circum-
spect in monitoring capital employment, risks and returns
by segment and business units while identifying good risks
among various new business opportunities.
Deeper Dialogue with Medium- and Long-Term Horizons
I have been communicating with Japanese and foreign
shareholders and investors on the important topic of
sustainable growth since becoming the Group CFO in
June 2015. My focus during these dialogues is helping
shareholders and investors understand the fundamental
strengths that enable ORIX to successfully create value
over the medium and long term. I will continue to value this
dialogue with shareholders and investors, who have been
supporting our business to date. ORIX does not currently
announce annual performance forecasts. Instead, we have
disclosed our medium-term management targets for the
three-year period to FY2018.3. Our rationale is that it is in the
interest of our stakeholders to base our dialogue on medium-
and long-term management vectors.
In FY2016.3 we began complementing the existing
disclosure framework of our six business segments by
additionally highlighting certain results in three business
categories, consisting of Finance, Operation and Investment.
This new framework of three categories is the result of
multiple discussions at meetings of Board of Directors, where
opinions from our Outside Directors were also reflected. The
three categories encompass risk and personnel management
as well as finance, and will prove useful in discussions of
our business strategies going forward. We will continue to
enhance disclosure and deepen discussion to ensure even
better understanding of ORIX’s approach to value creation.
Employed Capital Ratio* (Graph 1) Capital Employed by Segment (Graph 2)
33ORIX INTEGRATED REPORT 2016